

Evaluating Partners for Renewable Energy Trading: A Multidimensional Framework and Tool


1
Institute of Political Science, Technical University of Darmstadt, Residenzschloss 1, 64283 Darmstadt, Germany
2
Institute of Political Science, University of Heidelberg, Bergheimer Straße 56, 69115 Heidelberg, Germany
3
Geschwister-Scholl-Institut of Political Science, University of Munich, Oettinenstraße 67, 80538 Munich, Germany
4
Department of Health and Sport Sciences, Technical University of Munich, Connollystraße 32, 80809 Munich, Germany
*
Author to whom correspondence should be addressed.
Sustainability 2024, 16(9), 3632; https://0-doi-org.brum.beds.ac.uk/10.3390/su16093632
Submission received: 15 January 2024
/
Revised: 15 April 2024
/
Accepted: 24 April 2024
/
Published: 26 April 2024
(This article belongs to the Special Issue Governing Green Energy Trade: Challenges and Opportunities)
Abstract
:The worsening climate crisis has increased the urgency of transitioning energy systems from fossil fuels to renewable sources. However, many industrialized countries are struggling to meet their growing demand for renewable energy (RE) through domestic production alone and, therefore, seek to import additional RE using carriers such as hydrogen, ammonia, or metals. The pressing question for RE importers is therefore how to select trading partners, i.e., RE exporting countries. Recent research has identified a plethora of different selection criteria, reflecting the complexity of energy systems and international cooperation. However, there is little guidance on how to reduce this complexity to more manageable levels as well as a lack of tools for effective partner evaluation. This article aims to fill these gaps. It proposes a new multidimensional framework for evaluating and comparing potential RE trading partners based on four dimensions: economy and technology, environment and development, regulation and governance, and innovation and cooperation. Focusing on Germany as an RE importer, an exploratory factor analysis is used to identify a consolidated set of composite selection criteria across these dimensions. The results suggest that Germany’s neighboring developed countries and current net energy exporters, such as Canada and Australia, are among the most attractive RE trading partners for Germany. A dashboard tool has been developed to provide the framework and composite criteria, including adjustable weights to reflect the varying preferences of decision-makers and stakeholders. The framework and the dashboard can provide helpful guidance and transparency for partner selection processes, facilitating the creation of RE trade networks that are essential for a successful energy transition.
1. Introduction
Addressing the worsening climate crisis requires a rapid transition from fossil fuels to renewable energy (RE) sources. Recently, the introduction of new climate neutrality targets and the energy crisis resulting from Russia’s war against Ukraine have further intensified the need for a rapid and comprehensive decarbonization of national economies across all sectors [1]. However, meeting the rapidly growing demand for RE through domestic production alone is a challenge for many industrialized countries. This challenge arises from the inherently volatile nature and uneven geographical distribution of RE, which makes RE-based energy systems technically complex and expensive (Over the last decade, remarkable progress has been made in RE generation. However, RE currently still accounts for only approximately 30% of global electricity generation [2]).
In this urgent situation, many industrialized countries are not only accelerating their own RE production but are also planning to import additional RE from countries where it is more abundant and production is more affordable, particularly from countries with ample sun and wind resources. For these countries, the prospect of RE trade opens up new opportunities to promote local socioeconomic development, including that in developing countries with favorable conditions for RE production from solar and wind resources. Research generally suggests that RE trade will be a crucial element in achieving a successful global energy transition [3,4,5,6].
Various technologies are currently being explored for storing, transporting, and releasing RE, including carriers such as hydrogen and ammonia, as well as reactive metals such as iron and aluminum [7,8,9,10,11,12,13,14]. These technologies have the potential to enable large-scale RE storage and long-distance transport via pipelines and/or ships. For instance, hydrogen can serve as an energy carrier, industrial raw material, and transport fuel in sectors that are difficult to decarbonize [15,16,17] (The environmental impact of the emerging hydrogen economy will, of course, depend on the use of low- or zero-carbon production modes).
These developments are expected to create an international RE market with substantial geopolitical and economic consequences, as new trade relationships create opportunities and shift (inter)dependencies [18,19,20,21]. For countries seeking to import RE, the key question is how to select partner countries given the large number of potential suppliers. This question has become even more important in the current context of a changing geopolitical landscape and the experience of multiple crises, which have made countries more cautious about entering into new trade relationships and (inter)dependencies.
This situation is complicated by the fact that RE trade (as any energy system) involves massive interdependencies between social, ecological, and technical systems. As a result, the establishment of sustainable and reliable RE trade relationships would have to address many different objectives, ranging from technological and economic feasibility to environmental protection, social acceptance, and institutional stability and effectiveness [22]. However, the literature on RE trading continues to be dominated by technological and economic assessments, which typically identify countries with more abundant RE and water resources as suitable partners [18,21,23,24,25,26,27,28,29]. This imbalance has prompted scholars in the field to call for more research from the social sciences, particularly from a development and just transition perspective [5,30,31,32]. Indeed, since problems in interdependent systems are the result of multiple factors [33], focusing on just one aspect of the development of RE trading is unlikely to be a successful strategy.
The situation is further complicated by the fact that RE trading affects many different actors whose objectives and values may differ and conflict. Depending on these values, the same impacts of RE trading may be interpreted differently. Decision-makers in RE trading therefore need to reconcile differences and build coalitions. Considering multiple objectives and criteria ex ante can make this process“ explicit, transparent, and open to deliberation, rather than obscure and ad hoc” [34] (p. 149).
Recently, there have been increasing efforts to develop more holistic, multi-criteria assessments of RE trade partnerships and potential partner countries [28,35,36,37,38]. For example, Quitzow et al. [36] argued that the development of international hydrogen partnerships should consider six interrelated policy dimensions: climate change mitigation, geopolitics, green industrial development, the security of the supply, economic feasibility, and just transitions. Brauer et al. [37] analyzed factors such as technological feasibility, supply costs, and the political, macroeconomic, know-how, and adaptability dimensions. Breitschopf et al. [35] identified more than twenty indicators in the areas of technical and natural resources; environmental, social, and institutions conditions; infrastructure; and economic frameworks that can be considered when developing partnerships. In addition, existing energy and hydrogen cooperation and related projects should be considered.
These studies have made important contributions to our understanding of RE trading and potential partnerships. However, this research landscape is also confusing due to the numerous dimensions and indicators proposed and the limited guidance on how to navigate this complexity. In particular, there is a lack of guidance on how to reduce this complexity to more manageable levels while respecting the plurality of values and concerns. Therefore, it is necessary to carefully consolidate and systematize indicators and objectives. This task is not trivial, as there are many more objectives and interdependencies between these objectives than decision-makers can typically take into account [34]. Additionally, there is a lack of tools available for decision-makers and researchers to effectively assess and compare potential RE trading partners [35].
This article aims to fill this research gap. To this end, we propose a new multidimensional framework for evaluating and comparing RE trading partner countries that contributes to the literature in at least four ways. First, instead of focusing on a single perspective such as economic and technological feasibility, our framework respects the complexity of sustainable energy systems by including multiple criteria reflecting social, environmental, economic, and institutional considerations. Second, we include more specific RE-related regulatory, institutional, and innovation indicators than existing multi-criteria approaches. Third, and perhaps most importantly, we argue for a more tractable set of objectives and criteria organized along four distinct dimensions of sustainable energy systems: economy and technology, environment and development, regulation and governance, and innovation and cooperation. Finally, we create a publicly available dashboard tool that can be used to evaluate and compare potential RE trading partners. The dashboard allows for the customizable weighting of dimensions and criteria to reflect different preferences and values of decision-makers and stakeholders, providing a flexible tool for exploring areas of consent and contestation.
The article proceeds as follows: First, we review the literature and discuss key issues and objectives related to RE trading and the selection of partner countries organized along the four dimensions of our framework. Next, focusing on the case of Germany as a likely future importer of RE, we identify a comprehensive list of empirical indicators with which to measure and evaluate these issues. To this end, we compile a comprehensive dataset that includes 23 indicators for 112 potential partner countries. We then conduct an exploratory factor analysis to determine how indicators can be meaningfully combined. Based on these results, we normalize and aggregate our data to construct composite criteria. The results suggest that developing nations neighboring Germany, as well as established net energy exporters such as Canada, Australia, and Norway, are highly favorable partners for renewable energy (RE) trading. The framework also highlights the potential of additional partners from the Middle East and Africa, albeit with comparatively lower rankings on environmental and governance metrics. Finally, we introduce an initial version of the customizable dashboard tool that can be used to evaluate and compare potential RE trading partners. Future versions of the tool may incorporate additional criteria and refinements of existing criteria.
The framework and dashboard are novel contributions that can guide decision-making by reducing complexity and making the exploration of trade-offs between criteria and objectives more transparent, facilitating the justification of decisions in building the renewable energy trading systems necessary for a successful energy transition.
2. Key Dimensions for Evaluating RE Trading Partners
The selection of RE trading partners is a complex task in which decision-makers may have to consider several different objectives and potential trade-offs between these objectives, such as their cost-effectiveness, environmental protection, social acceptability, and the security of the supply. As outlined above, existing studies tend to focus on only one or a few of these objectives, while only a few studies consider multiple objectives and criteria.
In this section, we review the main issues and criteria that are discussed in the literature on RE trading. We organize our presentation along four dimensions: economy and technology, environment and development, regulation and governance, and cooperation and innovation. These dimensions reflect an expanded view of energy sustainability [22] that includes not only the widely known core of economic, social, and environmental considerations but also the institutional framework and opportunities for innovation and cooperation. We argue that these dimensions, taken together, provide a sound basis for evaluating potential RE trading partners and give practical guidance for creating reliable RE trade partnerships.
Although other dimensions may be relevant, the four dimensions included in our framework provide a robust representation of the questions and issues emphasized in the evolving literature on RE trading. Moreover, by focusing on four dimensions, we strike a balance between our goal of consolidating existing criteria and providing a comprehensive basis for selecting RE trading partners. Below, we discuss each dimension in turn before moving on to identify specific empirical indicators.
2.1. Economy and Technology
First, RE trading must be technically viable and reach competitive cost levels to be implemented on a larger scale. Given the early stage of development and high level of uncertainty in the RE market, most research on the RE trade to date has focused on technological and economic feasibility. Economic assessments usually involve general macroeconomic indicators or models of RE production and transportation costs or a combination of both [27,36,39]. Studies have conducted detailed supply cost analyses that depend on the dominant production and storage technology for RE, typically identifying countries rich in wind and sun resources as preferred partners [18,37].
In addition to the production costs of RE, the costs of transporting RE carriers, such as hydrogen, and the necessary technical infrastructure have been subjects of considerable academic attention [28,40]. Research shows that the cost of transporting RE varies depending on the transportation methods and carriers used [17,37,41,42]. While shipping is generally considered a cost-effective means of transporting large quantities of goods, shipping hydrogen requires more complex technical infrastructure than does transporting reactive metals such as iron [9,43]. Scholars have analyzed and debated the economic viability of long-distance hydrogen trading, such as from Chile or Australia to Europe. While some researchers argue that global differences in production costs and relatively low transportation costs make this approach feasible [6,44], others are more skeptical [45].
Regardless of the carrier used for transportation, a high-quality infrastructure is typically viewed as a facilitator of the RE trade. As a result, general infrastructure indicators are frequently employed in technical and economic assessments. High-quality infrastructure is expected to not only improve the movement of the carrier itself but also enhance plant operations, worker mobility, and the transportation of other raw materials, and products [35]. An inadequate infrastructure can lead to increased costs and delays negatively impacting supply chain security and increasing environmental risks [32,35].
2.2. Environment and Development
The dominant research focus on economic and technological feasibility has inspired an increasing number of scholars to highlight other potentially important criteria in the development of the RE trade. A growing body of research emphasizes the environmental, developmental, and related geopolitical consequences of a future RE trade market [5,19,46,47]. For example, scholars have cautioned against importing RE from countries with drought risks, a lack of RE production, energy poverty, and generally weak social standards, arguing that such trade relationships may exacerbate existing equity gaps, creating new exploitative relationships between the Global North and South while consolidating patronage and rights abuses in the exporting countries [20,31,32,48,49].
To ensure sustainable RE exports, it is important to consider potential partners’ decarbonization agendas. Countries with a stronger RE sector are less likely to undermine their own energy transition by becoming RE exporters. Moreover, these countries can be expected to have more knowledge and more advanced technologies, invest more in the RE sector, and be more committed to meeting international climate commitments, which can help to build reliable RE trade relationships [50,51,52]. In contrast, importing RE from countries with high levels of GHG emissions harms the importer’s reputation for a commitment to clean energy transitions [53,54].
2.3. Regulation and Governance
Another important dimension in assessing potential RE trading partners is their political, institutional, and regulatory environment. Research suggests that well-functioning institutions that respect local interests and prevent conflicts, as well as effective business regulations, create a favorable environment for investment in the RE trade [35,37,38]. Such countries are less risky investment targets because of their ability to create and enforce laws and regulations and to curb corrupt, rent-seeking, and clientelistic practices [55,56,57]. This position also makes these countries more likely to benefit from technology and knowledge transfers, further increasing their attractiveness as RE trading partners [58].
Finally, it is important to note that not only the general institutional setup of a country but also its regulatory approach to RE, which is often neglected in existing studies, is important for the establishment of an RE trade. For example, a supportive legal framework, including feed-in tariffs and/or tax incentives for RE, can encourage investment and development in the sector [54,59,60]. Such an environment also signals a long-term commitment to RE development, enhancing the legitimacy of such trade relations from the perspective of importers.
2.4. Innovation and Cooperation
Finally, the capacity of countries to innovate and create new industries, as well as their ability to cooperate internationally, is another crucial aspect that can facilitate RE trade partnerships. This aspect is often overlooked in existing studies. Countries that are more technologically advanced are more likely to develop new RE production and transport technologies and adopt innovations developed elsewhere [35,61]. Cooperation with these countries can therefore result in efficiency gains and lower production costs in RE, which can increase investor profits [28,62].
RE importers may also prefer suppliers with a proven track record of international cooperation [58]. Selecting partners with a history of international energy cooperation may enhance the legitimacy of such partnerships by demonstrating an adherence to international standards in energy production and trading [63]. This selection may also entail higher levels of trust and policy alignment, which can reduce transaction costs and improve access to finance [37,64].
3. Data and Analysis
The aim of this study is to develop a coherent framework for a comprehensive and systematic evaluation of potential RE trading partners. It seeks to identify a consolidated set of selection criteria across the four discussed dimensions that capture the most relevant aspects in an RE trading partner selection process.
We illustrate our approach using the case of Germany as a particularly likely future RE importer. Germany is an interesting and appropriate case because it is a major political and economic actor in the EU with high climate change mitigation ambitions while it also faces considerable challenges in its energy transition. Germany is committed to achieving carbon neutrality by 2045 and has recently phased out nuclear power while continuing to phase out coal. As a result, there is a substantial and growing demand for RE. Germany’s projected RE demand exceeds its production capacity, prompting the government to consider RE imports from abroad, including that in the form of green hydrogen, which is also expected to replace fossil fuels in industrial processes [26,65].
For some time, Germany has been signing energy partnerships around the world and trying to identify further import options [35,36,66]. This makes Germany a relevant example, as other importer countries such as the Netherlands and Belgium face similar challenges [38]. Moreover, it is important to note that the framework presented is generic and most of the data presented do not pertain specifically to Germany. Therefore, the framework can be easily adapted to other RE importers.
Figure 1 summarizes our research strategy. First, we identify relevant indicators within each of the four dimensions outlined. We then compile a cross-country dataset and conduct an exploratory factor analysis (EFA) to combine this information and identify meaningful criteria. We then aggregate our data and present a snapshot of our findings. Finally, we present and discuss a publicly available dashboard tool that provides a dynamic summary of our framework and allows for the weighting of dimensions and criteria based on user preferences.
3.1. Data Collection and Measurement
The data are all collected from public sources with the aim of providing a comprehensive and transparent assessment of potential RE trading partners. We focus on maritime countries because shipping appears to be the most widely available transport option in terms of different carriers and potential suppliers. In contrast, the pipeline transport of RE is limited to certain carriers, such as hydrogen, and a smaller group of potential suppliers [37]. We also exclude countries with fewer than one million inhabitants due to their limited RE production capacity and data availability limitations. Our dataset, which is described below, includes 113 countries, covering the vast majority of the world’s current and projected RE production capacity. The indicator variables for each dimension are described in turn, while Table 1 provides a summary including the data sources.
3.1.1. Economy and Technology Indicators
The perhaps best-described economic and technological determinants of RE trade partnerships concern the expected costs, which can be broadly grouped into production and transportation costs [27,37]. To approximate RE production costs, we focus on solar energy as the currently cheapest RE generation technology with broad coverage. Data on the levelized cost of electricity (LCOE) for solar energy are collected from the World Bank’s Solargis database.
Transportation costs for RE are particularly difficult to estimate because they depend on factors such as distance, the transportation infrastructure, and technology [41,42]. In their simplest form, however, transportation costs tend to increase with the distance between the exporter and the importer. Assuming that RE is transported by ship, we approximate transportation costs using the maritime distance between the major ports of potential partner countries as classified by the World Port Index (WPI) and Bremerhaven, Germany’s largest port with direct access to the North Sea (Bremerhaven is the second largest port in Germany. Hamburg, Germany’s largest port, can only be accessed via the River Elbe).
In addition, given the technological challenges of transporting RE [32], a country’s infrastructure may affect the efficiency and reliability of RE trade relations. We therefore include the World Bank’s Logistics Performance Index (LPI), which measures a country’s customs performance, infrastructure quality, ease of arranging shipments, quality of logistics services, tracking and timeliness of shipments, and logistics efficiency.
3.1.2. Environment and Development Indicators
The second dimension concerns the relationship between the RE trade and environmental sustainability. Certainly, the design of individual projects is likely to have a major impact on the environmental impact and (local) acceptance of the RE trade [69]. However, we argue that partnerships with already more developed and environmentally advanced countries are still more likely to meet higher standards, while relations with highly polluting countries that cannot meet the basic energy needs of their citizens are much riskier.
First, we expect that countries with greater RE production capacities are more likely to be able to meet their export demand without compromising their domestic demand and RE targets. In addition, these countries often have more political and technological expertise to advance their RE production and potential exports [32,48]. We measure a country’s RE production capacity as a linear extrapolation of its current capacity to the year 2030.
Second, countries that are more advanced in their own energy transition may be more legitimate suppliers of RE to others [32,70]. We measure this progress by a country’s share of fossil fuels in its electricity mix and its level of CO2 emissions from electricity and heat generation [22].
Similarly, the public acceptance of RE exports may be lower in countries where the basic energy needs of the population are not met, potentially fueling perceptions of injustice and neo-colonial relations [31,49]. We use the proportion of the population with access to electricity and clean cooking fuels and technologies to measure the extent to which a country is meeting these needs.
There are also environmental risks associated with the RE trade. In particular, countries with limited freshwater resources may face more limited acceptance of investments in water-intensive RE export technologies, such as hydrogen electrolysis, as this could lead to competition for water at the local level [32,48,71]. We use the World Bank’s Water Stress Index, which reflects freshwater withdrawals as a percentage of available resources, to approximate potential restrictions on water use.
Finally, natural disasters pose another important risk in the RE trade, potentially leading to production disruptions and the loss of capital. We therefore include the World Risk Index, which measures countries’ exposure and vulnerability to natural hazards [72].
3.1.3. Regulation and Governance Indicators
Policy-makers and investors in the RE trade are likely to consider the regulatory and institutional environment of a potential partner country. Strong entrepreneurial freedoms and efficient business regulations may be preferred [35,73,74], along with respect for core labor rights to avoid reputational risks [31]. We use the Heritage Foundation’s Open Markets and Regulatory Efficiency indices, which assess tariff and nontariff barriers to trade and the quality and efficiency of government regulations on economic freedom and business operations, as well as the compliance with core labor rights such as the freedom of association and organization and collective bargaining.
In addition, policy-makers and investors in the RE trade will likely prefer countries with high-quality governance and political and social stability [22]. To approximate these preferences, we use the unweighted average of the World Bank’s Worldwide Governance Indicators (WGI), which are based on expert assessments across six different dimensions (voice and accountability, political stability and the absence of violence/terrorism, government effectiveness, regulatory quality, rule of law, and the control of corruption).
In addition to the overall regulatory and institutional environment, we expect that the presence of laws and regulations that support RE development could increase confidence in a partner country’s ability to increase RE production and meet its export commitments [60]. We use two indices from the World Bank’s Regulatory Indicators for Sustainable Energy (RISE) database to assess the regulatory and legal environment for RE (specifically, the Incentives and Regulatory Support for RE captures the presence of financial and fiscal instruments, grid connectivity and net metering support regulations, while the Legal Framework for RE takes into account RE laws or policies, specific technology regulations, and RE expansion plans).
Finally, legal safeguards against pollution risks may play a role in RE trading. We assess such safeguards in terms of existing environmental impact assessment (EIA) laws, using data collected from the Legal Atlas, the Environmental Law Alliance Worldwide (ELAW), and the ECOLEX and FAOLEX databases maintained by the FAO, IUCN, and UNEP.
3.1.4. Innovation and Cooperation Indicators
More innovative and (already) more cooperative countries may also be preferred RE trading partners. To measure a country’s technological development and innovation potential, we use both RE-specific and generic indicators. The former are measured by the number of existing operational hydrogen-related projects and the number of RE-related patents and trademarks filed (normalized to GDP). For the latter, we use the innovation potential index of the World Economic Forum (WEF) index and human capital stocks available from the Penn World Tables (PWT) [48].
Finally, existing cooperation may embody greater mutual trust, harmonized regulatory frameworks, and existing infrastructures that can lower transaction costs and reduce risks. As the empirical illustration focuses on Germany, we employ a binary indicator that measures the (non)existence of energy partnerships between Germany and the EU and a potential partner country, using data from the IRENA and the EU-Lex. Table 2 provides a summary of the statistics for all our variables.
3.2. Exploratory Factor Analysis
The above presented dimensions and indicators all reflect important considerations in the evaluation and selection of RE trading partners, but they still represent a rather complex set of variables. Existing studies have either worked with (in some cases, even more) complex sets [35] or with a much more limited number of variables [21,38]. To consolidate existing approaches and develop a coherent and manageable framework, this section explores how the identified indicators in each dimension relate to each other and, thus, the possibilities of combining them in meaningful ways.
To this end, we perform an exploratory factor analysis (EFA) using principal components and varimax rotation after z-standardizing the data. EFA is a well-established method for validating scales and describing a multidimensional dataset with fewer variables. It is particularly appropriate for our purpose, as we seek to determine how many meaningful criteria can be extracted in each of the four dimensions described. Technically, the method measures the ratio of an indicator’s unique variance to its shared variance, thereby extracting factors that can be considered to be explanations of the raw data and its relationships [75]. Moreover, the method is particularly appropriate when measurement errors may be present in the data and has been widely used to construct cross-country indices based on macro data such as ours [76,77,78]. In general, the use of principal components is the most common approach for extracting factors in the construction of composite indicators and indices [78,79].
Since EFA is based on correlations, the first step is to check whether there is sufficient covariance in the data [80,81]. A correlation analysis shows that all variables are correlated with at least one other variable at 0.3 in each dimension (see Appendix A, Table A1, Table A2, Table A3 and Table A4). We then assess the suitability of the data for EFA by calculating Cronbach’s alpha [82] to test the internal consistency of our dimensions. The Kaiser–Meyer–Olkin (KMO) measure of sampling adequacy is used to test whether it is worthwhile to extract factors from our data [83], while a Bartlett sphericity test additionally assesses whether the variables are intercorrelated. Following common practice, we aim for a Cronbach’s alpha > 0.6, a KMO > 0.5, and a Bartlett test of sphericity that is significant at the five-percent level.
After determining that our data meet these conditions, we perform an EFA for each of the four dimensions. We use scree plots (available in the Appendix A) to select the number of factors to retain [84]. We then orthogonally rotate the factors (resulting in uncorrelated factors). The results are presented in Table 3, Table 4, Table 5 and Table 6.
In the economy and technology dimension, the EFA identifies two factors that together explain 72% of the variance in the data (Rho). The first factor relates to the costs of producing and transporting RE, while the second relates to what we call stability, including the indicators of trade infrastructure quality and inflation. Thus, a stable environment for RE trading would be associated with high-quality infrastructure and controlled inflation.
The EFA for the environment and development dimension yields three factors that together explain 71% of the variance. The first relates to the development-related indicators of access to electricity and cooking fuels and the RE generation capacity. The share of fossil fuels in the electricity mix and CO2 emissions from electricity and heat production load positively on the second factor, which may be called decarbonization, reflecting a country’s progress in energy transition. The third factor relates to the environmental risks that may be considered in the development of RE trade, including restrictions on freshwater use and exposure to natural hazards.
In the regulation and governance dimension, the EFA identifies two factors, namely, governance quality and RE regulation, which together account for 71% of the variance in the data. The first factor relates to the general governance quality of a country, as measured in terms of political and market-related indicators. In contrast, the second factor relates to specific RE and environmental regulations.
Finally, in the last dimension, we identify two factors related to what we call innovation potential and international cooperation. These two factors explain approximately 75% of the variance in the data. The first factor has consistently high positive loadings on the four innovation-related indicators, i.e., RE innovation activity, human capital, hydrogen innovation, and innovation capacity. The second factor includes the indicators related to (pre)existing energy cooperation with Germany and the EU.
3.3. Construction of Composite Criteria
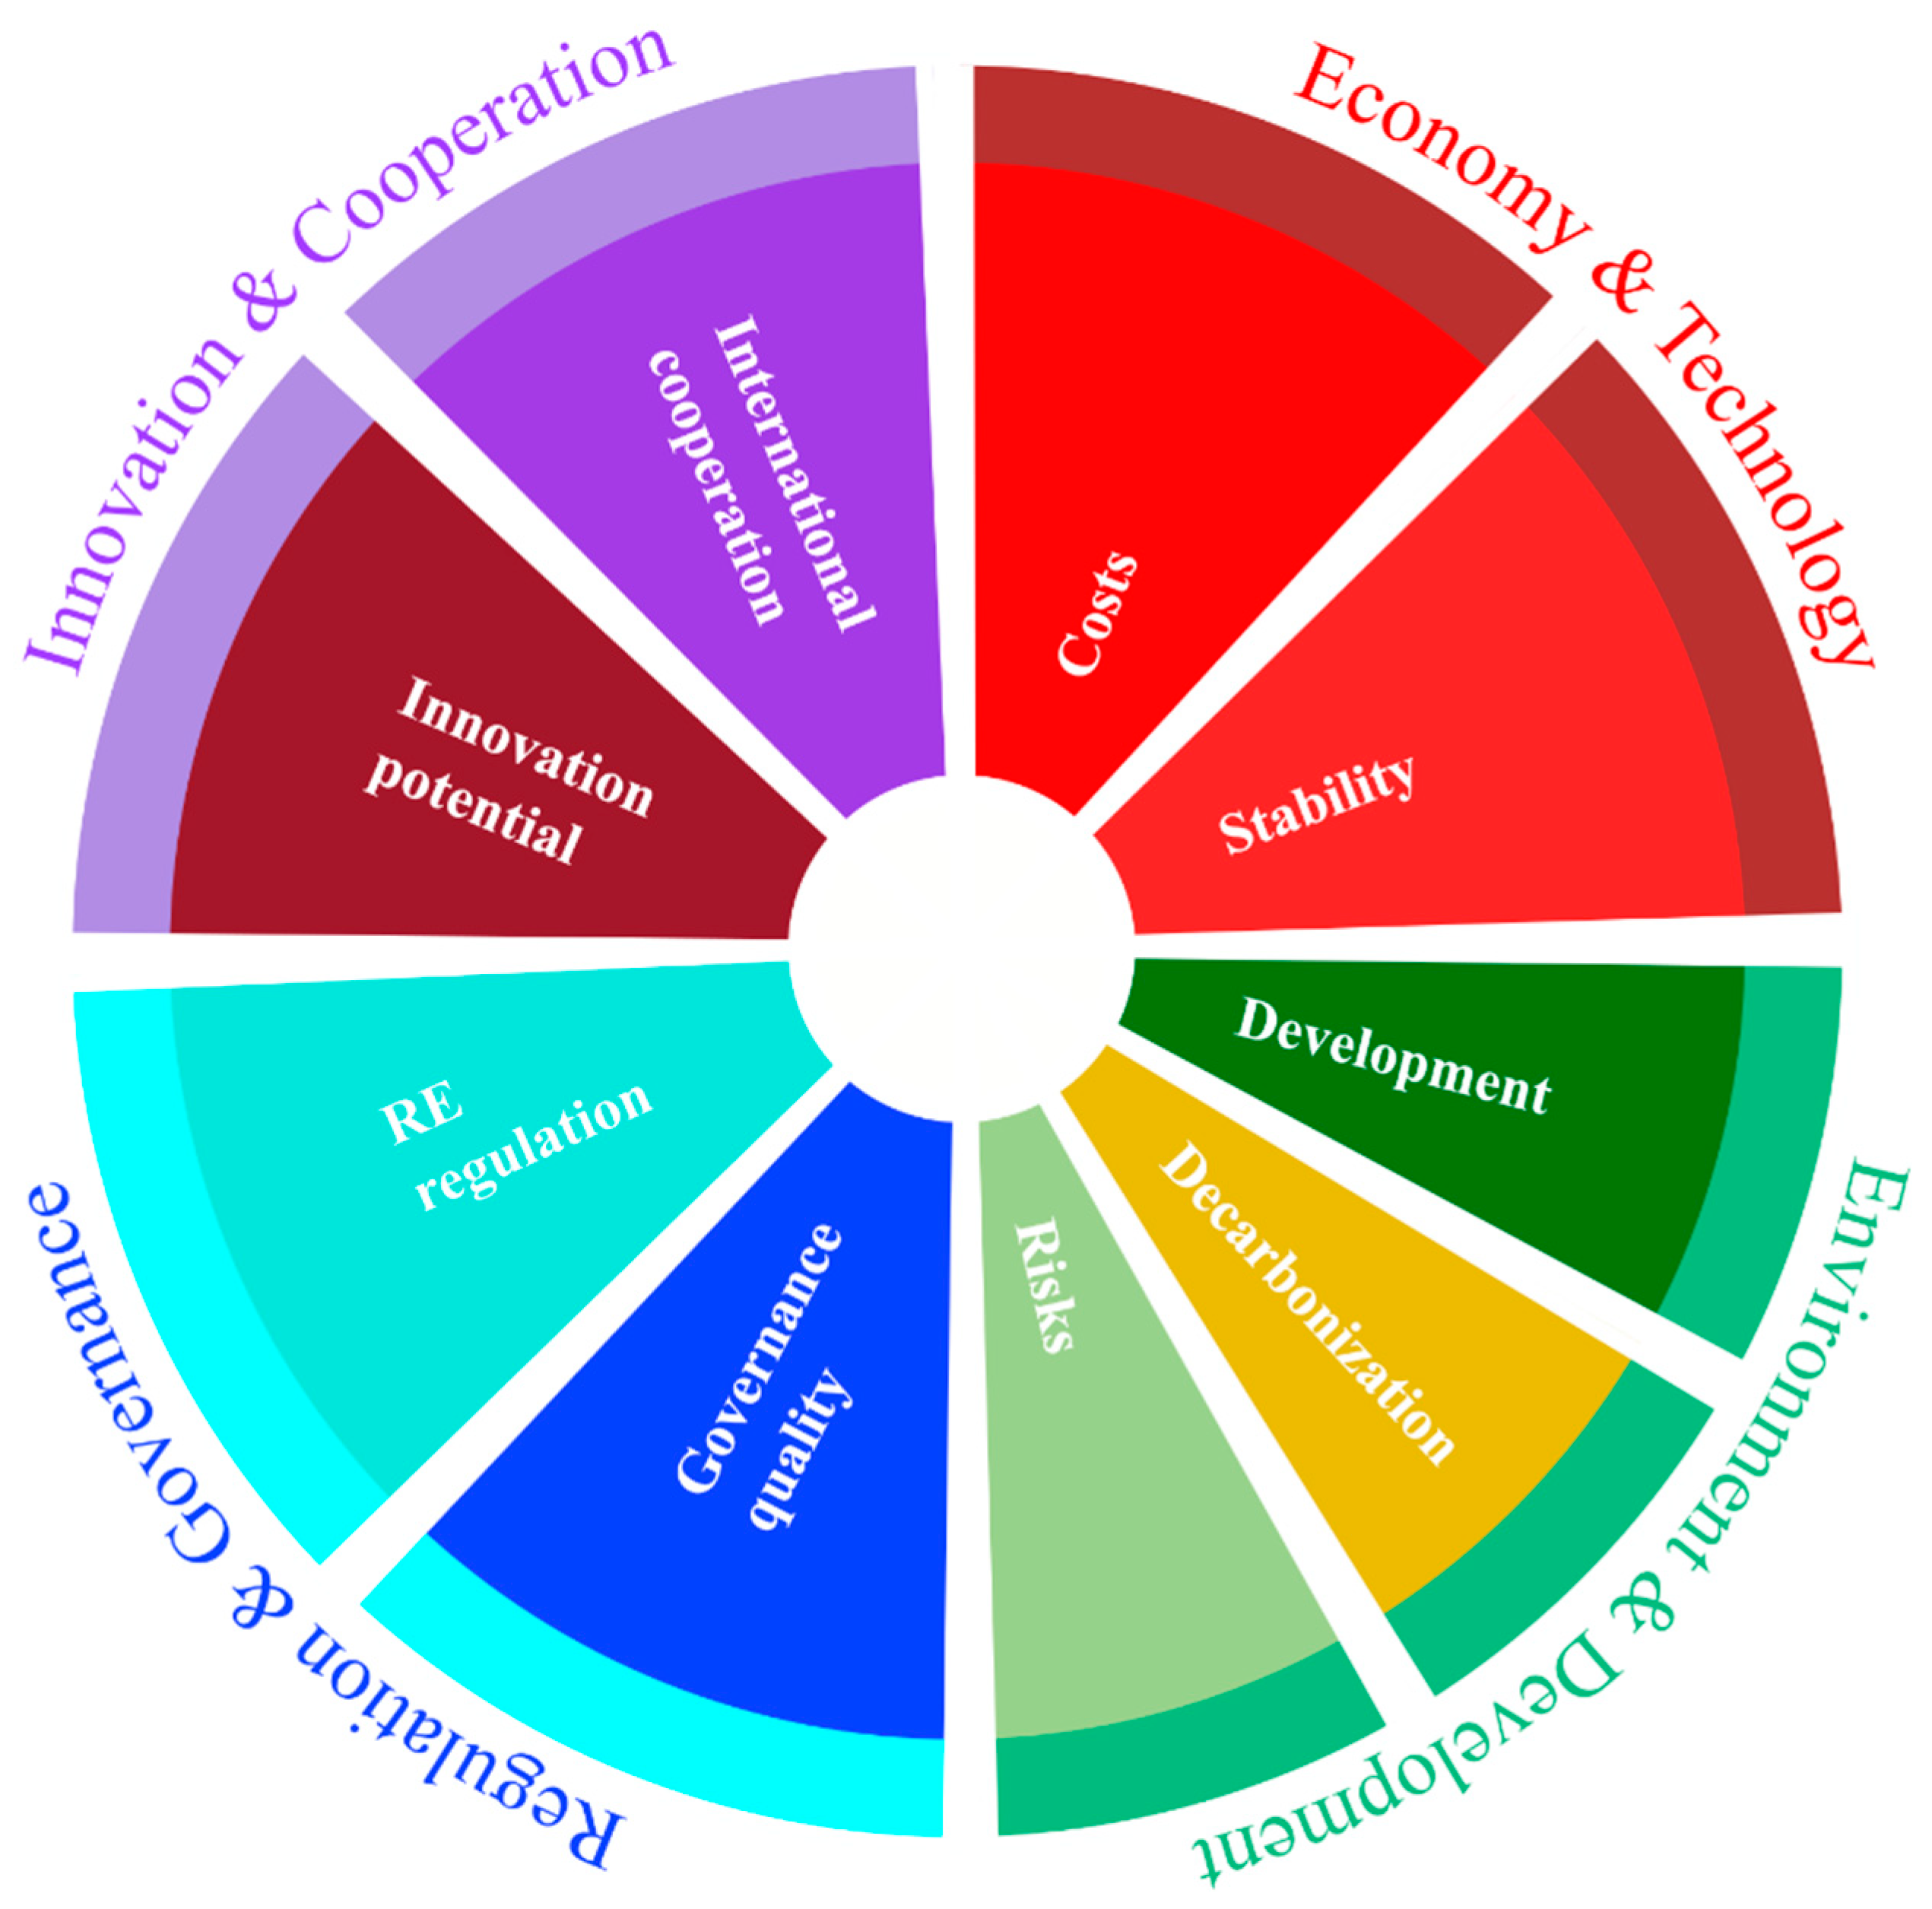
The results of the EFA reveal fairly strong correlations that allow the indicators to be consolidated and aggregated in a meaningful way. Based on the identified factors, we have therefore created nine composite criteria that, together with the four dimensions, form the primary components of our framework for evaluating potential RE trading partners. Figure 2 illustrates the overall structure of our proposed consolidated framework, including all composite criteria and dimensions.
To aggregate the data, we use a min–max normalization procedure, rescaling variable values to a range of 0 to 100. This approach is particularly accessible and suitable for comparing a finite set of potential partners. Therefore, it is commonly used by organizations and researchers to construct cross-country indices [76,77].
In constructing the composite criteria and dimensions, we opt for a linear, unweighted combination of indicators in the form of averages (factor-based scores). This approach is likely the best-known formula for aggregating data, and it allows us to use the full variance of the data and to avoid calculating factor scores (weights) [35]. We made this decision due to the lack of specific priors for weighting indicators. In this case, any indicator weights could be controversial. Furthermore, this option is preferred given the exploratory nature of our analysis and the lack of conceptual assumptions regarding the generated factor loadings [77,85].
4. Results and Discussion
Figure 3 presents the results for the four dimensions, each with equal criteria weights. The findings indicate that, overall, developed countries rank higher as potential RE trading partners for Germany in all four dimensions. European countries neighboring Germany generally rank high on the economy and technology dimension reflecting lower transportation costs. However, countries from South America, for example, rank lower than others that are even farther away from Germany, such as Australia, due to their lower infrastructure and stability scores. This result is broadly consistent with previous findings [28,41].
In terms of the environment and development dimension, more advanced, industrialized countries generally rank higher than less developed countries, reflecting greater environmental and development risks in the latter. The latter includes countries such as Namibia and South Africa, which have excellent conditions for RE production but riskier emissions and development characteristics [3,42]. Research suggests that RE importers need to tread carefully and develop projects that provide local benefits in these countries to ensure a just energy transition and increase the local acceptance of RE exports [5,86].
Our data also confirm that more democratic countries tend to score higher on the regulation and governance dimension, making them more reliable potential partners for RE trading [35,37]. Fairly stable countries that can supply low-cost RE can also be found in the Middle East. However, these countries have lower levels of environmental sustainability, particularly due to water restrictions, where RE exports may hinder their own energy transitions [4,38,42]. Therefore, it is important that RE trading with these countries does not interfere with their local supplies of RE and their national decarbonization targets. For example, Morocco could be an attractive RE trading partner for Germany according to our data due to its high RE potential and greater levels of political stability and environmental sustainability than other countries in the region [64,87].
Figure 3 also shows that Canada, the United States, Australia, and China rank highest in the innovation and cooperation dimension. These countries are already investing heavily in positioning themselves as leaders in the RE trade and green hydrogen production, as reflected in our data on RE and hydrogen-related innovation and cooperation [20].
Overall, our data suggest that many of the most attractive RE trading partners for Germany are developed OECD countries. In particular, net energy exporters such as Canada, Australia, and Norway, which already have a high level of energy cooperation with Germany and the EU, can be considered top choices for developing RE trading. Dejonghe [38] would refer to these countries as low-risk partners or “trusted friends”, but she also points out that selecting from this group may lead to too few suppliers and that the “trustworthiness” of countries may also change over time. In this context, our data also reveal opportunities and trade-offs beyond the “usual suspects”, including potential partners from South America, Africa, and the Middle East.
The unweighted results provide an initial overview that is generally consistent with existing studies. However, it is important to note that the value of this unweighted exercise is limited. This is because decision-makers and stakeholders involved in RE trading and selecting partners are likely to have varying and potentially evolving preferences, i.e., views on the relative importance of different criteria and dimensions. For example, a country’s environmental ministry may prioritize cooperation with partners that have a higher level of environmental protection. Meanwhile, investors from the same country may prioritize cost-effectiveness when considering partnerships.
Moreover, it is important to acknowledge and navigate potential trade-offs between dimensions and criteria. For instance, selecting RE trading partners based on a higher level of environmental sustainability may come at a higher cost, and vice versa. Our framework can assist in exploring such trade-offs and identifying areas of agreement and disagreement during the selection process.
To facilitate such differentiated assessments and to allow users to apply their own weights to the criteria and dimensions, we created an interactive dashboard accessible at https://renewable-energy-trade.com (accessed on 20 April 2024). The dashboard provides a visual representation of dimensions and criteria scores for 112 countries in the form of a world map that is updated in real time based on the selected relative weights (Figure 3, thus, essentially provides a snapshot of the dashboard tool when no (i.e., equal) weights are assigned). In addition, users can obtain a detailed comparison of the selected countries across the dimensions. Finally, it is also possible to zoom in on specific regions, such as Africa or North America.
The dashboard serves as a flexible, customizable tool for analyzing and evaluating potential RE trading partners. However, it is important to note that the proposed framework, like most composite indicators, involves constant compensation. This means that high scores in one dimension or criterion can offset low scores in another, which may or may not be desirable [77]. The weights applied by users can thus “only” determine the marginal rates of compensation between criteria and dimensions.
However, we implemented a feature to control the compensability between criteria and dimensions to some extent by setting thresholds. In essence, users can set minimum requirements that potential partner countries must meet, thus defining necessary, nonnegotiable conditions for partnerships. Other criteria that are more open to negotiation can then be left “unlocked” to explore how the potential selection changes with different weights.
Finally, it is worth noting that the dashboard does not offer guidance or recommendations on how to assign weights to dimensions and criteria. Stakeholders can use various subjective and objective methods, such as pairwise comparison or optimization, and combinations thereof, for determining weights in conjunction with the dashboard during a selection process [88,89].
The dashboard should therefore be seen as a flexible tool that can support decision-making by providing transparency and justification for decisions. Most likely, however, a quantitative analysis based on the framework alone will not be sufficient to make final decisions about partners and projects. Such an analysis should be considered a first step, possibly to narrow down the set of candidates for partnership. Next, additional qualitative analyses may be necessary to capture more details about the envisaged partnerships. In particular, building evidence for specific projects would likely require further methods and in-depth analyses at the national, subnational, and local levels. Such considerations could include, for example, social factors such as acceptability, culture, and taste, which are not easily quantified but are often critical to the adoption and approval of new policies and technologies [34].
5. Conclusions
As many industrialized countries face challenges in meeting their increasing demand for RE, the prospect of importing RE using carriers such as hydrogen, ammonia, or reactive metals has gained increasing attention in academic and political debates. However, realizing RE imports requires substantial upfront investments. Therefore, future RE importers must address the pressing question of how to select RE trading partners, i.e., RE exporting countries, from among the many potential alternatives.
Addressing this question clearly goes beyond considerations of cost-efficiency and technological feasibility. A growing body of research argues that future suppliers of RE would have to meet additional standards, such as social, environmental, and governance quality standards, to form reliable trade partnerships. The failure of the infamous Desertec project serves as a reminder that meeting all these requirements is not easy [90,91]. Therefore, it is important to assess and understand the differences between potential partner countries. In addition, it is crucial to acknowledge that there may be trade-offs between different dimensions of energy sustainability when selecting partners [22,69].
This article contributes to recent efforts to evaluate potential RE trading partners based on multiple criteria [28,32,35,37]. In particular, we propose a coherent four-dimensional evaluation framework that consolidates many of the criteria and indicators scattered throughout the literature. We have illustrated the framework focusing on the case of Germany as a likely future importer of RE, creating composite evaluation criteria and a new dynamic dashboard tool that can be used to weight criteria and dimensions. In this context, although this study has focused on Germany as an importer of RE, only a few indicators, namely, the transport distance and existing cooperation, are in fact relational. Therefore, future extensions of the framework to other RE importers can be implemented with relative ease.
The results indicate that developed countries in Germany’s neighborhood and well-known current net energy exporters such as Canada, Australia, and Norway are among the most attractive RE trading partners for Germany. The framework also highlights other potential partners from the Middle East and Africa, although they score lower on environmental and governance criteria. In this context, it is (once again) important to note that the selection of partner countries ultimately depends on the different, and potentially changing, preferences of the decision-makers and stakeholders involved in the selection process. Our framework and the developed tool can “only” support and inform selection processes, but they cannot replace them.
This study contributes to our understanding of the RE trade, but it is important to acknowledge its limitations. First, due to data limitations, the production and transportation cost indicators represent rather crude proxies, e.g., solar energy production and the distance to the importer. Future refinements of the framework could incorporate more detailed cost estimates, such as those for different types of RE carriers, RE production processes, and transportation modes [42]. Second, there is a need to regularly update the data underlying the framework and the dashboard to track and monitor relevant developments. For instance, cost estimates can change quite rapidly depending on developments in energy markets and carbon pricing. Other indicators, such as institutions, may be more stable, while the legal and policy frameworks for RE in a country may be more dynamic.
Decision-makers and scholars should also be aware that this study has focused on the perspective of RE importers. What is missing is the perspective of exporting countries, which could complement the present analysis and further inform selection processes. In particular, it is crucial to consider the strategies of exporting countries and how they would benefit from a particular partnership. Existing studies have only examined a limited number of exporters [3]. Therefore, further research is needed to identify and systematize factors that can be used for comparative assessments of RE exporting countries’ perspectives. In this context, it is also important to consider the potential competition among RE importers, which provides exporters with multiple options. For example, Japan may compete with European countries for RE imports not only from Australia but also from South America and even Europe [25,29,92].
In conclusion, this study contributes to our understanding of the criteria and dimensions that are relevant for developing reliable and sustainable RE trade relations. The results emphasize the need for decision-makers to consider these multiple criteria and dimensions when developing RE trades and to think strategically about the trade-offs between them. This process may involve difficult choices [69], but can also help to design projects and programs that can maximize benefits, minimize drawbacks, and compensate for losses.
However, these choices should reflect not only the different characteristics of individual partnerships but also the entire planned RE trade network and the RE shares that each partner is expected to supply. In other words, the design of RE trade networks should be guided by an analysis of the likelihood and impact of supply disruptions. In general, a well-designed network should spread and balance risks across different sustainability dimensions and partner countries.
Author Contributions
Conceptualization, K.S. and M.M.; methodology, K.S. and N.R.; software, K.S., M.M., N.R. and B.S.; data curation, M.M.; writing—original draft preparation, K.S., M.M. and N.R.; writing—review and editing, K.S.; visualization, M.M., N.R. and B.S.; supervision, K.S.; project administration, K.S. All authors have read and agreed to the published version of the manuscript.
Funding
This research was funded by the Hessian Ministry of Higher Education, Research, Science and the Arts—cluster project Clean Circles (https://www.tu-darmstadt.de/clean-circles/about_cc/index.en.jsp, accessed on 20 April 2024).
Institutional Review Board Statement
Not applicable.
Informed Consent Statement
Not applicable.
Data Availability Statement
The data presented in this study are available on request from M.M. ([email protected]).
Conflicts of Interest
The authors declare no conflict of interest.
Appendix A
Appendix A.1. Country Sample

Table A1.
List of countries used in the analysis.
| Albania | Equatorial Guinea | Lebanon | Romania |
| Algeria | Eritrea | Latvia | Russia |
| Angola | Estonia | Liberia | Saudi Arabia |
| Argentina | Finland | Libya | Senegal |
| Australia | France | Lithuania | Sierra Leone |
| Bahrain | Djibouti | Madagascar | Singapore |
| Bangladesh | Gabon | Malaysia | Vietnam |
| Belgium | Georgia | Mauritania | Slovenia |
| Bosnia and Herzegovina | Ghana | Mauritius | Somalia |
| Brazil | Greece | Mexico | South Africa |
| Bulgaria | Guatemala | Morocco | Spain |
| Myanmar (Burma) | Guinea | Mozambique | Sudan |
| Cambodia | Haiti | Oman | Sweden |
| Cameroon | Honduras | Namibia | Syria |
| Canada | India | Netherlands | Thailand |
| Sri Lanka | Indonesia | New Zealand | Togo |
| Chile | Iran | Nicaragua | Trinidad and Tobago |
| China | Iraq | Nigeria | United Arab Emirates |
| Colombia | Ireland | Norway | Tunisia |
| Congo—Brazzaville | Israel | Pakistan | Turkey |
| Congo—Kinshasa | Italy | Panama | Ukraine |
| Costa Rica | Ivory Coast | Papua New Guinea | Egypt |
| Croatia | Jamaica | Peru | United Kingdom |
| Cuba | Japan | Philippines | Tanzania |
| Benin | Kenya | Poland | United States |
| Denmark | North Korea | Portugal | Uruguay |
| Dominican Republic | South Korea | East Timor | Venezuela |
| Ecuador | Kuwait | Qatar | Yemen |
Appendix A.2. Correlational Matrices for all Four Sustainability Dimensions (Statistically Significant Coefficients > 0.05 in Bold)
Table A2.
Correlation matrix for the economy and technology dimension.
| RE Prod. Cost | Transportation Costs | Infr. Quality | Inflation | |
|---|---|---|---|---|
| RE prod. cost | 1 | |||
| Transportation costs | 0.290 | 1 | ||
| Infr. quality | 0.165 | 0.325 | 1 | |
| Inflation | 0.222 | 0.330 | 0.565 | 1 |
Table A3.
Correlation matrix for the environment and development dimension.
| RE Generation Potential | Share of Fossil Fuels | CO2 Emissions | Water Stress | Exposure to Nat. Hazards | Access to Electricity | Access to Clean Fuels | |
|---|---|---|---|---|---|---|---|
| RE generation potential | 1 | ||||||
| Share of fossil fuels | 0.260 | 1 | |||||
| CO2 emissions | 0.084 | 0.534 | 1 | ||||
| Water stress | −0.124 | 0.089 | 0.044 | 1 | |||
| Exposure to nat. hazards | 0.065 | −0.333 | −0.179 | −0.043 | 1 | ||
| Access to electricity | 0.278 | −0.065 | −0.073 | −0.304 | 0.174 | 1 | |
| Access to clean fuels | 0.300 | −0.052 | −0.048 | −0.257 | 0.270 | 0.893 | 1 |
Table A4.
Correlation matrix for the regulation and governance dimension.
| Quality of Governance | Env. Assessment Laws | Incentives and Regulatory Support for RE | Legal Framework for RE | Trade Freedom | Regulatory Efficiency | |
|---|---|---|---|---|---|---|
| Quality of governance | 1 | |||||
| Env. Assessment laws | 0.270 | 1 | ||||
| Incentives and regulatory support for RE | 0.575 | 0.196 | 1 | |||
| Legal Framework for RE | 0.355 | 0.211 | 0.501 | 1 | ||
| Trade freedom | 0.770 | 0.271 | 0.383 | 0.345 | 1 | |
| Regulatory efficiency | 0.720 | 0.120 | 0.366 | 0.254 | 0.818 | 1 |
Table A5.
Correlation matrix for the innovation and cooperation dimension.
| Energy Partnership with EU | H2 Innovation | RE Innovation | Human Capital | Energy Partnership with GER | Innovation Capacity | |
|---|---|---|---|---|---|---|
| Energy partnership with EU | 1 | |||||
| H2 innovation | −0.198 | 1 | ||||
| RE innovation | −0.446 | 0.549 | 1 | |||
| Human capital | −0.423 | 0.484 | 0.774 | 1 | ||
| Energy partnership with GER | 0.32 | 0.113 | 0.029 | 0.015 | 1 | |
| Innovation capacity | −0.412 | 0.612 | 0.908 | 0.774 | −0.002 | 1 |
Appendix A.3. Scree Plots of Eigenvalues
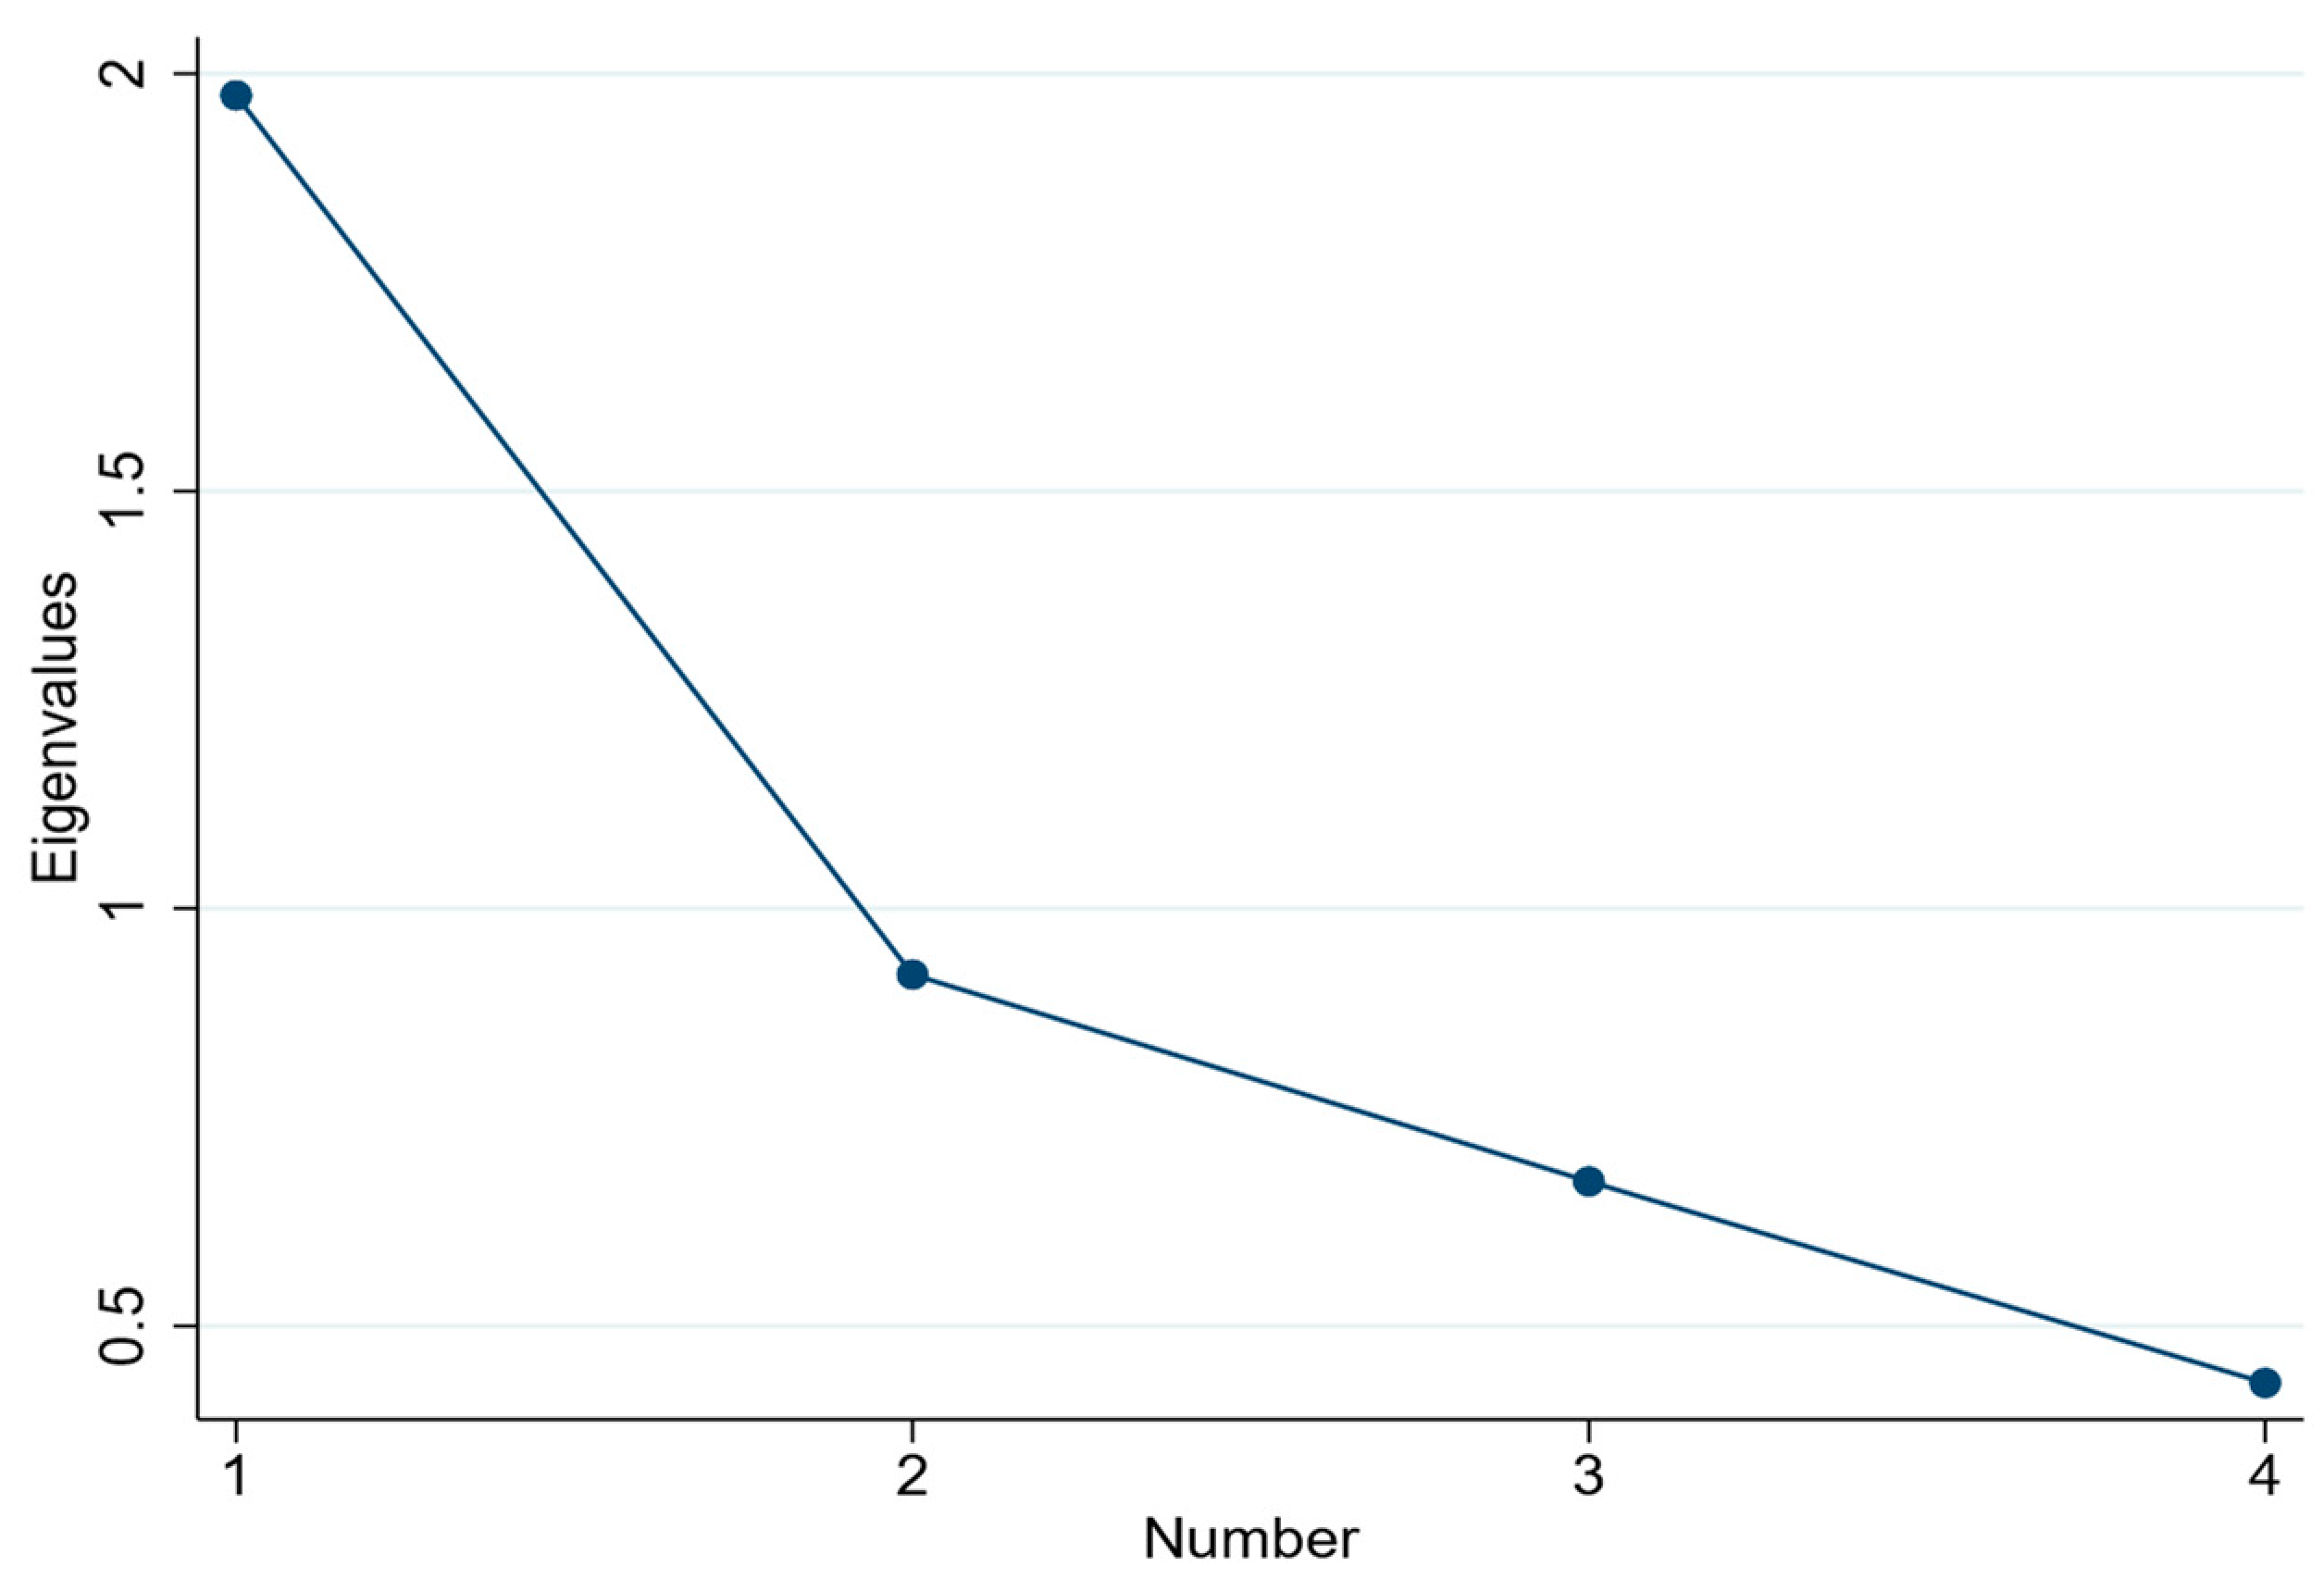
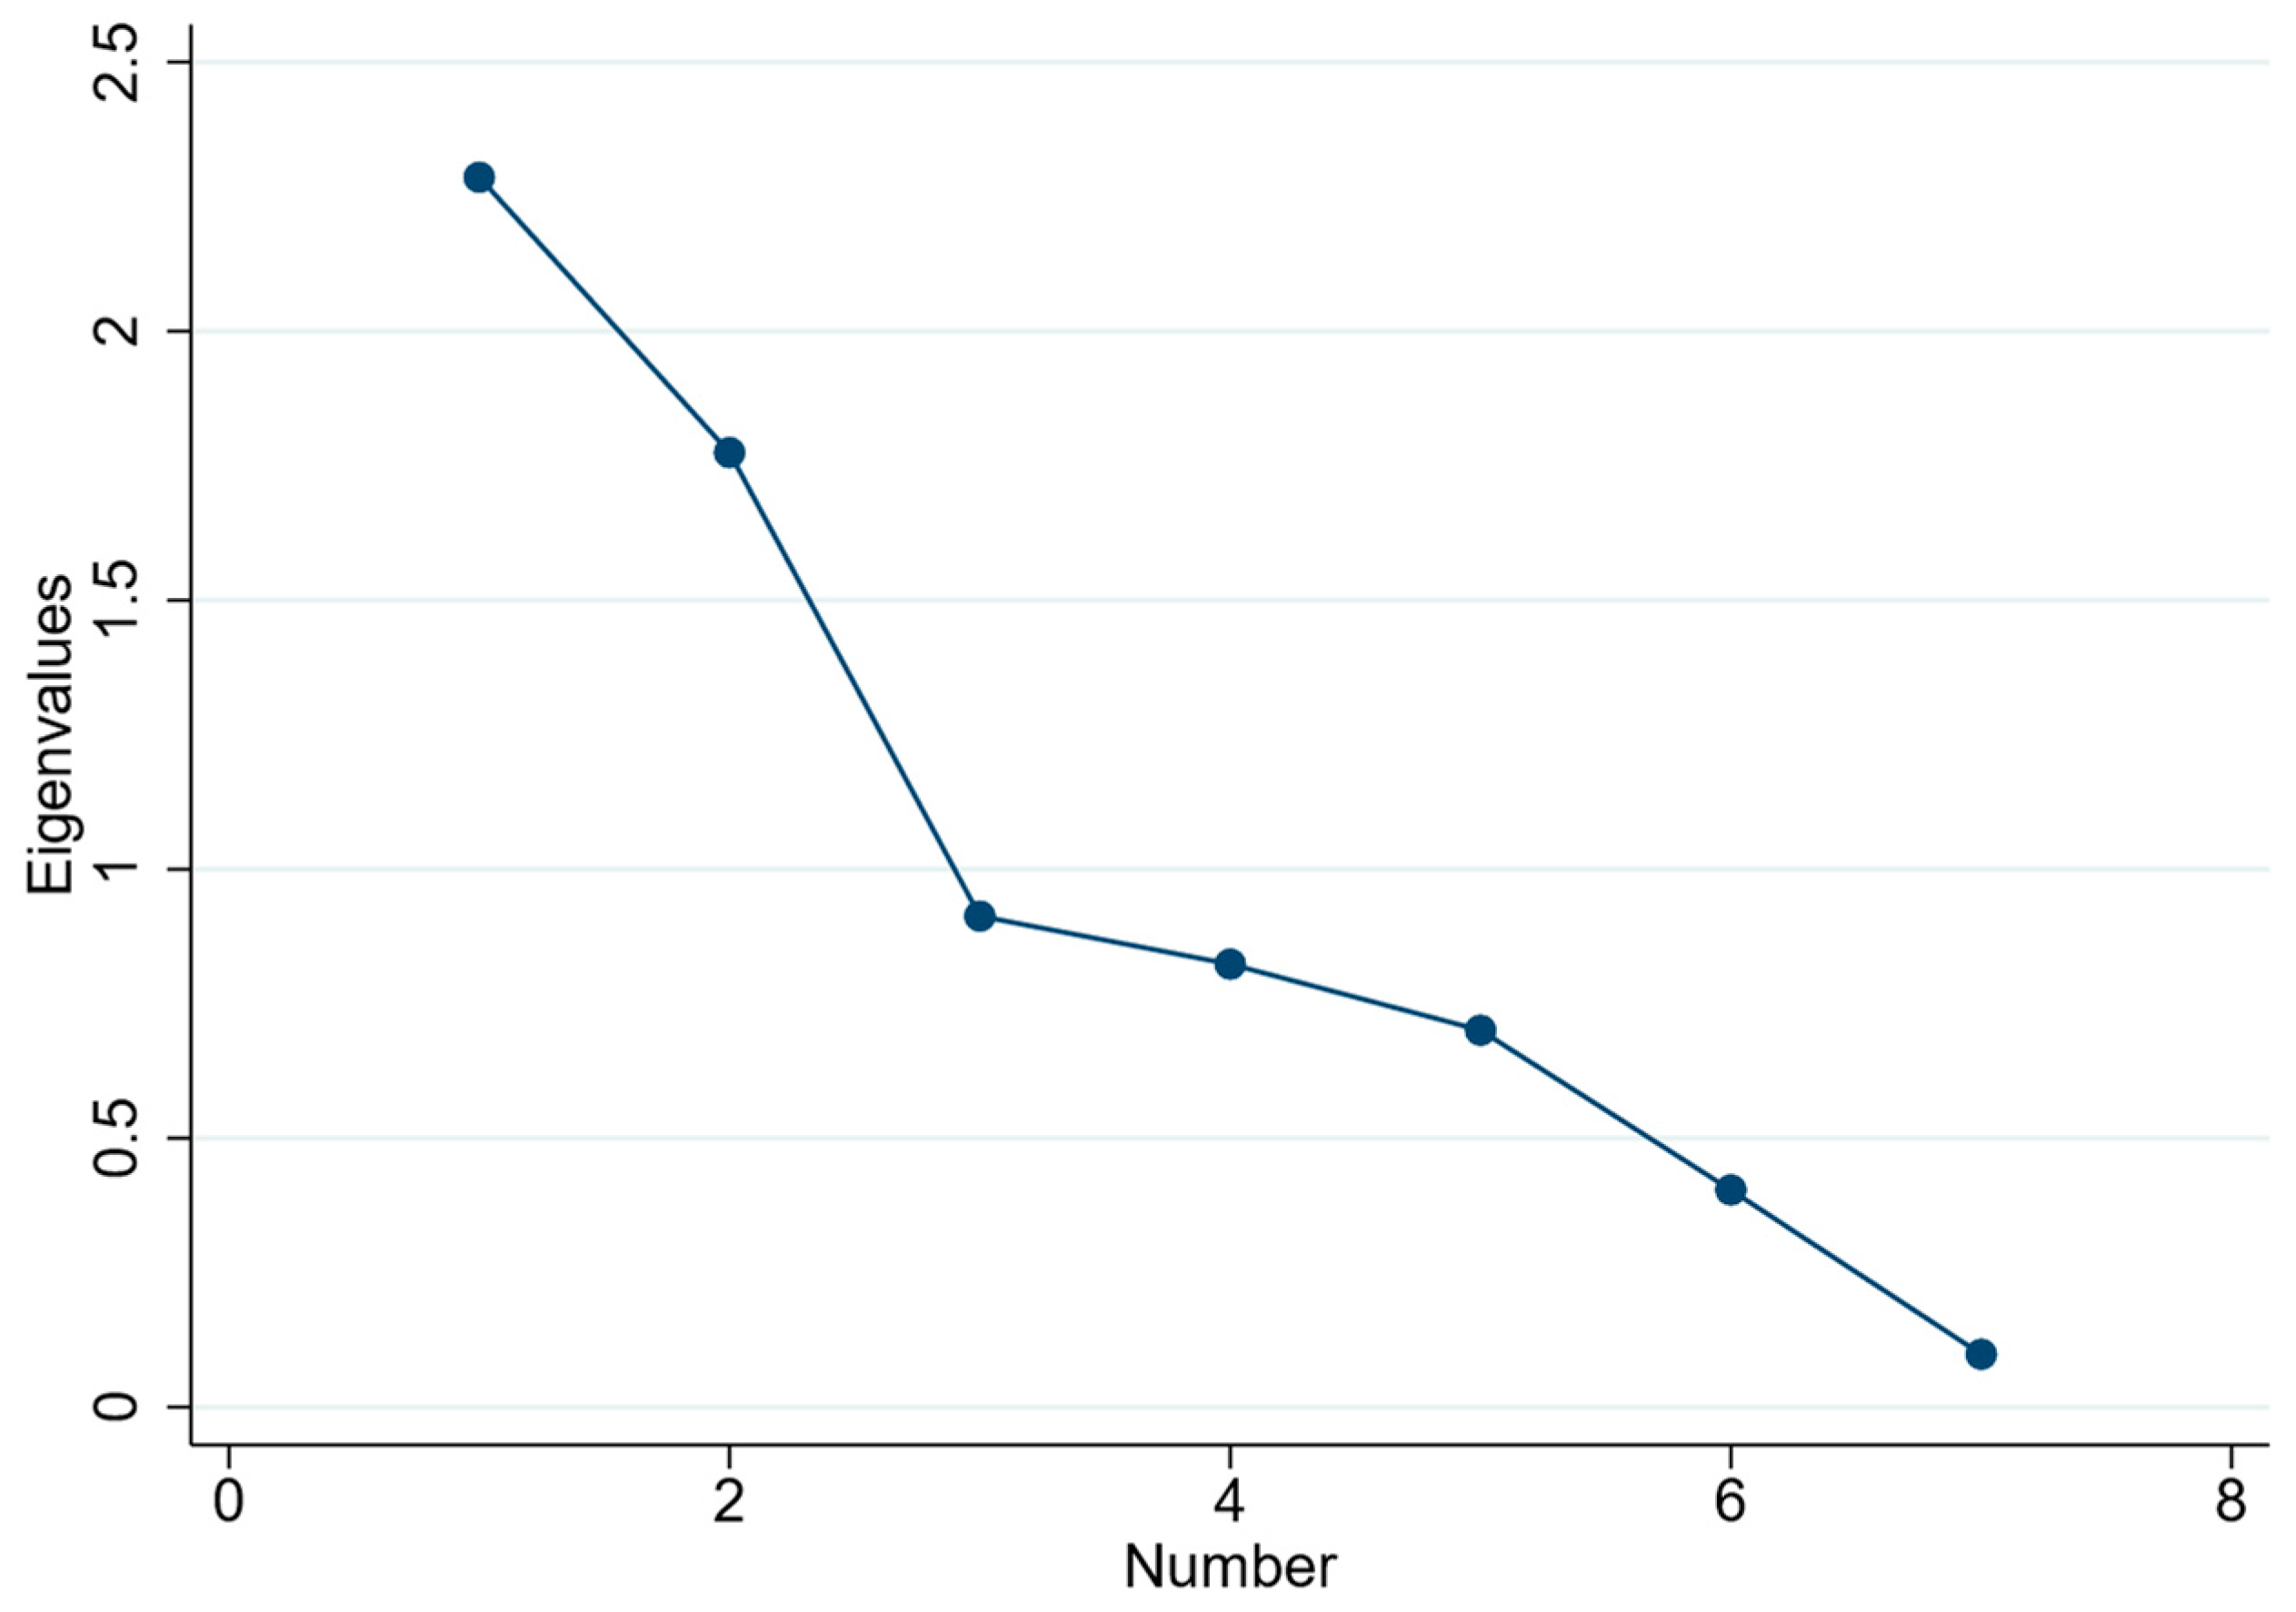
The rule of thumb for making a decision based on the scree test plot in an EFA is to identify the “elbow” point, where the decline in eigenvalues levels off, and to look at the factors to the left of that point. These plots suggest that we will have two main factors in the economy and technology, regulation and governance, and innovation and cooperation dimensions. For the environment and development dimension, the scree test suggests the existence of three factors.
Figure A1.
Scree plot for the economy and technology dimension.

Figure A2.
Scree plot for the environment and development dimension.

Figure A3.
Scree plot for the regulation and governance dimension.

Figure A4.
Scree plot for the innovation and cooperation dimension.

References
- Gillessen, B.; Heinrichs, H.; Hake, J.-F.; Allelein, H.-J. Natural gas as a bridge to sustainability: Infrastructure expansion regarding energy security and system transition. Appl. Energy 2019, 251, 113377. [Google Scholar] [CrossRef]
- IEA. Executive Summary—Renewables 2023—Analysis—IEA. Available online: https://www.iea.org/reports/renewables-2023/executive-summary (accessed on 28 March 2024).
- Cassidy, C.; Quitzow, R. Green Hydrogen Development in South Africa and Namibia: Opportunities and Challenges for International Cooperation; Research Institute for Sustainability (RIFS): Potsdam, Germany, 2023. [Google Scholar]
- IRENA. Geopolitics of the Energy Transformation: The Hydrogen Factor; International Renewable Energy Agency: Abu Dhabi, United Arab Emirates, 2022; ISBN 9789292603700. [Google Scholar]
- Kalt, T.; Tunn, J. Shipping the sunshine? A critical research agenda on the global hydrogen transition. GAIA—Ecol. Perspect. Sci. Soc. 2022, 31, 72–76. [Google Scholar] [CrossRef]
- Schmidt, J.; Gruber, K.; Klingler, M.; Klöckl, C.; Ramirez Camargo, L.; Regner, P.; Turkovska, O.; Wehrle, S.; Wetterlund, E. A new perspective on global renewable energy systems: Why trade in energy carriers matters. Energy Environ. Sci. 2019, 12, 2022–2029. [Google Scholar] [CrossRef]
- Kuhn, C.; Düll, A.; Rohlfs, P.; Tischer, S.; Börnhorst, M.; Deutschmann, O. Iron as recyclable energy carrier: Feasibility study and kinetic analysis of iron oxide reduction. Appl. Energy Combust. Sci. 2022, 12, 100096. [Google Scholar] [CrossRef]
- Abe, J.O.; Popoola, A.; Ajenifuja, E.; Popoola, O.M. Hydrogen energy, economy and storage: Review and recommendation. Int. J. Hydrogen Energy 2019, 44, 15072–15086. [Google Scholar] [CrossRef]
- Neumann, J.; Da Rocha, R.C.; Debiagi, P.; Scholtissek, A.; Dammel, F.; Stephan, P.; Hasse, C. Techno-economic assessment of long-distance supply chains of energy carriers: Comparing hydrogen and iron for carbon-free electricity generation. Appl. Energy Combust. Sci. 2023, 14, 100128. [Google Scholar] [CrossRef]
- Debiagi, P.; Rocha, R.C.; Scholtissek, A.; Janicka, J.; Hasse, C. Iron as a sustainable chemical carrier of renewable energy: Analysis of opportunities and challenges for retrofitting coal-fired power plants. Renew. Sustain. Energy Rev. 2022, 165, 112579. [Google Scholar] [CrossRef]
- Noussan, M.; Raimondi, P.P.; Scita, R.; Hafner, M. The Role of Green and Blue Hydrogen in the Energy Transition—A Technological and Geopolitical Perspective. Sustainability 2021, 13, 298. [Google Scholar] [CrossRef]
- Janicka, J.; Debiagi, P.; Scholtissek, A.; Dreizler, A.; Epple, B.; Pawellek, R.; Maltsev, A.; Hasse, C. The potential of retrofitting existing coal power plants: A case study for operation with green iron. Appl. Energy 2023, 339, 120950. [Google Scholar] [CrossRef]
- Baumann, M.; Barelli, L.; Passerini, S. The Potential Role of Reactive Metals for a Clean Energy Transition. Adv. Energy Mater. 2020, 10, 2001002. [Google Scholar] [CrossRef]
- Capurso, T.; Stefanizzi, M.; Torresi, M.; Camporeale, S.M. Perspective of the role of hydrogen in the 21st century energy transition. Energy Convers. Manag. 2022, 251, 114898. [Google Scholar] [CrossRef]
- McDowall, W. Exploring possible transition pathways for hydrogen energy: A hybrid approach using socio-technical scenarios and energy system modelling. Futures 2014, 63, 1–14. [Google Scholar] [CrossRef]
- Kovač, A.; Paranos, M.; Marciuš, D. Hydrogen in energy transition: A review. Int. J. Hydrogen Energy 2021, 46, 10016–10035. [Google Scholar] [CrossRef]
- Griffiths, S.; Sovacool, B.K.; Kim, J.; Bazilian, M.; Uratani, J.M. Industrial decarbonization via hydrogen: A critical and systematic review of developments, socio-technical systems and policy options. Energy Res. Soc. Sci. 2021, 80, 102208. [Google Scholar] [CrossRef]
- Brändle, G.; Schönfisch, M.; Schulte, S. Estimating long-term global supply costs for low-carbon hydrogen. Appl. Energy 2021, 302, 117481. [Google Scholar] [CrossRef]
- van de Graaf, T.; Overland, I.; Scholten, D.; Westphal, K. The new oil? The geopolitics and international governance of hydrogen. Energy Res. Soc. Sci. 2020, 70, 101667. [Google Scholar] [CrossRef] [PubMed]
- Eicke, L.; de Blasio, N. Green hydrogen value chains in the industrial sector—Geopolitical and market implications. Energy Res. Soc. Sci. 2022, 93, 102847. [Google Scholar] [CrossRef]
- Ikonnikova, S.A.; Scanlon, B.R.; Berdysheva, S.A. A global energy system perspective on hydrogen Trade: A framework for the market color and the size analysis. Appl. Energy 2023, 330, 120267. [Google Scholar] [CrossRef]
- Iddrisu, I.; Bhattacharyya, S.C. Sustainable Energy Development Index: A multi-dimensional indicator for measuring sustainable energy development. Renew. Sustain. Energy Rev. 2015, 50, 513–530. [Google Scholar] [CrossRef]
- Fasihi, M.; Weiss, R.; Savolainen, J.; Breyer, C. Global potential of green ammonia based on hybrid PV-wind power plants. Appl. Energy 2021, 294, 116170. [Google Scholar] [CrossRef]
- Schorn, F.; Breuer, J.L.; Samsun, R.C.; Schnorbus, T.; Heuser, B.; Peters, R.; Stolten, D. Methanol as a renewable energy carrier: An assessment of production and transportation costs for selected global locations. Adv. Appl. Energy 2021, 3, 100050. [Google Scholar] [CrossRef]
- Ishimoto, Y.; Voldsund, M.; Nekså, P.; Roussanaly, S.; Berstad, D.; Gardarsdottir, S.O. Large-scale production and transport of hydrogen from Norway to Europe and Japan: Value chain analysis and comparison of liquid hydrogen and ammonia as energy carriers. Int. J. Hydrogen Energy 2020, 45, 32865–32883. [Google Scholar] [CrossRef]
- Ruprecht, D.; Schmidt-Achert, T.; Zahler, J.; Pichlmaier, S. Imports of Green Hydrogen and Its Derivates to Germany in a Climate Neutral Future: A Meta-Study, Munich. 2022. Available online: https://www.ffe.de/wp-content/uploads/2023/01/Imports-of-green-hydrogen.pdf (accessed on 5 May 2023).
- Moritz, M.; Schönfisch, M.; Schulte, S. Estimating global production and supply costs for green hydrogen and hydrogen-based green energy commodities. Int. J. Hydrogen Energy 2023, 48, 9139–9154. [Google Scholar] [CrossRef]
- Pflugmann, F.; De Blasio, N. The Geopolitics of Renewable Hydrogen in Low-Carbon Energy Markets. Geopol. Hist. Int. Relat. 2020, 12, 9–44. [Google Scholar] [CrossRef]
- Heuser, P.-M.; Ryberg, D.S.; Grube, T.; Robinius, M.; Stolten, D. Techno-economic analysis of a potential energy trading link between Patagonia and Japan based on CO2 free hydrogen. Int. J. Hydrogen Energy 2019, 44, 12733–12747. [Google Scholar] [CrossRef]
- Hanusch, F.; Schad, M. Hydrogen research: Technology first, society second? GAIA—Ecol. Perspect. Sci. Soc. 2021, 30, 82–86. [Google Scholar] [CrossRef]
- Müller, F.; Tunn, J.; Kalt, T. Hydrogen justice. Environ. Res. Lett. 2022, 17, 115006. [Google Scholar] [CrossRef]
- Heinemann, C.; Mendelvitch, R. Sustainability Dimensions of Imported Hydrogen; Oeko-Institut Working Paper 8/2021; Oeko-Institut: Freiburg im Breisgau, Germany, 2021. [Google Scholar]
- Hulme, M. Why We Disagree about Climate Change: Understanding Controversy, Inaction and Opportunity; Cambridge University Press: Cambridge, UK, 2009; ISBN 9781107268890. [Google Scholar]
- Bhardwaj, A.; Joshi, M.; Khosla, R.; Dubash, N.K. More priorities, more problems? Decision-making with multiple energy, development and climate objectives. Energy Res. Soc. Sci. 2019, 49, 143–157. [Google Scholar] [CrossRef]
- Breitschopf, B.; Thomann, J.; Garcia, J.F.; Kleinschmitt, T.C. Importing Hydrogen and Hydrogen Derivatives: Export Countries; HYPAT Working Paper 02/2022; Fraunhofer-Publica: Karlsruhe, Germany, 2022. [Google Scholar]
- Quitzow, R.; Mewes, C.; Thielges, S.; Tsoumpa, M.; Zabanova, Y. Building Partnerships for an International Hydrogen Economy: Entry-Points for European Policy Action; Friedrich-Ebert-Stiftung: Berlin, Germany, 2023; ISBN 978-3-98628-224-0. [Google Scholar]
- Brauer, J.; Truby, J.; Villavicencio, M. Establishing low-carbon hydrogen trade relations—Where to go and who to partner with? In Proceedings of the 2022 18th International Conference on the European Energy Market (EEM), Ljubljana, Slovenia, 13–15 September 2022; IEEE: New York, NY, USA, 2022; pp. 1–6, ISBN 978-1-6654-0896-7. [Google Scholar]
- Dejonghe, M. Risky Business? Evaluating Hydrogen Partnerships Established by Germany, The Netherlands, and Belgium. Sustainability 2023, 15, 16876. [Google Scholar] [CrossRef]
- Ozturk, M.; Dincer, I. An integrated system for ammonia production from renewable hydrogen: A case study. Int. J. Hydrogen Energy 2021, 46, 5918–5925. [Google Scholar] [CrossRef]
- Odenweller, A.; Ueckerdt, F.; Nemet, G.F.; Jensterle, M.; Luderer, G. Probabilistic feasibility space of scaling up green hydrogen supply. Nat. Energy 2022, 7, 854–865. [Google Scholar] [CrossRef]
- Hampp, J.; Düren, M.; Brown, T. Import options for chemical energy carriers from renewable sources to Germany. PLoS ONE 2023, 18, e0262340. [Google Scholar] [CrossRef] [PubMed]
- Staiß, F.; Adolf, J.; Ausfelder, F.; Erdmann, C.; Fischedick, M.; Hebling, C.; Jordan, T.; Klepper, G.; Müller, T.; Palkovits, R.; et al. Optionen für den Import Grünen Wasserstoffs Nach Deutschland bis zum Jahr 2030: Transportwege—Länderbewertungen—Realisierungserfordernisse; Acatech—Deutsche Akademie der Technikwissenschaften; Deutsche Akademie der Naturforscher Leopoldina e.V.—Nationale Akademie der Wissenschaften; Union der deutschen Akademien der Wissenschaften e.V: München/Halle (Saale)/Mainz, Germany, 2022; ISBN 9783982005348. [Google Scholar]
- Gerboni, R. Introduction to hydrogen transportation. Compendium of Hydrogen Energy; Elsevier: Amsterdam, The Netherlands, 2016; pp. 283–299. ISBN 9781782423621. [Google Scholar]
- Dertinger, A.; Schimmel, M.; Jörling, K.; Bietenholz, D.; Schult, H.; Steinbacher, K.; Kerres, P. Covering Germany’s Green Hydrogen Demand: Transport Options for Enabling Imports; Guidehouse Germany GmbH: Berlin, Germany, 2022; Available online: https://guidehouse.com/-/media/www/site/insights/energy/2022/transport-options-for-covering-germanys-green-hydrogen-demand.pdf (accessed on 15 September 2023).
- Galimova, T.; Fasihi, M.; Bogdanov, D.; Breyer, C. Impact of international transportation chains on cost of green e-hydrogen: Global cost of hydrogen and consequences for Germany and Finland. Appl. Energy 2023, 347, 121369. [Google Scholar] [CrossRef]
- Dejonghe, M.; van de Graaf, T.; Belmans, R. From natural gas to hydrogen: Navigating import risks and dependencies in Northwest Europe. Energy Res. Soc. Sci. 2023, 106, 103301. [Google Scholar] [CrossRef]
- Scita, R.; Raimondi, P.P.; Noussan, M. Green Hydrogen: The Holy Grail of Decarbonisation? An Analysis of the Technical and Geopolitical Implications of the Future Hydrogen Economy; FEEM Working Paper 13/2020; Fondazione Eni Enrico Mattei: Milan, Italy, 2020. [Google Scholar] [CrossRef]
- Lindner, R. Green hydrogen partnerships with the Global South. Advancing an energy justice perspective on “tomorrow’s oil”. Sustain. Dev. 2022, 31, 1038–1053. [Google Scholar] [CrossRef]
- Torvik, R. Natural resources, rent seeking and welfare. J. Dev. Econ. 2002, 67, 455–470. [Google Scholar] [CrossRef]
- Falkner, R. The Paris Agreement and the new logic of international climate politics. Int. Aff. 2016, 92, 1107–1125. [Google Scholar] [CrossRef]
- Huenteler, J.; Schmidt, T.S.; Ossenbrink, J.; Hoffmann, V.H. Technology life-cycles in the energy sector—Technological characteristics and the role of deployment for innovation. Technol. Forecast. Soc. Chang. 2016, 104, 102–121. [Google Scholar] [CrossRef]
- Lewis, J.I. The Rise of Renewable Energy Protectionism: Emerging Trade Conflicts and Implications for Low Carbon Development. Glob. Environ. Politics 2014, 14, 10–35. [Google Scholar] [CrossRef]
- Jakob, M.; Chen, C.; Fuss, S.; Marxen, A.; Edenhofer, O. Development incentives for fossil fuel subsidy reform. Nat. Clim. Chang. 2015, 5, 709–712. [Google Scholar] [CrossRef]
- Wüstenhagen, R.; Menichetti, E. Strategic choices for renewable energy investment: Conceptual framework and opportunities for further research. Energy Policy 2012, 40, 1–10. [Google Scholar] [CrossRef]
- Keeley, A.R.; Ikeda, Y. Determinants of foreign direct investment in wind energy in developing countries. J. Clean. Prod. 2017, 161, 1451–1458. [Google Scholar] [CrossRef]
- McCulloch, N. Why Tackling Energy Governance in Developing Countries Needs a Different Approach; Chemonics: Washington, DC, USA, 2021; Available online: https://chemonics.com/wp-content/uploads/2021/06/Energy-Governance-White-Paper-6.10.21.pdf (accessed on 12 September 2023).
- Ramos-Mejía, M.; Franco-Garcia, M.-L.; Jauregui-Becker, J.M. Sustainability transitions in the developing world: Challenges of socio-technical transformations unfolding in contexts of poverty. Environ. Sci. Policy 2018, 84, 217–223. [Google Scholar] [CrossRef]
- Hoekman, B.M.; Smarzynska Javorcik, B. Global Integration and Technology Transfer; The World Bank: Washington, DC, USA, 2006; ISBN 978-0-8213-6125-2. [Google Scholar]
- Klessmann, C.; Held, A.; Rathmann, M.; Ragwitz, M. Status and perspectives of renewable energy policy and deployment in the European Union—What is needed to reach the 2020 targets? Energy Policy 2011, 39, 7637–7657. [Google Scholar] [CrossRef]
- Zhang, Z.; Cheng, S.; Wang, C.; Song, S.; Feng, Y. Climate policy uncertainty and corporate investment efficiency: Evidence from China. J. Environ. Plan. Manag. 2023, 1–21. [Google Scholar] [CrossRef]
- Zhang, F.; Gallagher, K.S. Innovation and technology transfer through global value chains: Evidence from China’s PV industry. Energy Policy 2016, 94, 191–203. [Google Scholar] [CrossRef]
- Popp, D. The Role of Technological Change in Green Growth; The World Bank: Washington, DC, USA, 2012. [Google Scholar]
- Hovi, J.; Sprinz, D.F.; Sælen, H.; Underdal, A. Climate change mitigation: A role for climate clubs? Palgrave Commun. 2016, 2, 16020. [Google Scholar] [CrossRef]
- Plank, F.; Daum, B.; Muntschick, J.; Knodt, M.; Hasse, C.; Ott, I.; Niemann, A. Hydrogen: Fueling EU-Morocco Energy Cooperation? Middle East Policy 2023, 30, 37–52. [Google Scholar] [CrossRef]
- Nunez, A.; Quitzow, R. Germany’s Hydrogen Strategy: Securing Industrial Leadership in a Carbon-Neutral Economy; RIFS Discussion Paper April 2023; Research Institute for Sustainability (RIFS): Potsdam, Germany, 2023. [Google Scholar]
- Belova, A.; Quittkat, C.; Lehotský, L.; Knodt, M.; Osička, J.; Kemmerzell, J. The more the merrier? Actors and ideas in the evolution of German hydrogen policy discourse. Energy Res. Soc. Sci. 2023, 97, 102965. [Google Scholar] [CrossRef]
- Lee, C.W.; Zhong, J. Top down strategy for renewable energy investment: Conceptual framework and implementation. Renew. Energy 2014, 68, 761–773. [Google Scholar] [CrossRef]
- Gatzert, N.; Vogl, N. Evaluating investments in renewable energy under policy risks. Energy Policy 2016, 95, 238–252. [Google Scholar] [CrossRef]
- Ansari, D.; Pepe, J.M. Toward a Hydrogen Import Strategy for Germany and the EU: Priorities, Countries, and Multilateral Frameworks; Working Paper No. 1; Stiftung Wissenschaft und Politik: Berlin, Germany, 2023; Available online: https://policycommons.net/artifacts/4064383/toward-a-hydrogen-import-strategy-for-germany-and-the-eu/4871691/ (accessed on 15 February 2024).
- Zhang, Z.; Zhang, Y.; Zhao, M.; Muttarak, R.; Feng, Y. What is the global causality among renewable energy consumption, financial development, and public health? New perspective of mineral energy substitution. Resour. Policy 2023, 85, 104036. [Google Scholar] [CrossRef]
- Webber, M.E. The water intensity of the transitional hydrogen economy. Environ. Res. Lett. 2007, 2, 34007. [Google Scholar] [CrossRef]
- Welle, T.; Birkmann, J. The World Risk Index—An Approach to Assess Risk and Vulnerability on a Global Scale. J. Extr. Even. 2015, 2, 1550003. [Google Scholar] [CrossRef]
- Jiang, W.; Martek, I. Political risk analysis of foreign direct investment into the energy sector of developing countries. J. Clean. Prod. 2021, 302, 127023. [Google Scholar] [CrossRef]
- World Bank. Enabling Foreign Direct Investment in the Renewable Energy Sector: Reducing Regulatory Risks and Preventing Investor-State Conflicts; World Bank: New York, NY, USA, 2023. [Google Scholar]
- Child, D. The Essentials of Factor Analysis, 3rd ed.; Continuum: New York, NY, USA, 2006; ISBN 13: 978-0826480002. [Google Scholar]
- Botta, E.; Kozluk, T. Measuring Environmental Policy Stringency in OECD Countries—A Composite Index Approach; OECD Environmental Directorate Working Paper; OECD: Paris, France, 2014; Available online: https://econpapers.repec.org/paper/oececoaaa/1177-en.htm (accessed on 12 September 2023).
- Greco, S.; Ishizaka, A.; Tasiou, M.; Torrisi, G. On the Methodological Framework of Composite Indices: A Review of the Issues of Weighting, Aggregation, and Robustness. Soc. Indic. Res. 2019, 141, 61–94. [Google Scholar] [CrossRef]
- OECD. Handbook on Constructing Composite Indicators: Methodology and User Guide; OECD: Paris, France, 2008; ISBN 9789264043459. [Google Scholar]
- Nicoletti, G.; Scarpetta, S.; Boylaud, O. Summary Indicators of Product Market Regulation with an Extension to Employment Protection Legislation; Economics Department Working Papers No. 226, ECO/WKP(99)18; OECD: Paris, France, 2000. [Google Scholar]
- Dziuban, C.D.; Shirkey, E.C. When is a correlation matrix appropriate for factor analysis? Some decision rules. Psychol. Bull. 1974, 81, 358–361. [Google Scholar] [CrossRef]
- Watkins, M.W. A Step-By-Step Guide to Exploratory Factor Analysis with Stata; Routledge: New York, NY, USA, 2021; ISBN 9781003149286. [Google Scholar]
- Cronbach, L.J. Coefficient alpha and the internal structure of tests. Psychometrika 1951, 16, 297–334. [Google Scholar] [CrossRef]
- Kaiser, H.F.; Rice, J. Little Jiffy, Mark Iv. Educ. Psychol. Meas. 1974, 34, 111–117. [Google Scholar] [CrossRef]
- Cattell, R.B. The Scree Test For The Number Of Factors. Multivar. Behav. Res. 1966, 1, 245–276. [Google Scholar] [CrossRef]
- Hopkins, M. Human development revisited: A new UNDP report. World Dev. 1991, 19, 1469–1473. [Google Scholar] [CrossRef]
- Stamm, A.; Altenburg, T.; Strohmaier, R.; Oyan, E.; Thoms, K. Green Hydrogen: Implications for International Cooperation: With Special Reference to South Africa; IDOS Discussion Paper; IDOS: Bonn, Germany, 2023. [Google Scholar]
- Weko, S.; Farrand, A.; Fakoussa, D.; Quitzow, R. The Politics of Green Hydrogen Cooperation: Emerging Dynamics in Morocco, Algeria and Mauritania; Research Institute for Sustainability (RIFS): Potsdam, Germany, 2023. [Google Scholar]
- Wang, J.-J.; Jing, Y.-Y.; Zhang, C.-F. Weighting methodologies in multi-criteria evaluations of combined heat and power systems. Int. J. Energy Res. 2009, 33, 1023–1039. [Google Scholar] [CrossRef]
- Khosla, R.; Dukkipati, S.; Dubash, N.K.; Sreenivas, A.; Cohen, B. Towards Methodologies for Multiple Objective-Based Energy and Climate Policy. Econ. Political Wkly. 2015, 50, 49–59. [Google Scholar]
- Schmitt, T.M. (Why) did Desertec fail? An interim analysis of a large-scale renewable energy infrastructure project from a Social Studies of Technology perspective. Local Environ. 2018, 23, 747–776. [Google Scholar] [CrossRef]
- Hamouchene, H. Desertec: What Went Wrong? EcoMENA, 23 July 2020. Available online: https://www.ecomena.org/desertec/ (accessed on 28 March 2023).
- Nagashima, M. Japan’s Hydrogen Strategy and Its Economic and Geopolitical Implications; IFRI: Paris, France, 2018; Available online: https://www.ifri.org/sites/default/files/atoms/files/nagashima_japan_hydrogen_2018_.pdf (accessed on 11 April 2023).
Figure 1.
The research process.

Figure 2.
Dimensions and composite criteria for evaluating RE trading partners.

Figure 3.
Comparison of RE trading partners across four dimension dashboards.

Table 1.
Indicators and data.
| Dimension | Indicator | Description | Measurement Unit | Time | Source |
|---|---|---|---|---|---|
| Economy and Technology | RE production costs * | Cost of solar electricity production | $ per kWh | 2023 | WB-SG |
| RE transportation costs * | Shortest maritime distance to Bremerhaven (Germany) | km | 2023 | WPI | |
| Trade and transportation infrastructure | Logistics Performance Index (LPI): Quality of trade and transportation-related infrastructure | Index (1–5) | 2010–2020 | WB-LPI | |
| Financial stability * | Inflation rate | % | 2000–2019 | WDI | |
| Environment and Development | RE generation potential | Linear extrapolation of the installed renewable electricity generation capacity for 2030, excl. hydroelectricity (share of overall generation capacity) | % | 2030 (extrapolation) | IEA |
| Electricity from fossil fuels * | Share of electricity generated from fossil fuels | % | 2010–2020 | EIA | |
| CO2 emissions * | CO2 emissions from electricity and heat production as a share of total fuel combustion | % | 2010–2020 | WDI | |
| Access to electricity | Share of the population with access to electricity | % | 2010–2020 | WDI | |
| Access to clean cooking | Share of the population with access to clean fuels and technologies for cooking | % | 2010–2020 | WDI | |
| Water use restrictions * | Water Stress Index: freshwater withdrawal as a share of available freshwater resources | % | 2010–2020 | WDI | |
| Disaster risks * | Share of the population exposed to natural hazards | % | 2010–2020 | WRI | |
| Regulation and Governance | Open markets | Trade, investment, and financial freedom | Index (1–100) | 2010–2020 | HF |
| Business regulation | Business, labor, and monetary freedom | Index (1–100) | 2010–2020 | HF | |
| Quality of governance | Unweighted average of all Worldwide Governance Indicators (perceived quality of governance) | Index (−2.5–2.5) | 2010–2020 | WGI | |
| Environmental impact assessment | Presence of environmental impact assessment legislation | 0/1 | 2000–2021 | Legal-Atlas | |
| Incentives and regulatory support for RE | Financial and regulatory support for RE deployment, grid access, RE transport, heating and cooling | Index (1–100) | RISE | ||
| Legal framework for RE | Legal framework outlining the private ownership, RE targets and strategies linked to nationally determined contributions (NDCs) | Index (1–100) | RISE | ||
| Innovation and Cooperation | Energy cooperation with Germany | Existence if an energy partnership with Germany | 0/1 | 2023 | IRENA |
| Energy cooperation with the EU | Existence of an energy partnership with the EU | 0/1 | 2023 | EUR-Lex | |
| Hydrogen innovation level | Number of hydrogen-related projects in operation (hydrogen-related technological development) | # projects | 2023 | IEA | |
| RE innovation level | Number of RE patent and trademarks normalized over GDP Technological innovations in RE, number | # patents/GDP | 2000–2017 | PATSTAT | |
| Innovation capacity | Innovation potential | Index (1–6) | 2010–2019 | WEF | |
| Human capital | Human capital index (average years of schooling and returns to education) | Index | 2010–2019 | PWT |
Notes: WB-SG: World Bank Solargis database; WB-LPI: World Bank Logistics Performance Index; WPI: World Port Index; WDI: World Development Indicators; WGI: Worldwide Governance Indicators; HF: Heritage Foundation; RISE: Regulatory Indicators for Sustainable Energy; IRENA: International Renewable Energy Agency; IEA: International Environmental Agency; EIA: U.S. Energy Information Administration; WRI: World Risk Index; PWT: Penn World Tables; PATSTAT: European Patent Office; WEF: World Economic Forum; EUR-Lex: EU law database (e.g., treaties, regulations, MoUs, agreements). * Values are inverted for ease of interpretation; thus, higher values represent a better performance, i.e., suitability as an RE trading partner.
Table 2.
A summary of the variables’ statistics.
| Variable | N | Mean | SD | Min | Max |
|---|---|---|---|---|---|
| Economy and Technology | |||||
| RE production costs | 112 | 0.103 | 0.022 | 0.067 | 0.232 |
| Transportation costs | 112 | 10,086.640 | 5812.197 | 610.302 | 24,708.580 |
| Infrastructure quality | 112 | 2.798 | 0.670 | 1.595 | 4.226 |
| Inflation rate | 112 | 6.153 | 5.515 | −0.324 | 26.128 |
| Environment and Development | |||||
| Share of fossil fuels | 112 | 64.706 | 31.064 | 0 | 99.987 |
| CO2 emissions | 112 | 35.686 | 20.235 | 0 | 76.383 |
| Water stress | 112 | 87.132 | 373.258 | 0.027 | 3399.281 |
| Exposure to natural hazards | 112 | 15.840 | 11.052 | 3.941 | 96.534 |
| RE generation capacity | 112 | 26.018 | 26.851 | 0 | 118.382 |
| Access to electricity | 112 | 83.157 | 24.888 | 15.286 | 100 |
| Access to clean cooking | 112 | 68.289 | 36.983 | 0.391 | 100 |
| Regulation and Governance | |||||
| Quality of governance | 112 | −0.087 | 0.943 | −2.173 | 1.817 |
| Open markets | 112 | 61.133 | 16.018 | 0 | 85.999 |
| Business regulation | 112 | 65.638 | 11.764 | 2.222 | 89.459 |
| Incentives/regulatory support for RE | 112 | 51.895 | 27.439 | 0 | 100 |
| Legal framework for RE | 112 | 81.390 | 19.331 | 20 | 100 |
| Environmental impact assessment | 112 | 0.779 | 0.417 | 0 | 1 |
| Innovation and Cooperation | |||||
| RE innovation activity | 112 | 125.847 | 132.570 | 5.818 | 460.410 |
| Human capital | 112 | 2.468 | 0.575 | 1.560 | 3.653 |
| Innovation capacity | 112 | 3.364 | 0.649 | 2.640 | 5.174 |
| Hydrogen innovation | 112 | 2.071 | 5.125 | 0 | 26 |
| Energy partnership with GER | 112 | 0.142 | 0.350 | 0 | 1 |
| Energy partnership with EU | 112 | 0.103 | 0.022 | 0.067 | 0.232 |
Table 3.
EFA results for the economy and technology dimension.
| Variable | Costs | Stability | Uniqueness |
|---|---|---|---|
| RE production costs | 0.914 | 0.040 | 0.164 |
| Transportation costs | 0.595 | 0.433 | 0.458 |
| Infrastructure quality | 0.060 | 0.879 | 0.225 |
| Inflation rate | 0.148 | 0.848 | 0.258 |
| Bartlett test (Chi2) | 69.42 | ||
| Bartlett test (Prob > Chi2) | 0.000 | ||
| Cronbach’s α | 0.65 | ||
| KMO | 0.65 | ||
| Rho | 0.72 |
Table 4.
EFA results for the environment and development dimension.
| Variable | Development | Decarbonization | Risks | Uniqueness |
|---|---|---|---|---|
| Access to electricity | 0.947 | −0.023 | −0.036 | 0.101 |
| Access to clean cooking | 0.914 | −0.034 | −0.144 | 0.142 |
| RE generation capacity | 0.442 | 0.416 | −0.260 | 0.565 |
| Share of fossil fuels | −0.031 | 0.877 | −0.006 | 0.230 |
| CO2 emissions | −0.015 | 0.775 | 0.156 | 0.375 |
| Water stress | −0.288 | 0.165 | 0.788 | 0.269 |
| Exposure to natural hazards | 0.417 | −0.464 | 0.518 | 0.345 |
| Bartlett test (Chi2) | 265.66 | |||
| Bartlett test (Prob > Chi2) | 0.000 | |||
| Cronbach’s α | 0.60 | |||
| KMO | 0.57 | |||
| Rho | 0.71 |
Table 5.
EFA results for the regulation and governance dimension.
| Variable | Governance Quality | RE Regulation | Uniqueness |
|---|---|---|---|
| Quality of governance | 0.845 | 0.335 | 0.173 |
| Open Markets | 0.908 | 0.196 | 0.138 |
| Business regulation | 0.937 | 0.043 | 0.120 |
| Incentives/regulatory support for RE | 0.391 | 0.684 | 0.380 |
| Legal Framework for RE | 0.191 | 0.786 | 0.345 |
| Environmental impact assessment | 0.069 | 0.618 | 0.614 |
| Bartlett test (Chi2) | 320.13 | ||
| Bartlett test (Prob > Chi2) | 0.000 | ||
| Cronbach’s α | 0.81 | ||
| KMO | 0.74 | ||
| Rho | 0.71 |
Table 6.
EFA results for the innovation and cooperation dimension.
| Variable | Innovation Potential | International Cooperation | Uniqueness |
|---|---|---|---|
| RE innovation activity | 0.932 | −0.049 | 0.129 |
| Human capital | 0.940 | −0.041 | 0.114 |
| Innovation capacity | 0.724 | 0.234 | 0.421 |
| Hydrogen innovation | 0.870 | −0.071 | 0.238 |
| Energy partnership with GER | −0.511 | 0.587 | 0.395 |
| Energy cooperation with EU | 0.082 | 0.885 | 0.211 |
| Bartlett test (Chi2) | 382.23 | ||
| Bartlett test (Prob > Chi2) | 0.000 | ||
| Cronbach’s α | 0.78 | ||
| KMO | 0.80 | ||
| Rho | 0.75 |
Disclaimer/Publisher’s Note: The statements, opinions and data contained in all publications are solely those of the individual author(s) and contributor(s) and not of MDPI and/or the editor(s). MDPI and/or the editor(s) disclaim responsibility for any injury to people or property resulting from any ideas, methods, instructions or products referred to in the content. |
© 2024 by the authors. Licensee MDPI, Basel, Switzerland. This article is an open access article distributed under the terms and conditions of the Creative Commons Attribution (CC BY) license (https://creativecommons.org/licenses/by/4.0/).
Share and Cite
MDPI and ACS Style
Schulze, K.; Mišić, M.; Radojičić, N.; Serin, B. Evaluating Partners for Renewable Energy Trading: A Multidimensional Framework and Tool. Sustainability 2024, 16, 3632. https://0-doi-org.brum.beds.ac.uk/10.3390/su16093632
AMA Style
Schulze K, Mišić M, Radojičić N, Serin B. Evaluating Partners for Renewable Energy Trading: A Multidimensional Framework and Tool. Sustainability. 2024; 16(9):3632. https://0-doi-org.brum.beds.ac.uk/10.3390/su16093632
Chicago/Turabian StyleSchulze, Kai, Mile Mišić, Nikola Radojičić, and Berkin Serin. 2024. "Evaluating Partners for Renewable Energy Trading: A Multidimensional Framework and Tool" Sustainability 16, no. 9: 3632. https://0-doi-org.brum.beds.ac.uk/10.3390/su16093632
Note that from the first issue of 2016, this journal uses article numbers instead of page numbers. See further details here.