Study of the Demand for Ecological Means of Transport in Micromobility: A Case of Bikesharing in Szczecin, Poland


1
Faculty of Economics and Transport Engineering, Maritime University of Szczecin, 70-507 Szczecin, Poland
2
Institute of Mathematics, Physics and Chemistry, Maritime University of Szczecin, 70-500 Szczecin, Poland
*
Author to whom correspondence should be addressed.
Sustainability 2024, 16(9), 3620; https://0-doi-org.brum.beds.ac.uk/10.3390/su16093620
Submission received: 4 March 2024
/
Revised: 13 April 2024
/
Accepted: 19 April 2024
/
Published: 26 April 2024
Abstract
:The need for urban societies to move continues to grow with the intensity of their various activities. One of the challenges in micromobility in cities based on bike, scooter, or public scooter systems is determining the potential yet realistic demand for such services. This article aims to present the level of demand for eco-friendly non-motorized transport systems and identify the motivations driving users of public transport to choose these eco-friendly Personal Mobility Devices (PMD). The authors propose a methodology based on the integration of four components: a case study, an analysis of participatory budget projects, a metadata analysis of bikesharing (BSS) in Szczecin, and a meta plan. They utilized a case study method and conducted a survey based on a custom questionnaire. An analysis of participatory budget projects and data from the operation of bikesharing in Szczecin was performed using statistical methods. Applying the heuristic tool meta plan, they outlined the directions for the development and support of bikesharing as an example of micromobility in Szczecin. The research identified connections between the socio-demographic structure of respondents and attributes of bike communication. This study highlighted periods of intensive system use and locations with the highest exploitation. It showed that the demand for BSS depends on weather conditions, traveler convenience, the density and coherence of bike infrastructure with important locations for residents, transfer connections, and safety. The presented research results can assist planners and authorities in Szczecin and other cities in expanding bikesharing.
1. Introduction
Shared micro-mobility is not just a trend but also an alternative to an effective means of urban transportation. Observations confirm that urban public transport undergoes continuous transformations, and these changes are not always beneficial for city residents, often stemming from alterations in road infrastructure, spatial planning, and ongoing repairs. Such phenomena discourage city dwellers from using public transport, as evidenced by the increasing number of cars, with the highest car ownership rate in Europe reported in 2023—687 cars per 1000 inhabitants, according to the European Statistical Office Eurostat [1]. Carsharing is also gaining popularity, with the number of car rental companies continually increasing [2,3,4]. However, both forms of urban travel have a negative impact on the environment, contribute to congestion, and shape the quality of life in cities. Non-motorized forms of transportation, such as bikesharing, scooters, and electric scooters, present an alternative way of moving around the city. This form of transport is known as micromobility, utilizing small, light, and emission-free Personal Mobility Devices (PMDs) [5]. These devices enable residents to cover short distances, typically the first or last segment of a planned journey, including individuals with disabilities who use these devices to improve their mobility [6,7]. Micro-mobility is defined differently in various literature, often as the shared use of bicycles, scooters, motorcycles, and other low-speed transportation modes according to needs [8,9,10]. The National League of Cities (NLC) identifies micro-mobility as the mass sharing of bicycles and scooters in urban areas. However, the U.S. Department of Transportation refers to this form of transport as microtransit [11].
The evolving micromobility becomes an increasingly important part of urban residents’ mobility each year, and studying user needs is crucial for its development direction. In Polish cities, this can be based on gathering information about projects from the Participatory Budget (PB). Such projects have been implemented since 2011 in small cities—with populations ranging from 5000 to 20,000 inhabitants medium-sized cities with populations in two ranges: 20,000–50,000 and 50,000–100,000, as well as large cities with populations of 100,000–200,000 and above 200,000 [12,13,14]. The specificity of the issue requires the application of appropriate tools, methods, and methodologies that would outline social needs significantly, including in this area. Updating information related to the needs of Personal Mobility Devices is also an indicator of the development direction and policies pursued by city authorities. The aim of the article is to determine the scale of needs for the functioning of a bikesharing system (BSS) as an element of micromobility in a medium-sized city in Poland.
For the purpose of achieving the goal, the following tasks have been defined:
- Identification of the level of interest in the bike rental system in Poland;
- Evaluation of the socio-demographic structure in the context of using bicycles as a means of transport;
- Quantitative analysis of urban bike rental in terms of time and urban space;
- Assessment of social involvement in the expansion of cycling infrastructure in Szczecin;
- Determination of the current situation of bikesharing in Szczecin, its weaknesses, and directions for development.
The article has the following structure: In Section 2, a literature review and several key points regarding the demand for ecological micromobility among city residents are presented. In Section 3, research methodology related to the studied area, in this case, the city of Szczecin, and the proposed approach to the analyzed problem of ecological micro-mobility, especially bikesharing, are presented. In Section 4, the results of the implementation of the proposed approach to determine the level of residents’ needs in Szczecin regarding shared micromobility are presented. This is based on the analysis of applications submitted to the Participatory Budget and a survey conducted using an author’s questionnaire. Surveys were conducted from 2019 to 2021. The research also included metadata from the city’s bikesharing system. Section 5 is dedicated to discussing the results. The final conclusions are included in Section 6. The research results have many implications for business practice. This relates to managing the city’s transportation system, energy savings, and decarbonization policy. This also includes the creation of new business models that respond to the challenges of contemporary society and are in line with the principles of sustainable development.
The conducted research has allowed us to conclude that the analyzed problem is not homogeneous. Despite the significant interest of researchers, this issue has not been considered so far using the proposed configuration of methods and data. The proposed methodology allows for obtaining data from multiple sources and a more reliable assessment of them. There is, therefore, a research gap to be filled. It can be stated that the added value of the article lies in its multi-aspect approach to the problem of demand for ecological means of transportation in the city, using bikesharing as an example.
2. Literature Review
The 21st century is characterized not only by the progress of digitization and technology but also by the growing need for mobility over various distances. Residents of small, medium, and large cities travel for daily chores, healthcare appointments, and recreational purposes. Means of transportation include cars, buses, trams, and sometimes trolleybuses or subways. There are also alternative options, such as non-motorized and shared transportation, that supporting micromobility. These include bicycles, scooters, and electric scooters [15]. While users may have their means of transportation, city authorities, guided by the concept of sustainable development, increasingly provide rental systems for residents, including bicycles, scooters, and electric scooters.
Research on residents’ mobility and micro-mobility needs employs various methods and methodologies [16]. Blad and others proposed a methodology based on multi-criteria analysis (MCA) and multi-actor multi-criteria, consisting of five criteria measuring location suitability—potential demand in a given location, hub implementation costs (regional shared mobility center), generalized travel costs to and from the center, connection to the environment, and social impact measured by nine attributes [17]. Other researchers emphasize that location modeling techniques can be grouped into three categories: “mathematical algorithms”, “multi-criteria decision-making”, and “GIS” [18].
2.1. Shared Mobility and Micromobility
Shared mobility is a category of transportation that has gained a new dimension in recent years, not only in Poland but as a global phenomenon of sharing various goods and services. It falls between public transport and individual transport [19]. Shared mobility is most commonly discussed in the context of urban travel using specially designated shared vehicles, ranging from bicycles, electric scooters, and scooters to cars, accessible to the general public [20,21,22]. Shared mobility services have a long history; for example, the first known shared bicycle system was established in 1965 in Amsterdam [23], and the first shared car system emerged much earlier, in 1948 in Zurich [24,25]. While public bikesharing systems have existed for almost half a century, their rapid growth in both prevalence and popularity worldwide occurred in the last decade [26,27]. Bikesharing programs serve to showcase and promote environmentally friendly aspects of mobility in cities and can contribute to achieving specific goals related to mobility, health, and reducing dependence on fossil fuels [28,29].
2.2. Bikesharing System
Bikesharing is a form of urban transportation that offers temporary rental, with a deposit and a specified fee, for various bicycle types such as single bikes, tandem bikes, rickshaws, rollerblades, and scooters. The system provides an efficient way to shift part of the city’s traffic from cars to bicycles. Shared mobility services can be a source of savings, reducing daily transportation costs, providing convenience, and limiting vehicle ownership [30,31]. A properly functioning BSS consists of several elements. The system includes owners, users, regulations, rental services, operations, system infrastructure, and support. The first group comprises local government institutions and networks of public operators, such as Clearchannel (SmartBike). In Paris, the city owns the Vefib system, but JCDecaux covers the costs of purchasing and maintaining bicycles in exchange for advertising rights. In Warsaw, the Veturilo system is owned by the Nextbike GZM company, while the Call-a-Bike system in Germany operates thanks to Deutsche Bahn [32]. The second group, users, mainly consists of city residents commuting to work and school daily. This also includes tourists who, by visiting cities like Szczecin, gain access to an affordable and independent means of transportation. Students and individuals using bikes for commuting to Park and Ride (P&R) facilities and important public transport hubs, such as train stations, bus stops, tram stops, or metro stations, are also significant user groups. The legal aspect, part of the BSS, involves key legal acts applicable in Poland concerning bicycle traffic and infrastructure, such as the Vienna Convention on Road Traffic of 1968 [33] and the Road Traffic Act of 20 June 1997 [34]. Rental services, both commercial and public, form another critical element of the BSS. Commercial services operate based on straightforward principles, with a customer service office often serving as a bicycle warehouse and repair point. In the case of public rentals, they consist of customer service offices, bicycle parking areas with racks and bicycles, stations with docking points, bike vending machines, specialized services, and a website. Crucial for the BSS is its infrastructure, designed to facilitate bike traffic and enhance cyclist safety. For the system to function smoothly, its infrastructure should meet five requirements: coherence, directness, attractiveness, convenience, and safety. Another system element is organization, which encompasses all activities from conceptualization and design to implementation. The last component is supported, provided by programs such as CIVITAS II, which gave rise to the CARAVEL project, focusing on “Traveling toward new mobility” and aiming to increase the efficiency of public transport with environmental considerations [35].
The justification for creating such systems seems evident and stems from several fundamental premises highlighted by researchers in this field, summarizing the benefits of bike usage, such as flexible mobility, emission reduction, physical activity benefits, alleviating traffic congestion and fuel consumption, individual financial savings, and support for multimodal transport connections for various purposes [36].
The demand for bike rentals is a multi-faceted research area covering different factors influencing usage patterns and operational strategies. Hua presents empirical research results on the operation of bike rentals during the COVID-19 pandemic, shedding light on the impact of external events on demand [37]. Additionally, Guo identifies the connection between public bike usage and the built environment, emphasizing the significance of infrastructure and urban design on demand variability [38]. Shen contributes to understanding bike rentals as a sustainable transport option, highlighting bikesharing’s potential to reduce car usage [39].
Studies conducted by researchers [40] focus on optimization models and predicting demand for BSS, addressing the need for efficient supply and spatial regression models to meet demand effectively. Lin emphasizes the importance of understanding the spatiotemporal distribution of demand to increase the operational efficiency of the BSS [41]. Others [42] compare the effectiveness of various repositioning strategies based on predicted demand patterns, contributing to the development of effective operational strategies. Additionally, Lainjo and Yu tackle challenges related to demand forecasting and allocation strategies, offering valuable insights into improving the planning and allocation of shared bike systems [43]. Zhou underlines the importance of factors influencing bike rental demand, including weather, air quality, spatial location, and historical travel data [44].
Recognizing the need for comprehensive demand and supply management strategies [45], the impact of pricing and coordination strategies on the supply chain of city bikes has also been investigated [46], based on multiple linear regression models, and [47] delves into the influence of the built environment, spatial interactions, and social factors on the use of city bikes, providing a holistic understanding of the determinants of station-based bike demand.
In summary, demand for bike rentals is influenced by numerous factors, including external events, the built environment, optimization models, weather, and pricing strategies. Understanding these factors is crucial for developing effective operational and planning strategies to meet the demand for bikesharing systems.
Continuing with the review of studies on bikesharing demand in cities, the authors did not come across a multidimensional comparison of demand based on survey research among residents, metadata from the rental system, and reports of PB projects. They believe that this article can be a valuable addition to their knowledge in this area.
2.3. Bikesharing in Poland
Cycling in Polish cities, much like worldwide, aims to reduce car traffic, traffic jams, and improve transport accessibility, aligning with the promotion of low-emission transport initiatives [48]. It is the most energy-efficient mode of transportation. Through bikesharing, it becomes widely accessible, cost-effective, and requires minimal space. The primary energy consumption (MJ) per passenger-kilometer for a bicycle is 0.06, compared to 0.16 MJ/pkm for pedestrian traffic. In comparison to trams (0.52 MJ/pkm) and, of course, personal cars (2.45 MJ/pkm), bicycles are notably more energy-efficient [49].
The popularity of public bike systems in Polish cities is growing steadily, drawing attention from researchers and becoming the subject of various inquiries. Bicycles are increasingly incorporated into government strategies and feature in various local government documents such as transportation plans, e.g., the Sustainable Public Transport Development Plan (PZRPTZ), city budgets, local spatial development plans (MPZP), and sustainable urban mobility plans (SUMP). In the case of the SUMP for Poznań, there is advocacy for bicycles to become the second most popular mode of transport [50]. Similarly, in the Mobility Plan of the Lublin Functional Area for the years 2017–2025, priority is emphasized on the widespread use of bicycles in urban transport [51].
In 2021, the operation of public bicycles was declared in 86 cities in Poland. In the case of 70 cities, the initiative was financially supported by the municipality, while in 17 cities, it was funded from another source. The situation changed quite dynamically, as in 2022, commercial operators providing bicycles appeared in four major cities [52]. A comparison of public bicycle systems managed by municipalities according to provinces in 2022 is presented in Figure 1. It is evident how significantly Mazovian Voivodeship deviates from the others, reaching a level of over 6000 bicycles.
The number of bicycles available in selected cities across Poland is presented in Figure 2.
In terms of the number of bicycles, the order is noticeable: Warsaw—4951 units, Wrocław—2265 units, Poznań—1829 units. Szczecin ranks 6th with 830 bicycles. Similarly, the number of rentals for public bicycles is depicted in Figure 3.
A comparison of the number of bicycle paths is presented in Figure 4.
In most cities, there is a systematic regression in the expansion of bicycle paths. As in previous comparisons, Warsaw has the most extensive network of roads. The least number of bicycle paths is observed in Katowice. This may result from the reclassification of roads into other forms of urban or bicycle infrastructure, such as traffic-calmed zones.
Summarizing the above comparisons and the pace of development of non-motorized shared transportation, specifically city bike systems, in selected Polish cities, it should be noted that the potential for sustainable mobility is not fully recognized by legislators and city authorities. There is still a lack of monitoring and demand management for city bikes and optimal station planning to promote synergy between micromobility and public transportation. Additionally, systematic efforts are crucial for regulations and infrastructure solutions ensuring the safety of using city bikes and other shared vehicles. According to the Polish Ecological Club, Mazovian District (PKEOM), the foundation of urban systems should be conventional and electric bikes, complemented by cargo bikes. Furthermore, the widespread adoption of shared bikes still requires attention and the resolution of issues, including accessibility for older individuals who may face challenges in using applications for active mobility needs [54].
3. Research Methodology
3.1. Study Area
Szczecin is the largest city in north-western Poland, situated in one of the countries bordering the Baltic Sea. It is home to approximately 401,990 residents [55]. Positioned near the Polish–German border at the mouth of the Oder River, its coordinates are 14°33′10″ E longitude and 53°25′44″ N latitude [56]. The city covers an area of 300.55 km2, with 1202.8 km2 occupied by water bodies. Its distinctive feature is its location on both sides of the Oder River, posing frequent transportation challenges for both residents and urban planners of city infrastructure. The public transportation network and city bike stations are depicted in Figure 5 and Figure 6.
Within Szczecin, Road and Urban Transport Management (ZDiTM) operates as a separate organizational unit. It is a municipal budgetary entity responsible, among other things, for the broad organization and management of public transport [59]. ZDiTM issues contracts to operators, companies holding permits for passenger transport services, who have entered into agreements with the public collective transport organizer, ZDiTM, to provide public transport services on the specified communication line, encompassing both bus and tram services, as shown in Figure 7.
As part of their operations, transportation is arranged on numerous lines [60]:
- Regular daytime tram lines: 1, 2, 5, 6, 7, 8, 9, 10, 11, and 12;
- Regular daytime bus lines: 51, 52, 53, 54, 56, 57, 58, 59, 60, 61, 62, 63, 64, 65, 66, 67, 68, 69, 70, 72, 73, 75, 76, 77, 78, 79, 80, 82, 84, 85, 86, 87, 88, 89, 90, 91, 92, 93, 94, 96, 97, 98, 99, 101, 102, 103, 106, 107, 109, 221, 222, 223, 224, 225, 226, 227, 241, 242, 243, and 244;
- Regular daytime on-demand bus lines: 904 and 908;
- Regular daytime express bus lines: B and C;
- Regular daytime substitute bus lines: 806;
- Night bus lines: 521, 522, 523, 524, 525, 526, 527, 528, 529, 530, 531, 532, 533, 534, 535, and 536.
3.2. City Bike in Szczecin
The idea of introducing city bikes in Szczecin under the name “Szczeciński Rower Miejski” (SRM) emerged in 2014 with the development of cycling infrastructure in Szczecin. It was also a result of citizens’ participation in deciding on a portion of the budget in 2014 through the Citizens’ Budget (PB). The project underwent a citizens’ vote and garnered the highest number of votes (2728), securing the top position among nearly 300 proposals submitted to the Szczeciński Budżet Obywatelski (SBO) in 2014. Following a competitive tender process, the company BikeU was selected to implement the project with a value of PLN 2.69 million (PLN 575,000 from the SBO, the rest from self-financing, Nieruchomości i Opłaty Lokalne—NiOL). NiOL is the entity responsible for project implementation and ongoing operations [61].
In 2018, the length of cycling paths in Szczecin was 137.3 km and progressively increased to 139.3 km in 2019, 148.6 km in 2020, 154.9 km in 2021, and 160 km in 2022 [55]. The number of SRM stations from 2018 to 2020 was 87 [62].
In 2018, the SRM season started with a delay on March 6 instead of March 1. During the winter break, damage to locks occurred, and even after repairs, there were issues with unlocking bikes at old stations. On April 10, the station on 26 Kwietnia Street was dismantled due to the construction of a bike path in the area, and it was reactivated on October 24. Unfortunately, in 2018, the number of rentals did not exceed 500,000. The highest number of rentals was in May–86,000. June followed slightly lower with 78,000, and April with 72,000 rentals. In the remaining months, bikes were less popular, considering that they were inactive during the winter months from November to March. In May, 50 new Bike_S bikes were purchased. After their acquisition, the fleet was supplemented with vehicles that, after four years of SRM operation, were worn out or lost.
From 1 March 2019, a total of 586 bikes were introduced on the streets of Szczecin, all of which underwent a thorough inspection during the winter break. Damaged parts were replaced, gears and brakes were adjusted, and the necessary parts were lubricated. In the city center, 368 bikes were stationed, and 217 were available on the right bank. It was announced that the 2019 season might be the last in the current formula. Participation in the Citizens’ Budget 2019 and the corresponding number of votes allowed Szczeciński Rower Miejski to transition to fourth-generation bikes. The number of rentals in various months, such as November, July, or September, noticeably decreased. This is especially evident in November, with a total of just under 20,000 rentals. The best month of the season was undoubtedly June, with 69,258 rentals, followed by April with 59,324 rentals, and July with 55,665 rentals. The 2019 season concluded with 410,000 rentals, 80,000 less compared to the previous year. This could be attributed to the emergence of alternative forms of transportation such as electric scooters, although their presence did not significantly affect the popularity of Bike_S.
Repaired and repainted bikes allocated to 87 stations began the seventh season on the streets of Szczecin in 2020. Users had access to 350 bikes on the left bank and 170 on the right bank. Due to the COVID-19 pandemic, Bike_S bicycles were out of use from April 1 to 6 May 2020. All bikes transported back to the stations underwent disinfection of the most frequently touched elements, such as handles, saddles, steering wheels, and keypad terminals for stations. On 21 May 2020, 63 new bikes joined the Bike_S-SRM fleet. The supplier was the company Nextbike, in collaboration with NiOL since 2016. This year, there was the least interest in city bikes due to the epidemic threat. The situation related to the coronavirus left a significant mark on the final monthly results, causing the lowest interest in the history of Bike_S. Excluding April, which had no bikes on the streets of Szczecin, November and March performed the worst, with the number of rentals being 11,000 and 17,000, respectively. Surprisingly, the highest number of rentals occurred during the holiday season, especially in July. The epidemic likely compelled Szczecin residents to stay in the city during this time, positively influencing the utilization of city bikes.
The 2020 season concluded with 217,508 bike rentals. Compared to previous seasons, the result was unsatisfactory and significantly differed from those of previous seasons. One of the main reasons was the threat associated with the coronavirus epidemic, which forced bikes off the streets of Szczecin for five weeks. The implemented lockdown and restrictions also contributed to the situation. Despite the inconveniences, the transition to the next generation of bikes was announced, concluding the current stage of Bike_S with 3 million trips since 2014. These years were marked by numerous problems that NiOL had to confront. Failures and station and bike vandalisms were the main factors causing trouble for residents and operators who had to deal with emerging obstacles. Nevertheless, NiOL always made every effort to mitigate the consequences of events and provide an alternative means of transportation for the residents of Szczecin, such as city bikes. According to Bike_S statistics, Szczeciński Rower Miejski was most frequently rented between 3:00 PM and 4:00 PM on weekdays. This suggests that city bikes were primarily used as an alternative to both public and individual transportation.
In 2021, Szczeciński Rowery Miejskie was not available to Szczecin residents due to preparations for the transition to the fourth generation of bikes. Tender procedures were carried out, not always according to the planned schedule of the project.
BikeS fourth generation started operating on 1 March 2022. Registration is possible exclusively through the Roovee mobile application, available for free download from http://www.bikes-srm.pl as well as from Google Play, the App Store, and the App Gallery. The application is available in four languages: Polish, German, English, and Ukrainian. The application enables, among other things, initiating the starting fee (PLN 20), topping up the account, purchasing a subscription, locating parking zones and available bikes, reserving a bike, and, above all, renting a bike by scanning the QR code from the electronic lock. A total of 800 bikes equipped with GPS and autonomous locks await future users. The system operates year-round, not just from March to November as in previous editions of the bike. Ordinary bike docks have replaced the former docking stations, and their number has increased from 87 to 99. The system operates on new principles, and a re-registration is necessary for individuals who were previously registered in the rental and wish to use it again [63].
3.3. Participating Budget
Local authorities and municipalities, understanding the need for residents’ mobility, particularly in the context of bikesharing, strive to fulfill these needs. However, due to limited city or municipality budgets, they cannot always financially support initiatives related to this area. In such cases, participating in a citizens’ budget (PB) project competition, also known as participatory budgeting, can be a good solution. It is planned for a specific year, and, to gain social support, this process should be designed as a regular mechanism for citizens’co-decision on initiatives within the city or municipality, especially those related to micromobility. In Poland, participatory projects between 2011 and 2019 were created by local governments solely based on the general statutory competencies of a given local government unit [64,65].
In 2013, the highest number of such projects was reported in Łódź—903, Gdańsk—421, Szczecin—304, nearly the same in Zielona Góra—302, and Radom—277. The number of proposals could be influenced by various factors, including the size of the city, the amount of the citizens’ budget, the territorial division of the city, and the specified circle of entities allowed to submit applications to the PB. However, regardless of all differentiating factors, it can be stated that residents are actively engaged in submitting proposals to citizens’ budgets already in the first year or first years of the budgets’ operation [66].
Most frequently, in such projects related to micromobility, residents considered the construction or renovation of pedestrian paths. On the PB list, following investments in roads, parking spaces, and especially in the largest cities, cycling paths were included, significantly improving and encouraging the use of shared micromobility. In the category of urban furniture, PB included bike racks alongside benches, trash bins, and lamps. Not all proposed solutions by residents are accepted, contributing to the examination of the justification for implementing a particular solution. Since 2018, all cities with county rights, i.e., 66 cities, have been obligated to implement PB projects. Only two cities from this group deviated from this obligation in 2021–2022. There are also smaller, non-legally obligated cities that decide to engage in this type of social participation, thus gaining partial insights into the infrastructure, transport, and recreational needs of residents [67].
Residents of Szczecin have been regularly participating in the competition for projects from the Szczeciński Budżet Obywatelski (SBO) since 2013. In Szczecin, 226 projects were submitted only in the last year [68]. Details are presented using a histogram, in Figure 7.
Figure 7.
The number of submitted citizens’ projects in Szczecin in editions from 2014 to 2024. Source: Own elaboration based on [68] (accessed: 28 January 2024).
Figure 7.
The number of submitted citizens’ projects in Szczecin in editions from 2014 to 2024. Source: Own elaboration based on [68] (accessed: 28 January 2024).

In terms of allocated funds, SBO is present in the central areas of cities with over 200 thousand inhabitants. Warsaw is the clear leader in this ranking, which is not surprising considering its population size. Following closely are Krakow and Wroclaw. On the other hand, residents of Radom, Częstochowa, and Gdynia have the smallest budget at their disposal. When comparing the largest cities in Poland in terms of the PB amount per capita, Katowice takes the lead in this ranking, with 70.7 PLN per capita. Warsaw is in the second position, allocating an average of 54.5 PLN per resident. Among the 14 cities with over 200 thousand inhabitants, Szczecin ranks tenth with an amount of 43.6 PLN. Right behind are Lublin (42.2 PLN) and Gdańsk (42 PLN) [68].
Thus far, through SBO, various aspects of bikesharing have been financed, including the establishment of Szczeciński Rower Miejski along with its expansion, the construction and extension of bike paths, and cycling roads. The rules and procedures for participating in social consultations within SBO are preceded by the announcement of the relevant resolution for the given year in the Official Journal of the West Pomeranian Voivodeship [69,70,71,72].
3.4. Methods
The applied research procedure is presented in Figure 8.
In the first stage, a review of the literature available in the Web of Science and Scopus databases was conducted on the topic of urban micro-mobility from the perspective of eco-sharing, particularly bikesharing.
In the second stage, an analysis of the transportation needs of Szczecin residents in the field of micromobility and other available means of transportation was carried out using the case study method.
Unpublished research based on a proprietary survey questionnaire titled “Quality of life from the perspective of residents of a medium-sized city using various means of transportation” was utilized for this purpose. Treated as primary research, the survey was made available to Szczecin residents through the Google browser from 17 May 2019, to 1 April 2021. A total of 322 respondents, aged 16 to 80, participated in this study. Out of the nine questions in the survey, four were utilized, specifically in the section related to bicycles, covering their availability, frequency of use, safety assessment, and the impact on respondents’ lives.
To determine user preferences, a six-element metric was employed, characterizing respondents based on gender, age, occupational activity and industry, education level, and place of residence [73]. A non-random, random sample method was used for this study [74].
To assess the results, correspondence analysis, Kruskal–Wallis analysis of variance, and dependency tests were used.
In the third stage, an analysis of bikesharing in Szczecin was conducted for the years 2018–2020 based on data provided by the NiOL company. The level of bike rentals was evaluated using variance tests.
To evaluate the level of social involvement in the expansion of cycling infrastructure in stage 4, and thus obtain information on the level of interest in bikesharing in Szczecin, the authors analyzed and assessed the qualitative and quantitative aspects of projects submitted and won in Szczecin’s participatory budgets in the years 2018–2021 and 2024.
In the fifth stage, to determine the current situation of bikesharing in Szczecin, its weaknesses, and directions for development, a brief survey II was conducted among SRM users on 11–12 December 2023. It consisted of two metric questions: “In which age group do you belong?” and “What is your occupational activity?” Additional questions included: “How often do you ride a bike?” and “What factors influence your decision to ride a bike?”. A total of 345 respondents aged 15 to 80 participated in this study.
During this stage, a meta plan [75] was also developed for the issue: “Too little interest in bikesharing among Szczecin residents”. The meta plan involved gathering input and insights from participants to address and discuss potential solutions or improvements related to the identified problem.
The research discussed in the article exhibits characteristics of both quantitative and qualitative research. The quantitative aspect pertains to identifying the level of interest in bikesharing in Poland, particularly in Szczecin. The qualitative research focuses on determining the social involvement in the expansion of cycling infrastructure and the weaknesses of bikesharing in Szczecin, along with its directions for development. Conducting research using both quantitative and qualitative methods allows it to be treated as a form of methodological triangulation.
4. Results
4.1. Case Study for Szczecin in the Scope of Micromobility
Based on respondents’ answers to questions regarding the frequency of bike usage, bike availability, safety of biking, and the impact of biking on their lives, connections between the characteristics of the chosen mode of transportation, in this case, a bike, and the characteristics of the respondents were identified. When asked about the type of transportation chosen by Szczecin residents for commuting to various places (Table 1) the role of bikes is relatively small. For example, 4.35% of respondents declared commuting to work by bike and 2.5% for commuting to school, as shown in Figure 9.
Overall, across all directions, the dominant modes of transportation are cars and walking [76], as illustrated in Figure 10, where the percentage of respondents choosing a specific means of transportation for the respective commuting direction is presented.
The utilization of the three micromobility options considered in the survey is depicted in accordance with the graph presented in Figure 11.
Only the bicycle was noticeably declared by respondents. The predominant use of bicycles is on the home-entertainment route (H-e). The declaration of the frequency of using a specific means of transportation for micromobility by Szczecin residents is presented in Figure 12.
For scooters and electric scooters, the response “I do not use” clearly dominates, reaching almost 90%. Regarding bicycles, declarations of non-use and infrequent use also prevail, but they are distributed more evenly, not exceeding 25%.
Socio-Demographic Structure of Respondents in the Context of Bicycle Travel
The following analyses demonstrate the demand for bicycles as an urban means of transportation by linking age categories, occupations, residence, and education with various aspects of biking: frequency of use, availability, and safety.
A chi-square independence test revealed a dependence between the frequency of bike usage and the respondent’s age (test statistic value of 59.25 with a critical value of 50.99). However, the strength of the dependence is not substantial, with a Cramer’s V coefficient of 0.18. Correspondence analysis allows for the association of age categories with the frequency of bike usage, as depicted in Figure 13.
The presented arrangement of the two variables explains almost 85% of the inertia of all observed variables, enabling the analysis of the co-occurrence of individual categories. Two distinct groups can be clearly identified:
- Very frequent users, whose percentage is highest in the age group from 55 to 65 years.
- Non-users of bicycles, whose percentage is highest in the age group from 45 to 55 years.
In other cases, associations are highly diverse. A chi-square independence test revealed a dependence between the characteristics of “frequency of bicycle usage” and “the degree of impact of cycling in the city on the respondent’s life” (test statistic value of 156 with a critical value of 50.99). The strength of the dependence is moderate, with a Cramer’s V coefficient of 0.29. Correspondence analysis allows for the association of impact categories with the frequency of bicycle usage, as depicted in Figure 14.
Consistent use of a bicycle is associated with a declaration of a strong impact (Group I). Frequent and very frequent use of a bicycle is linked to a strong and very strong impact (Group II). On the other hand, the declaration of little or no impact is associated with infrequent bicycle use. These associations confirm the coherence of respondents’ opinions in the analyzed survey.
A chi-square independence test revealed a dependence between the frequency of bicycle usage and the assessment of biking safety (test statistic value of 79 with a critical value of 50.99). However, the strength of the dependence is not substantial, with a Cramer’s V coefficient of 0.19. Correspondence analysis allows for the association of safety assessment categories with the frequency of bicycle usage, as depicted in Figure 15.
In the presented associations, two groups stand out:
Habitual users who perceive biking as very safe.
Those who bike very frequently (once a day) and assess biking in a completely different manner—as very unsafe.
This indicates an awareness of the actual conditions of cycling in Szczecin. A chi-square independence test revealed a dependence between the assessment of bicycle safety and the respondent’s type of occupational activity (test statistic value of 38.5 with a critical value of 36.4). However, the strength of the dependence is not substantial, with a Cramer’s V coefficient of 0.17. Correspondence analysis allows for the association of safety assessment categories with the frequency of bicycle usage. For the two dominant groups in the survey, students and professionally active individuals, the chart of associations is as follows, as presented in Figure 16.
Professionally active individuals assess biking as unsafe, while among students, the prevailing opinion is that biking is a safe means of transportation. Although the student category is strongly associated with the assessment that biking is extremely unsafe.
A chi-square independence test revealed a dependence between the assessment of bicycle safety and the respondent’s place of residence (test statistic value of 28.7 with a critical value of 28.4). However, the strength of the dependence is not substantial, with a Cramer’s V coefficient of 0.17. Correspondence analysis allows for the association of safety assessment categories with the respondent’s place of residence, as presented in Figure 17.
In this case, individuals from outside Szczecin clearly formed groups with different assessments of the safety of cycling in Szczecin. People from the vicinity of Szczecin have moderate opinions about the safety of cycling. Those from more distant areas within the West Pomeranian Voivodeship rate the safety of cycling very poorly. On the other hand, individuals from farther regions of Poland perceive cycling in Szczecin as very safe. However, the opinions of Szczecin residents regarding the safety of cycling are extremely diverse.
A chi-square independence test revealed a dependence between the assessment of bicycle availability and the respondent’s age (test statistic value of 125.5 with a critical value of 50.99). The strength of the dependence is moderate, with a Cramer’s V coefficient of 0.25. Correspondence analysis allows for the association of availability categories with the age of respondents, as depicted in Figure 18.
Within the age group of 55 to 65 years, opinions prevail that the bicycle is a very difficult means of transportation to access. In the age group of 25 to 34 years, opinions prevail that the bicycle is very accessible. In the age group of 35 to 44 years, opinions prevail that the bicycle is moderately accessible. However, the age groups 45–54 and 18–24 have diverse opinions about the availability of bicycles in Szczecin.
A chi-square independence test revealed a dependence between the assessment of bicycle availability and the respondent’s education level (test statistic value of 172.5 with a critical value of 28.9). The strength of the dependence is substantial, with a Cramer’s V coefficient of 0.42. Correspondence analysis allows for the association of availability categories with the two most numerous groups of respondents with higher and medium education, as depicted in Figure 19.
Among the two dominant groups with medium and higher education, it can be observed that respondents with higher education rate the availability of bicycles as average. Meanwhile, the group with medium education declares extreme opinions: very accessible and at the same time very difficult to access.
4.2. Meta-Analysis of Bike Rental Data for the Years 2018–2020
The main indicator of the intensity of using city bikes is the number of rentals. Below (Figure 20) are comparisons and statistics related to the period 2018–2020. In 2021, the operation of city bikes in Szczecin was suspended.
Over the years 2018–2020, noticeable seasonal fluctuations in the number of bike rentals can be observed. Additionally, there is a clear decline in the number of city bike rentals. Particularly low values in 2020 are associated with the COVID-19 pandemic, during which the operation of city bikes was significantly restricted. However, earlier data already suggested a decrease in interest in city bikes, as depicted in Figure 21.
While the years 2014–2018 do not significantly differ in terms of the average daily number of rentals, 2019 already has a significantly lower average, and this trend deepens in 2020. The absolute annual number of rentals has been systematically decreasing since 2016, as shown in Figure 22.
The distribution of the number of rentals in individual months was as follows, as depicted in Figure 23.
Another measure of demand for bikesharing services is the average daily number of bikes on the streets. Details for each month and the years 2018–2020 are presented in Table 2.
Despite the significantly varied number of rentals in individual years, the average number of city bikes (SRM) cycling on the streets of Szczecin continues to grow: in 2018, it was 525 bikes, in 2019—547 bikes, and in 2020, it reached 568 bikes.
Another indicator of SRM popularity is the number of registered users, which remained at a similar level between 40,000 and 50,000 during the examined period, as shown in Figure 24.
To assess the periodicity of changes in SRM usage, the daily number of rentals was analyzed in two aspects: monthly and weekly.
The daily number of rentals is also highly variable in individual months. Data from the month of April are significantly disrupted because the city bike system did not operate in this month in 2020, and the data underestimate the average. A similar situation occurred in May when the bike service started, but there were significant restrictions. In the years 2018–2019, the situation unfolded as depicted in Figure 25.
Kruskal–Wallis tests indicated a significant difference between the number of rentals in individual months. Fisher’s Least Significant Difference tests allow the identification of the following groups, as shown in Table 3.
The highest number of rentals occurred in June, while the lowest was in November. In July and August, there was a significant decrease compared to June—the holiday season. During the months of April to May, the number of rentals was notably higher than in the vacation months of July and August. It can be inferred that city bikes are used more for commuting to school and work than for recreational or shopping purposes. This is also evident in the diagram below, where a lower number of rentals is observed on Saturdays and Sundays. Additionally, a significantly lower number of rentals is noticeable in the autumn and winter months, indicating the significant impact of weather conditions, which in Szczecin during this period, especially do not favor cycling, as shown in Figure 26.
Multiple comparison tests (Fisher’s LSD test) indicate significant differences between the number of rentals on Saturdays and Sundays compared to the other days of the week, as presented in Table 4.
Data on rentals at individual SRM stations allows us to identify stations with the highest number of rentals. The 20 most popular stations are presented in Figure 27.
Nineteen out of the 20 most popular city bike stations are located in the left-bank part of Szczecin, with only one in the right-bank part. The map below illustrates the distribution of these stations in the left-bank part, which constitutes the central area of Szczecin with municipal and provincial offices, universities, cultural centers, the main railway and bus station, dormitories, etc. (Figure 28).
All of these most popular SRM stations are located near crucial points, such as:
Intersections of tram and bus lines
Transfer centers
Offices
Railway stations
Dormitories
The choice of mobility method, considering factors such as availability, travel time, and the number of transfers, is influenced by the specific organization of urban space in Szczecin, including the topography, rivers, street and road network, and bridges.
4.3. Analysis of the Szczecin Participatory Budget (SBO)
In the years 2018–2021, residents of Szczecin actively participated in submitting projects for implementation within the framework of the SBO. Each year, the funds allocated for the implementation of selected projects have been increasing, from 8 million PLN in 2018 to 17.2 million PLN in 2024. Details are presented in Table 5.
Part of these projects was related to the broadly understood cycling infrastructure and involved bikesharing stations, cycling paths, and other related initiatives. Details are provided in Table 6.
On average, 9.8% of all projects and 7.7% of all votes are related to cycling infrastructure. Some of these projects are closely connected to bikesharing. Between 2018 and 2021, there were a total of 14 such projects, constituting only 1.65% of all voted projects.
During this period, only five cycling projects were selected for implementation. In 2019, the project “Pedestrian-roller-skating-cycling route around Lake Goplana—an extension of the existing route around the Arkonka bathing area” was chosen as a citywide project with a budget of PLN 3,156,500. It received 2854 votes and was accepted for implementation as the winner.
In 2020, a district project was chosen: “Pumptrack—a universal cycling track in Wielgowo” with a budget of PLN 253,000. It received 940 votes [77].
In 2021, three district projects were selected:
- “Consistent cycling routes for Szczecin—Sczaniecka” (budget—PLN 330,000; number of votes—724)
- “Jeziorko Słoneczne, Gumieńce—improvement of recreational and cycling infrastructure. Construction of the missing section of the roller-cycling path around Lake Słoneczne, construction of a skatepark at Taczak” (budget—PLN 580,000; number of votes—2600);
- “Consistent cycling routes for Szczecin—Matejki” (budget—PLN 231,000; number of votes—839) [78].
4.4. Meta Plan for Bikesharing in Szczecin
After conducting the previously discussed analyses, the authors decided to utilize another method. The meta plan was developed based on all previously conducted research, and additionally, specifically for its needs, a survey was conducted among 345 respondents aged 15 to 80 years old. The survey results are presented in Figure 29.
The developed meta plan takes into account the observations and conclusions from the previous analyses and helps formulate final conclusions in the analysis of the needs of Szczecin residents regarding the use of bikesharing, partially addressing the question of why there is too little interest in bikesharing in Szczecin. Details are presented in Figure 30.
5. Discussion
To investigate the demand for ecological individual means of transport, one of the Polish cities where BSS has been operating since 2014 was chosen. The main reason for creating the system was the societal need expressed in the voting during the Civic Budget. Since then, there has been a systematic development of the system, which has already found its place in the city’s transportation system. It constitutes an important element, positively influencing the capacity and mobility of the residents.
A case study based on survey research and metadata concerning Bike_SSRM confirms the findings that entertainment, despite the passage of time, still seems to be a key motivation for bike users in Szczecin, as well as in cities like London [79]. The demand for bikes in Szczecin is also influenced by unfavorable weather conditions, similar to New York and London [80,81], where demand drops during adverse weather. Respondents, especially those active professionally, confirm that the bike is an important alternative means of transportation in the city, and they assess its availability positively. However, when it comes to assessing its safety, they are not as enthusiastic as younger, learning individuals, as confirmed by other studies [82].
A significant factor influencing the utilization of BSS is comfort and convenience. Users are much more willing to use bikes, which is also confirmed by other researchers, especially during warmer months [83]. Unfavorable weather conditions discourage bicycle travel [84].
The utilization of city bikes in Szczecin is noticeably lower on weekends and during the holiday period, as confirmed by research in other cities [85,86]. Researchers analyzing the demand for electric bikes [87] have shown that factors such as weekends, summer months, and the proximity of recreational centers and bike paths influence more frequent use of bikesharing systems. In Szczecin, as in many other cities, bikesharing systems are based on non-electrically powered vehicles. On the other hand, many authors confirm the relationship between bikesharing demand and the proximity of businesses and workplaces to bikesharing stations [88]. Gervini and Khanal suggest that urban infrastructure and the spatial distribution of bike stations are key factors in meeting the demand for city bikes [89]. This situation is also evident in Szczecin, as demonstrated by the authors.
The significant decrease in demand for city bikes in Szczecin during COVID-19 is also confirmed by research [90], especially in the initial months of the pandemic. However, the situation in Szczecin in the later months of 2020 unfolded differently than in many American and European cities, such as Budapest [91] or Kosice [92], where there was an increase in the number of rentals to pre-pandemic levels. In Szczecin, the decline was continuous, and the main reason, as presumed by the authors, could be the COVID-19 pandemic. SRM was unavailable to users in April, which undoubtedly influenced rental statistics. Additionally, Bike_SSRM was being prepared for a change in operator and system formula to a dockless system, so there was no investment in new bikes or existing stations.
Verification of the demand for BSS in Szczecin based on submitted SBO projects confirms the community’s interest in this non-motorized individual form of transportation. Each year, Szczecin residents systematically submit needs related to BSS in various elements of bike infrastructure and the bikes themselves. Despite the globally recognized initiative of participatory budgeting [93,94], there are few cases of using this form of societal co-decision to assess its interest in BSS.
6. Conclusions
The research methodology proposed by the authors, based on case studies, surveys, SRM and BO metadata, and the meta-plan method, allows for a more thorough assessment of the demand among Szczecin residents for the environmentally friendly means of transportation that is the bicycle.
The goal set forth in the article was achieved through the implementation of specific tasks using methods chosen by the authors.
The identification of the level of interest in the bicycle rental system in Poland was conducted based on literature analysis and data from the Central Statistical Office (GUS). This level, viewed through the prism of the number of bicycles and rentals as well as the length of bike paths, continues to increase steadily.
The survey results in Szczecin unequivocally demonstrated significant correlations between various socio-demographic groups and different aspects of cycling, such as safety, accessibility, frequency, and others. Bikesharing stands out as dominant compared to other ecological means of transportation. Information obtained from professionally active respondents indicates a need for using bikesharing systems with limited trust in safety. The issue of bikesharing system accessibility is still evolving, which may indicate the dynamic development of the area under investigation.
The quantitative analysis of bikesharing system (BSS) rentals revealed specific locations and periods of intense BSS usage. This provides valuable guidance for city authorities and public transportation organizers in building new models, especially concerning the distribution of bike paths, the placement of additional BSS stations, and the quantity of available bikes at each station.
The analysis of participatory budgets (BO) allowed for the assessment of social interest and approval for BSS development. The percentage of engaged residents ranges from 5% to 16% of the total population. This indicates that the public bike system serves as a reinforcing element of sustainable mobility in the city.
The applied meta-plan method allowed the authors to identify new aspects and supplement the previously mentioned uses of BSS in Szczecin, which are influenced by several important factors. These factors include:
- Still insufficiently developed linear and point infrastructure for bicycles.
- High burden on the city’s linear infrastructure, and consequently, also on the bicycle infrastructure, due to urban development investments carried out simultaneously, which also affects the emergence of congestion and adversely impacts the safety of cyclists.
The research presented in the article allows us to conclude that the social demand for bikesharing in Szczecin is shaped by a complex interplay of factors, including urban infrastructure, efficiency, proximity to businesses and employment centers, and the COVID-19 pandemic. Understanding and addressing these factors is necessary and essential for effectively meeting the demand for bikesharing and promoting micromobility through the use of shared non-motorized transportation.
The research results have many implications for business practice. This relates to managing the city’s transportation system, energy savings, and decarbonization policies, and also includes the creation of new business models that respond to the challenges of contemporary society and align with the principles of sustainable development.
The proposed methodology integrates science, represented by researchers, with urban data analysis. It can assist planners and officials in Szczecin and other cities in expanding or initiating exploration of areas for future BSS station locations. Through BO analysis and individual meta-plan development, it allows for the identification of tasks necessary for implementation.
The proposed methodology is not without flaws. It does not consider the participation of older people and those with disabilities in BSS. In the future, it would be necessary to examine this area and seek solutions beneficial to all urban subsystems (pedestrian, bicycle, individual, and public transportation), taking into account all stakeholders involved.
Author Contributions
Conceptualization, A.E.W. and L.K.; data curation, A.E.W. and L.K.; formal analysis, A.E.W. and L.K.; investigation, A.E.W. and L.K.; methodology, A.E.W. and L.K.; visualization, L.K. and A.E.W.; writing-original draft, A.E.W. and L.K.; writing-review and editing A.E.W. All authors have read and agreed to the published version of the manuscript.
Funding
The APC was funded by Maritime University of Szczecin.
Institutional Review Board Statement
Not applicable.
Informed Consent Statement
Not applicable.
Data Availability Statement
Data are contained within the article and references. The data presented in this study are available on request from the corresponding author.
Acknowledgments
The authors would like to express their gratitude for the assistance provided by NiOL. Thanks to collaboration with this organization, researchers were able to conduct crucial analyses related to the demand for bikesharing in Szczecin.
Conflicts of Interest
The authors declare no conflicts of interest.
Abbreviations
| PMD | Personal Mobility Device |
| NCL | National Leaque of Cities |
| DBS | Dockless Bicycles Stations |
| PB | Participatory Budget or Citizens’ Budget |
| SBO | Participatory Budget in Szczecin (Szczeciński Budżet Obywatelski) |
| P&R | Park and Ride |
| pkm | passenger-kilometer |
| SUMP | Sustainable Urban Mobility Plans |
| SRM, Bike_S | Szczecin City Bike (Szczeciński Rower Miejski) |
| GUS | Statistics Poland (Główny Urząd Statystyczny) |
| ZDiTM | Road and Public Transport Authority in Szczecin |
| SDP | Sustainable Development Principles |
| NiOL | Nieruchomości i opłaty Lokalne |
| BSS | Bikesharing system |
References
- Eurostat Database, European Commission. Available online: https://ec.europa.eu/eurostat/en/web/products-eurostat-news/w/DDN-20230530-1 (accessed on 31 January 2024).
- Shaheen, S.; Cohen, A. Innovative Mobility: Carsharing Outlook; Carsharing Market Overwiew, Analysis and Trends—Spring 2020. Available online: https://escholarship.org/uc/item/61q03282 (accessed on 17 January 2023).
- Smart Rural Portal. Car-Sharing for Rural Areas. Available online: https://www.smartrural21.eu/smart-solution/electric-car-sharing/ (accessed on 23 January 2023).
- Statista Portal. Car-Sharing. Available online: https://0-www-statista-com.brum.beds.ac.uk/outlook/mmo/shared-mobility/car-sharing/worldwide (accessed on 25 September 2023).
- Litman, T. Managing Diverse Modes and Activities on Nonmotorized Facilities: Guidance for Practitioners. ITE J. 2006, 76, 20–27. [Google Scholar]
- Litman, T.; Blair, R. Managing Personal Mobility Devices (PMDs) on Nonmotorized Facilities; Victoria Transport Policy Institute: Victoria, BC, Canada, 2023. [Google Scholar]
- Philpott, M. Literature Review of the Older Adults’ Mobility Needs and Services for Mobility, Edition V 1.1, The Happy Walker Consortium 2019. Available online: http://deliverables.aal-europe.eu/call-4/happy-walker/hw_d1-1_v1.1/at_download/file (accessed on 8 September 2023).
- Shaheen, S.; Cohen, A. Shared Micromoblity Policy Toolkit: Docked and Dockless Bike and Scooter Sharing. UC Berkeley: Transportation Sustainability Research Center. Available online: https://escholarship.org/uc/item/00k897b5 (accessed on 22 January 2024).
- Kim, S.-H.; Lim, H.; Kim, J. Exploring Countermeasures from a Psychological Perspective to Create a Safe Driving Environment for Personal Mobility Devices. Sustainability 2021, 13, 5450. [Google Scholar] [CrossRef]
- Arias-Molinares, D.; Julio, R.; García-Palomares, J.C.; Gutierrez, J. Exploring micromobility services: Characteristics of station-based bike-sharing users and their relationship with dockless services. J. Urban Mobil. 2021, 1, 100010. [Google Scholar] [CrossRef]
- Micromobility in Cities. A History and Policy Overview. 2019. National League of Cities. Available online: https://www.nlc.org/wp-content/uploads/2019/04/CSAR_MicromobilityReport_FINAL.pdf (accessed on 2 May 2019).
- Act of the Law on Municipal Government (Ustawa z Dnia 8 Marca 1990 r. o Samorządzie Gminnym); Dz. U. z 1990 r. nr 16 poz. 95; Chancellery of the Sejm: Warsaw, Poland, 1990. Available online: https://isap.sejm.gov.pl/isap.nsf/DocDetails.xsp?id=wdu19900160095 (accessed on 21 January 2024).
- Ustawa z Dnia 11 Lipca 2014 r. o Petycjach (Dz. U. z 2014 r. Poz. 1195). Available online: https://isap.sejm.gov.pl/isap.nsf/DocDetails.xsp?id=WDU20140001195 (accessed on 21 January 2024).
- Ustawa z Dnia 28 Kwietnia 2022 r. o Zmianie Ustawy o Samorządzie Gminnym (Dz. U. z 2022 r. Poz. 1005). Available online: https://isap.sejm.gov.pl/isap.nsf/DocDetails.xsp?id=WDU20220001005 (accessed on 21 January 2024).
- Giglio, C.; Musmanno, R.; Palmieri, R. Cycle logistics projects in Europe: Intertwining bike-related success factors and region-specific public policies with economic results. Appl. Sci. 2021, 11, 1578. [Google Scholar] [CrossRef]
- Reck, D.J.; Haitao, H.; Guidon, S.; Axhausen, K.W. Explaining shared micromobility usage, competition and mode choice by modelling empirical data from Zurich, Switzerland. Transp. Res. Part C Emerg. Technol. 2021, 124, 102947. [Google Scholar] [CrossRef]
- Blad, K.; de Almeida Correia, G.H.; van Nes, R.; Annema, J.A. A methodology to determine suitable locations for regional shared mobility hubs. Case Stud. Transp. Policy 2022, 10, 1904–1916. [Google Scholar] [CrossRef]
- Bahadori, M.S.; Goncalves, A.B.; Moura, F. A Systematic Review of Station Location Techniques for Bicycle-Sharing Systems Planning and Operation. ISPRS Int. J. Geo-Inf. 2021, 10, 554. [Google Scholar] [CrossRef]
- Kamargianni, M.; Li, W.; Matyas, M.; Schäfer, A. A Critical Review of New Mobility Services for Urban Transport. Transp. Res. Procedia 2016, 14, 3294–3303. [Google Scholar] [CrossRef]
- Turoń, K. Car-Sharing Systems in Smart Cities: A Review of the Most Important Issues Related to the Functioning of the Systems in Light of the Scientific Research. Smart Cities 2023, 6, 796–808. [Google Scholar] [CrossRef]
- Kubik, A. Impact of the Use of Electric Scooters from Shared Mobility Systems on the Users. Smart Cities 2022, 5, 1079–1091. [Google Scholar] [CrossRef]
- Guyader, H.; Friman, M.; Olsson, L.E. Shared Mobility: Evolving Practices for Sustainability. Sustainability 2021, 13, 12148. [Google Scholar] [CrossRef]
- Shaheen, S.A.; Guzman, S.; Zhang, H. Bikesharing in Europe, the Americas, and Asia. Transp. Res. Rec. 2010, 2143, 159–167. [Google Scholar] [CrossRef]
- Shaheen, S.; Cohen, A.P. Carsharing and Personal Vehicle Services: Worldwide Market Developments and Emerging Trends. Int. J. Sustain. Transp. 2013, 7, 5–34. [Google Scholar] [CrossRef]
- Shaheen, S.; Cohen, A.; Jaffee, M. Innovative Mobility: Carsharing Outlookcarsharing Market Overview, Analysis, and Trends, Winter 2018; Transportation Sustainability Research Center—University of California: Berkeley, CA, USA, 2018; Available online: https://escholarship.org/uc/item/9jh432pm (accessed on 11 January 2024).
- Bikeshare and E-Scooter Systems in the U.S. Available online: https://data.bts.gov/stories/s/Bikeshare-and-e-scooters-in-the-U-S-/fwcs-jprj (accessed on 7 October 2023).
- Larsen, J. Bike-Sharing Programs Hit the Streets in over 500 Cities Worldwide, Earth Policy Institute. 25 April 2013. Available online: https://www.earth-policy.org/plan_b_updates/2013/update112 (accessed on 11 January 2024).
- Audikana, A.; Ravalet, E.; Baranger, V.; Kaufmann, V. Implementing bikesharing systems in small cities: Evidence from the Swiss experience. Transp. Policy 2017, 55, 18–28. [Google Scholar] [CrossRef]
- Qiu, L.-Y.; He, L.-Y. Bike Sharing and the Economy, the Environment, and Health-Related Externalities. Sustainability 2018, 10, 1145. [Google Scholar] [CrossRef]
- Sadiq, M.; Moslehpour, M.; Qiu, R.; Hieu, V.M.; Duong, K.D.; Ngo, T.Q. Sharing economy benefits and sustainable development goals: Empirical evidence from the transportation industry of Vietnam. J. Innov. Knowl. 2023, 8, 100290. [Google Scholar] [CrossRef]
- Jochem, P.; Frankenhauser, D.; Ewald, L.; Ensslen, A.; Fromm, H. Does freefloating carsharing reduce private vehicle ownership? The case of SHARE NOW in European cities. Transp. Res. Part A Policy Pract. 2020, 141, 373–395. [Google Scholar] [CrossRef] [PubMed]
- Rower Miejski W Niemczech. Available online: http://wrower.pl/miasto/rower-miejski-w-niemczech,2734.html (accessed on 25 January 2024).
- Dz.U.1988.5.40. Konwencja o Ruchu Drogowym. Wiedeń.1968.11.08. Available online: https://sip.lex.pl/akty-prawne/dzu-dziennik-ustaw/konwencja-o-ruchu-drogowym-wieden-1968-11-08-16792648 (accessed on 21 January 2024).
- Dz.U.2023.1047 t.j.Ustawa z Dnia 20 Czerwca 1997 r. Prawo o Ruchu Drogowym. Available online: https://sip.lex.pl/akty-prawne/dzu-dziennik-ustaw/prawo-o-ruchu-drogowym-16798732) (accessed on 21 January 2024).
- Projekt CARAVEL. Available online: http://www.caravel.forms.pl/ (accessed on 21 January 2024).
- Kuźma, J.; Połom, M.; Żukowska, S. Rozwój mobilności współdzielonej w Polsce na tle trendów europejskich. Wydawnictwo Uniwersytetu Jagiellońskiego. Pr. Kom. Geogr. Komun. PTG 2022, 1, 7–22. [Google Scholar]
- Hua, M.; Chen, X.; Cheng, L.; Chen, J. Should bike-sharing continue operating during the COVID-19 pandemic? empirical findings from Nanjing, China. J. Transp. Health 2021, 23, 101264. [Google Scholar] [CrossRef] [PubMed]
- Guo, Y.; Yang, L.; Yang, C. Bike share usage and the built environment: A review. Front. Public Health 2022, 10, 848169. [Google Scholar] [CrossRef] [PubMed]
- Shen, Y.; Zhang, X.; Zhao, J. Understanding the usage of dockless bike sharing in Singapore. Int. J. Sustain. Transp. 2018, 12, 686–700. [Google Scholar] [CrossRef]
- Sun, S.; Hu, L. Planning for Bike-Sharing System: Predicting Potential Usage with Spatial Regression Models. Available online: https://0-doi-org.brum.beds.ac.uk/10.21203/rs.3.rs-2010850/v1 (accessed on 21 January 2024).
- Lin, P.; Weng, J.; Hu, S.; Alivanistos, D.; Li, X.; Yin, B. Revealing spatio-temporal patterns and influencing factors of dockless bike sharing demand. IEEE Access 2020, 8, 66139–66149. [Google Scholar] [CrossRef]
- Cho, J.; Seo, Y.; Kim, D. Efficiency comparison of public bike-sharing repositioning strategies based on predicted demand patterns. Transp. Res. Rec. J. Transp. Res. Board 2021, 2675, 104–118. [Google Scholar] [CrossRef]
- Yu, L.; Feng, T.; Li, T.; Cheng, L. Demand prediction and optimal allocation of shared bikes around urban rail transit stations. Urban Rail Transit 2022, 9, 57–71. [Google Scholar] [CrossRef] [PubMed]
- Zhou, S.; Song, C.; Wang, T.; Pan, X.; Chang, W.; Yang, L. A short-term hybrid tcn-gru prediction model of bike-sharing demand based on travel characteristics mining. Entropy 2022, 24, 1193. [Google Scholar] [CrossRef] [PubMed]
- Deng, G.; Wang, S.; Wang, R. Pricing and coordination strategies for bike-sharing supply chain based on Stackelberg game. In Proceedings of the SPIE 12591, Sixth International Conference on Traffic Engineering and Transportation System (ICTETS 2022), Guangzhou, China, 23–25 September 2022. 125912B. [Google Scholar] [CrossRef]
- Zhang, Y.; Thomas, T.; Brussel, M.; Maarseveen, M. Exploring the impact of built environment factors on the use of public bikes at bike stations: Case study in Zhongshan, China. J. Transp. Geogr. 2017, 58, 59–70. [Google Scholar] [CrossRef]
- Jiang, W. Bike sharing usage prediction with deep learning: A survey. Neural Comput. Appl. 2022, 34, 15369–15385. [Google Scholar] [CrossRef] [PubMed]
- Thondo, M.M.; Marqueta, O.; M’arqueza, S.; Nieuwenhuijsena, M.J. Small cities, big needs: Urban transport planning in cities of developing countries. J. Transp. Health 2020, 19, 100944. [Google Scholar] [CrossRef]
- Krych, A. Energochłonność jako kryterium optymalizacji miejskiego transportu publicznego. Transp. Miej. Reg. 2019, 6, 10–18. Available online: https://bibliotekanauki.pl/articles/192699.pdf (accessed on 30 November 2023).
- Polityka Mobilności Transportowej Miasta Poznania i Plan Zrównoważonej Mobilności Miejskiej dla Miasta Poznania. Uchwała nr L/894/VIII/2021 Rady Miasta Poznania z dnia 6 lipca 2021 r. Available online: https://www.poznan.pl/mim/main/uchwala-rady-miasta-poznania,p,48680,60503.html (accessed on 24 November 2023).
- Plan Mobilności Lubelskiego Obszaru Funkcjonalnego na Lata 2017–2025. Uchwała nr 1075/XLI/2018 Rady Miasta Lublin z dnia 22.03.2018 r. Available online: https://bip.lublin.eu/strategia-i-planowanie/mobilnosc-miejska/plan-mobilnosci-lubelskiego-obszaru-funkcjonalnego-na-lata-20172025,2,28274,2.html (accessed on 24 November 2023).
- Hyła, M. Polityka Rowerowa Polskich Miast, Badania Obserwatorium Polityki Miejskiej, Instytut Rozwoju Miast i Regionów, Warszawa-Kraków 2023. Available online: https://obserwatorium.miasta.pl/biblioteka/polityka-rowerowa-polskich-miast/ (accessed on 24 November 2023).
- Local Data Bank. Available online: https://bdl.stat.gov.pl/bdl/dane/podgrup/wykres (accessed on 20 January 2024).
- Polski Klub Ekologiczny. Available online: https://samorzad.infor.pl/wiadomosci/5999827,ekologiczna-rewolucja-w-miastach-przyspiesza-rower-i-hulajnoga.html (accessed on 24 January 2024).
- Local Data Bank. Available online: https://bdl.stat.gov.pl/bdl/dane/podgrup/tablica (accessed on 24 January 2024).
- Instytut Meteorologii i Gospodarki Wodnej-Państwowy Instytut Badawczy. Rocznik Meteorologiczny. 2020. Available online: https://danepubliczne.imgw.pl/data/dane_pomiarowo_obserwacyjne/Roczniki/Rocznik%20meteorologiczny/ (accessed on 20 April 2023).
- Zarząd Dróg i Transportu Miejskiego. Available online: https://www.zditm.szczecin.pl/storage/network-maps/dzienne.pdf (accessed on 14 January 2024).
- Google Maps. Available online: https://www.google.pl/maps (accessed on 10 January 2024).
- O Zarządzie Dróg i Transportu Miejskiego, Zarząd Dróg i Transportu Miejskiego. Available online: https://www.zditm.szczecin.pl/pl/zditm/o-zditm (accessed on 28 January 2024).
- Rozkłady Jazdy Według Linii, Zarząd Dróg i Transportu Miejskiego. Available online: https://www.zditm.szczecin.pl/pl/pasazer/rozklady-jazdy,wedlug-linii (accessed on 28 January 2024).
- Wolnowska, A.; Rymer, W. The role of city bicycles in the public transport in Szczecin. Studia Miej. 2016, 23, 145–157. [Google Scholar]
- Nieruchomości i Opłaty Lokalne. Statystyki 2014–2020. Unpublished data.
- Szczecin Aktualności. Available online: https://spp.szczecin.pl/aktualnosci/mozna-juz-sie-rejestrowac-w-bikes (accessed on 14 January 2024).
- Ustawa z Dnia 11 Stycznia 2018 r. o Zmianie Niektórych Ustaw w Celu Zwiększenia Udziału Obywateli w Procesie Wybierania, Funkcjonowania i Kontrolowania Niektórych Organów Publicznych (Dz. U. z 2018 r. Poz. 130). Available online: https://isap.sejm.gov.pl/isap.nsf/DocDetails.xsp?id=WDU20180000130 (accessed on 21 January 2024).
- Kempa, J.; Kozłowski, R. Participatory budget as a tool supporting the development of civil society in Poland. NISPAcee J. Public Adm. Policy 2020, 13, 61–79. [Google Scholar] [CrossRef]
- Kraszewski, D.; Mojkowski, K. Budżet Obywatelski w Polsce; Fundacja im; Stefana Batorego: Warszawa, Poland, 2014; p. 20. [Google Scholar]
- Informacja o Wynikach Kontroli. Funkcjonowanie Budżetów Partycypacyjnych (Obywatelskich). Nr Ewid. 20/2019/P/18/064/LGD. Available online: https://www.nik.gov.pl/kontrole/wyniki-kontroli-nik/kontrole,19361.html (accessed on 28 January 2024).
- Wójkowski, G.; Ginejko, K. Raport Końcowy z Ewaluacji Procesu Wdrażania Szczecińskiego Budżetu Obywatelskiego 2024. Stowarzyszenie Aktywności Obywatelskiej BONA FIDES, 2023. Available online: https://sbo.szczecin.eu/sites/default/files/2024-01/Raport%20BO%20Szczecin%202024.pdf (accessed on 20 January 2024).
- Zarządzenie Nr 455/17 Prezydenta Miasta Szczecin z Dnia 19 Października 2017 r. w Sprawie Zasad Obsługi Głosowania Oraz Sposobu Weryfikacji Głosów w Ramach Konsultacji Społecznych—Szczeciński Budżet Obywatelski 2018 (.pdf, 1.96 MB). Available online: https://bip.um.szczecin.pl/chapter_131087.asp?soid=62E148C9EF794A07923BEABA799A07C1 (accessed on 20 January 2024).
- Zarządzenie Nr 179/18 PMS z Dnia 25 Kwietnia 2018 r. w Sprawie Wysokości Wydatków Inwestycyjnych Budżetu Miasta Szczecin Oraz Wzoru Formularza Zgłoszeniowego w Ramach Konsultacji Społecznych—Szczeciński Budżet Obywatelski 2019 .pdf, 881 KB. Available online: https://konsultuj.szczecin.pl/konsultacje/chapter_116233.asp (accessed on 20 January 2024).
- Zarządzenie nr 526/19 Prezydenta Miasta Szczecin z Dnia 6 Grudnia 2019 r. Zmieniające Zarządzenie w Sprawie Głosowania Na Projekty Zgłoszone Do Szczecińskiego Budżetu Obywatelskiego 2020 (.pdf, 187 KB). Available online: https://konsultuj.szczecin.pl/konsultacje/files/3A5FAEBB29894D4E95C1D768334CCEA4/Zarzadzenie_Prezydenta_526.pdf (accessed on 20 January 2024).
- Zarządzenie Nr 257/23 Prezydenta Miasta Szczecin z Dnia 29 Maja 2023 r. w Sprawie Zasad Losowania i Naboru Do Rady Ds. Budżetu Obywatelskiego Oraz Komisji Odwoławczej, Ogłoszenia Naboru Oraz Regulaminu Funkcjonowania Rady i Komisji. Available online: https://sbo.szczecin.eu/sites/default/files/2023-06/Zarz%C4%85dzenie%20nr%20257%20ws.%20naboru%20do%20Rady%20i%20Komisji%20Podpisane%20%284%29.pdf (accessed on 20 January 2024).
- Wolnowska, A.E.; Kasyk, L. Ways Residents of Large Cities in Poland, Commute before and during the COVID-19 Pandemic. Eur. Res. Stud. J. 2021, 3B, 24. [Google Scholar]
- Al-Salih, W.Q.; Esztergár-Kiss, D. Linking Mode Choice with Travel Behavior by Using Logit Model Based on Utility Function. Sustainability 2021, 13, 4332. [Google Scholar] [CrossRef]
- Ovchinnikova, O.M.; Frantsuzskaya, E.O.; Lutoshkina, O.S. Meta Plan-based Development of Speaking Skills. In Procedia—Social and Behavioral Sciences; Elsevier: London, UK, 2015; Volume 200, pp. 624–630. [Google Scholar] [CrossRef]
- Wolnowska, A.E.; Kasyk, L. Transport Preferences of City Residents in the Context of Urban Mobility and Sustainable Development. Energies 2022, 15, 5692. [Google Scholar] [CrossRef]
- Szczeciński Budżet Obywatelski. Available online: https://sbo.szczecin.eu/szczecinski-budzet-obywatelski (accessed on 5 January 2024).
- Szczeciński Budżet Obywatelski. Available online: https://sbo.szczecin.eu/archiwum-sbo-2021 (accessed on 5 January 2024).
- Transport for London. Travel in London Report 4. 2011. Available online: http://www.tfl.gov.uk/cdn/static/cms/documents/travel-in-london-report-4.pdf (accessed on 5 January 2024).
- Wang, H.; Robert, B. Noland, Bikeshare and subway ridership changes during the COVID-19 pandemic in New York City. Transp. Policy 2021, 106, 262–270. [Google Scholar] [CrossRef] [PubMed]
- Feng, D.; Cheng, L.; Du, M. Exploring the impact of dockless bikeshare on docked bikeshare—A case study in London. Sustainability 2020, 12, 6110. [Google Scholar] [CrossRef]
- Bhandal, J.; Noonan, R.J. Motivations, perceptions and experiences of cycling for transport: A photovoice study. J. Transp. Health 2022, 25, 101341. [Google Scholar] [CrossRef]
- Goldmann, K.; Wessel, J. Some people feel the rain, others just get wet: An analysis of regional differences in the effects of weather on cycling. Res. Transp. Bus. Manag. 2021, 40, 100541. [Google Scholar] [CrossRef]
- Li, D.; Lin, C.; Gao, W.; Gao, Y.; Gao, J.; Xia, W. Short-term IoT data forecast of urban public bicycle based on the DBSCAN-TCN model for social governance. Wirel. Commun. Mob. Comput. 2021, 2021, 9488369. [Google Scholar] [CrossRef]
- Chiariotti, F.; Pielli, C.; Zanella, A.; Zorzi, M. A dynamic approach to rebalancing bike-sharing systems. Sensors 2018, 18, 512. [Google Scholar] [CrossRef] [PubMed]
- Ma, X.; Ji, Y.; Yuan, Y.; Oort, N.V.; Jin, Y.; Hoogendoorn, S.P. A comparison in travel patterns and determinants of user demand between docked and dockless bike-sharing systems using multi-sourced data. Transp. Res. Part A Policy Pract. 2020, 139, 148–173. [Google Scholar] [CrossRef]
- He, Y.; Song, Z.; Liu, Z.; Sze, N. Factors influencing electric bike share ridership: Analysis of park city, Utah. Transp. Res. Rec. J. Transp. Res. Board 2019, 2673, 12–22. [Google Scholar] [CrossRef]
- Wang, X.; Lindsey, G.; Schoner, J.; Harrison, A. Modeling bike share station activity: Effects of nearby businesses and jobs on trips to and from stations. J. Urban Plan. Dev. 2016, 142, 04015001. [Google Scholar] [CrossRef]
- Gervini, D.; Khanal, M. Exploring patterns of demand in bike sharing systems via replicated point process models. J. R. Stat. Soc. Ser. C Appl. Stat. 2018, 68, 585–602. [Google Scholar] [CrossRef]
- Basak, E.; Balawi, R.; Fatemi, S.; Tafti, A. When crisis hits: Bike-sharing platforms amid the COVID-19 pandemic. PLoS ONE 2023, 18, e0283603. [Google Scholar] [CrossRef] [PubMed]
- Bucsky, P. Modal share changes due to COVID-19: The case of Budapest. Transp. Res. Interdiscip. Perspect. 2020, 11, 100141. [Google Scholar] [CrossRef] [PubMed]
- Kubaľák, S.; Kalašová, A.; Hájnik, A. The Bike-Sharing System in Slovakia and the Impact of COVID-19 on This Shared Mobility Service in a Selected City. Sustainability 2021, 13, 6544. [Google Scholar] [CrossRef]
- Cabannes, Y. The impact of participatory budgeting on basic services: Municipal practices and evidence from the field. Environ. Urban. 2015, 27, 257–284. [Google Scholar] [CrossRef]
- Menendez-Blanco, M.; Bjørn, P. Designing digital participatory budgeting platforms: Urban biking activism in Madrid. Comput. Support. Coop. Work 2022, 31, 567–601. [Google Scholar] [CrossRef]
Figure 1.
The number of bicycles in bicycle systems in individual voivodeships in Poland. Source: Own elaboration based on GUS data [53] (accessed: 5 January 2024).
Figure 1.
The number of bicycles in bicycle systems in individual voivodeships in Poland. Source: Own elaboration based on GUS data [53] (accessed: 5 January 2024).

Figure 2.
The number of bicycles in bicycle systems in individual cities in Poland in 2022. Source: Own elaboration based on GUS data [53] (accessed: 5 January 2024).
Figure 2.
The number of bicycles in bicycle systems in individual cities in Poland in 2022. Source: Own elaboration based on GUS data [53] (accessed: 5 January 2024).

Figure 3.
The number of bicycle rentals in bicycle systems in selected cities in Poland in 2022. Source: Own elaboration based on GUS data [53] (accessed: 5 January 2024).
Figure 3.
The number of bicycle rentals in bicycle systems in selected cities in Poland in 2022. Source: Own elaboration based on GUS data [53] (accessed: 5 January 2024).

Figure 4.
Comparison of bicycle paths in selected cities in Poland from 2018 to 2022. Source: Own elaboration based on GUS data [53] (accessed: 5 January 2024).
Figure 4.
Comparison of bicycle paths in selected cities in Poland from 2018 to 2022. Source: Own elaboration based on GUS data [53] (accessed: 5 January 2024).

Figure 5.
Diagram of the daily communication network. Source: [57] (accessed: 27 January 2024).
Figure 5.
Diagram of the daily communication network. Source: [57] (accessed: 27 January 2024).

Figure 6.
City bike parking zones Source: Own elaboration based on [58] (accessed: 27 January 2024).
Figure 6.
City bike parking zones Source: Own elaboration based on [58] (accessed: 27 January 2024).

Figure 8.
Research methodology. Source: Own elaboration.

Figure 9.
Percentage of users declaring commuting to work or school by a specific means of transportation.
Figure 9.
Percentage of users declaring commuting to work or school by a specific means of transportation.

Figure 10.
Percentage of users declaring the choice of means of transportation in different directions.
Figure 10.
Percentage of users declaring the choice of means of transportation in different directions.

Figure 11.
Percentage of users declaring the choice of an eco-friendly means of transportation in different directions.
Figure 11.
Percentage of users declaring the choice of an eco-friendly means of transportation in different directions.

Figure 12.
Percentage of residents declaring the frequency of choosing a micromobility means.

Figure 13.
Two-dimensional chart of profiles for the categories “frequency of bicycle usage” and “age”.
Figure 13.
Two-dimensional chart of profiles for the categories “frequency of bicycle usage” and “age”.

Figure 14.
Two-dimensional chart of profiles for the categories “frequency of bicycle usage” and “impact of cycling on life”.
Figure 14.
Two-dimensional chart of profiles for the categories “frequency of bicycle usage” and “impact of cycling on life”.

Figure 15.
Three-dimensional chart of profiles for the categories “frequency of bicycle usage” and “assessment of bicycle safety”.
Figure 15.
Three-dimensional chart of profiles for the categories “frequency of bicycle usage” and “assessment of bicycle safety”.

Figure 16.
One-dimensional chart of profiles for the categories “assessment of bicycle safety” and “occupation”.
Figure 16.
One-dimensional chart of profiles for the categories “assessment of bicycle safety” and “occupation”.

Figure 17.
Two-dimensional chart of profiles for the categories “assessment of bicycle safety” and “place of residence”.
Figure 17.
Two-dimensional chart of profiles for the categories “assessment of bicycle safety” and “place of residence”.

Figure 18.
Two-dimensional chart of profiles for the categories “assessment of bicycle availability” and “age”.
Figure 18.
Two-dimensional chart of profiles for the categories “assessment of bicycle availability” and “age”.

Figure 19.
One-dimensional chart of profiles for the categories “assessment of bicycle availability” and “education”.
Figure 19.
One-dimensional chart of profiles for the categories “assessment of bicycle availability” and “education”.

Figure 20.
Time series of the number of bike rentals in the years 2018–2020. Source: Own elaboration based on: [62].
Figure 20.
Time series of the number of bike rentals in the years 2018–2020. Source: Own elaboration based on: [62].

Figure 21.
Dynamics of changes in the average daily number of rentals in the years 2014–2020. Source: Own elaboration based on: [62].
Figure 21.
Dynamics of changes in the average daily number of rentals in the years 2014–2020. Source: Own elaboration based on: [62].

Figure 22.
Dynamics of changes in the annual number of rentals in the years 2014–2022. Source: Own elaboration based on: [55,62].

Figure 23.
Number of rentals in individual months of city bike operation. Source: Own elaboration based on: [62].
Figure 23.
Number of rentals in individual months of city bike operation. Source: Own elaboration based on: [62].

Figure 24.
Number of users in individual months of city bike operation. Source: Own elaboration based on [62].
Figure 24.
Number of users in individual months of city bike operation. Source: Own elaboration based on [62].

Figure 25.
Variation in the daily number of rentals in individual months of the years 2018–2019. Source: Own elaboration based on [62].
Figure 25.
Variation in the daily number of rentals in individual months of the years 2018–2019. Source: Own elaboration based on [62].

Figure 26.
Average daily number of rentals on individual days of the week with a 0.95 confidence interval. Source: Own elaboration based on [62].
Figure 26.
Average daily number of rentals on individual days of the week with a 0.95 confidence interval. Source: Own elaboration based on [62].

Figure 27.
Number of rentals at individual stations. Source: Own elaboration based on [62].
Figure 27.
Number of rentals at individual stations. Source: Own elaboration based on [62].

Figure 28.
Distribution of the most popular SRM stations in the center of Szczecin. Source: Own elaboration based on [62].
Figure 28.
Distribution of the most popular SRM stations in the center of Szczecin. Source: Own elaboration based on [62].

Figure 29.
Survey Results for meta plan. Source: Own elaboration.

Figure 30.
Meta plan for bikesharing in Szczecin. Source: Own elaboration.


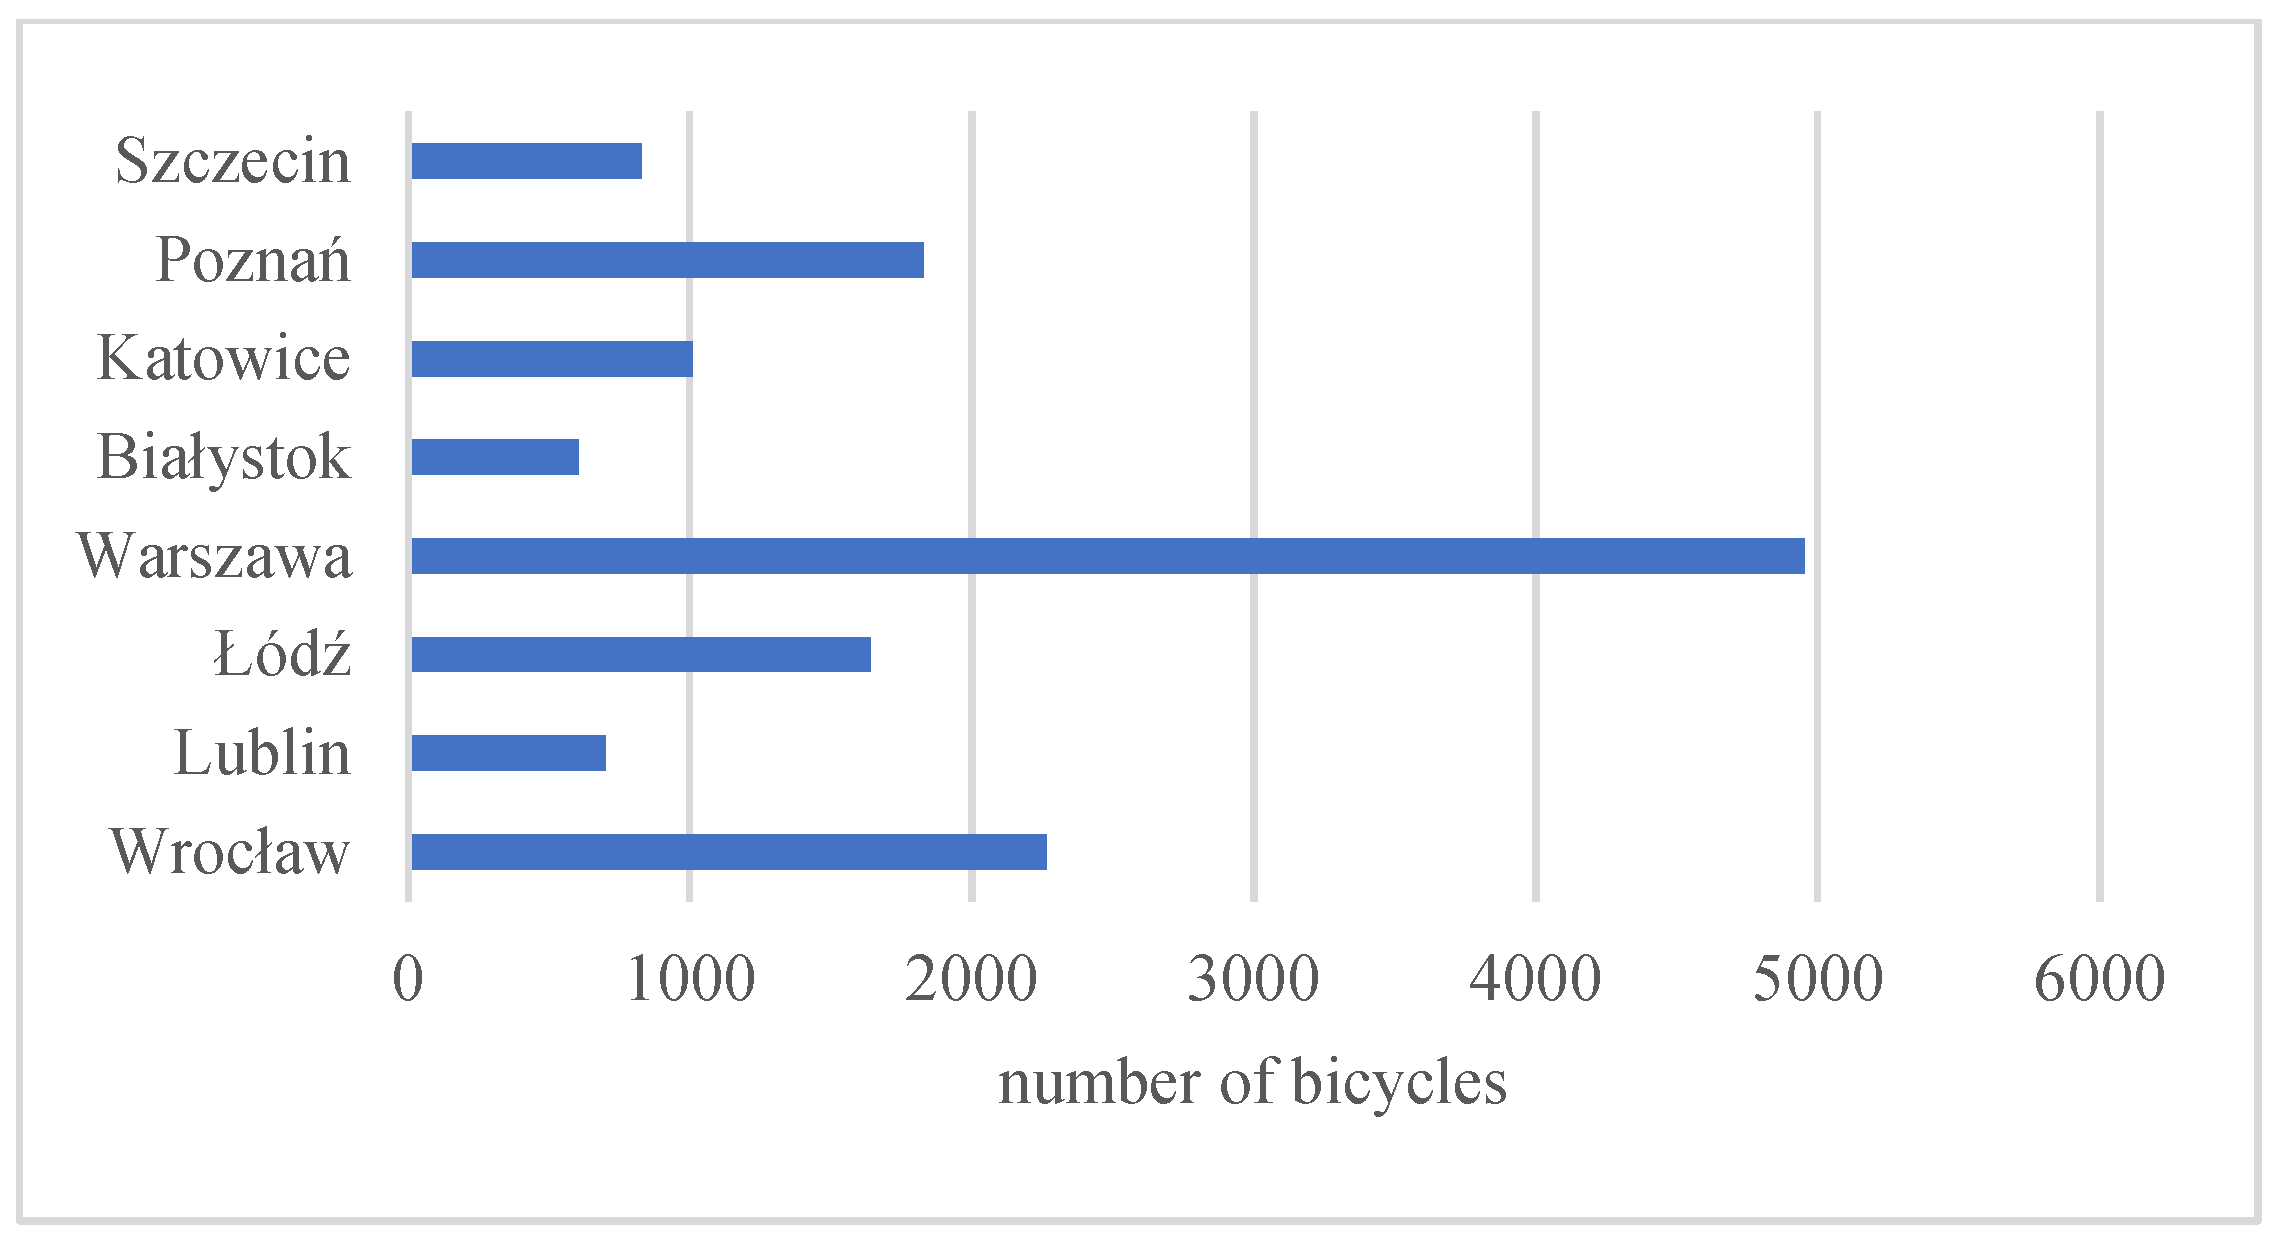
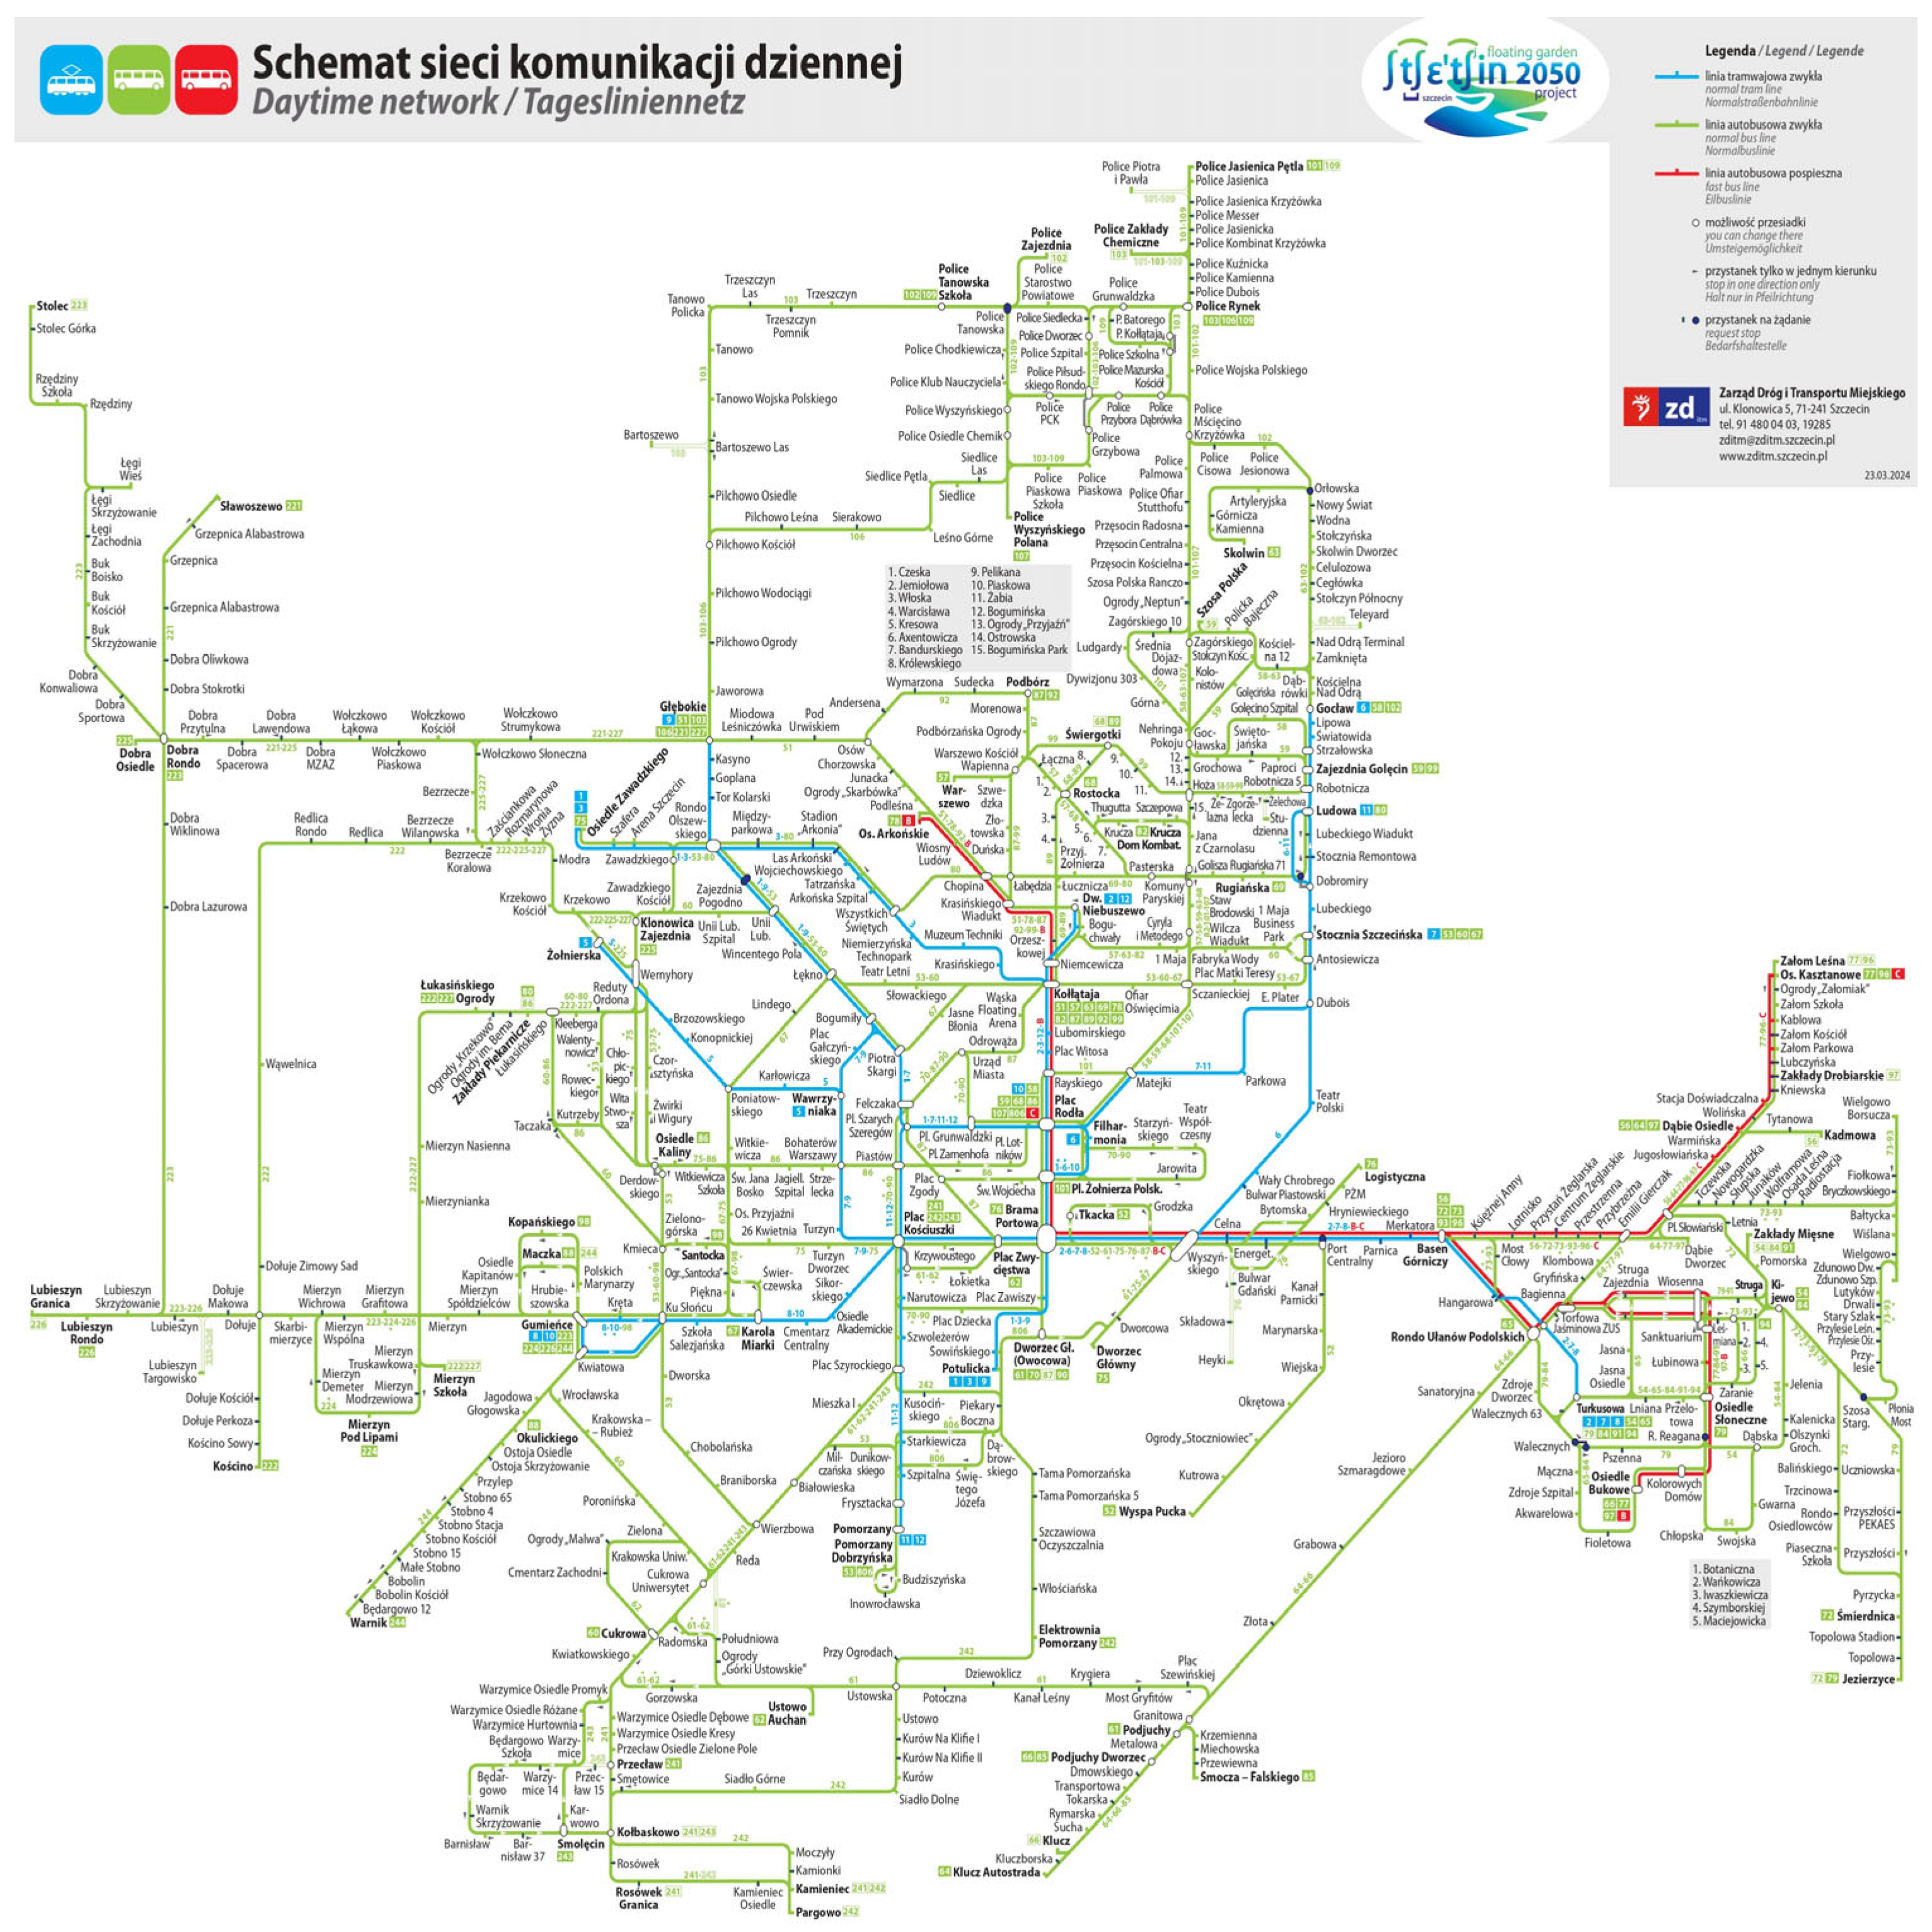
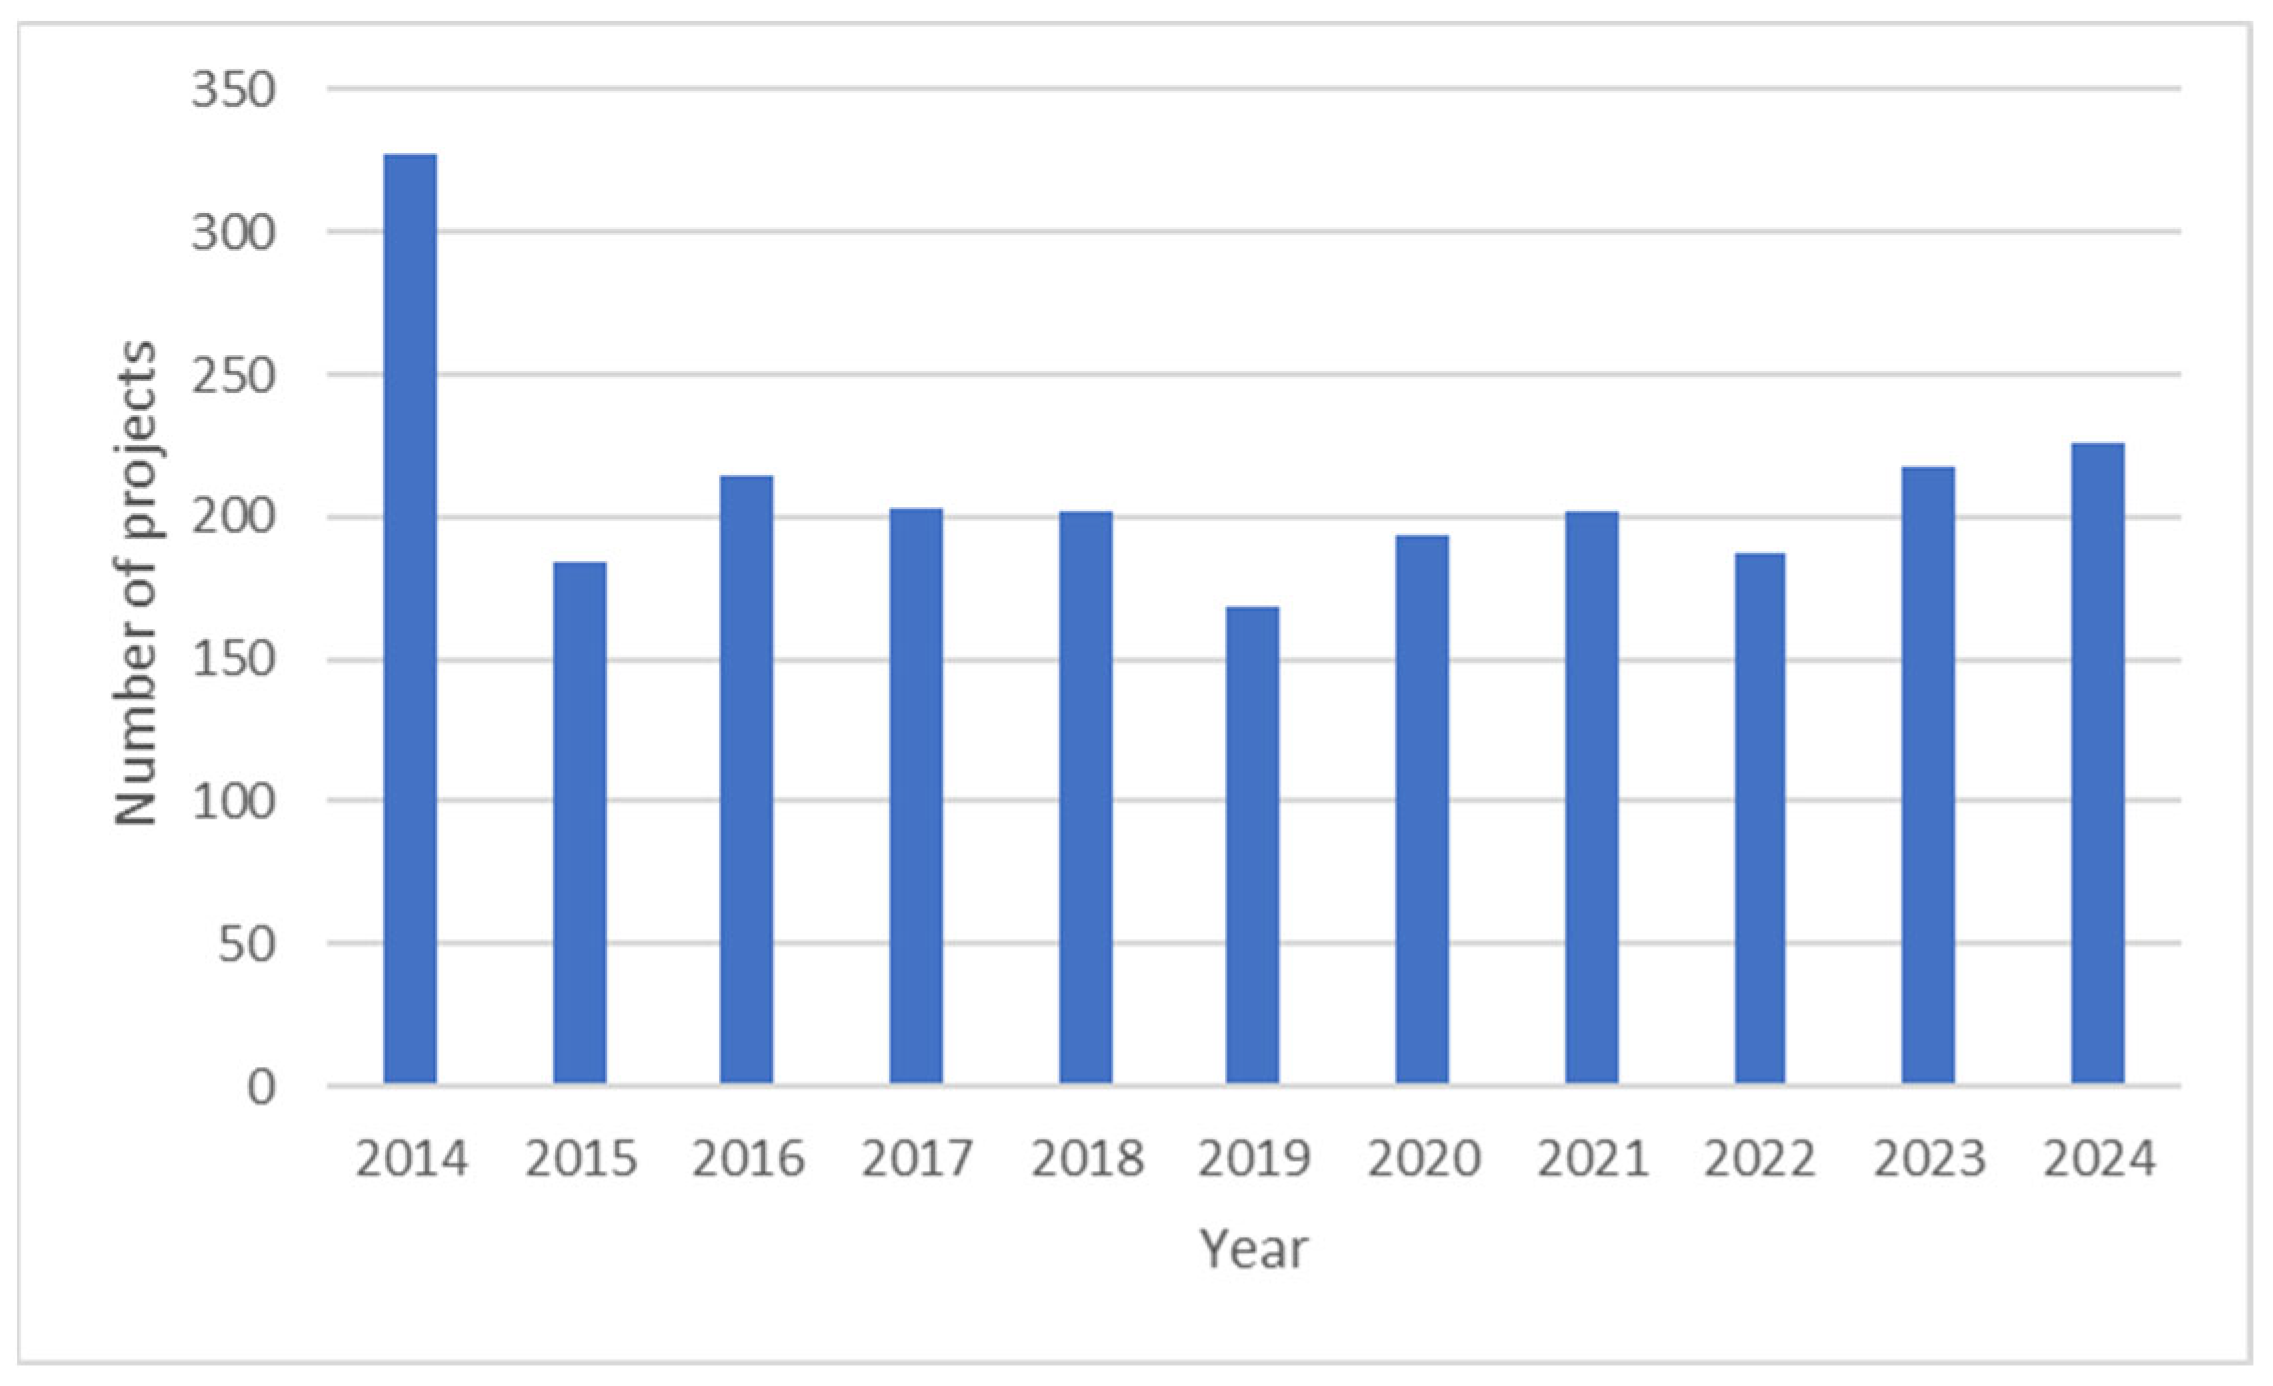
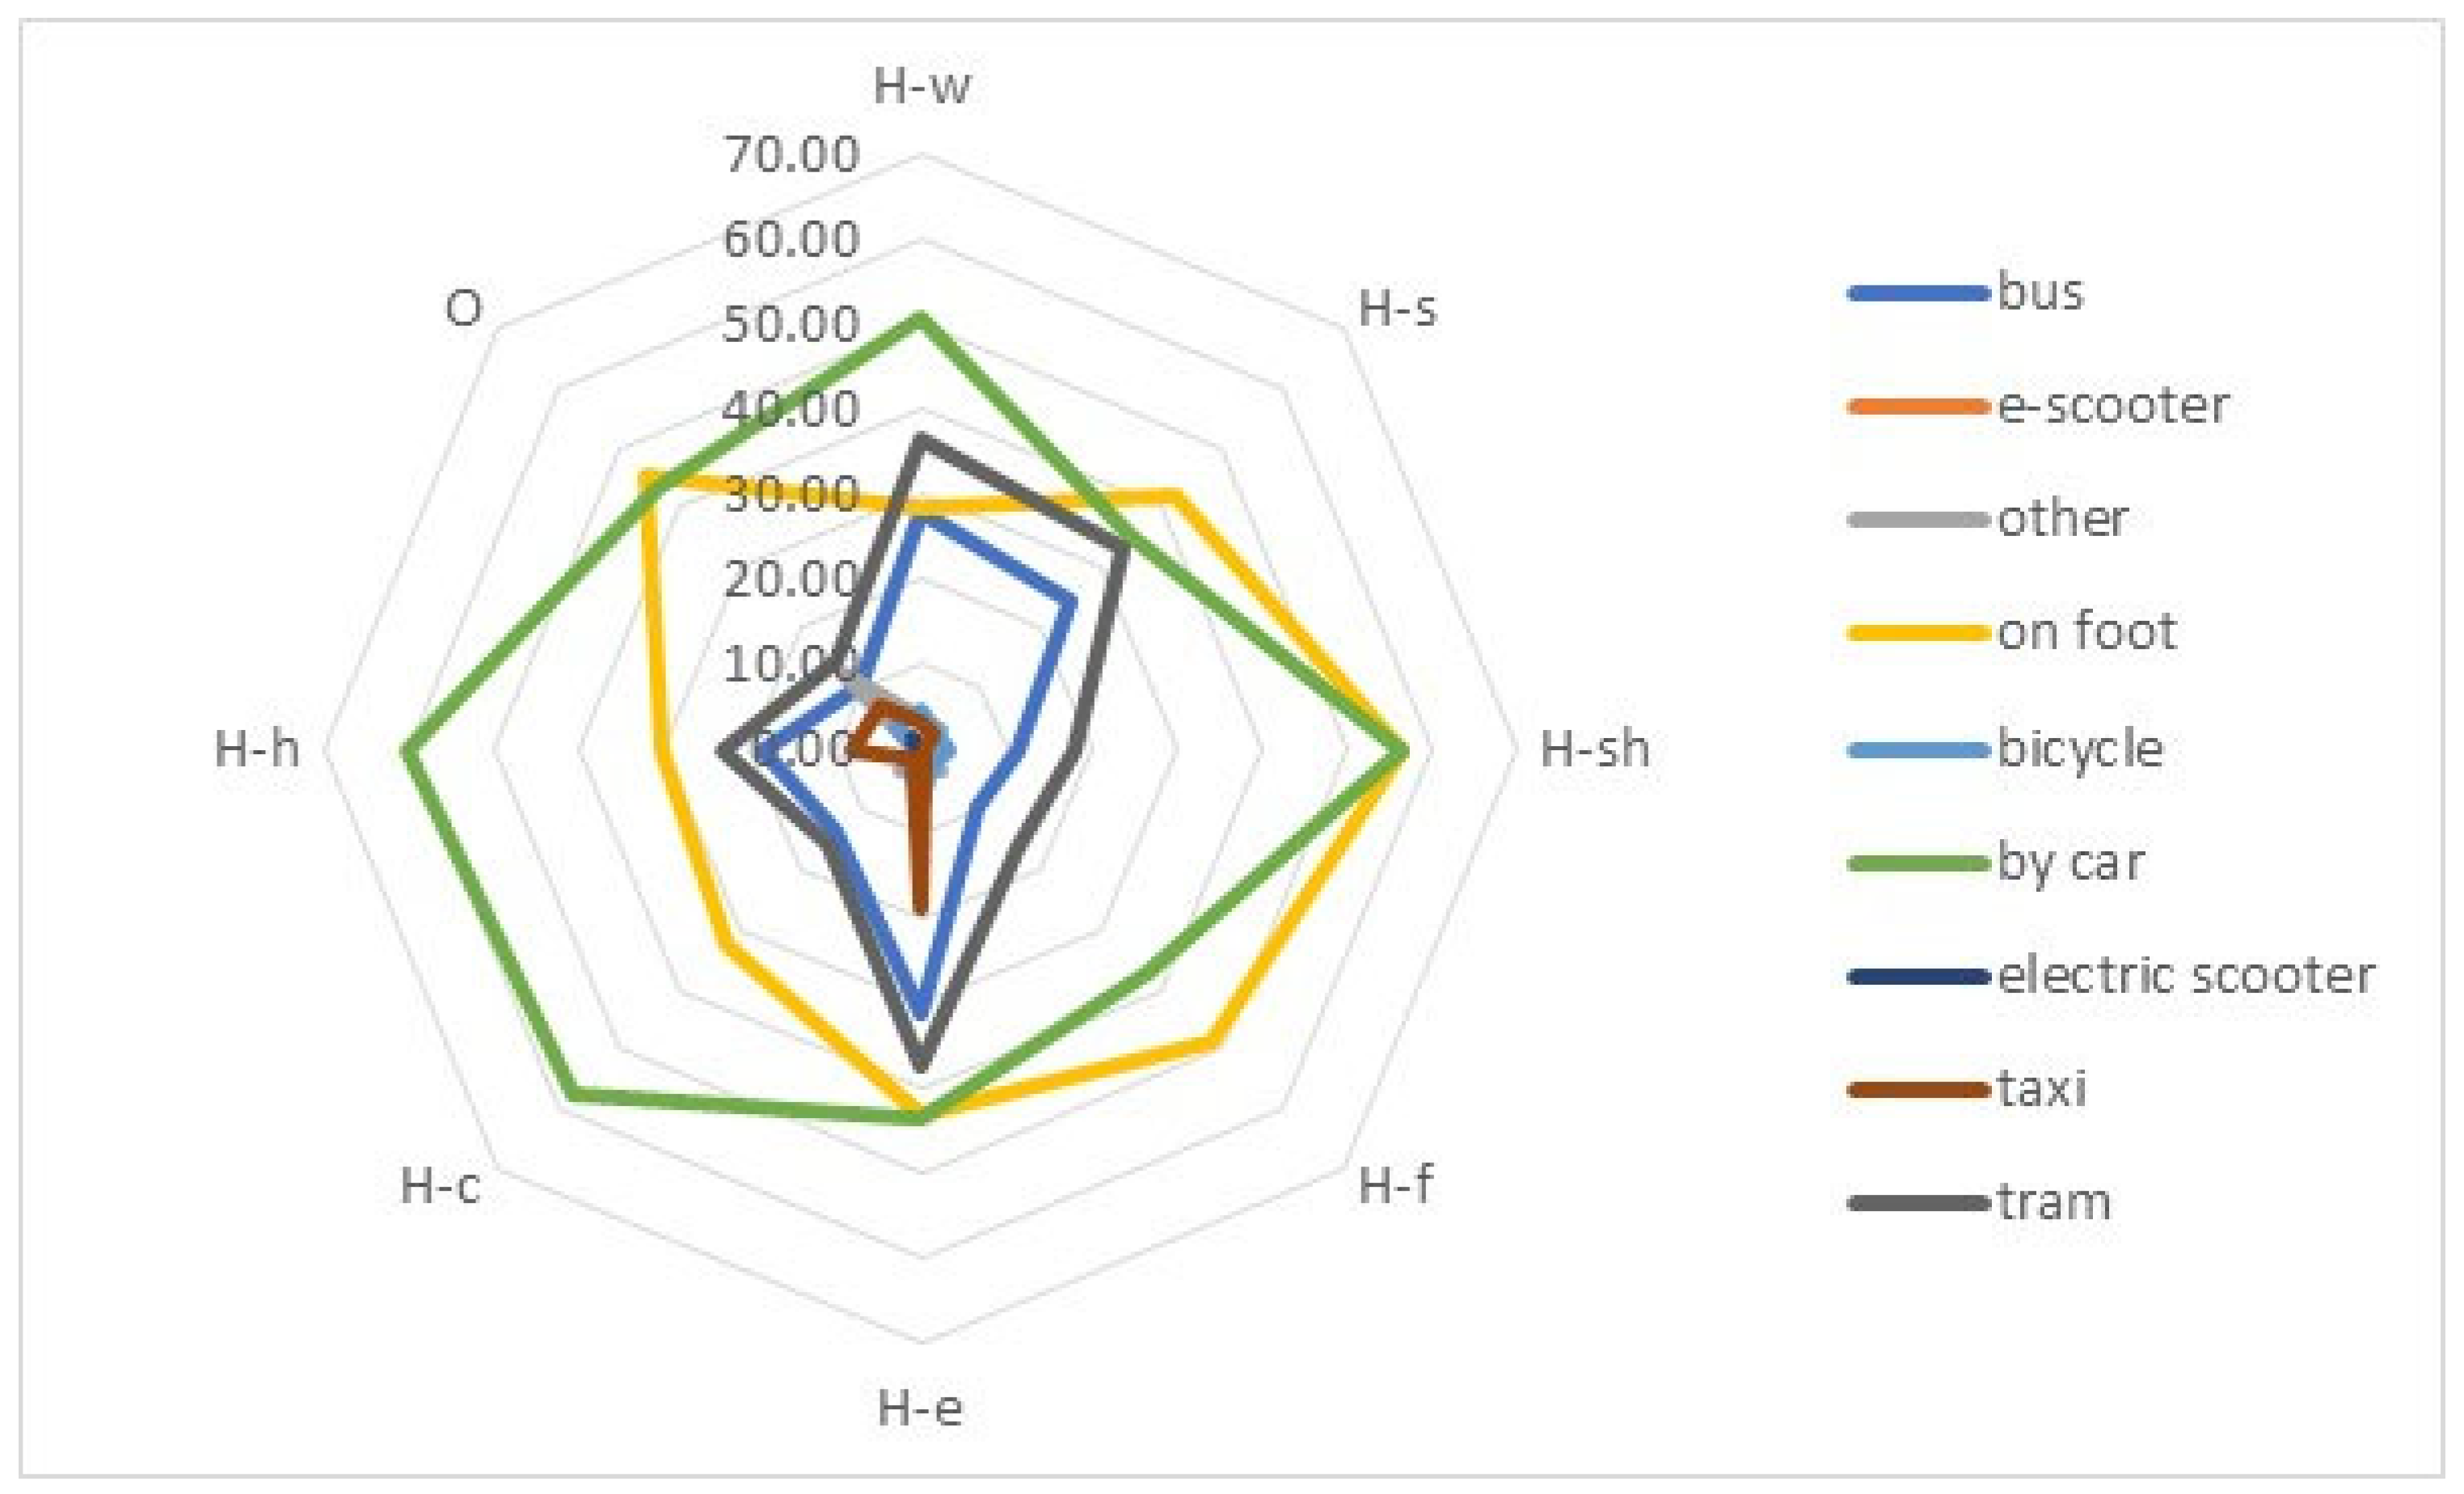
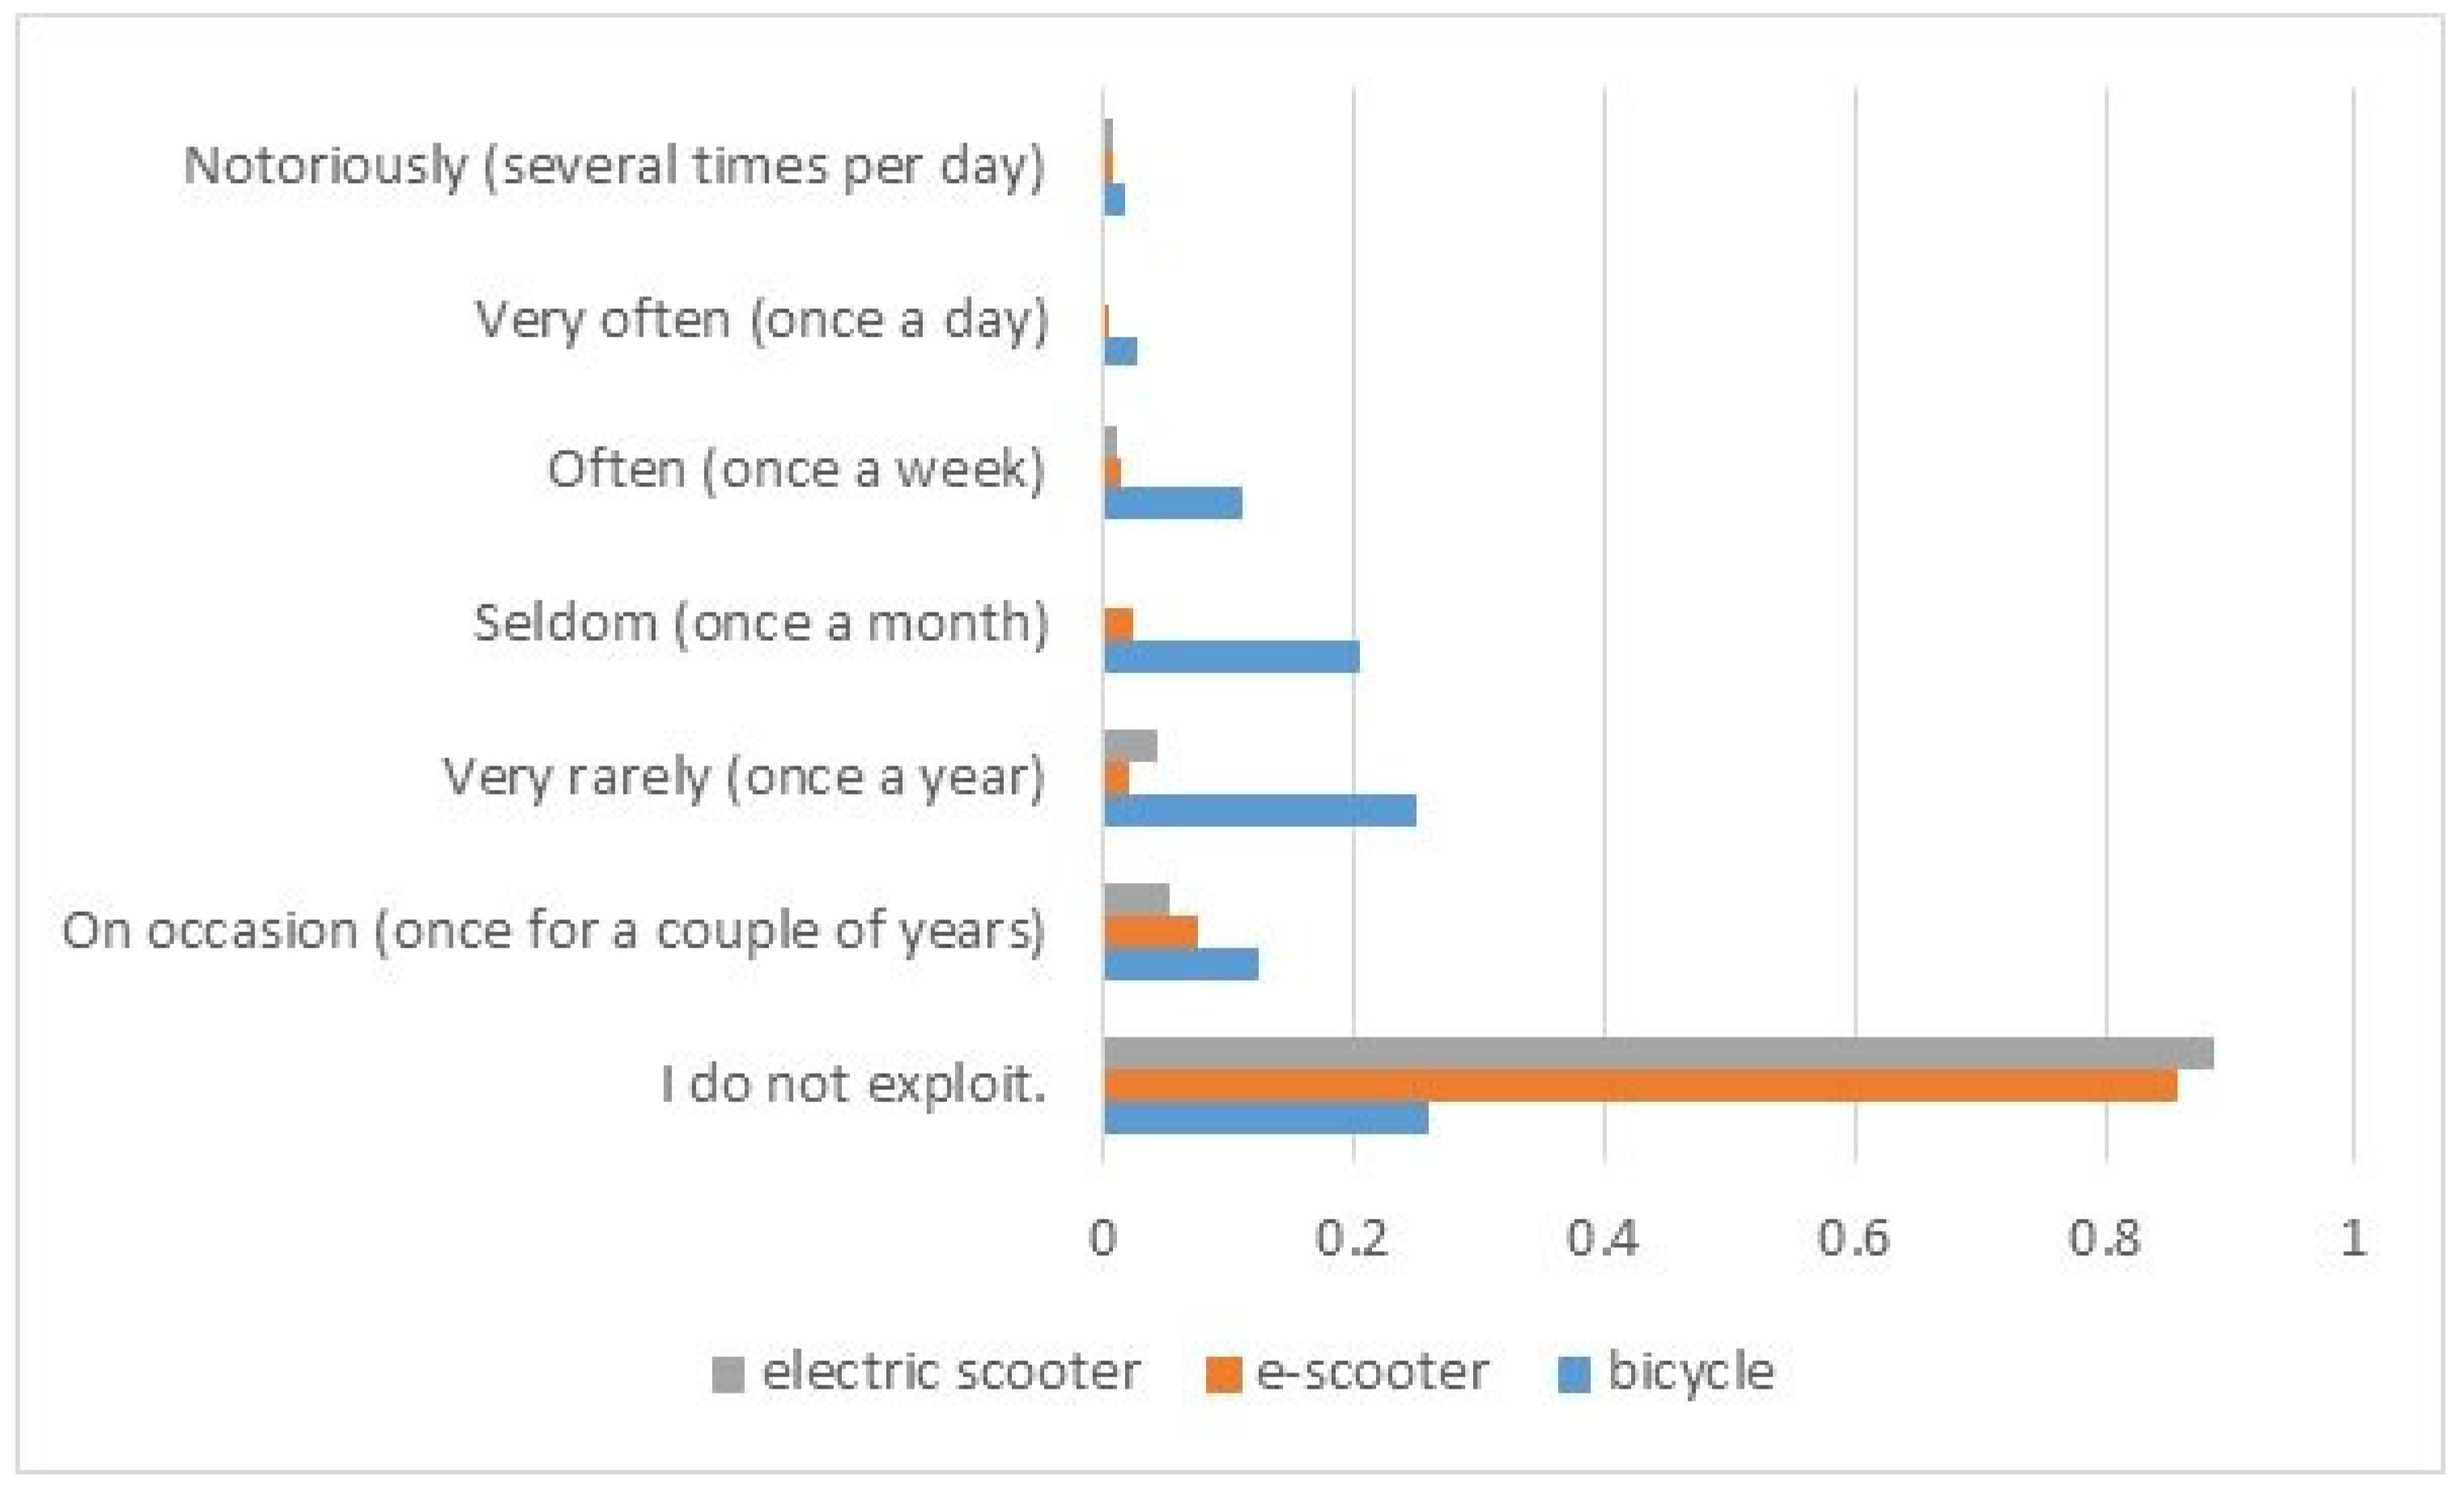
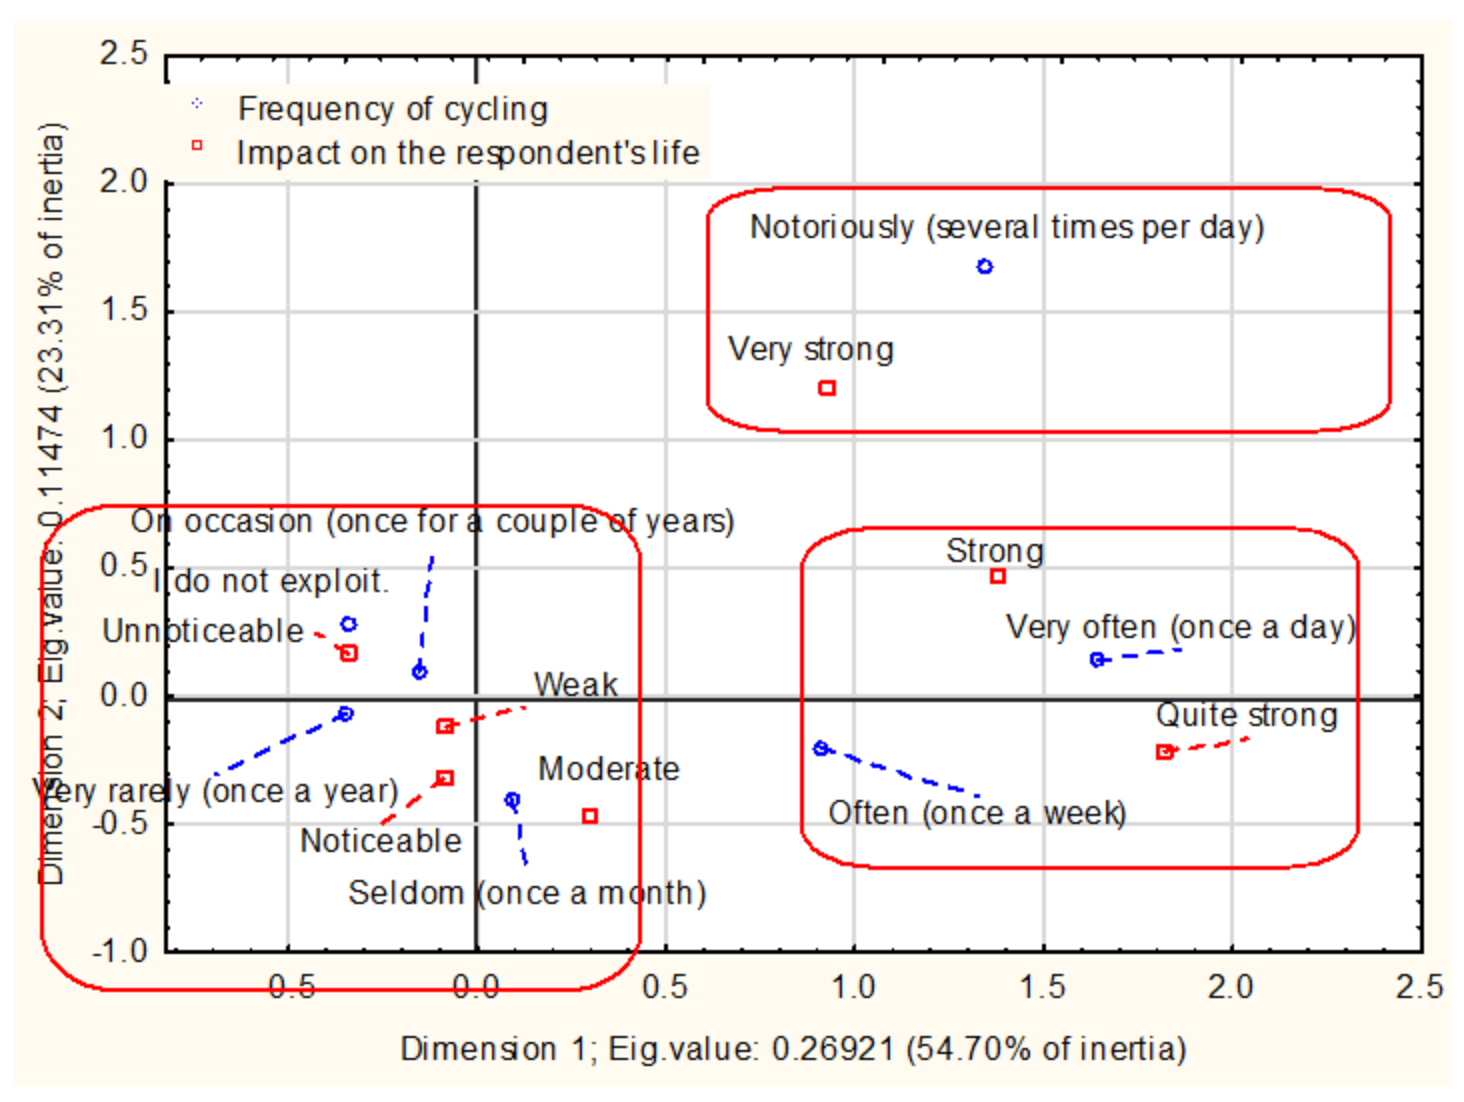
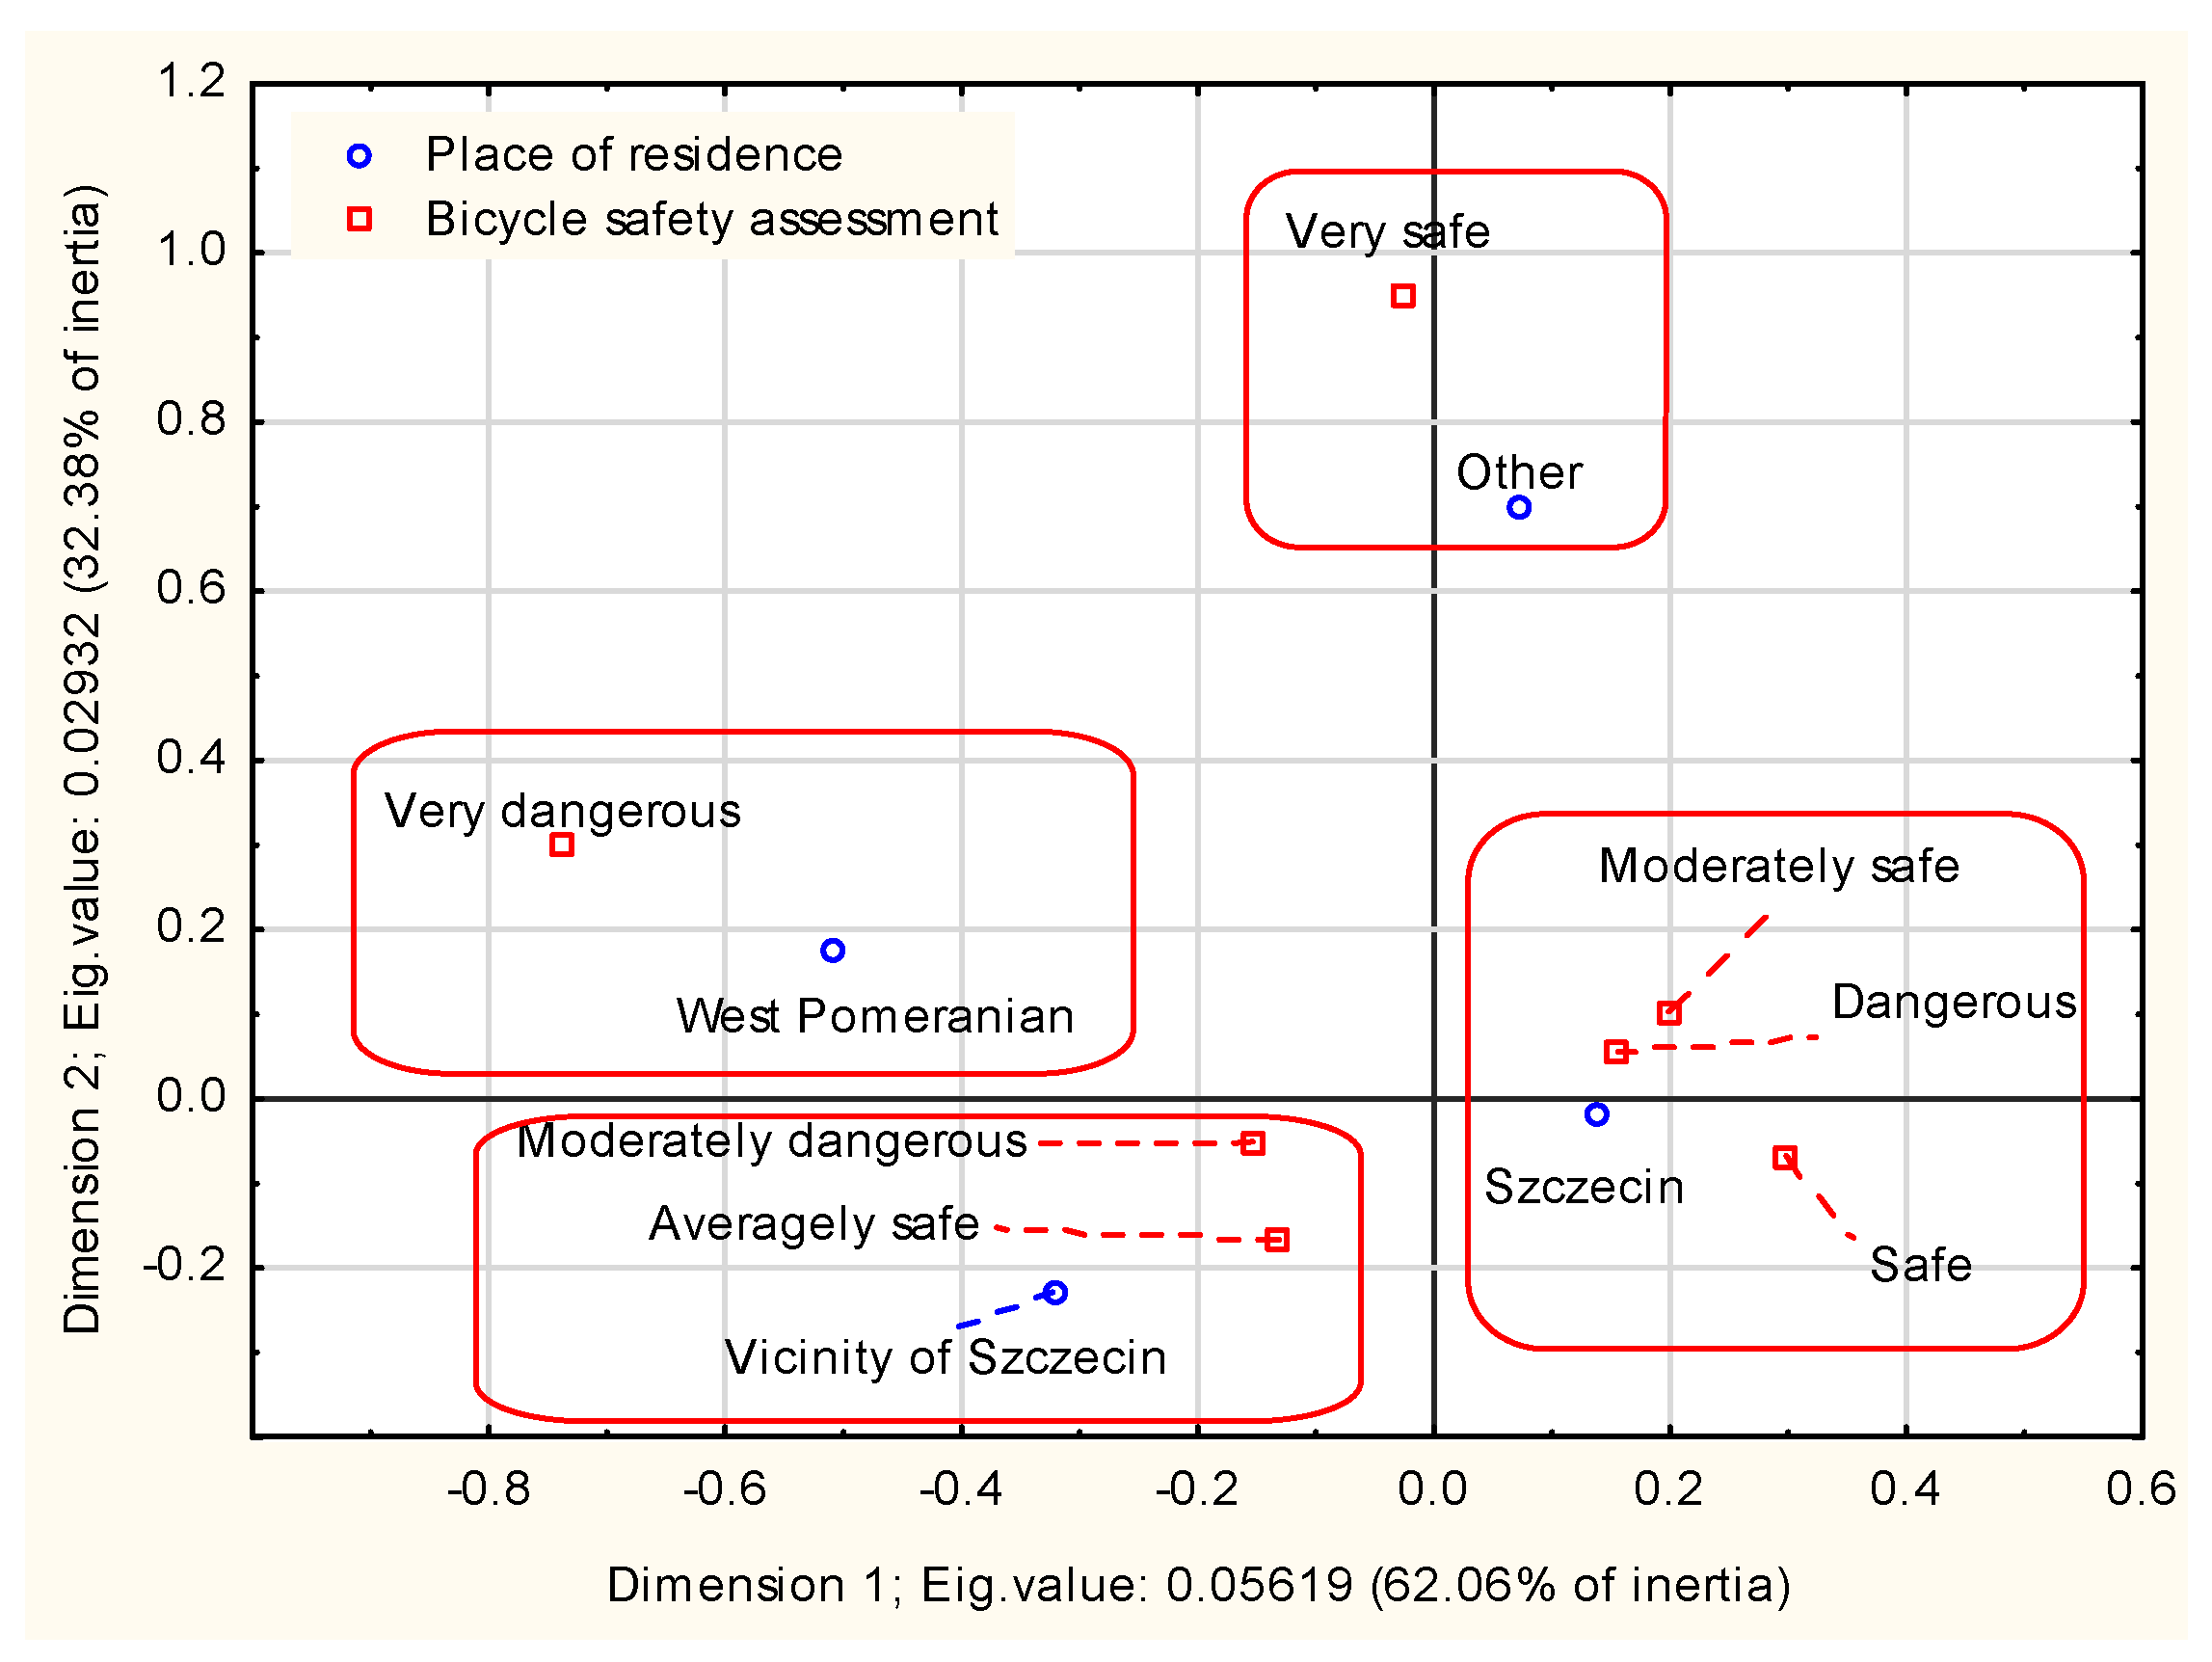
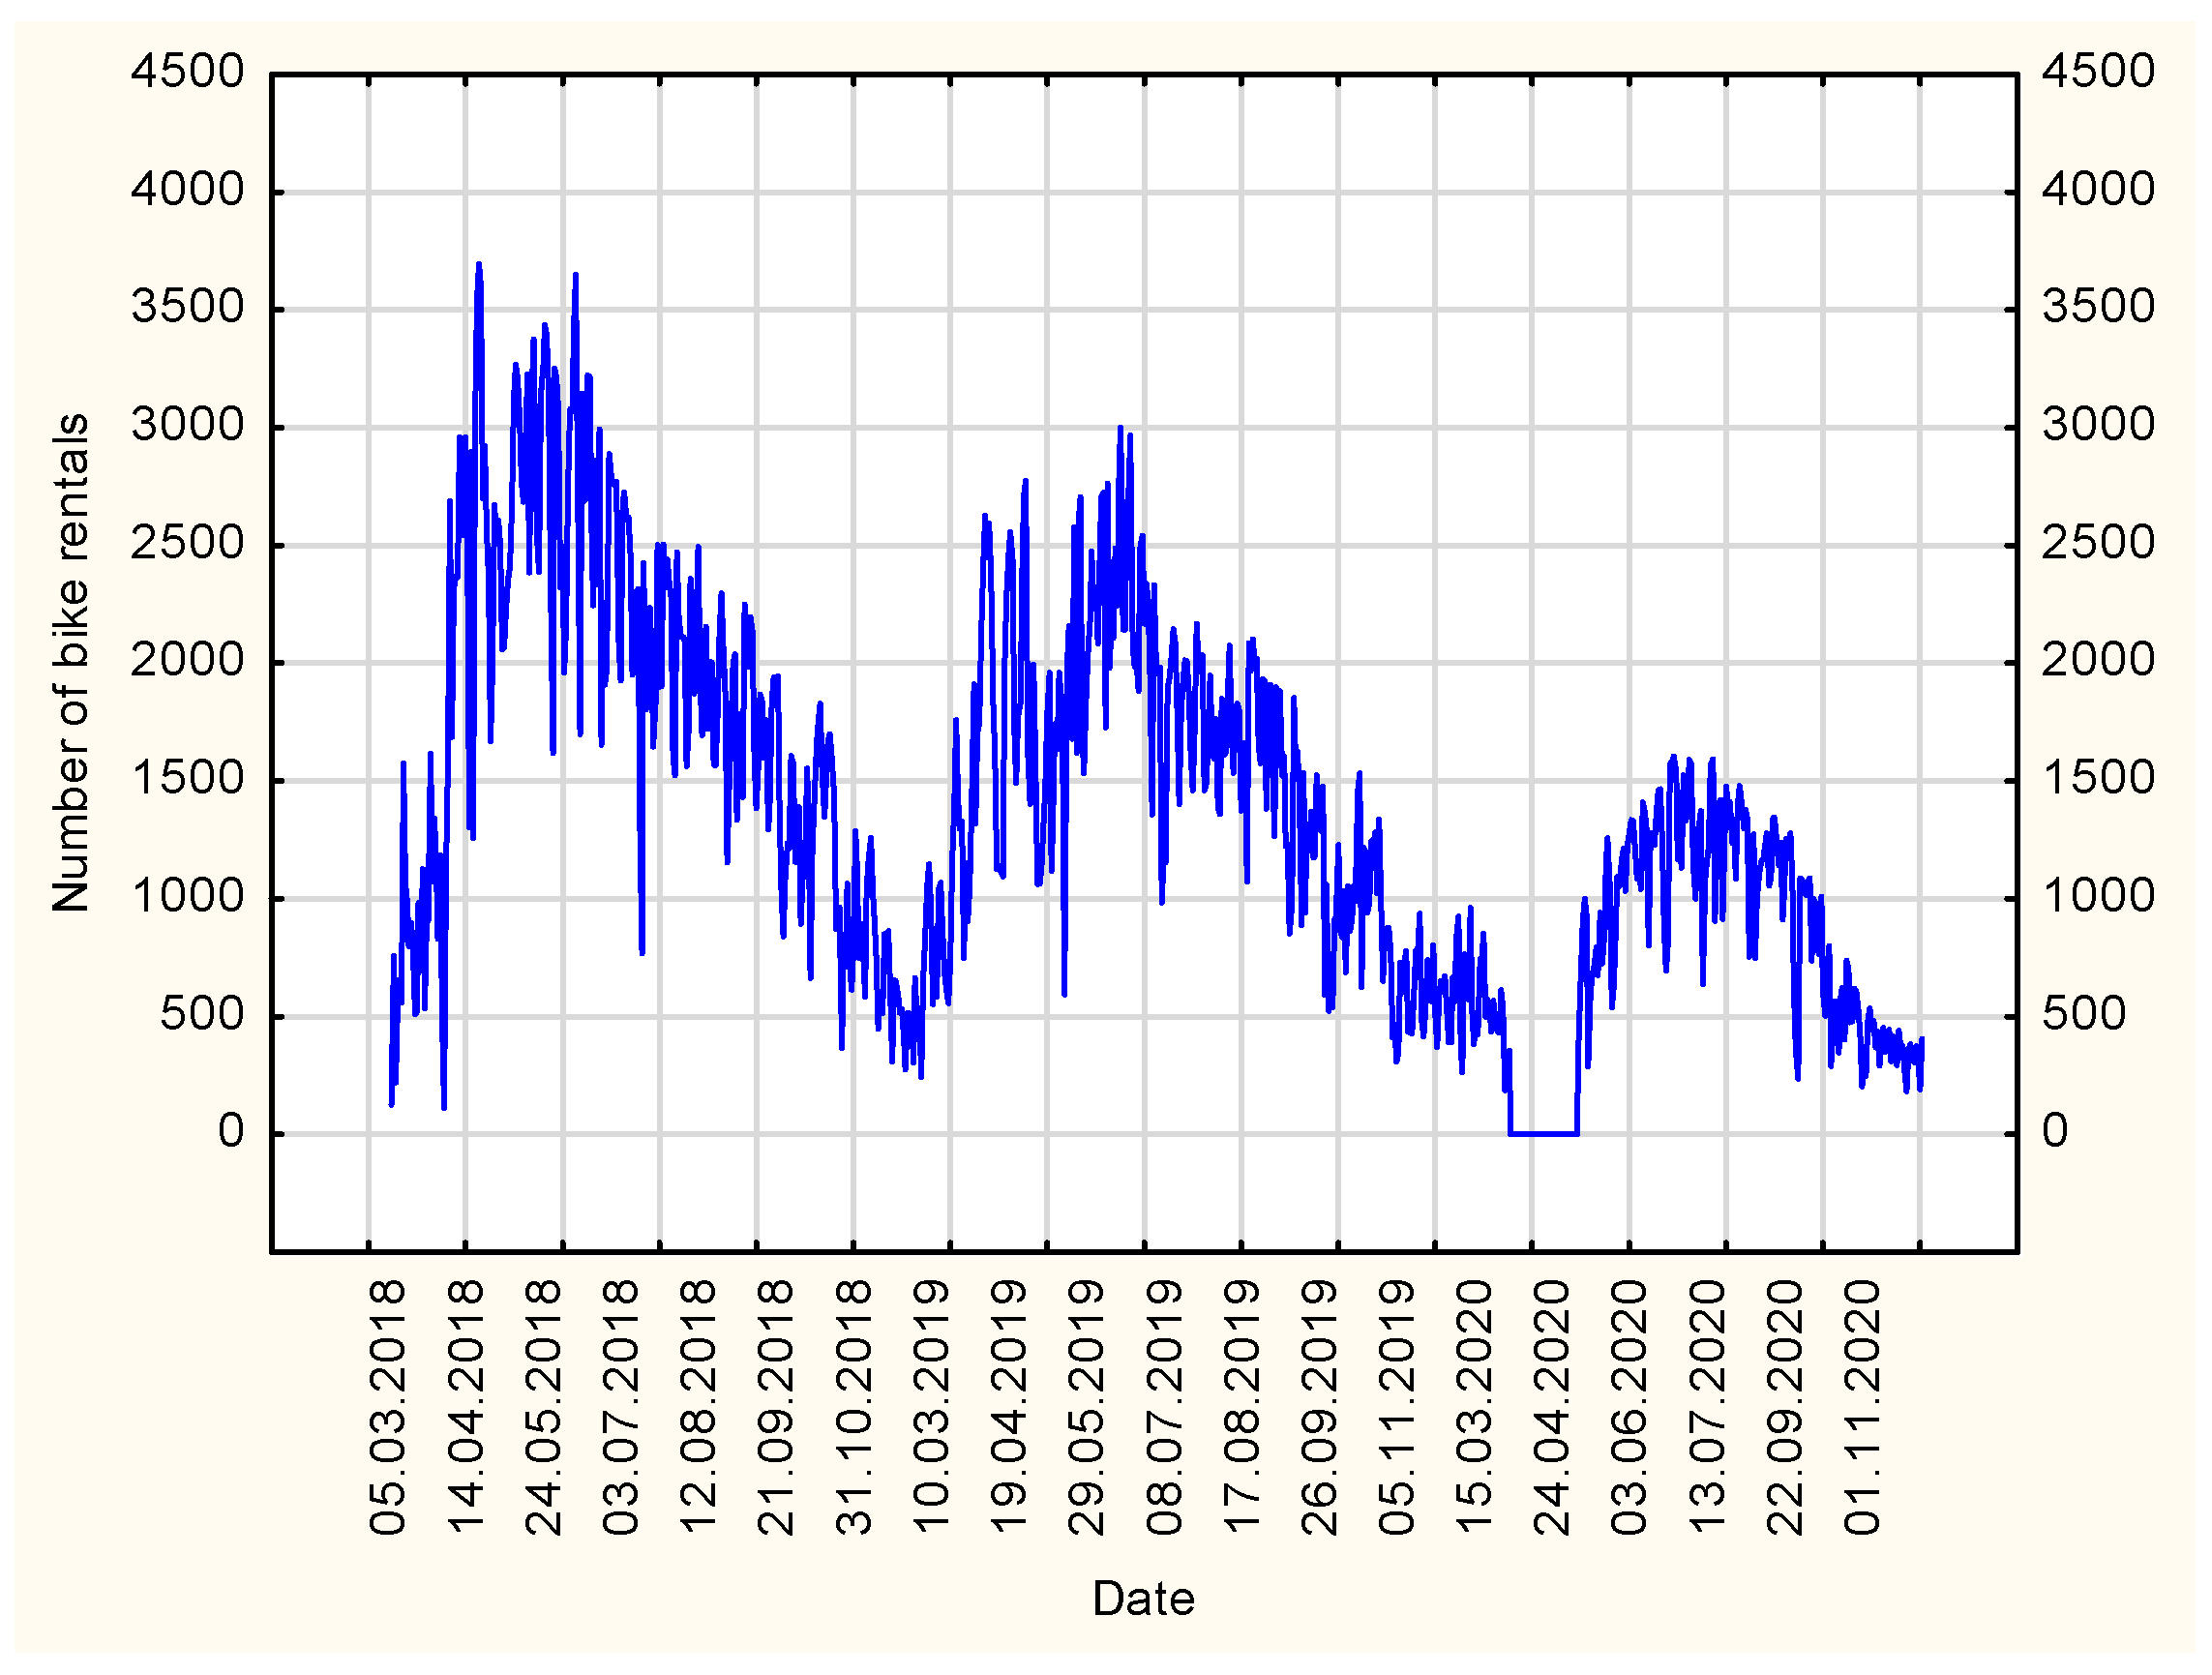
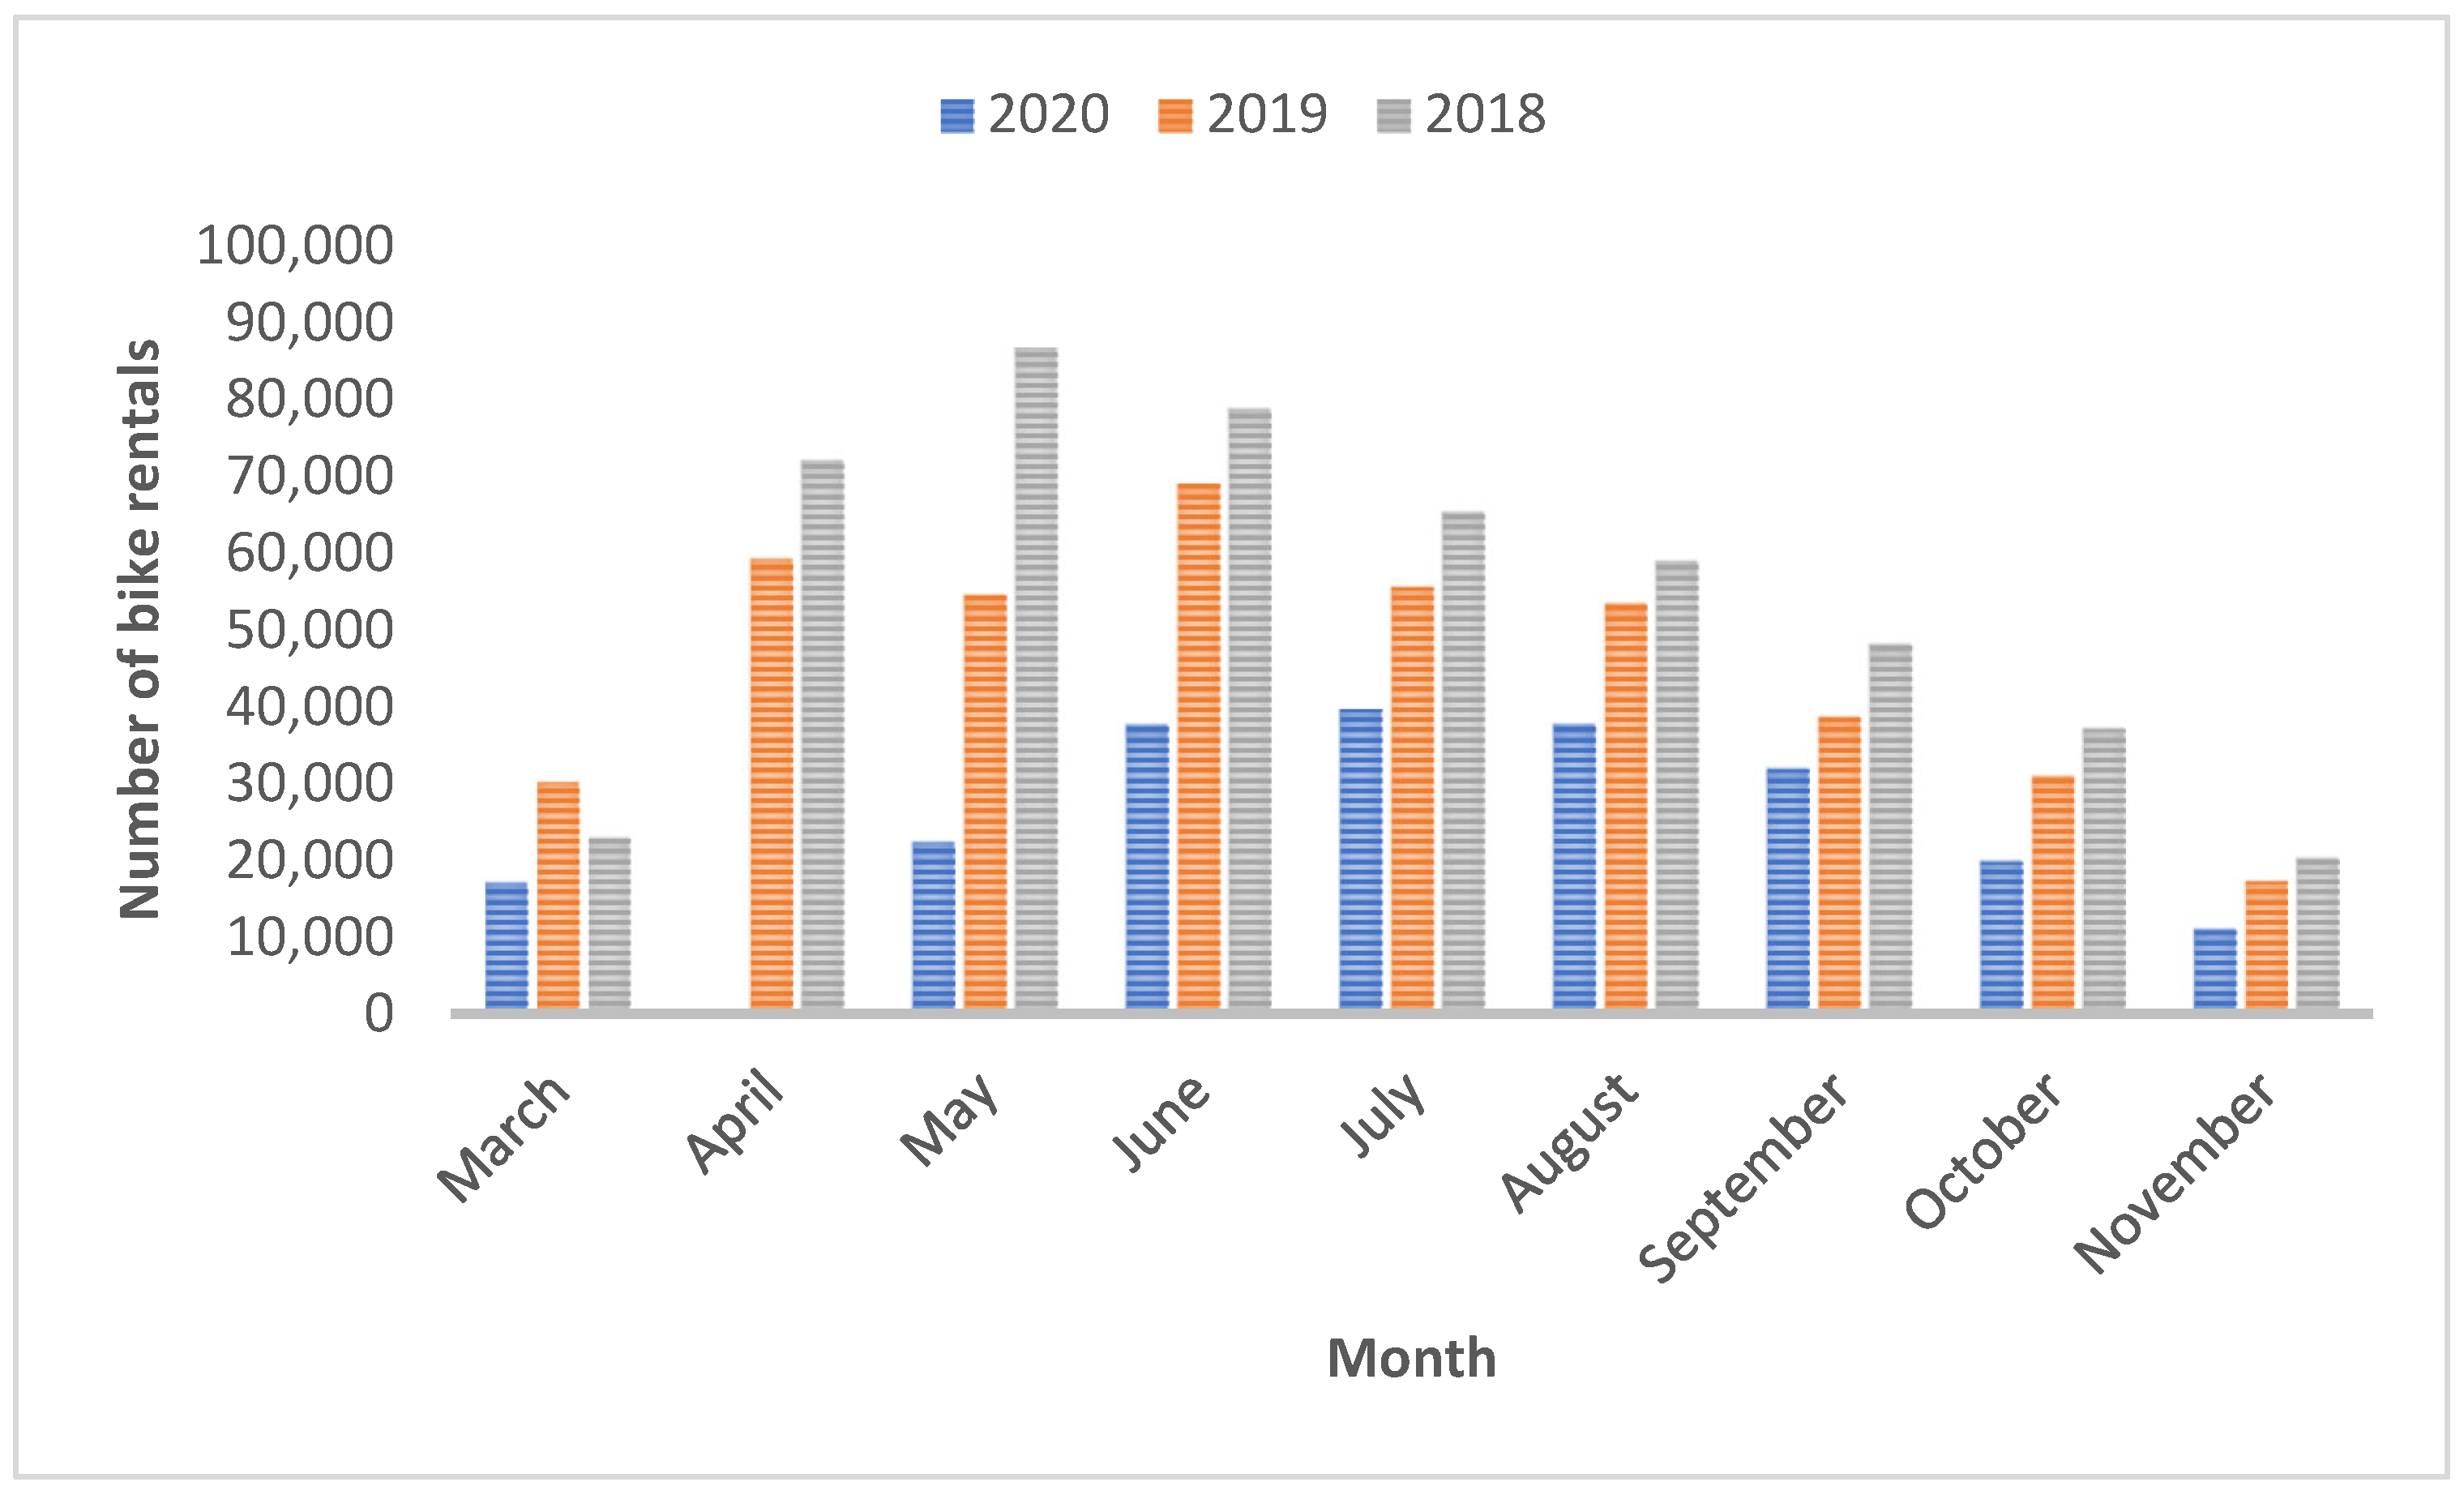
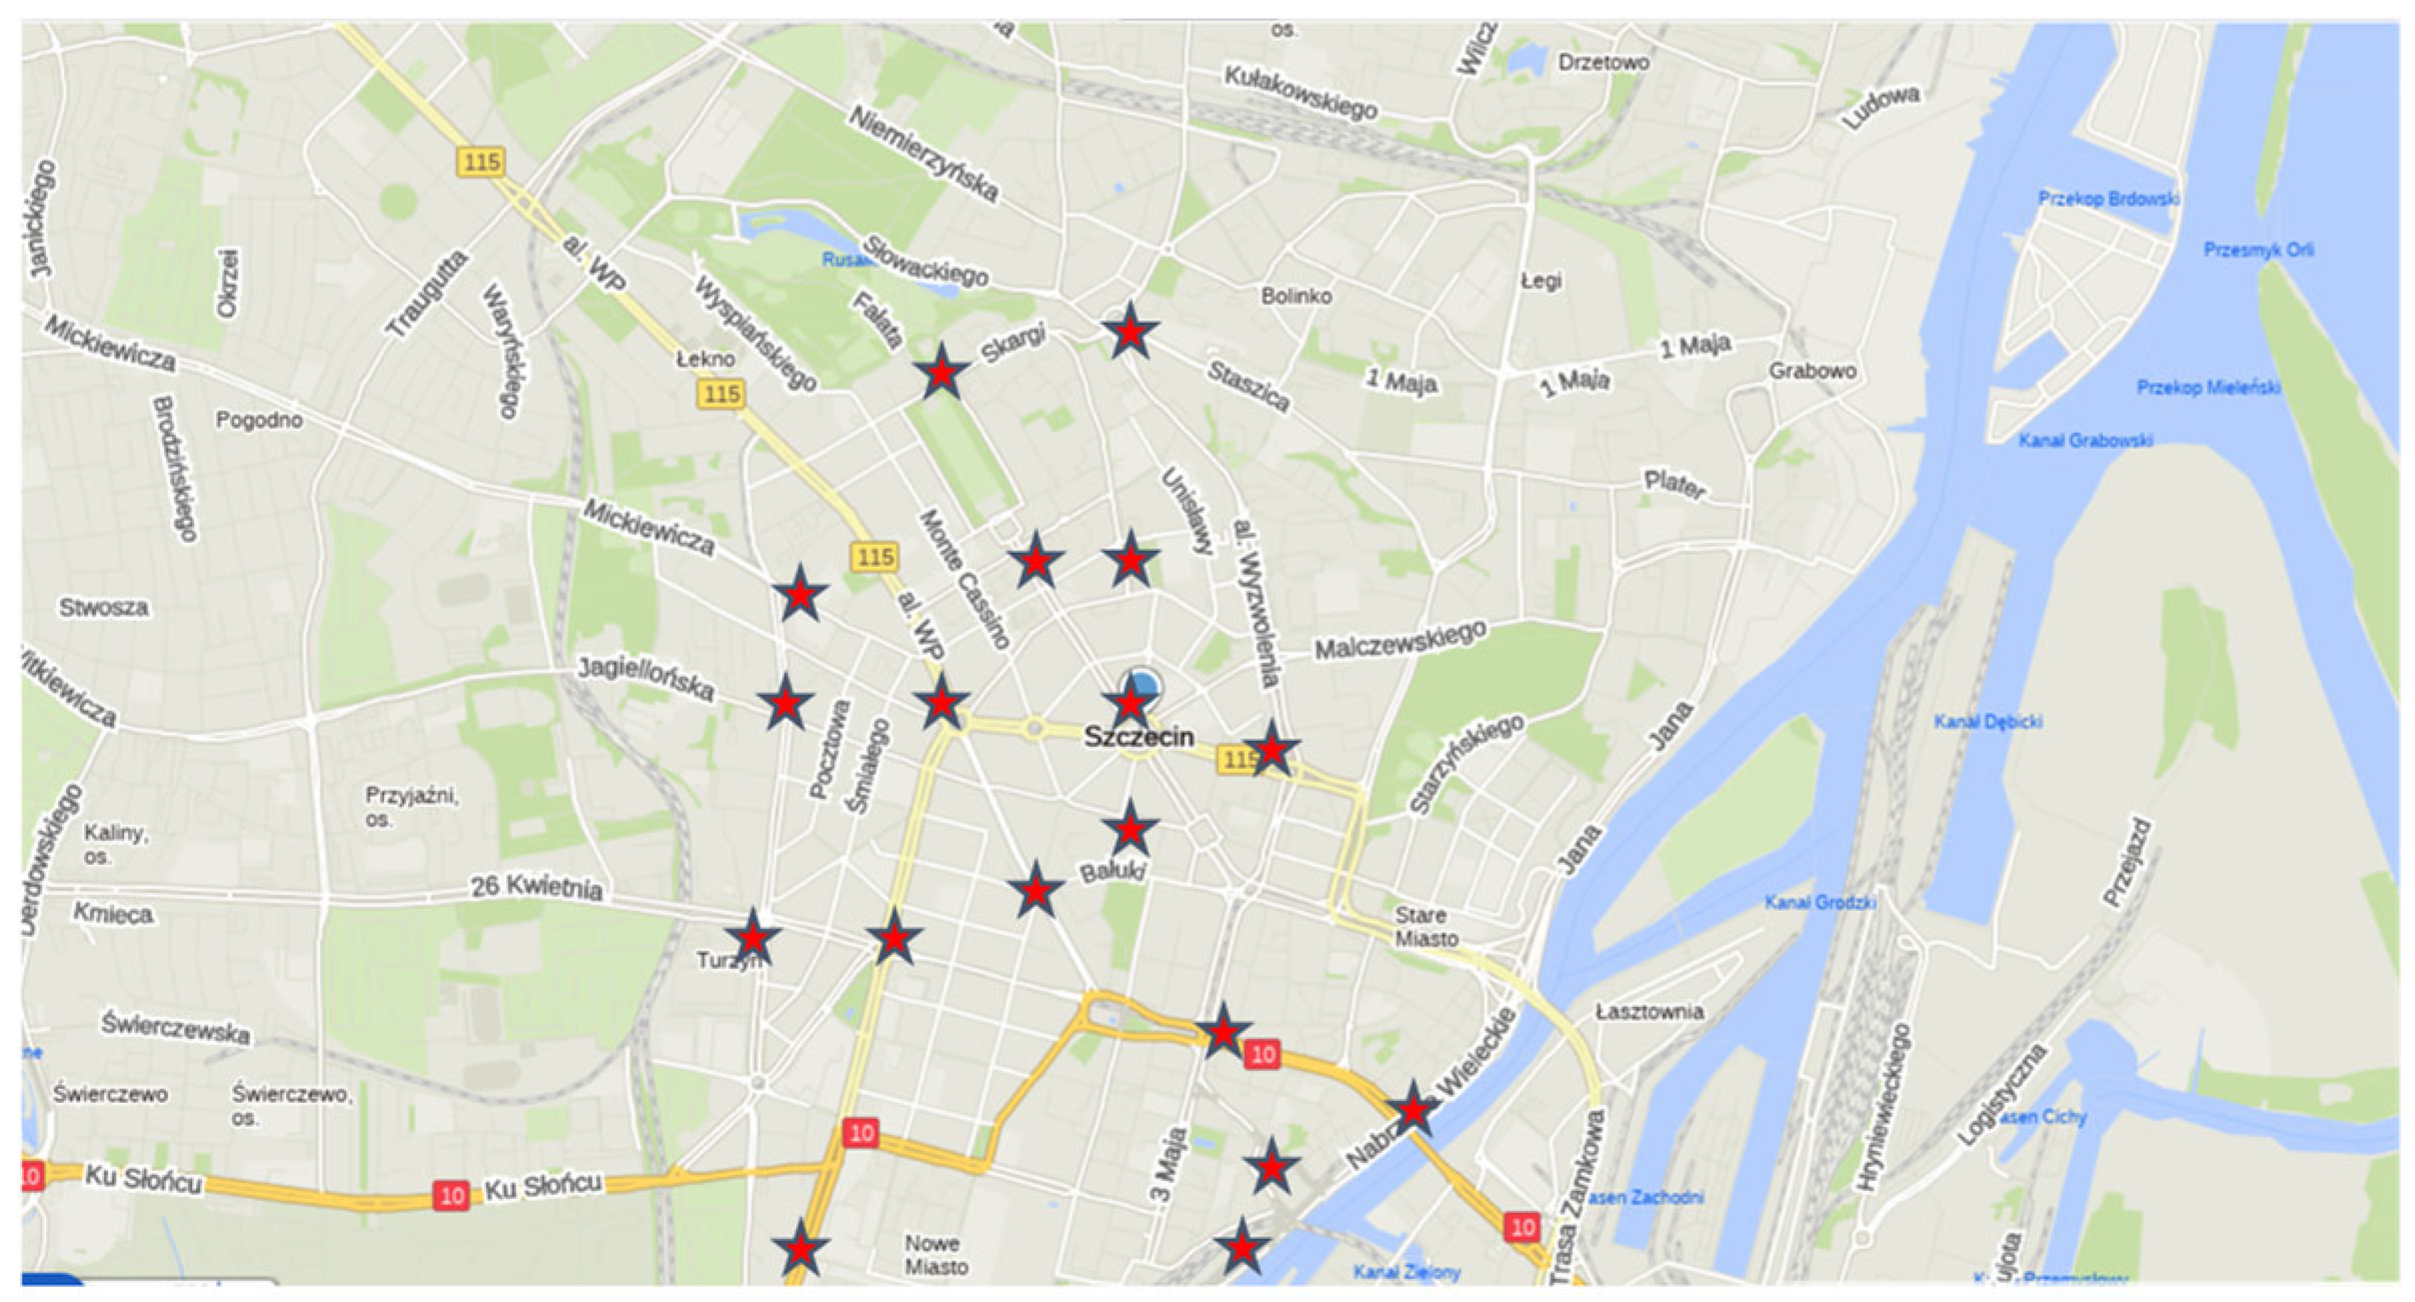
Table 1.
Travel directions suggested to the respondents and their abbreviations.
| Travel Directions | Abbreviations Used |
|---|---|
| Home–work | H-w |
| Home–school | H-s |
| Home–shopping | H-sh |
| Home–fitness | H-f |
| Home–entertainment | H-e |
| Home–cemetery | H-c |
| Home–hospital | H-h |
| Other than mentioned | O |
Table 2.
Average number of bikes daily on the streets in individual months in the years 2018–2020.
| Month | 2018 | 2019 | 2020 |
|---|---|---|---|
| March | 599 | 636 | 522 |
| April | 580 | 593 | - |
| May | 547 | 577 | 588 |
| June | 515 | 573 | 611 |
| July | 517 | 544 | 588 |
| August | 443 | 515 | 576 |
| September | - | 505 | 560 |
| October | 474 | 481 | 547 |
| November | 503 | 501 | 555 |
Source: Own elaboration based on: [62].
Table 3.
Systematized results of the Fisher’s test for month.
| Month | Average Number of Rentals | Group 1 | Group 2 | Group 3 | Group 4 | Group 5 | Group 6 | Group 7 |
|---|---|---|---|---|---|---|---|---|
| 11 | 626.833 | **** | ||||||
| 3 | 914.500 | **** | ||||||
| 10 | 1099.919 | **** | ||||||
| 9 | 1447.633 | **** | ||||||
| 8 | 1813.903 | **** | ||||||
| 7 | 1952.532 | **** | ||||||
| 4 | 2190.050 | **** | ||||||
| 5 | 2281.790 | **** | ||||||
| 6 | 2468.617 | **** |
Source: Own elaboration based on [62]. (****) means belonging to a given group.
Table 4.
Systematized results of the Fisher’s test for day of week.
| Day of the Week | Average Daily Number of Rentals | Group 1 | Group 2 |
|---|---|---|---|
| Sunday | 1391.597 | **** | |
| Saturday | 1461.256 | **** | |
| Thursday | 1697.603 | **** | |
| Monday | 1700.885 | **** | |
| Tuesday | 1756.641 | **** | |
| Wednesday | 1759.282 | **** | |
| Friday | 1769.101 | **** |
Source: Own elaboration based on [62]. (****) means belonging to a given group.
Table 5.
Basic data on SBO projects in the years 2018–2024.
| Year | Funds | Number of Projects | Number of Votes Cast |
|---|---|---|---|
| 2018 | 8.00 * 106 | 113 | 75,047 |
| 2019 | 9.00 * 106 | 110 | 61,727 |
| 2020 | 1.27 * 107 | 122 | 141,415 |
| 2021 | 1.46 * 107 | 113 | 134,607 |
| 2022 | 1.67 * 107 | 114 | 122,181 |
| 2023 | 1.75 * 107 | 153 | 134,630 |
| 2024 | 1.72 * 107 | 124 | 51,131 |
Source: Own elaboration based on: [77] (accessed: 29 January).
Table 6.
Data on cycling projects in SBO.
| Year | Number of Bicycle Projects | Percentage of Bicycle Projects | Number of Votes Cast for Bicycle Projects | Percentage of Votes Cast for Bicycle Projects |
|---|---|---|---|---|
| 2018 | 23 | 20.35 | 12,048 | 16.05 |
| 2019 | 12 | 10.91 | 7148 | 11.58 |
| 2020 | 2 | 1.64 | 1247 | 0.88 |
| 2021 | 7 | 6.19 | 8656 | 6.43 |
| 2022 | 9 | 7.89 | 9487 | 7.76 |
| 2023 | 12 | 7.84 | 8288 | 6.16 |
| 2024 | 16 | 12.90 | 2429 | 4.75 |
Source: Own elaboration based on: [77] (accessed: 29 January).
Disclaimer/Publisher’s Note: The statements, opinions and data contained in all publications are solely those of the individual author(s) and contributor(s) and not of MDPI and/or the editor(s). MDPI and/or the editor(s) disclaim responsibility for any injury to people or property resulting from any ideas, methods, instructions or products referred to in the content. |
© 2024 by the authors. Licensee MDPI, Basel, Switzerland. This article is an open access article distributed under the terms and conditions of the Creative Commons Attribution (CC BY) license (https://creativecommons.org/licenses/by/4.0/).
Share and Cite
MDPI and ACS Style
Wolnowska, A.E.; Kasyk, L. Study of the Demand for Ecological Means of Transport in Micromobility: A Case of Bikesharing in Szczecin, Poland. Sustainability 2024, 16, 3620. https://0-doi-org.brum.beds.ac.uk/10.3390/su16093620
AMA Style
Wolnowska AE, Kasyk L. Study of the Demand for Ecological Means of Transport in Micromobility: A Case of Bikesharing in Szczecin, Poland. Sustainability. 2024; 16(9):3620. https://0-doi-org.brum.beds.ac.uk/10.3390/su16093620
Chicago/Turabian StyleWolnowska, Anna Eliza, and Lech Kasyk. 2024. "Study of the Demand for Ecological Means of Transport in Micromobility: A Case of Bikesharing in Szczecin, Poland" Sustainability 16, no. 9: 3620. https://0-doi-org.brum.beds.ac.uk/10.3390/su16093620
Note that from the first issue of 2016, this journal uses article numbers instead of page numbers. See further details here.