Article

Urban Ecological Quality Assessment Based on Google Earth Engine and Driving Factors Analysis: A Case Study of Wuhan City, China

1
School of Geography Science and Geomatics Engineering, Suzhou University of Science and Technology, Suzhou 215000, China
2
School of Environmental Science and Engineering, Suzhou University of Science and Technology, Suzhou 215000, China
3
Suzhou Key Laboratory of Spatial Information Intelligent Technology and Application, Suzhou 215000, China
*
Author to whom correspondence should be addressed.
Sustainability 2024, 16(9), 3598; https://0-doi-org.brum.beds.ac.uk/10.3390/su16093598
Submission received: 29 March 2024 / Revised: 17 April 2024 / Accepted: 21 April 2024 / Published: 25 April 2024

Abstract

:
Ecological quality is a critical factor affecting the livability of urban areas. Remote sensing technology enables the rapid assessment of ecological quality (EQ), providing scientific theoretical support for the maintenance and management of urban ecology. This paper evaluates and analyzes the EQ and its driving factors in the city of Wuhan using remote sensing data from five periods: 2001, 2006, 2011, 2016, and 2021, supported by the Google Earth Engine (GEE) platform. By employing principal component analysis, a Remote Sensing Ecological Index (RSEI) was constructed to assess the spatiotemporal differences of EQ in Wuhan City. Furthermore, the study utilized the optimal parameter-based geographical detector model to analyze the influence of factors such as elevation, slope, aspect, population density, greenness, wetness, dryness, and heat on the RSEI value in 2021 and further explored the impact of changes in precipitation and temperature on the EQ in Wuhan. The results indicate that (1) principal component analysis shows that greenness and wetness positively affect Wuhan’s EQ, while dryness and heat have negative impacts; (2) spatiotemporal analysis reveals that from 2001 to 2021, the EQ in Wuhan showed a trend of initial decline followed by improvement, with the classification grades evolving from poor and average to good and better; (3) the analysis of driving factors shows that all nine indicators have a certain impact on the EQ in Wuhan, with the influence ranking as NDVI > NDBSI > LST > WET > elevation > population density > GDP > slope > aspect; (4) the annual average temperature and precipitation in Wuhan have a non-significant impact on the EQ. The EQ in Wuhan has improved in recent years, but comprehensive management still requires enhancement.

1. Introduction

Human survival and development are dependent on the stability and health of natural ecosystems [1]. With the acceleration of global urbanization, urban expansion and human activities have profoundly impacted the ecological environment [2]. Rapid urbanization has led to dramatic changes in land use patterns, intensified habitat fragmentation, reduced biodiversity, and degraded ecosystem service functions [3,4]. The burgeoning population and rapid economic development in urban areas have placed tremendous pressure on limited environmental resources and fragile ecological foundations [5]. This problem is prevalent in both developed and developing countries. For example, the United States experienced drastic urban expansion in the second half of the 20th century, with large amounts of farmland, forests, and wetlands being converted into urban land, resulting in ecosystem degradation and decreased environmental quality [6]. The urbanization process in Europe has been relatively moderate, but urban sprawl has still led to ecosystem fragmentation and biodiversity loss [7]. In developing countries, urbanization is progressing rapidly, and ecological and environmental problems are more prominent [8,9]. Therefore, coordinating the relationship between urban development and ecological protection to achieve sustainable urban development has become a pressing global issue [10].
In response to this challenge, The United Nations’ Sustainable Development Goals (SDGs) underscore the necessity of integrating ecological conservation with sustainable urban development, urging the adoption of advanced technological solutions in ecological assessments [11]. Particularly, Goal 11 [12] (to make cities and human settlements inclusive, safe, resilient, and sustainable) and Goal 15 [13] (to protect, restore, and promote the sustainable use of terrestrial ecosystems, sustainably manage forests, combat desertification, halt and reverse land degradation, and halt the loss of biodiversity) are directly related to the sustainable management and protection of urban ecological environments. To support the implementation of SDGs at the urban scale, it is imperative to carry out urban ecosystem monitoring and comprehensive assessment research. The long-term and dynamic monitoring of the spatiotemporal differentiation characteristics and driving mechanisms of urban ecological quality can provide a scientific basis for urban ecological protection, spatial planning, and management decisions [14].
Currently, there are various methods for evaluating the quality of urban ecology, such as the Technique for Order Preference by Similarity to Ideal Solution (TOPSIS), the entropy weight method, and the Analytic Hierarchy Process (AHP) [15]. However, these methods rely heavily on socio-economic statistical data and questionnaire survey data, which are often difficult to obtain and lack timeliness. Remote sensing technology, with its advantages of being macroscopic, rapid, dynamic, and economical, has been widely used in urban ecological environment monitoring since the 1970s [16,17]. Many scholars have used remote sensing data to assess the impact of urban expansion on the ecological environment in different regions of the world. For example, Weng [18] used Landsat imagery to evaluate the changes in landscape patterns and ecological processes caused by urban expansion in Indianapolis, USA. Rimal [19] utilized remote sensing and GIS techniques to assess land use/land cover changes and their impacts on the urban environment in the Haldia Municipality, India. Estoque [20] assessed the relationship between urban expansion and ecosystem service changes in the Manila metropolitan area, Philippines. Other scholars have focused on analyzing the spatiotemporal changes in urban surface parameters and their ecological effects, such as vegetation cover, surface temperature, and moisture [21,22]. However, these studies mostly focused on specific aspects of urban ecological processes or patterns and are difficult to comprehensively reflect the overall characteristics of complex urban ecosystems.
In recent years, constructing ecological composite indices by comprehensively utilizing multi-source remote sensing data and geo-models to conduct the overall evaluation and mapping of regional ecological environments has become a research hotspot in the field of ecological remote sensing [23]. Among them, the Remote Sensing Ecological Index (RSEI) proposed by Xu [24] comprehensively evaluates regional ecological conditions from four dimensions: greenness, wetness, heat, and dryness, and has strong comprehensiveness and regional comparability. The RSEI and its improved models have been applied to urban ecological quality assessments at multiple scales worldwide with good results [25,26,27]. For example, Zhou [28] and others used this index to assess the ecological environment changes in the Dongjiang source area over nearly 20 years (2000–2019), identifying urban construction land expansion driven by human activities as the main reason for the changes in the region’s ecological environment quality. In addition, Paudel [29] used RSEI to evaluate the changes in the ecological environment in the Middle Hills of Western Nepal from 2000 to 2015. The results showed that the overall ecological environmental quality in the region showed a deteriorating trend, mainly due to deforestation and land degradation.
However, previous studies mostly used traditional remote sensing data processing and analysis methods, which have limitations in data acquisition and computational efficiency. The Google Earth Engine (GEE) cloud computing platform that has emerged in recent years provides a new solution for remote sensing data acquisition, processing, analysis, and sharing [30]. It integrates a variety of commonly used remote sensing datasets and offers near-real-time data updates, with storage reaching petabyte levels. Users can develop and test algorithms and process and share data outcomes swiftly through the client, significantly boosting the efficiency of geographical information data processing and analysis [31,32]. Since its inception, GEE has been widely applied in diverse research fields such as ecology, environment, and agriculture [33,34].
Furthermore, when analyzing the driving factors of urban ecological quality, the geographical detector model is an effective tool for exploring the spatial heterogeneity and interaction of variables [35]. However, the traditional geographical detector often neglects the scale effect and zoning effect caused by the modifiable areal unit problem (MAUP), which may affect the reliability of the results [36,37]. Addressing this oversight, the optimal parameter-based geographical detector (OPGD) model proposed by Song [38] can identify the optimal spatial scale parameters and discretization scheme, providing a more robust framework for factor analysis.
In this context, we take Wuhan, a rapidly urbanizing city in central China, as a case study. As a major industrial base and transportation hub, urban ecology in Wuhan, Hubei Province, China is relatively fragile and unstable, more susceptible to the impacts of human economic activities [39]. Therefore, it is in urgent need of systematic and dynamic ecological quality monitoring and assessment. This study implements the RSEI model on the GEE platform to evaluate the spatiotemporal patterns of ecological quality in Wuhan from 2001 to 2021 based on Landsat imagery. The OPGD model is further applied to analyze the driving factors behind the ecological quality dynamics. The main innovations of this study include (1) integrating GEE and RSEI for efficient urban-scale ecological quality assessment, overcoming the limitations of data acquisition and processing in previous studies; (2) characterizing the long-term ecological quality dynamics under rapid urbanization using multi-temporal remote sensing data; and (3) quantifying the influence of natural and anthropogenic factors on ecological quality patterns with the OPGD model, providing decision support for urban ecological planning and management.
The findings of this study not only have important implications for ecological civilization construction and sustainable development in Wuhan but also contribute to global research on urban ecological assessment and management. Moreover, it provides a novel methodological framework that integrates cloud computing, remote sensing indices, and geographical detectors, which can be extended to other urban areas worldwide. The research outcomes are expected to deepen the understanding of urban ecological quality dynamics and support the realization of SDGs at the city level.

2. Materials and Methods

2.1. Study Area

Wuhan, the capital city of the Hubei Province, China, is geographically positioned between 29°58′ N to 31°22′ N latitude and 113°41′ E to 115°05′ E longitude, situated in the eastern part of the Jianghan Plain and the middle reaches of the Yangtze River. The city is comprised of six central urban districts and seven peripheral districts (as detailed in Figure 1), covering an administrative area of 57,943.92 km2 and hosting a substantial permanent resident population of 31.9874 million [40]. Wuhan is characterized by its varied topography in all directions, particularly at the confluence of the Yangtze and Han rivers, which forms the unique geographical layout of “Two Rivers and Three Towns”. The city experiences a subtropical humid monsoon climate, with abundant rainfall and sufficient heat throughout the year, boasting an average annual temperature between 15.8 °C and 17.5 °C. It possesses an exceptional ecological environment, serving as a confluence for a vast array of plant species from both northern and southern regions. Nearly half of the city’s area is covered with green vegetation, providing more than the expected average of 10 square meters of green space per capita. These ecological assets are vital for Wuhan’s endeavor to become an ecological civilization city and stand at the core of its environmental protection objectives [41].

2.2. Data

The powerful data computation capabilities of GEE enable the batch and rapid processing of image datasets, making it an ideal platform for preprocessing and calculating various indices. This capability allows for the efficient and swift processing of image datasets, including the selection of images with minimal cloud coverage to ensure optimal image quality. To maximize the observation of vegetation greenness, this study primarily utilizes Landsat 8 OLI remote sensing imagery from the GEE platform, aiming to capture images during the peak vegetation growth periods to extract NDVI, WET, LST, and NDBSI. High-quality image data from Wuhan City, spanning from 2001 to 2021 with less than 10% cloud and a spatial resolution of 30 m, were selected for image preprocessing. The image data include cloud processing using the CFMASK (The C Function of Mask) algorithm to mask the quality assessment (QA) bands. Moreover, manual identification and processing were conducted to address areas within cloud regions that could not be labeled as clouds and anomalies due to sensor issues, with these being progressively eliminated through stepwise masking.
Additional data sources utilized in this study are detailed in Table 1. Digital Elevation Model (DEM) data were sourced from the Geospatial Data Cloud, providing essential topographical information. Population density and Gross Domestic Product (GDP) data [42], pivotal for analyzing human impact on the landscape, were obtained from the Resource Environment Science and Data Center. Furthermore, slope and aspect data, crucial for understanding terrain influences on vegetation patterns [43], were derived via detailed elevation data analysis. To ensure the reliability and accuracy of these data in experimental analyses, a comprehensive preprocessing regimen was employed. This regimen included cropping to the study area, reclassification to align with the research objectives, and geometric correction to ensure spatial accuracy. These meticulous preprocessing steps are vital for the integrity of the data and the validity of the subsequent analysis, underlining the study’s commitment to methodological rigor and precision.

2.3. Methods

2.3.1. Remote Sensing Ecological Index (RSEI)

This article utilized the RSEI to evaluate the EQ in Wuhan. Dryness, heat, wetness, and greenness indices are selected as the main research indicators, and the PCA method is used to construct the RSEI. Combined with the EQ grade difference calculation, it provides a detailed assessment and analysis of the spatiotemporal ecological changes in Wuhan’s urban area. Figure 2 presents the framework of this study.
  • NDVI
The greenness index, which measures the biomass, leaf area index, and vegetation coverage of green plants, utilizes the normalized difference vegetation index (NDVI) by calculating the difference between the near-infrared (NIR) and red (RED) bands of remote sensing data [44]. The calculation formula is
N D V I = ρ n i r ρ red ρ n i r + ρ r e d
In the formula, ρ n i r   a n d   ρ r e d represent the reflectance in the near-infrared and red-light bands, respectively.
2.
WET
The wetness index, which includes the moisture content of both soil and vegetation, is obtained from remote sensing data through the Tasseled Cap Transformation (K-T) [45]. Due to the differences in spectral resolution between the Landsat TM and OLI sensors, the formula for the wetness index is as follows:
  Wet T M = 0.0315 ρ blue + 0.2021 ρ green + 0.3102 ρ red + 0.1594 ρ n i r 0.6806 ρ swir 1 0.6109 ρ swir 2
W e t O L I = 0.01511 ρ blue + 0.1973 ρ green + 0.3283 ρ red + 0.3407 ρ n i r 0.7117 ρ swir 1 0.4559 ρ swir 2
In the formula, ρ green ,   ρ blue ,   ρ swir 1   a n d   ρ swir 2 , respectively, represent the reflectance of the green, blue, shortwave infrared 1 (SWIR1), and shortwave infrared 2 (SWIR2) bands.
3.
LST
Land surface temperature represents the heat level. It reflects the level of radiant heat from the Earth’s surface and plays a crucial role in the ecological environment, constituting an essential variable within it. Various methods for calculating land surface temperature include the radiative transfer equation, single-window algorithm, and single-channel algorithm [46]. This paper employs the single-channel algorithm formula:
T s = c 2 λ l n c 1 λ 1 S B T s + 1
B T s = a 0 + a 1 w + a 2 + a 3 w + a 4 w 2 · 1 / ε + a 5 + a 6 w + a 7 w 2 · L Sen / ε
In the formula, L s e n represents the radiance received by the sensor; ε denotes the emissivity of the land surface; w stands for the water vapor content in the atmosphere; B T S represents the Planck’s radiance value at temperature; λ is the effective wavelength; and a i ( i = 1,2 , 3 7 ) are the coefficients within the B T S model for Landsat series data.
4.
NDBSI
The dryness index, known as the Normalized Difference Built-up and Soil Index (NDBSI), is composed of the average values of the Index-Based Built-up Index (IBI) and the Soil Index (SI) [47]. The calculation formula is
N D B S I = ( S I + I B I ) 2
SI = ρ swir 1 + ρ red ρ blue ρ n i r ρ swir 1 + ρ red + ρ blue + ρ n i r
I B I = 2 ρ s w i r 2 ( ρ s w i r 1 + ρ n i r ) ρ n i r ρ n i r + ρ r e d + ρ g r e e n ρ s w i r 1 + ρ g r e e n 2 ρ s w i r 2 ( ρ s w i r 1 + ρ n i r ) + ρ n i r ρ n i r + ρ r e d + ρ g r e e n ρ s w i r 1 + ρ g r e e n
In the formula, ρ green ,   ρ blue ,   ρ red ,   ρ n i r ,   ρ swir 1   a n d   ρ swir 2 , respectively, represent the reflectance of the green, blue, red, near-infrared, shortwave infrared 1 (SWIR1), and shortwave infrared 2 (SWIR2) bands.
5.
Construction of the RSEI
The RSEI is an index that evaluates the ecological environment by integrating wetness, greenness, heat, and dryness [48]. Due to the differences in numerical units and magnitudes among these components, it is necessary to normalize the data before integration to remove unit discrepancies. The specific formula for the normalization process is as follows:
N I = N I N I m i n N I m a x N I m i n   or   N I = N I m a x N I N I m a x N I m i n
In the formula, N represents the normalized value of the index, I is the value of the index itself, and I m a x and I m i n represent the peak and trough values among all the indices, respectively. After the normalization of all component indices, we employ PCA to determine the variance contribution of each principal component. These contributions are used as weights for the component indices, which are then further transformed into the four original component indices. The extraction formula is as follows:
R S E I = P C A [ f ( N D V I , W E T , N D B S I , L S T ) ]
The initial RSEI is normalized to fall within the [0, 1] range, where values closer to 1 indicate better and superior ecological environment quality [49]. Based on the ecological environment grading standards set forth in the Technical Specifications for Ecological Environment Evaluation, the RSEI is classified into five levels, as shown in Table 2:

2.3.2. Optimal Parameter-Based Geographical Detector

  • Spatial Scale Optimization
Based on the scope of the research area, two scales of 2 km and 3 km were established, generating 2613 and 899 grids, respectively. By comparing the 90th percentile of all driving factors q at these two different spatial scales, the scale at which this percentile reaches its maximum value is identified as the optimal spatial scale.
2.
Geographical Detector Model
The Geographical Detector is a tool used to study spatially varying geographical phenomena. It includes four detectors: differentiation and factor detection, interaction detection, risk area detection, and ecological detection. Its advantages lie in the lack of a need for a linear hypothesis and its clear physical significance [50].
Differentiation and factor detection evaluate the impact of the independent variable X (an evaluation index) on the dependent variable Y (EQ), measured with the q value:
q = 1 h = 1 L   N h σ h 2 N σ 2 = 1 S S W S S T
S S W = h = 1 L   N h σ h 2 ,   SS T = N σ 2
In the formula, h = 1 , 2 ;   L represents the stratification of variable Y or factor X ; N and N h denote the total number of units in the entire region and in the stratum h , respectively; σ h 2 and σ 2 are the variances of Y values within stratum h and across the entire region, respectively; S S W and S S T represent the sum of within-stratum variances and the total variance across the region. The q value serves as an indicator of the influence of factor X on Y , with larger values indicating a stronger influence.
Interaction detection is utilized to explore the interactions between different factors, assessing whether the interaction effect between every two independent variables enhances or reduces the explanatory power on the dependent variable. There are also instances where the influence of independent variables on the dependent variable is mutually independent. Refer to the Table 3 for the types of interactions between factors:

3. Results

3.1. Factor Index Principal Component Analysis (PCA)

PCA was applied to four indicators of Wuhan City in 2001, 2006, 2011, 2016, and 2021, yielding the proportion, RSEI, and contribution rate of the first principal component. According to the data in Table A1, the average contribution of the first principal component exceeds 66%, indicating its dominant role in the overall framework. This demonstrates that PCA is an effective and impartial method to reflect the comprehensive environmental status of Wuhan City.
The PCA of Wuhan City’s four indicators in 2001, 2006, 2011, 2016, and 2021 (see Table A1) reveals that the eigenvalue contribution of the first principal component consistently surpasses 50%, signifying its representation of the majority of information across the four indicators. Therefore, this principal component can substitute for the four components of greenness, wetness, dryness, and heat. To minimize the influence of subjective factors in the composite of multiple indicators, the variance contribution rate is selected as the weight for each component indicator. Utilizing these weights, a comprehensive evaluation model for the RSEI is constructed to conduct an in-depth assessment of EQ in Wuhan. The contribution rate of greenness has been increasing over the study period, indicating that the ecological protection has improved in Wuhan in recent years, resulting in a positive trend in vegetation cover and its increasing impact on the overall EQ compared to other indicators. Similarly, the contribution rate of the heat indicator is rising, reflecting the continuous increase in Wuhan’s surface temperature during the study period, which is closely related to the urban heat island effect, thereby increasing the weight of the heat indicator in the RSEI evaluation. In the annual first principal component, the greenness (NDVI) and wetness (WET) indicators are positive, suggesting a beneficial impact on the ecological environment, while the dryness (NDBSI) and heat (LTS) indicators are negative, indicating potential adverse effects. High values of greenness and wetness suggest good vegetation cover and soil moisture content, reflecting a favorable EQ. Conversely, high dryness and heat values may indicate issues like sparse vegetation, exposed bedrock, soil desertification, and urbanization, signifying poor ecological conditions. Since other principal components do not show significant trends or clear reflections of EQ, this study only utilizes the contribution rate of the first principal component to construct the RSEI [51].

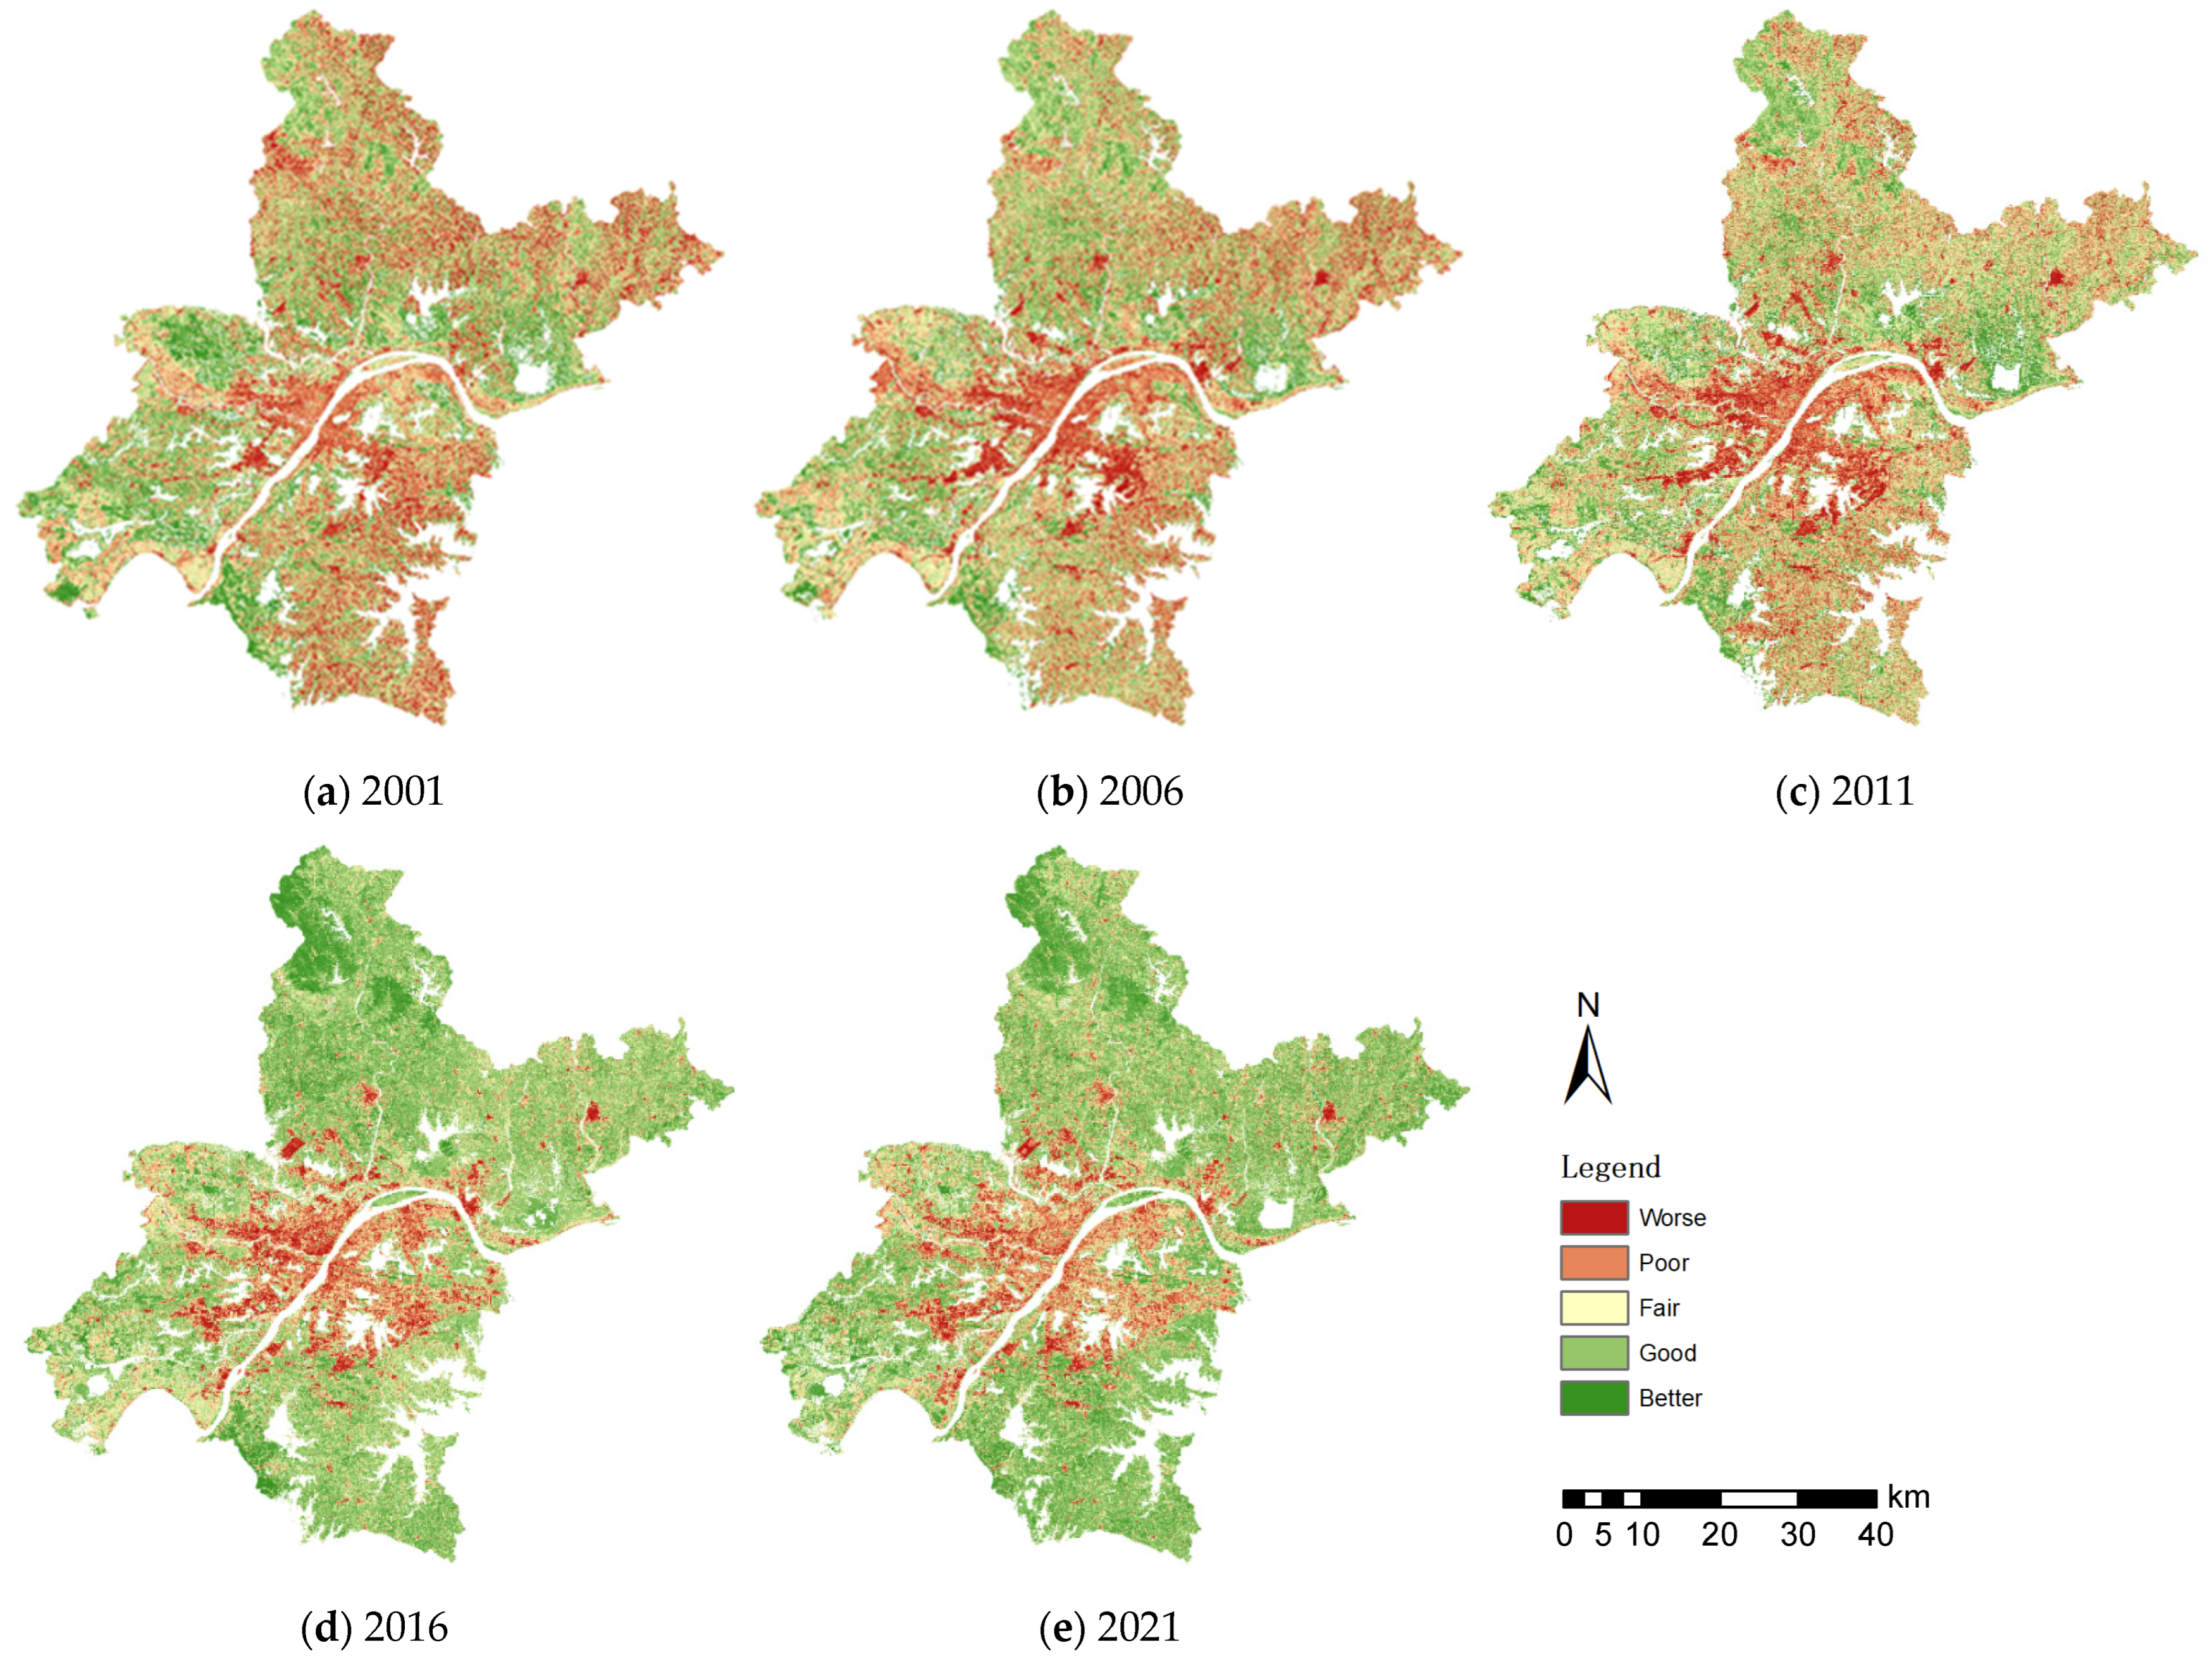
3.2. Spatiotemporal Distribution of EQ in Wuhan

From 2001 to 2021, the average value of RSEI in Wuhan and the area and proportion of the area corresponding to each grade are shown in Figure 3 and Table 4. Observing the data for individual years, in 2001, the area rated as poor in EQ reached a peak, accounting for 43.25% of the total area, while the area rated as good was the least, making up only 10% of the total area, approximately 823.62 km2. In the same year, the areas rated as average and better accounted for 29.53% and 12%, respectively. By 2006, the proportion of areas rated as poor increased to 25.58%, covering an area of 2146.92 km2, while the proportion of average areas decreased to 24.51%, covering 2056 km2. In 2011, compared to 2006, there was little change; the proportion of poor areas decreased to 21.56%, covering 1809 km2, while the proportion of better areas increased to 7.01%. In 2016, the proportion of areas rated as good rose to 31.04%, and the proportion of better areas also significantly increased to 36.43%, covering 3057.07 km2. In 2021, the proportion of average areas increased to 27.70%, good areas continued to rise to 33.52%, and the proportion of better areas slightly decreased to 12.43%, covering 1043.21 km2.
Looking at the overall trend, from 2001 to 2021, Wuhan City’s RSEI mean value shows a trend of first decreasing and then increasing, indicating an improvement in the EQ in recent years, which may be related to the city’s economic development policies. According to statistical data, Wuhan’s GDP grew from CNY 39.91 billion in 1978 to CNY 13,410.34 billion in 2017, and the permanent population increased from 8.58 million in 2004 to 10.33 million in 2014. This growth led to more human activities, causing ecological issues such as vegetation destruction and soil pollution. With the government’s continuous efforts in environmental protection and governance, the implementation of relevant policies, and the promotion of ecological civilization construction over the past two decades, the environmental awareness of Wuhan’s residents has significantly improved. Through the combined efforts in various aspects, the trend of ecological environment deterioration in Wuhan has been successfully curbed, shifting towards improvement.
To more directly illustrate the geographic distribution of EQ in Wuhan, as shown in Figure 4, the surrounding urban districts exhibit better ecological conditions. These areas, characterized by slower economic development, primarily utilize land for agriculture and forestry, boasting rich vegetation and high biodiversity. In contrast, regions such as Hongshan, Hanyang, Wuchang, and Qingshan exhibit relatively poorer ecological conditions. The Hongshan District, anchored by academic and educational institutions, hosts numerous higher education entities and has a dense population, whereas Qingshan, Hanyang, and Wuchang are predominantly industrial areas, housing major industrial enterprises like Wuhan Iron and Steel, Wuhan Petrochemical, Dongfeng Motor, and Wuhan Shipbuilding. Industrial production and human activities in these areas exert significant pressure on the ecological environment.
Observing the trend from 2001 to 2021, Wuhan’s ecological environment displays a ring-shaped distribution pattern, with poorer conditions in the core urban areas and relatively better conditions in the suburbs. Over time, the scope of the central urban area has gradually expanded, especially towards the Yangtze and Han rivers. By 2021, areas with poorer ecological conditions have extended across the east–west axis, covering most of Wuhan and its core urban areas. This pattern indicates that the newly developed surrounding areas of Wuhan respond quickly to ecological changes, reflecting the city’s urban expansion. Large tracts of farmland and forests have been transformed into urban land, altering land use and cover patterns on the surface, and leading to reduced vegetation, decreased biodiversity, and diminished soil retention capability, thereby degrading EQ. The rapid urban expansion has significantly impacted these changes. For instance, in 2006, ecological problem areas were relatively dispersed, and issues in the urban core were not particularly pronounced. By 2016, the most noticeable ecological changes were concentrated along the western bank of the Han River and along both sides of the Yangtze River. Recently, as Wuhan’s urban development has approached saturation and with the advancement of ecological civilization, the central urban area has not shown a trend of continuous deterioration, and the overall EQ is improving.

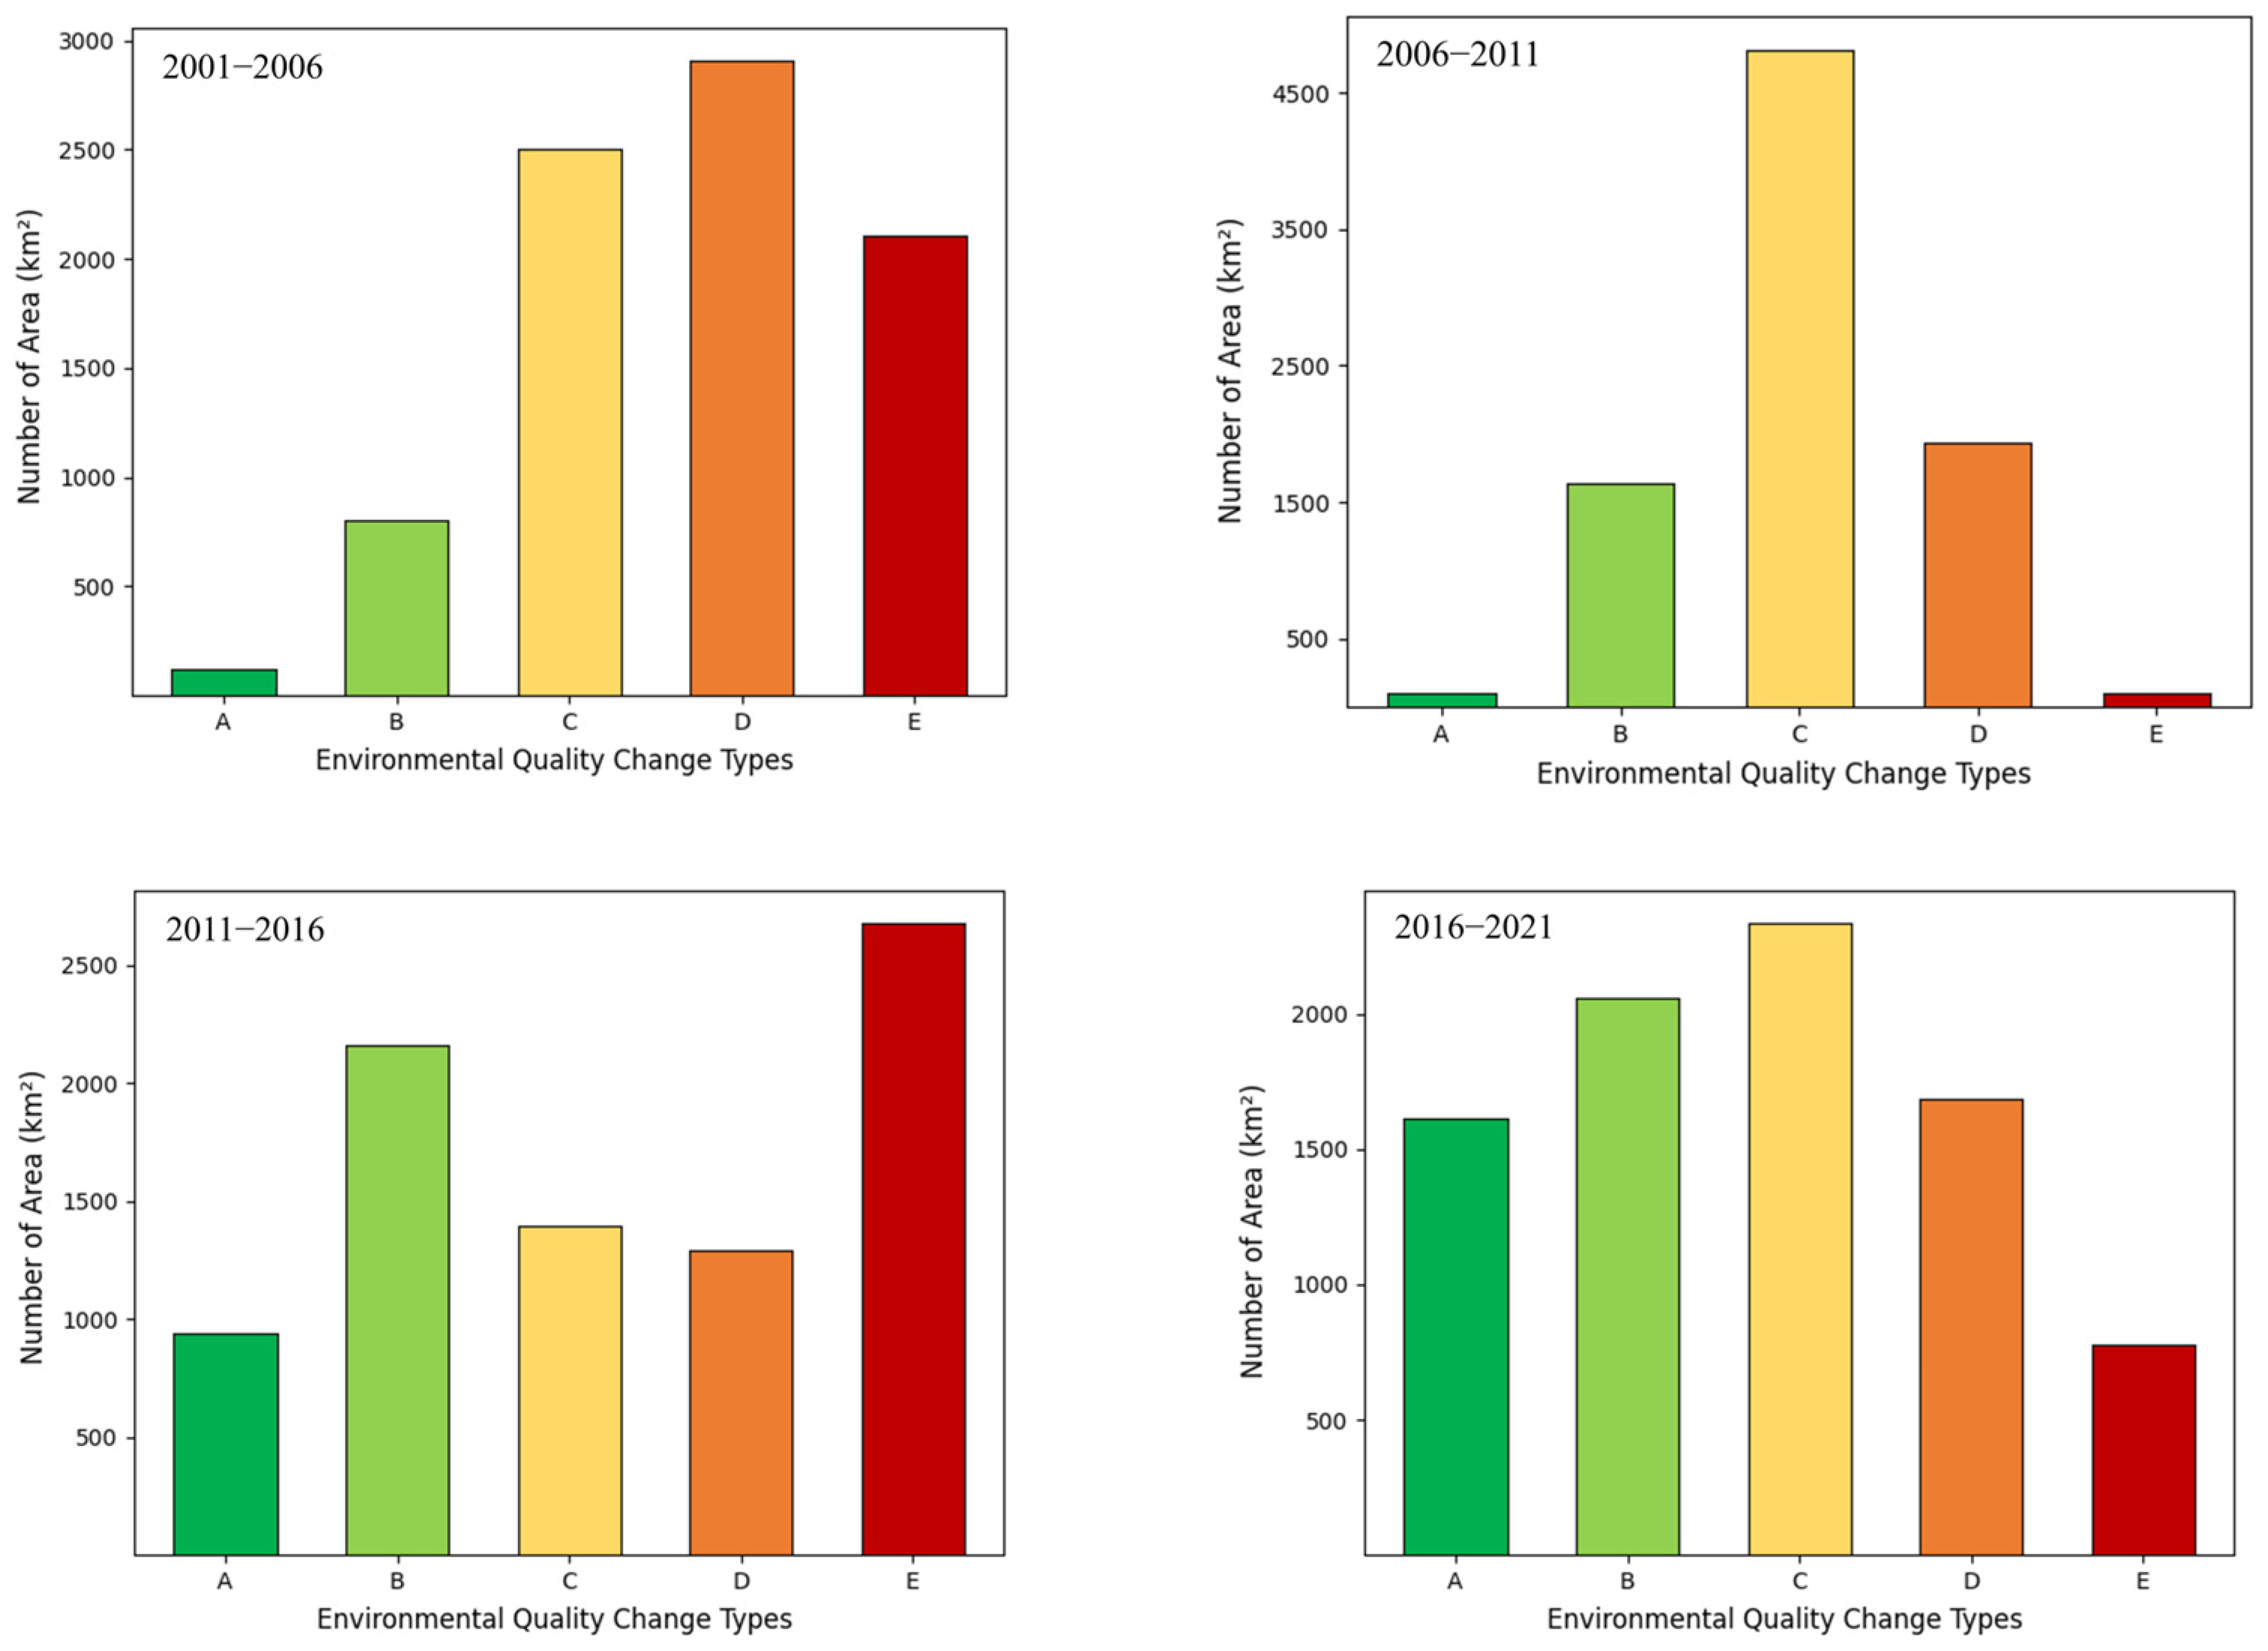
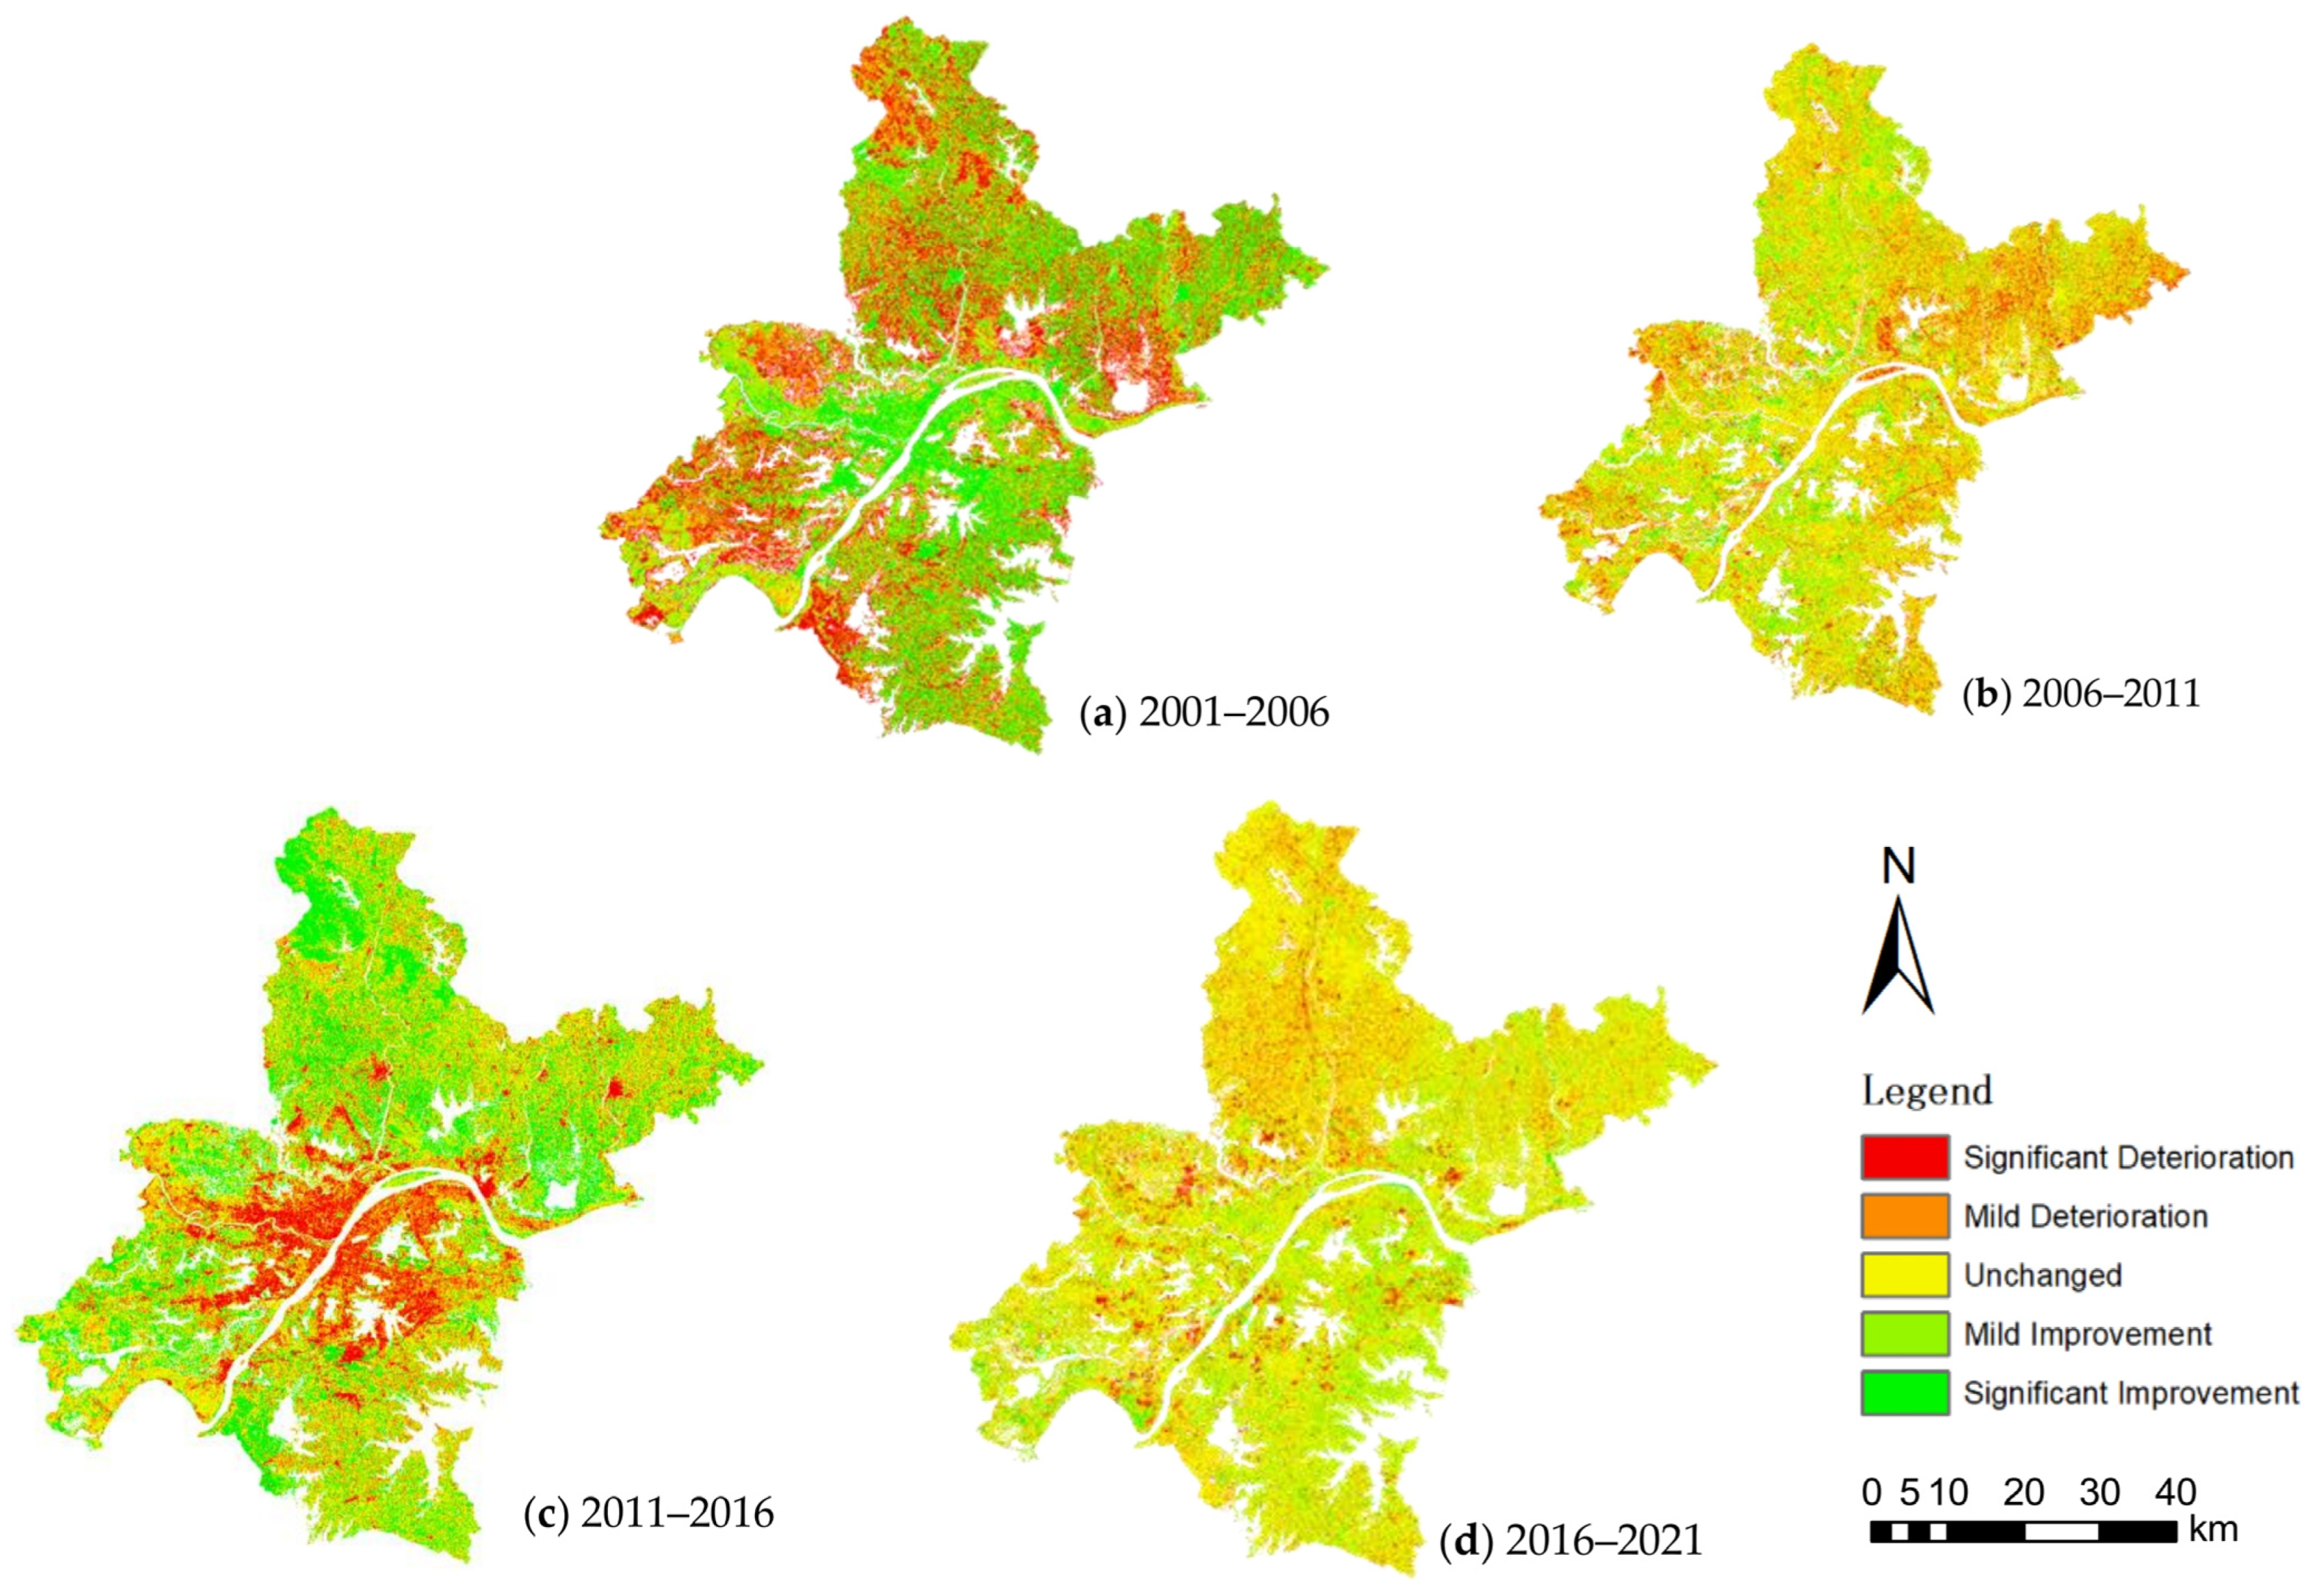
3.3. Spatiotemporal Analysis of EQ Differences

Based on the RSEI, this study analyzes the spatiotemporal differences in the EQ in Wuhan from 2001 to 2021, with five-year intervals. Figure 5 illustrates that from 2001 to 2006, Wuhan’s EQ exhibited a declining trend, with the area of deteriorated EQ accounting for 59.62%, while the areas of improvement and no change accounted for 10.64% and 29.75%, respectively. Specifically, the areas of mild and significant deterioration were 2910.42 km2 and 2108.8 km2, respectively. Between 2006 and 2011, the EQ in Wuhan remained largely unchanged, with stable areas accounting for 56.35%, areas of decline accounting for 23.45%, and areas of improvement representing 10.10%, including a mild deterioration area of 1936.36 km2 and a mild improvement area of 1639.9 km2. From 2011 to 2016, the EQ in Wuhan showed a slight downward trend, with 46.9% of the area worsening, 16.48% remaining unchanged, and 36.63% improving. The area of mild improvement was 2162.23 km2, while significant deterioration covered 2681.44 km2. Between 2016 and 2021, Wuhan’s EQ showed an improving trend, with 43.33% of the area improving, and 27.6% and 29.08% remaining unchanged or worsening, respectively. The areas of significant and mild improvement were 1613.02 km2 and 2054.53 km2, respectively. Overall, from 2001 to 2021, the area showing improvement in Wuhan‘s EQ accounted for 47.32%, approximately 3962.526 km2, while the areas of no change and deterioration accounted for 30.43% and 21.81%, respectively.
In terms of the spatial distribution of EQ changes, Figure 6 shows that from 2001 to 2016, the areas of EQ decline in Wuhan were mainly concentrated on the city’s outskirts and near water bodies. The ecological degradation of water bodies is associated with the illegal discharge of domestic sewage and industrial wastewater from urban residents and factories, as well as the burgeoning aquaculture industry in recent years. The construction land in Wuhan’s center mainly originated from the encroachment on surrounding green spaces and lakes, as well as the expansion of new urban areas toward the two rivers. From 2016 to 2021, the urban EQ improved, particularly in the city center, where the EQ remained stable or even enhanced, except for the water bodies. This improvement reflects the Wuhan government’s efforts in water environment management, increasing urban greening coverage, and ecological restoration projects, as well as the heightened environmental awareness among the citizens [52].

3.4. Analysis of Driving Factors Affecting EQ in Wuhan

3.4.1. Identification of Optimal Spatial Scale

At different spatial scales, there are variations in the degree of influence of various factors, as indicated in Table 5. With an increase in spatial grid size, several driving factors (q) tend to exhibit minor fluctuations. A common practice in existing research involves comparing the sizes of the 90th percentile of all driving factors (q) at different spatial scales, considering the scale at which this percentile reaches its maximum as the optimal spatial scale. The trend of decreasing 90th percentiles for all driving factors (q) reaches its peak at a spatial grid of 2 km, with a maximum decrease of 0.756. Consequently, among the two grid sizes, the 2 km grid is better suited to reflect the impact of latent variables on the changes in ecological and environmental quality.

3.4.2. Analysis of Differentiation Factor Detection Results

This article employs the geographical detector model to uncover the natural factors influencing the changes in EQ in Wuhan City. The study utilized the fishnet tool in ArcGIS to establish research grid points of 2 km × 2 km within the study area. It classified elevation, slope, aspect, population density, GDP, and four remote sensing ecological indicators into five levels. Through the fishnet points, the RSEI values were spatially associated with the values of nine driving factors. Subsequently, the spatially matched results were imported into the geographical detector model for factor detection analysis, which determined the influence values (q values, with higher q values indicating a greater impact of a specific index factor on RSEI) and explanatory power values (p values, with higher p values indicating a lesser explanatory power of an index factor on RSEI) of the nine driving factors on RSEI.
As shown in Table 6, the p values for LST, NDVI, WET, NDBSI, population density, GDP, and elevation are all zero, indicating that these seven driving factor indices have sufficient explanatory power for the EQ in Wuhan City. From the perspective of q values, NDVI and NDBSI have the highest values, indicating that these two driving factors had the most significant impact on Wuhan City’s RSEI value in 2021. The influence of LST and WET ranks third and fourth, respectively. The q values for slope and aspect are smaller, and their p values are larger; hence, their impact on RSEI values can be considered negligible. Finally, the study concludes that the impact strength of the nine factors on RSEI values within this research area, from strongest to weakest, is as follows: NDVI, NDBSI, LST, WET, elevation, population density, GDP, slope, and aspect.

3.4.3. Analysis of the Results from the Detection of Factor Interactions

To detect the interactions between various factors, this study evaluated whether the interaction between every two independent variables enhances or weakens the explanatory power on the dependent variable. The interaction detection analysis, conducted using a geographical detector model, categorized the results into bifactor enhancement and non-linear enhancement, as shown in Figure 7. The analysis indicates that, compared to individual influencing factors, all interaction factors significantly amplify the impact on the spatial heterogeneity of the dependent variable RSEI. Key interaction factors with a relatively high impact on RSEI’s spatial heterogeneity include NDVI ∩ NDBSI, WET ∩ NDBSI, LST ∩ NDBSI, NDBSI ∩ GDP, NDBSI ∩ DEM, and NDBSI ∩ POP, demonstrating that interaction factors have a more substantial effect on spatial heterogeneity. The detection results of differentiation factors revealed that slope and aspect have minimal impact on RSEI values; hence, their interactions were not included in the result analysis.

3.4.4. Analysis of the Causative Factors of Natural Elements

From 2001 to 2021, the annual average temperature and annual precipitation in Wuhan City both exhibited a slight upward trend. As illustrated in Figure 8, the fluctuation range of the annual average temperature is relatively significant, especially in 2006 and 2016, when the decline in Wuhan’s EQ may be closely related to the rise in temperature. Although the annual precipitation also shows an increasing trend, its significance is not prominent. Therefore, this indicator can be relatively overlooked when analyzing the changes in the EQ in Wuhan.

4. Discussion

4.1. The Advantages of the GEE Platform for Constructing the RSEI Model

Compared to conventional RSEI modeling approaches, the GEE platform empowers researchers to focus on the core objectives of their studies rather than on repetitive technical tasks [53]. GEE provides a plethora of built-in codes and functions that are highly accessible, including cloud masking, image compositing, principal component analysis, and ridge and linear regression functions [54]. These embedded resources guarantee that researchers can accurately and promptly detect changes in regional RSEI and forecast future EQ in specific areas. This study demonstrates that, through direct coding on the GEE platform, principal component analysis no longer necessitates external software such as MATLAB 2022 or SPSS 2022, thereby markedly improving research efficiency.
The use of GEE for RSEI modeling is a relatively novel approach in the field of urban ecological quality assessment [55]. Previous studies have primarily relied on traditional software and methods, such as using ENVI 5.3 for image preprocessing, ArcGIS for spatial analysis, and MATLAB or SPSS for statistical analysis. While these tools are powerful, they often require significant time and effort to process large datasets and integrate multiple data sources. In contrast, GEE’s cloud-based platform and extensive library of datasets and functions streamline the entire process, enabling researchers to analyze vast amounts of data more efficiently [56].
Moreover, GEE’s ability to handle multi-temporal and multi-source data is particularly advantageous for assessing urban ecological quality, which often involves analyzing changes over time and integrating various environmental and socio-economic factors [57]. By leveraging GEE’s capabilities, this study demonstrates the potential for more comprehensive and efficient assessments of urban ecological quality, which can inform sustainable urban planning and management strategies [58].
However, it is important to acknowledge the limitations and challenges of using GEE for RSEI modeling. One potential issue is the need for reliable internet connectivity and sufficient computing power to process large datasets on the cloud platform. Additionally, while GEE offers a wide range of datasets and functions, it may not include all the specific data or analysis tools required for a particular study, necessitating the integration of external data or custom code development.
Despite these limitations, the advantages of using GEE for RSEI modeling and urban ecological quality assessment are significant. As demonstrated in this study, GEE enables researchers to efficiently process and analyze large volumes of multi-source data, providing a more comprehensive understanding of the spatiotemporal patterns and drivers of urban ecological quality. This innovative approach has the potential to advance the field of urban ecological research and inform more effective strategies for sustainable urban development.

4.2. Temporal Changes of EQ and Causal Analysis

The temporal analysis of Wuhan’s ecological quality (EQ) from 2001 to 2021 reveals significant changes over time, with notable improvements in recent years. In 2001, the proportion of ecologically impoverished areas in Wuhan reached a staggering 43.25%, with the average EQ value at a relative low point. This poor ecological state can be attributed to several factors, including rapid industrialization, accelerated urbanization, population growth, and intensified human activities. During this period, Wuhan experienced a surge in economic development, which exerted tremendous pressure on natural resources and ecological systems, leading to environmental degradation.
From 2006 to 2011, the city’s EQ remained relatively low but fluctuated less, indicating that environmental governance policies had begun to curb the deteriorating trend to some extent. This period marked the beginning of a shift in Wuhan’s development strategy, with increasing emphasis on environmental protection and sustainable development [59]. The implementation of stricter environmental regulations, such as the “Environmental Protection Law of the People’s Republic of China” in 2008, likely contributed to the stabilization of Wuhan’s EQ during this time.
After 2016, Wuhan’s EQ began to improve significantly, with the proportion of areas experiencing improvement reaching 43.33% between 2016 and 2021. This positive trend can be attributed to several factors, including the government’s increased efforts in environmental management, the transformation of urban development patterns, industrial restructuring, and the heightened public awareness of environmental protection [60]. Wuhan’s government implemented a series of ecological restoration projects, such as the “Green Wuhan” initiative, which aimed to increase green space and improve the city’s ecological infrastructure [52]. Moreover, the promotion of low-carbon and green industries, coupled with stricter pollution control measures, helped to reduce the environmental impact of economic activities. These targeted actions, driven by a shift in government priorities and growing public concern for the environment, have played a crucial role in enhancing Wuhan’s EQ in recent years.
The temporal patterns of Wuhan’s EQ are consistent with findings from other studies on urban ecological quality in China. For example, a study by Wang [61] on the spatiotemporal evolution of urban ecological quality in Beijing found a similar trend, with a decline in ecological quality during the early 2000s, followed by a gradual improvement in recent years due to government-led environmental protection efforts. Similarly, research by Zhang [62] on the ecological quality of Shenzhen revealed a significant improvement in EQ from 2010 to 2020, attributed to the city’s sustainable development policies and ecological restoration projects.
However, it is important to note that the improvement in Wuhan’s EQ is a relatively recent phenomenon, and the city still faces significant ecological challenges. As indicated by the relatively high proportion of ecologically impoverished areas in 2021 (25.58%), there is a need for continued efforts to promote sustainable urban development and address the underlying drivers of ecological degradation. Future research could explore the long-term effectiveness of Wuhan’s ecological protection measures and identify potential strategies for further improving the city’s EQ.

4.3. Spatial Patterns of EQ and Causal Analysis

The spatial analysis of Wuhan’s ecological quality (EQ) reveals a distinct urban–rural disparity and a concentric distribution pattern [63]. The core urban areas, such as Wuchang, Hanyang, and Hongshan, which are densely populated and industrially developed, generally exhibit poorer EQ due to the intensity of human activities. In contrast, the relatively less economically active urban–rural fringes and suburban areas maintain a favorable ecological state [64]. This spatial pattern is consistent with findings from other studies on urban ecological quality in China and globally.
Although both the urban core and the urban–rural fringe areas have experienced ecological degradation, the degree of deterioration varies, resulting in the concentric distribution pattern of EQ. The urban core areas have suffered the most severe ecological degradation due to the intense urbanization pressures, such as the massive conversion of natural land to built-up areas and the high concentration of population and industrial activities [65]. In comparison, the urban–rural fringe areas, while also affected by urban expansion, have managed to retain a higher proportion of natural and semi-natural land covers, such as forests, grasslands, and agricultural lands, owing to the relatively lower development intensity [66]. These areas provide important ecosystem services, such as carbon sequestration, water regulation, and biodiversity conservation, which contribute to their higher EQ. The gradient change in EQ from the urban core to the periphery reflects the spatially heterogeneous impact of urban expansion on the ecological environment.
The formation of this spatial pattern is closely related to the process of urban expansion and land use change. As Wuhan has grown and developed, the central urban areas have experienced significant land cover changes, with the conversion of green spaces, wetlands, and agricultural lands into built-up areas [67]. This process has led to the degradation of natural habitats, reduction in biodiversity, and increased environmental pollution [68]. Moreover, the high concentration of population and industrial activities in the urban core has placed additional pressure on the local ecosystem, contributing to the lower EQ in these areas [69].
The spatial pattern of Wuhan’s EQ highlights the need for a more balanced and sustainable approach to urban development. While the concentration of population and economic activities in the urban core is a common feature of many cities, it is crucial to ensure that this growth does not come at the expense of the local ecosystem. Strategies such as urban greening, ecological restoration, and the protection of natural habitats in both urban and peri-urban areas can help mitigate the negative impacts of urbanization and improve the overall EQ of the city. Moreover, the spatial analysis of Wuhan’s EQ underscores the importance of considering the spatial heterogeneity of urban ecological quality in urban planning and management. A one-size-fits-all approach to ecological conservation and restoration may not be effective, given the distinct characteristics and challenges of different urban areas. Instead, a more targeted and context-specific approach, which takes into account the local socio-economic, environmental, and institutional factors, may be necessary.

4.4. Analysis of Influencing Factors and Recommendations

The analysis of the influencing factors on Wuhan’s ecological quality (EQ) using the geographic detection model reveals that vegetation cover (NDVI), built-up land (NDBI), land surface temperature (LST), and wetness (WET) are the dominant drivers of EQ in the city. These findings are consistent with previous studies that have identified land cover composition, urban heat island effect, and moisture conditions as key determinants of urban ecological quality [70,71,72]. The strong influence of NDVI on Wuhan’s EQ highlights the crucial role of vegetation in maintaining and improving the urban ecosystem. Vegetation provides numerous ecological benefits, such as reducing air and noise pollution, regulating microclimate, and supporting biodiversity. In Wuhan, the expansion of built-up areas and the consequent loss of vegetation cover have been major contributors to the decline in EQ, particularly in the urban core. Therefore, protecting and restoring green spaces, such as parks, forests, and wetlands, should be a key priority in Wuhan’s ecological management strategy.
The significant impact of NDBI on Wuhan’s EQ underscores the negative ecological consequences of rapid urbanization and the expansion of impervious surfaces. Built-up areas not only lead to the direct loss of natural habitats but also contribute to a range of environmental problems, such as increased surface runoff, reduced groundwater recharge, and the urban heat island effect. To mitigate these impacts, Wuhan should promote sustainable urban design and planning practices, such as compact development, mixed land use, and the integration of green infrastructure.
The influence of LST on Wuhan’s EQ highlights the need to address the urban heat island effect, which is a common problem in many cities worldwide. The high concentration of impervious surfaces and the lack of vegetation in urban areas contribute to higher surface and air temperatures, which can have negative impacts on human health, energy consumption, and ecosystem functioning. In Wuhan, the urban heat island effect has been intensifying in recent years, particularly in the summer months. To mitigate this problem, the city should implement strategies such as increasing the coverage of green spaces, promoting the use of cool materials and green roofs, and improving the efficiency of energy systems.
The role of WET in influencing Wuhan’s EQ emphasizes the importance of maintaining and restoring the city’s water resources and wetland ecosystems. Wuhan is known as the “city of a hundred lakes” due to its abundant water resources, including the Yangtze and Han rivers and numerous lakes and wetlands. These water bodies not only provide important ecosystem services, such as water purification, flood control, and biodiversity conservation but also contribute to the city’s unique landscape and cultural identity. However, rapid urbanization and industrial development have led to the degradation and loss of many of Wuhan’s water resources and wetland habitats. To address this issue, the city should strengthen the protection and management of its water resources, implement wetland restoration projects, and promote sustainable water use practices.
In addition to these key influencing factors, the analysis also reveals the significant impact of socio-economic factors, such as population density and GDP, on Wuhan’s EQ. This finding highlights the complex interplay between urban development, human activities, and ecological quality. To achieve sustainable urban development, Wuhan needs to find a balance between economic growth, social well-being, and environmental protection. This requires a multi-faceted approach that involves not only technical solutions, such as ecological restoration and green infrastructure, but also policy and institutional reforms, such as strengthening environmental regulations, promoting public participation, and fostering cross-sectoral collaboration.
Furthermore, the study highlights the potential impact of climate change on Wuhan’s EQ, as indicated by the negative influence of temperature increases on EQ in certain years. Wuhan, like many other cities in China and worldwide, is facing the challenges of climate change, such as rising temperatures, changing precipitation patterns, and more frequent extreme weather events [65]. These changes can have significant impacts on urban ecosystems, such as altering species distributions, disrupting ecological processes, and exacerbating environmental problems, such as air and water pollution [73]. To build resilience to climate change, Wuhan needs to mainstream climate considerations into its urban planning and management practices, such as developing climate adaptation plans, promoting low-carbon development, and strengthening early warning and disaster response systems.
Finally, it is important to recognize the limitations and uncertainties of this study and the need for further research. While the RSEI model and the geographic detection method provide valuable insights into the spatiotemporal patterns and influencing factors of Wuhan’s EQ, they are based on a limited set of indicators and data sources. Future studies could incorporate a wider range of ecological, social, and economic indicators, such as biodiversity, ecosystem services, and human well-being, to provide a more comprehensive assessment of urban ecological quality. Moreover, the study focuses on a single city, and the findings may not be directly applicable to other urban contexts. Comparative studies across different cities and regions could help to identify common patterns and context-specific factors influencing urban ecological quality. In summary, this study provides a valuable contribution to the understanding of urban ecological quality in Wuhan and offers important insights for sustainable urban development in China and beyond. The findings highlight the need for a multi-dimensional and integrative approach to urban ecological management, which takes into account the complex interactions between environmental, social, and economic factors. By adopting a more holistic and adaptive approach, cities like Wuhan can strive to achieve a balance between human well-being and ecological sustainability and contribute to the global goals of sustainable development.

5. Conclusions

In this study, in leveraging the GEE platform we conducted a rapid and detailed assessment of the changes in EQ in Wuhan from 2001 to 2021 and employed geographical detector model technology to uncover the key factors affecting the region’s EQ. The conclusions of this research not only provide vital scientific evidence for environmental management and sustainable development in Wuhan City but also offer empirical support for achieving the SDGs. The main findings are summarized as follows:
(1)
Trend of EQ: Between 2001 and 2021, Wuhan City experienced an initial decline followed by a subsequent increase in EQ. This trend is closely associated with the city’s rapid economic development, reduction in vegetation due to human activities, shrinkage of lake areas, and urban expansion. This finding underscores the importance of implementing effective environmental governance measures while pursuing economic growth. It also highlights the need for a balanced approach to urban development that prioritizes ecological sustainability alongside economic progress.
(2)
Spatial Distribution Differences: There is a significant difference in the ecological conditions between the core urban areas and the peripheral regions, which is related to the economic development level and strategic positioning of each district. Adjusting industrial layout and promoting industrial upgrading can provide new impetus for improving the urban ecology. This finding suggests that a spatially differentiated approach to ecological management, which takes into account the unique characteristics and challenges of different urban areas, may be more effective than a one-size-fits-all strategy.
(3)
Analysis of Driving Forces: Through the analysis of nine driving factors, it was found that greenness and dryness have the most significant impact on the EQ, while the effects of slope and aspect are relatively minor. This insight provides guidance for urban planning and ecological restoration, emphasizing the importance of maintaining and enhancing vegetation cover and managing built-up areas to improve urban ecological quality. Moreover, the significant influence of socio-economic factors, such as population density and GDP, highlights the need for an integrated approach that addresses the complex interplay between the environmental, social, and economic dimensions of urban sustainability.
(4)
Areas of Focus: The EQ along the Yangtze and Han riversides and in the city center remains a concern. Urban planning and development strategies need to place greater emphasis on ecological protection to achieve harmonious coexistence between humans and nature. This finding underscores the importance of prioritizing the conservation and restoration of critical ecological assets, such as rivers, lakes, and wetlands, in urban development plans. It also calls for a more proactive and integrated approach to urban ecological management, which involves not only technical solutions but also policy and institutional reforms to promote sustainable land use and environmental stewardship.
(5)
Methodological Contributions: This study demonstrates the effectiveness of the RSEI model and the geographical detector method for assessing and analyzing urban ecological quality. The integration of multi-source remote sensing data and socio-economic data within the GEE platform enables a comprehensive and efficient assessment of the spatiotemporal patterns and driving factors of urban EQ. This approach offers a promising tool for monitoring and evaluating urban ecological conditions, which can inform evidence-based decision-making for sustainable urban management. The methodology developed in this study can be applied to other cities and regions, providing a valuable reference for comparative studies and global assessments of urban ecological quality.
(6)
Implications for Sustainable Urban Development: The findings of this study have important implications for sustainable urban development in Wuhan and beyond. They highlight the need for a multi-dimensional and integrative approach to urban ecological management, which takes into account the complex interactions between environmental, social, and economic factors. By adopting a more holistic and adaptive approach, cities can strive to achieve a balance between human well-being and ecological sustainability and contribute to the global goals of sustainable development. This requires not only technical solutions, such as ecological restoration and green infrastructure but also policy and institutional reforms, such as strengthening environmental regulations, promoting public participation, and fostering cross-sectoral collaboration.
In conclusion, this study provides a comprehensive assessment of the spatiotemporal patterns and driving factors of urban ecological quality in Wuhan, using advanced remote sensing and spatial analysis techniques. The findings offer valuable insights into the complex dynamics of urban ecosystems and the challenges and opportunities for sustainable urban development. By highlighting the key areas of concern and the critical factors influencing urban ecological quality, this study provides a scientific basis for informed decision-making and targeted interventions to promote urban sustainability. The methodology and conclusions of this study can be extended to other cities and regions, contributing to the growing body of knowledge on urban ecological assessment and management. As cities around the world face the pressing challenges of rapid urbanization, environmental degradation, and climate change, this study underscores the importance of developing and applying innovative tools and approaches to monitor, assess, and enhance urban ecological quality, as a key component of sustainable development.

Author Contributions

Conceptualization, W.Z. (Weiwei Zhang) and W.Z. (Wanqian Zhang); methodology, W.Z. (Wanqian Zhang) and W.Z. (Weiwei Zhang); validation, W.Z. (Wanqian Zhang); formal analysis, J.J. and W.Z. (Wanqian Zhang); investigation, C.C.; resources, W.Z. (Weiwei Zhang); data curation, W.Z. (Weiwei Zhang); writing—original draft preparation, W.Z. (Wanqian Zhang) and W.Z. (Weiwei Zhang); writing—review and editing, W.Z. (Weiwei Zhang), J.J. and C.C.; visualization, J.J.; supervision, W.Z. (Weiwei Zhang); project administration, W.Z. (Weiwei Zhang); funding acquisition, W.Z. (Weiwei Zhang). All authors have read and agreed to the published version of the manuscript.

Funding

This study was supported by the National Natural Science Foundation of China (42171311, 41701477).

Institutional Review Board Statement

Not applicable.

Informed Consent Statement

Not applicable.

Data Availability Statement

The data will be made available upon request.

Acknowledgments

We would like to thank the editor and anonymous reviewers for their constructive comments and suggestions for improving the manuscript.

Conflicts of Interest

The authors declare that they have no known competing financial interests or personal relationships that could have appeared to influence the work reported in this paper.

Appendix A

Table A1. Result of principal component analysis.
YearParameterPC1PC2PC3PC4
2001NDVI0.3230.665−0.269−0.616
WET0.689−0.133−0.680−0.207
LTS−0.5860.1890.678−0.399
NDBSI−0.275−0.7090.0560.646
Eigenvalue0.1780.1020.0260.003
Contribution Rate/%583381
2006NDVI0.3270.7120.1610.598
WET0.6880.0980.6420.321
LTS−0.5150.0600.7480.412
NDBSI−0.391−0.691−0.008−0.607
Eigenvalue0.1540.1180.0200.003
Contribution Rate/%534061
2011NDVI0.306−0.6920.2220.613
WET0.7040.1160.6550.247
LTS−0.5630.1480.720−0.374
NDBSI−0.303−0.6950.043−0.649
Eigenvalue0.1530.1160.0210.003
Contribution Rate/%523981
2016NDVI0.3610.468−0.485−0.644
WET0.5320.678478−0.165
LTS−0.668−0.0280.719−0.188
NDBSI−0.3730.565−135722
Eigenvalue0.1200.0190.0080.002
Contribution Rate/%801361
2021NDVI0.3700.472−0.453−0.658
WET0.5370.6910.464−0.126
LTS−0.641−0.0330.745−0.176
NDBSI−0.4010.544−0.1500.720
Eigenvalue0.1250.0190.0110.002
Contribution Rate/%801271

References

  1. Xie, H.L.; Zhang, Y.W.; Choi, Y.; Li, F.Q. A scientometrics review on land ecosystem service research. Sustainability 2020, 12, 2959. [Google Scholar] [CrossRef]
  2. Grimm, N.B.; Faeth, S.H.; Golubiewski, N.E.; Redman, C.L.; Wu, J.; Bai, X.; Briggs, J.M. Global change and the ecology of cities. Science 2008, 319, 756–760. [Google Scholar] [CrossRef]
  3. Seto, K.C.; Güneralp, B.; Hutyra, L.R. Global forecasts of urban expansion to 2030 and direct impacts on biodiversity and carbon pools. Proc. Natl. Acad. Sci. USA 2012, 109, 16083–16088. [Google Scholar] [CrossRef]
  4. Erlwein, A. Exploring Ecosystems Health: Effects of Increments of Biodiversity and Trophic Complexity on the Stability of a Simple Gaian Ecosystem Model. Agro. Sur. 2022, 50, 192–204. [Google Scholar] [CrossRef]
  5. Gong, P.; Li, X.; Zhang, W. 40-Year (1978–2017) human settlement changes in China reflected by impervious surfaces from satellite remote sensing. Sci. Bull. 2019, 64, 756–763. [Google Scholar] [CrossRef] [PubMed]
  6. Lopez, R. Urban sprawl and risk for being overweight or obese. Am. J. Public Health 2004, 94, 1574–1579. [Google Scholar] [CrossRef]
  7. European Environment Agency. Urban Sprawl in Europe—The Ignored Challenge; EEA Report No. 10/2006; European Environment Agency: Copenhagen, Denmark, 2006. [Google Scholar]
  8. United Nations. World Urbanization Prospects: The 2018 Revision; United Nations: New York, NY, USA, 2019. [Google Scholar]
  9. Hao, L.; Sun, G.; Liu, Y.; Wan, J.; Qin, M.; Qian, H.; Liu, C.; Zheng, J.; John, R.; Fan, P.; et al. Urbanization dramatically altered the water balances of a paddy field-dominated basin in southern China. Hydrol. Earth Syst. Sci. 2015, 19, 3319–3331. [Google Scholar] [CrossRef]
  10. Angel, S.; Parent, J.; Civco, D.L.; Blei, A.; Potere, D. The dimensions of global urban expansion: Estimates and projections for all countries, 2000–2050. Prog. Plann. 2011, 75, 53–107. [Google Scholar] [CrossRef]
  11. Long, H. Analysis of the Key Factors of Ecological Environment Protection in the National Economic Sustainable Development Goals. J. Environ. Public Health 2022, 2022, 3593587. [Google Scholar] [CrossRef]
  12. Blasi, S.; Ganzaroli, A.; De Noni, I. Smartening sustainable development in cities: Strengthening the theoretical linkage between smart cities and SDGs. Sustain. Cities Soc. 2022, 80, 103793. [Google Scholar] [CrossRef]
  13. Dickens, C.; McCartney, M.; Tickner, D.; Harrison, I.J.; Pacheco, P.; Ndhlovu, B. Evaluating the global state of ecosystems and natural resources: Within and beyond the SDGs. Sustainability 2020, 12, 7381. [Google Scholar] [CrossRef]
  14. Haas, J.; Ban, Y. Urban growth and environmental impacts in Jing-Jin-Ji, the Yangtze, River Delta and the Pearl River Delta. Int. J. Appl. Earth Obs. Geoinf. 2014, 30, 42–55. [Google Scholar] [CrossRef]
  15. Sopandi, A.S.; Gustian, D.; Sembiring, F.; Muslih, M.; Arianti, N.D.; Setiawatif, A.; Kurniawan. Sistem pendukung keputusan penerima bantuan sosial tunai dengan metode technique for order preference by similarity to ideal solution. J. Rekayasa Nusa Putra 2022, 8, 268. [Google Scholar]
  16. Lillesand, T.; Kiefer, R.W.; Chipman, J. Remote Sensing and Image Interpretation; John Wiley & Sons: Hoboken, NJ, USA, 2015. [Google Scholar]
  17. Jensen, J.R. Remote Sensing of the Environment: An Earth Resource Perspective; Pearson Prentice Hall: Upper Saddle River, NJ, USA, 2007. [Google Scholar]
  18. Weng, Q. Remote sensing of impervious surfaces in the urban areas: Requirements, methods, and trends. Remote Sens. Environ. 2012, 117, 34–49. [Google Scholar] [CrossRef]
  19. Rimal, B.; Baral, H.; Stork, N.E.; Paudyal, K.; Rijal, S. Growing city and rapid land use transition: Assessing multiple hazards in the Kathmandu Valley, Nepal. Land 2018, 7, 10. [Google Scholar]
  20. Estoque, R.C.; Murayama, Y. Monitoring surface urban heat island formation in a tropical mountain city using Landsat data (1987–2015). ISPRS J. Photogramm. Remote Sens. 2017, 133, 18–29. [Google Scholar] [CrossRef]
  21. Ranagalage, M.; Estoque, R.C.; Murayama, Y. An urban heat island study of the Colombo metropolitan area, Sri Lanka, based on Landsat data (1997–2017). ISPRS Int. J. Geo-Inf. 2017, 6, 189. [Google Scholar] [CrossRef]
  22. Du, S.; Xiong, Z.; Wang, Y.C.; Guo, L. Quantifying the multilevel effects of landscape composition and configuration on land surface temperature. Remote Sens. Environ. 2016, 178, 84–92. [Google Scholar] [CrossRef]
  23. Turner, M.G.; Gardner, R.H. Landscape Ecology in Theory and Practice; Springer: New York, NY, USA, 2015. [Google Scholar]
  24. Xu, H.Q. A remote sensing urban ecological index and its application. Acta Ecol. Sin. 2013, 33, 7853–7862. [Google Scholar]
  25. Li, X.; Meng, Q.; Gu, X.; Jancso, T.; Yu, T.; Wang, K.; Mavromatis, S. A hybrid method combining pixel-based and object-oriented methods and its application in Hungary using Chinese HJ-1 satellite images. Int. J. Remote Sens. 2013, 34, 4655–4668. [Google Scholar] [CrossRef]
  26. Gu, H.; Singh, A.; Townsend, P.A. Detection of gradients of forest composition in an urban area using imaging spectroscopy. Remote Sens. Environ. 2015, 167, 168–180. [Google Scholar] [CrossRef]
  27. Zhao, S.; Zhu, W.; Shen, W.; Zhang, J.; He, B.; Li, Q. Gauging the ecological and environmental influences of the guangdong-hong kong-macao greater bay area on the pearl river estuary using the remote sensing ecological index. Water 2021, 13, 2256. [Google Scholar]
  28. Zhou, M. Evaluation of ecological environment quality of Dongjiang River headwaters based on remote sensing ecological index during 2000–2019. Bull Soil Water Conserv. 2021, 4, 231. [Google Scholar]
  29. Paudel, B.; Andersen, P. Monitoring ecological conditions at multiple scales using the Remote Sensing Ecological Index (RSEI) in the Middle Hills of Western Nepal. Remote Sens. 2020, 12, 1543. [Google Scholar]
  30. Gorelick, N.; Hancher, M.; Dixon, M.; Ilyushchenko, S.; Thau, D.; Moore, R. Google Earth Engine: Planetary-scale geospatial analysis for everyone. Remote Sens. Environ. 2017, 202, 18–27. [Google Scholar] [CrossRef]
  31. Zhou, J.; Menenti, M.; Jia, L.; Gao, B.; Zhao, F.; Cui, Y.; Xiong, X.; Liu, X.; Li, D. A scalable software package for time series reconstruction of remote sensing datasets on the Google Earth Engine platform. Int. J. Digit. Earth 2023, 16, 988–1007. [Google Scholar] [CrossRef]
  32. de Raus Maure, E.; Ilyushchenko, S.; Terauchi, G. A Simple Procedure to Preprocess and Ingest Level-2 Ocean Color Data into Google Earth Engine. Remote Sens. 2022, 14, 4906. [Google Scholar] [CrossRef]
  33. Habibie, M.I. The application of machine learning using google earth engine for remote sensing analysis. J. Teknoinfo 2022, 16, 1872. [Google Scholar] [CrossRef]
  34. Zhai, H.M.; Xie, W.Q.; Li, S.Q.; Zhang, Q. Evaluation of urban ecological environment based on remote sensing based ecological index model. Fresen. Environ. Bull. 2021, 30, 2527–2535. [Google Scholar]
  35. Wang, J.F.; Xu, C.D. Geodetector: Principle and prospective. Acta Geogr. Sinica. 2017, 72, 116–134. [Google Scholar]
  36. Wang, J.F.; Zhang, T.L.; Fu, B.J. A measure of spatial stratified heterogeneity. Ecol. Indic. 2016, 67, 250–256. [Google Scholar] [CrossRef]
  37. Ma, J.; Chen, F.; Liu, Y.; Xu, Y.; Chen, K.; Liu, M. The analysis of global ecological regionalization factors based on geographical detector models. Sci. Rep. 2020, 10, 16443. [Google Scholar]
  38. Song, Y.Z.; Wang, J.F.; Ge, Y.; Xu, C.D. An optimal parameters-based geographical detector model enhances geographic characteristics of explanatory variables for spatial heterogeneity analysis: Cases with different types of spatial data. GISci. Remote Sens. 2020, 57, 593–610. [Google Scholar] [CrossRef]
  39. Meng, X.; Gao, X.; Lei, J.; Li, S. Development of a multiscale discretization method for the geographical detector model. Int. J. Geogr. Inf. Sci. 2021, 35, 1650–1675. [Google Scholar] [CrossRef]
  40. Zheng, S.; Tang, Y.; Chan, F.K.S.; Cao, L.Y.; Song, R.X. The demographic implication for promoting sponge city initiatives in the Chinese megacities: A case of Wuhan. Water 2022, 14, 883. [Google Scholar] [CrossRef]
  41. Xu, L.; Zhang, Z.; Tan, G.M.; Zhou, J.; Wang, Y. Analysis on the Evolution and Resilience of Ecological Network Structure in Wuhan Metropolitan Area. Sustainability 2022, 14, 8580. [Google Scholar] [CrossRef]
  42. Ehrlich, D.; Freire, S.; Melchiorri, M.; Kemper, T. Open and Consistent Geospatial Data on Population Density, Built-Up and Settlements to Analyse Human Presence, Societal Impact and Sustainability: A Review of GHSL Applications. Sustainability 2021, 13, 7851. [Google Scholar] [CrossRef]
  43. Yang, J.; El-Kassaby, Y.; Guan, W. The Effect of Slope Aspect on Vegetation Attributes in a Mountainous Dry Valley, Southwest China. Sci. Rep. 2020, 10, 16465. [Google Scholar] [CrossRef]
  44. Eisfelder, C.; Asam, S.; Hirner, A.; Reiners, P.; Holzwarth, S.; Bachmann, M.F.; Gessner, U.; Dietz, A.; Huth, J.; Bachofer, F.; et al. Seasonal Vegetation Trends for Europe over 30 Years from a Novel Normalised Difference Vegetation Index (NDVI) Time-Series—The TIMELINE NDVI Product. Remote Sens. 2023, 15, 3616. [Google Scholar] [CrossRef]
  45. Stoyanov, A. Application of Tasseled Cap Transformation of Sentinel-2—MSI Data for Forest Monitoring and Change Detection on Territory of Natural Park “BLUE STONES”. Environ. Sci. Proc. 2022, 22, 42. [Google Scholar] [CrossRef]
  46. Han, W.; Duan, S.-B.; Tian, H.; Lian, Y. Estimation of land surface temperature from AMSR2 microwave brightness temperature using machine learning methods. Int. J. Remote Sens. 2023, 1–22. [Google Scholar] [CrossRef]
  47. Azad, R.; Balzter, H.; Rasul, G.R.F.I.; Hameed, H.M.; Wheeler, J.; Adamu, B.; Ibrahim, S.; Najmaddin, P.M. Applying Built-Up and Bare-Soil Indices from Landsat 8 to Cities in Dry Climates. Land 2018, 7, 81. [Google Scholar] [CrossRef]
  48. Li, Q.; Yu, F.F.; Mu, X. Evaluation of the Ecological Environment Quality of the Kuye River Source Basin Using the Remote Sensing Ecological Index. Int. J. Environ. Res. Public Health 2022, 19, 12500. [Google Scholar] [CrossRef] [PubMed]
  49. Jiang, X.; Guo, X.; Wu, Y.; Xu, D.; Liu, Y.; Yang, Y.; Lan, G. Ecological vulnerability assessment based on remote sensing ecological index (RSEI): A case of Zhongxian County, Chongqing. Front. Environ. Sci. 2023, 10, 1074376. [Google Scholar]
  50. Gong, C.; Wang, S.; Lu, H.; Liu, J. Research Progress on Spatial Differentiation and Influencing Factors of Soil Heavy Metals Based on Geographical Detector. Huan Jing Ke Xue = Huanjing Kexue 2023, 44, 2799–2816. [Google Scholar] [PubMed]
  51. Xu, T.Q.; Chen, Y.P. Eco-Efficiency Assessment of Wuhan Based on Data Envelopment Analysis Approach. In Proceedings of the 27th Chinese Control and Decision Conference (2015 CCDC), Qingdao, China, 23–25 May 2015. [Google Scholar]
  52. Xiong, H.; Hu, H.; Han, P.; Wang, M. Integrating Landscape Ecological Risks and Ecosystem Service Values into the Ecological Security Pattern Identification of Wuhan Urban Agglomeration. Int. J. Environ. Res. Public Health 2023, 20, 2792. [Google Scholar] [CrossRef] [PubMed]
  53. Xie, F.; Liu, S.; Gao, Y.; Zhu, Y.; Wu, K.; Qi, M.; Duan, S.; Tahir, A.M. Derivation of Supraglacial Debris Cover by Machine Learning Algorithms on the GEE Platform: A Case Study of Glaciers in the Hunza Valley. ISPRS Ann. Photogramm. Remote Sens. Spat. Inf. Sci. 2020, V-3, 417–420. [Google Scholar] [CrossRef]
  54. Papaiordanidis, S.; Gitas, I.Z.; Katagis, T. Soil Erosion Prediction Using the Revised Universal Soil Loss Equation (RUSLE) in Google Earth Engine (GEE) Cloud-Based Platform. Dokuchaev Soil Bull. 2020, 100, 36–52. [Google Scholar] [CrossRef]
  55. Wang, H.; Hua, L. Dynamic Monitoring of Ecological Environment Quality in Xiamen Based on the GEE Platform. In Proceedings of the Fourth International Conference on Geoscience and Remote Sensing Mapping (GRSM 2022), Changchun, China, 4–6 November 2022. [Google Scholar]
  56. Wu, S.; Cao, L.; Xu, D.; Zhao, C. Historical Eco-Environmental Quality Mapping in China with Multi-Source Data Fusion. Appl. Sci. 2023, 13, 8051. [Google Scholar] [CrossRef]
  57. An, M.; Li, W.; Wu, H.; An, H.; Huang, J. The Local Coupling and Telecoupling of Urbanization and Ecological Environment Quality Based on Multisource Remote Sensing Data. J. Environ. Manag. 2022, 327, 116921. [Google Scholar] [CrossRef]
  58. Xu, H.; Wang, M.; Shi, T.; Guan, H.; Fang, C.; Lin, Z. Prediction of Ecological Effects of Potential Population and Impervious Surface Increases Using a Remote Sensing Based Ecological Index (RSEI). Ecol. Indic. 2018, 93, 730–740. [Google Scholar] [CrossRef]
  59. Cai, W.; Xu, F. The Impact of the New Environmental Protection Law on Eco-Innovation: Evidence from Green Patent Data of Chinese Listed Companies. Environ. Sci. Pollut. Res. 2021, 29, 10047–10062. [Google Scholar] [CrossRef] [PubMed]
  60. Hu, S.; Deng, J.; Li, X. Practice of Water Ecological Restoration of Large Urban Eutrophication Lake—A case of study of Donghu Lake, Wuhan. E3S Web Conf. 2023, 394, 01011. [Google Scholar] [CrossRef]
  61. Wang, K.; Zhou, W.Q.; Li, W. Impacts of population spatio-temporal dynamics on ecosystem quality during fast urbanization in Beijing, China. J. Appl. Ecol. 2016, 27, 2137–2144. [Google Scholar]
  62. Zhang, Y.Z.; Jiang, Z.Y.; Li, Y.Y.; Yang, Z.G.; Wang, X.H.; Li, X.B. Construction and Optimization of an Urban Ecological Security Pattern Based on Habitat Quality Assessment and the Minimum Cumulative Resistance Model in Shenzhen City, China. Forests 2021, 12, 847. [Google Scholar] [CrossRef]
  63. Li, J.; Gong, J.; Guldmann, J.-M.; Yang, J. Assessment of Urban Ecological Quality and Spatial Heterogeneity Based on Remote Sensing: A Case Study of the Rapid Urbanization of Wuhan City. Remote Sens. 2021, 13, 4440. [Google Scholar] [CrossRef]
  64. Huang, M.H.; Chen, J.J. Spatial and Temporal Change Analysis of Urban Heat Island Effect in Wuhan City. ISPRS—Int. Arch. Photogramm. Remote Sens. Spat. Inf. Sci. 2020, XLII-3/W10, 705–712. [Google Scholar] [CrossRef]
  65. Halbac-Cotoara-Zamfir, R.; Marucci, A.; Salvia, R.; Quaranta, G.; Sateriano, A.; Cecchini, M.; Bianchini, L. Caring of the Fringe? Mediterranean Desertification between Peri-Urban Ecology and Socioeconomics. Sustainability 2022, 14, 1426. [Google Scholar] [CrossRef]
  66. Zipperer, W.C.; Northrop, R.J.; Andreu, M.G. Urban development and environmental degradation. In Oxford Research Encyclopedia of Environmental Science; Oxford University Press: Oxford, UK, 2020; ISBN 978-0-19-938941-4. [Google Scholar]
  67. Xie, Q.J.; Han, Y.D.; Zhang, L.M.; Han, Z. Dynamic Evolution of Land Use/Land Cover and Its Socioeconomic Driving Forces in Wuhan, China. Int. J. Environ. Res. Public Health 2023, 20, 3316. [Google Scholar] [CrossRef]
  68. Zhang, J.L.; Hou, Y.; Dong, Y.F.; Wang, C.; Chen, W.P. Land Use Change Simulation in Rapid Urbanizing Regions: A Case Study of Wuhan Urban Areas. Int. J. Environ. Res. Public Health 2022, 19, 8785. [Google Scholar] [CrossRef]
  69. Wang, Z.; Zeng, J.; Chen, W. Impact of Urban Expansion on Carbon Storage Under Multi-Scenario Simulations in Wuhan, China. Environ. Sci. Pollut. Res. 2022, 29, 45507–45526. [Google Scholar] [CrossRef] [PubMed]
  70. Pan, Y.; Gong, J.; Li, J. Assessment of Remote Sensing Ecological Quality by Introducing Water and Air Quality Indicators: A Case Study of Wuhan, China. Land 2022, 11, 2272. [Google Scholar] [CrossRef]
  71. Zhang, M.; Kafy, A.; Ren, B.; Zhang, Y.; Tan, S.; Li, J. Application of the Optimal Parameter Geographic Detector Model in the Identification of Influencing Factors of Ecological Quality in Guangzhou, China. Land 2022, 11, 1303. [Google Scholar] [CrossRef]
  72. Yin, H.; Chen, C.N.; Dong, Q.; Zhang, P.; Chen, Q.L.; Zhu, L. Analysis of Spatial Heterogeneity and Influencing Factors of Ecological Environment Quality in China’s North-South Transitional Zone. Int. J. Environ. Res. Public Health 2022, 19, 2236. [Google Scholar] [CrossRef]
  73. Chen, H.; Liu, Y.; Hu, L.; Zhang, Z.; Chen, Y.; Tan, Y. Constructing a Flood-Adaptive Ecological Security Pattern from the Perspective of Ecological Resilience: A Case Study of the Main Urban Area in Wuhan. Int. J. Environ. Res. Public Health 2022, 20, 385. [Google Scholar] [CrossRef]
Figure 1. The location of Wuhan City, Hubei Province, China.
Sustainability 16 03598 g001
Figure 2. Technical Flowchart.
Sustainability 16 03598 g002
Figure 3. Area and proportion of Wuhan EQ classification areas from 2001 to 2021. (a) Area of different grades; (b) proportion of different grades.
Sustainability 16 03598 g003
Figure 4. Classification map of EQ from 2001 to 2021 in Wuhan.
Sustainability 16 03598 g004
Figure 5. Changes in EQ type area in Wuhan City from 2001 to 2021. Note: A. Significant Improvement; B. Mild Improvement; C. Unchanged; D. Mild Deterioration; E. Significant Deterioration.
Sustainability 16 03598 g005
Figure 6. Spatial Distribution Map of EQ Changes in Wuhan from 2001 to 2021.
Sustainability 16 03598 g006
Figure 7. Heat map of factor interaction detection results.
Sustainability 16 03598 g007
Figure 8. Changes in average annual temperature and precipitation in Wuhan from 2001 to 2021.
Sustainability 16 03598 g008
Table 1. Source information of the data.
Data NameResolutionData SourceData Preprocessing
WET30 mGoogle Earth EngineMosaicking, Reclassification
NDVI30 mMosaicking, Reclassification
LST30 mMosaicking, Reclassification
NDBSI30 mMosaicking, Reclassification
DEM30 mGeospatial data cloud
(www.gscloud.cn) (accessed on 30 September 2023)
Mosaicking, Clipping, Reclassification
Slope1000 mExtraction, Clipping
Aspect1000 mExtraction, Clipping
GDP1000 mGeometric correction
Population1000 mCAS Resource and Data Center (www.resdc.cn) (accessed on 30 September 2023)Clipping, Geometric correction,
Reclassification
Table 2. The ecological environment situation scale.
Level IndexFeature Description
Worse
(0 < RSEI ≤ 0.2)
Low vegetation cover, drought and low rainfall, rock exposure, soil drying, and obvious limitations on human life.
Poor
(0.2 < RSEI ≤ 0.4)
Relatively low vegetation coverage, dry weather, sparse rainfall, fewer species, are notable factors limiting human habitation.
Fair
(0.4 < RSEI ≤ 0.6)
Medium coverage, moderate rainfall, suitable for human habitation, and factors limiting human survival.
Good
(0.6 < RSEI ≤ 0.8)
High vegetation coverage, rich biodiversity, soil rich in organic matter, and favorable climate; suitable for human residence.
Better
(0.8 < RSEI ≤ 1.0)
High vegetation coverage, rich biodiversity, high organic matter content in the soil, moist and pleasant climate, and ecological stability
Table 3. Interaction types of the detection factors.
Interaction TypeJudgment Criteria
Non-linear Weakening q X 1 X 2 < M i n q X 1 , q X 2
Non-linear Attenuation M i n [ q ( X 1 ) , q ( X 2 ) ] < q ( X 1 X 2 < M a x [ q ( X 1 ) , q ( X 2 ) ]
Bifactor Enhancement q X 1 X 2 > M a x q ( X 1 ) , q ( X 2 )
Mutually Independent q X 1 X 2 = q X 1 + q X 2
Non-linear Enhancement q X 1 X 2 > q X 1 + q X 2
Table 4. Area statistics of RSEI levels from 2001 to 2021 in Wuhan.
Ecological Rating20012006201120162021
Area
/km2
Area
/%
Area
/km2
Area
/%
Area
/km2
Area
/%
Area
/km2
Area
/%
Area
/km2
Area
/%
Worse93.231.212146.9225.581809.0321.56262.373.13283.633.38
Poor3815.6543.253021.7236.012863.9734.132240.6026.702063.8524.59
Fair2274.2529.532056.6224.512012.6823.981027.3312.242324.5627.70
Good823.6210.621099.5613.11118.1413.322604.6431.042813.5233.52
Better1235.2514.72134.891.61588.667.013057.0736.431043.2112.43
Total8392.62100.008392.25100.008392.48100.008392.01100.008392.37100.00
Table 5. Comparative Spatial Scale Effects of Driving Factor q and 90th Percentile.
FactorLSTNDVIWETNDBSIPOPGDPDEMPDPXThe 90th
Percentile of q
Grid Size
2 km0.3530.8690.1450.7430.0280.0270.0680.0250.0240.756
3 km0.2870.8430.1750.7210.0260.0290.0710.0210.0190.733
Table 6. Spatial Heterogeneity Response of RSEI Value to Nine Driving Factors.
FactorLSTNDVIWETNDBSIPOPGDPDEMPDPX
q0.3530.8690.1450.7430.0280.0270.0680.0250.024
p0.0000.0000.0000.0000.0000.0000.0000.0150.017
Ranking314267589
Disclaimer/Publisher’s Note: The statements, opinions and data contained in all publications are solely those of the individual author(s) and contributor(s) and not of MDPI and/or the editor(s). MDPI and/or the editor(s) disclaim responsibility for any injury to people or property resulting from any ideas, methods, instructions or products referred to in the content.

