
Response of Sandy Soil–Water Migration to Different Conditions under Unidirectional Freezing

1
Institute of Cold Groundwater Research, Heilongjiang University, Harbin 150080, China
2
School of Hydraulic and Electric Power, Heilongjiang University, Harbin 150080, China
*
Author to whom correspondence should be addressed.
Sustainability 2024, 16(9), 3597; https://0-doi-org.brum.beds.ac.uk/10.3390/su16093597
Submission received: 10 July 2023
/
Revised: 20 April 2024
/
Accepted: 22 April 2024
/
Published: 25 April 2024
(This article belongs to the Special Issue The 13th International Symposium on Cold Region Development Conference (ISCORD 2023))
Abstract
:In order to conserve valuable soil and water resources and avoid problems related to frozen soil, it is important to study the migration of frozen soil water. A greater understanding of frozen soil–water migration can assist with sustainable development and utilization of soil and water resources in frozen areas. This study used an indoor soil column test device to conduct a one-way indoor freezing test of unsaturated soil and the response of soil sample water migration to different freezing temperatures, initial moisture contents, soil densities, freezing times, solute concentrations, and solute types. The experimental and analytical results showed that the temperature field of the soil sample could be divided into three stages: sharp cooling, slow cooling, and stability. After the soil sample had been frozen for 100 h, the temperature field stabilized. The freezing temperature, initial water content, soil density, and freezing time affected water migration in the soil sample. Lower freezing temperatures and greater initial water content resulted in higher levels of water migration. By contrast, greater soil density led to lower water migration levels. In addition, longer freezing times produced smoother soil–water migration curves. The solute concentration and solute type also affected water migration in frozen soil; the higher the solute concentration, the greater the water migration. Compared with CaCl2, NaCl had a stronger effect, causing more water migration and leading to a higher water content. The research findings will aid further studies on soil and water utilization, environmental maintenance, and restoration in areas with seasonally frozen soil, as well as promote the sustainable development of agriculture, water conservancy project development, and the social economy.
1. Introduction
Frozen soil accounts for approximately 3/4 of China’s total area, with permafrost accounting for 22.3% of the land area and seasonally frozen soil accounting for 53.5% [1]. When low temperatures cause the soil to freeze, water migrates upward from the lower soil levels and is stored as ice in the frozen upper levels. The frozen soil forms a weakly permeable layer near the surface, which greatly reduces the evaporation rate and effectively avoids the loss of seepage water. This discovery has been widely applied to northern China’s farmland water storage and soil moisture preservation. The phenomenon ensures that the soil is in a good, moist condition during spring plowing, but at the same time, spring waterlogging inevitably occurs. Given the dual influence of human activities and global climate change, permafrost areas’ hydrology, climate, resources, and environment are playing increasingly influential roles in agriculture, the environment, and the economy, with critical implications for human populations. Therefore, water and heat transfer during soil freezing has become an important research topic. The exploitation and utilization of soil and water resources and the maintenance and restoration of the environment in seasonally frozen regions are discussed in this paper, with particular emphasis on the development of agriculture and the social economy.
Water migration in frozen soil is an important part of the natural water cycle and plays a critical role in agriculture, water resources, environmental systems, and capital construction, particularly in road construction in seasonally frozen areas [2]. Furthermore, the freezing and melting of soil water have led to various disasters. Several scholars have analyzed the effects of water migration on frozen soil. For example, according to experimental research on migration mechanisms, temperature and water content, unfrozen water content, and soil water potential are the three basic factors influencing the migration of water and salt in frozen and thawed soils. Water is the primary carrier of salt in the soil and so plays a key role in salt transport, and the factors affecting water migration also affect salt migration [2]. Researchers have studied the effects of different dry densities and initial moisture content on soil–water migration [3] and conducted experiments on water migration at different freezing temperatures and with freezing methods [4]. Many scholars have studied water migration and ice formation mechanisms under external loads [5,6]. Other studies have involved the dynamic observation of soil sample moisture content and the analysis of the changing state of moisture content in test soil samples [7]. Changes in the temperature field and water content before and after freezing and thawing have been analyzed by changing the initial water content or temperature model [8]. Xu et al. [9] investigated the effects of soil–water migration in a closed system during freezing. The effects of different dry densities, freezing times, and moisture contents on soil water transport characteristics have also been analyzed [10]. Cao et al. studied the effects of water transport in soil under different saturations, temperature gradients, freezing rates, and hydration conditions [11]. Other scholars have studied the effect of temperature gradients on water migration [12,13,14].
Many researchers have studied the hydrothermal characteristics of frozen soils. Mao et al. designed and conducted monitoring experiments on the water content and temperature changes in the freezing zone and analyzed water migration patterns in different soils during the freezing process [15]. Some researchers have also analyzed the movement patterns of soil moisture under various snow cover conditions [16]. The mechanism of hydrothermal interaction was analyzed through one-year on-site dynamic observations of the hydrothermal state, frost heave, and freezing depth [17]. Hou et al. analyzed the corresponding moisture, salt, and temperature functions in soil samples using an indoor, unidirectional freezing test [18]. The characteristics of their changes during different freeze–thaw periods were analyzed by studying the interannual and daily variations in soil temperature, water content, and surface heat flux during freeze–thaw periods [19]. Sun et al. analyzed the response of water migration and distribution to soil moisture and temperature by monitoring soil moisture and temperature at different depths in a semi-arid agricultural pastoral ecotone in northern China [20]. Most of the above studies were qualitative in terms of the transport law of water and heat in frozen soil.
Many scholars have focused on systematic studies of the effects of different temperature gradients, soil densities, and initial water contents on water migration in frozen soil. However, soil water often contains a variety of salts. Previous studies have failed to consider the effects of different solute concentrations and solute types on hydrological migration in frozen soil, affecting soil hydrological content in spring and thus affecting spring plowing. In addition, extreme climate events are frequent and low- or ultra-low-temperature weather events can easily occur. Considering the influence of different conditions on soil–water migration at relatively low temperatures is important for future research on the change and sustainable utilization of water resources in cold regions under climate change. Therefore, an indoor one-way freezing test investigated the effects of different freezing temperatures, soil densities, initial water contents, freezing times, and solute concentrations on water migration. The aim was to further study the mechanisms and quantitative change in soil–water migration in frozen soil and provide technical information to assist with the sustainable utilization of frozen-soil water resources. The research findings will aid further studies on soil and water utilization, environmental maintenance, and restoration in areas with seasonally frozen soil, as well as promote the sustainable development of agriculture, water conservancy project development, and the social economy.
2. Materials and Methods
2.1. Soil Samples and Reagents
Sandy soil from the Hulan Campus of Heilongjiang University in China was used for the experiment. First, visible stones and other debris were removed from the collected soil samples. The soil was then passed through a 0.25 mm sieve after natural air drying, and the amount of sieved soil required for the test soil samples was collected along with its moisture content. The test reagents used were NaCl, anhydrous CaCl2, anhydrous ethanol, and ethylene glycol. Anaerobic ethanol and ethylene glycol were used as antifreeze solutions in a cryogenic tank, and NaCl and anhydrous CaCl2 were used as solute solutions for the test soil samples. The reagent parameters used are listed in Table 1.
2.2. Test Device and Scheme Design
In this experiment, we designed a set of frozen water migration monitoring and data acquisition devices, including freezing, temperature cycle control, data monitoring, and data acquisition devices.
A one-way soil freezing test (Figure 1) was conducted in a cylindrical periclase tank (15 cm internal diameter, 50 cm height). Insulation materials were wrapped around the sides and bottom of the test device to ensure an internal insulation effect and one-way freezing of the soil samples. The NX-05AS refrigerant was placed on top of the soil sample, and a time-domain reflectometry (TDR) sensor was buried every 10 cm in the side hole of the glass groove to record real-time changes in the soil sample temperature and moisture content.
The temperature cycle control device adopted was an XT5201 series in a low-temperature incubator. A compressor cooled the circulating liquid, and the circulating liquid was exported to the freezing plate using a circulating pump.
The data monitoring device [21] had a V-3000-ECTH-N01 sensor, which could simultaneously monitor the conductivity, soil temperature, and humidity and reflect the soil moisture content by measuring the soil dielectric constant. The sensor has stable performance and high sensitivity and complies with international standards.
The data acquisition device [22] had a VMS-3000-XZJ-100-Y environmental monitoring host and uploaded the data collected by the sensors to the cloud platform through the RS485 interface. Subsequently, data visualization and editing could be conducted on a cloud platform.
Table 2 presents the experimental design for analyzing the rules of water transport under different freezing temperatures, soil densities, initial moisture contents, freezing times, solute concentrations, and solute species. The design can be tested on a research target by changing a single variable and performing a group comparison experiment. The freezing temperature was set to allow for a rapid drop in the column temperature at relatively low temperatures and to observe the migration of soil moisture at lower temperatures. The permeability coefficient of frozen soil was tested, and the data can be found in the relevant literature [23,24].
2.3. Test Methods and Steps
Step 1: The test preparation complied with the standard [25] for geotechnical test methods. The soil samples were dried in a drying box at 105 °C ± 2 °C for 12 h and placed in a dryer to cool before being removed and weighed. After weighing, the soil samples were placed in the oven until the quality of the samples remained unchanged. This experiment used the Malvern 3000 instrument to measure particle size, and the results showed that the soil particles were mostly between 0.15 and 1.5 mm in size, confirming that the sample was composed of fine sandy soil. The cumulative curve of the soil particles is shown in Figure 2.
Step 2: The amount of soil required for each group of soil columns was calculated. The appropriate concentration of solution was sprayed onto the soil sample. The sample was then covered with plastic wrap and allowed to stand for 48 h to ensure a uniform distribution of the solution in the soil sample.
Step 3: The soil column (15 cm inner diameter, 50 cm height) was divided into five layers. The soil samples were filled and compacted according to the test density with a total filling height of 50 cm. Small holes were reserved during soil filling, and one sensor was buried every 10 cm in the side direction of the soil column. Then, the soil column was wrapped with insulating cotton for axial freezing.
Step 4: The temperature and water content of the soil samples were monitored in real-time, and the values corresponding to each sensor layer were recorded every 5 min. After one set of tests, the soil sample was removed, and steps 2–4 were repeated.
3. Results and Discussion
3.1. Temperature Field Test Results and Analysis
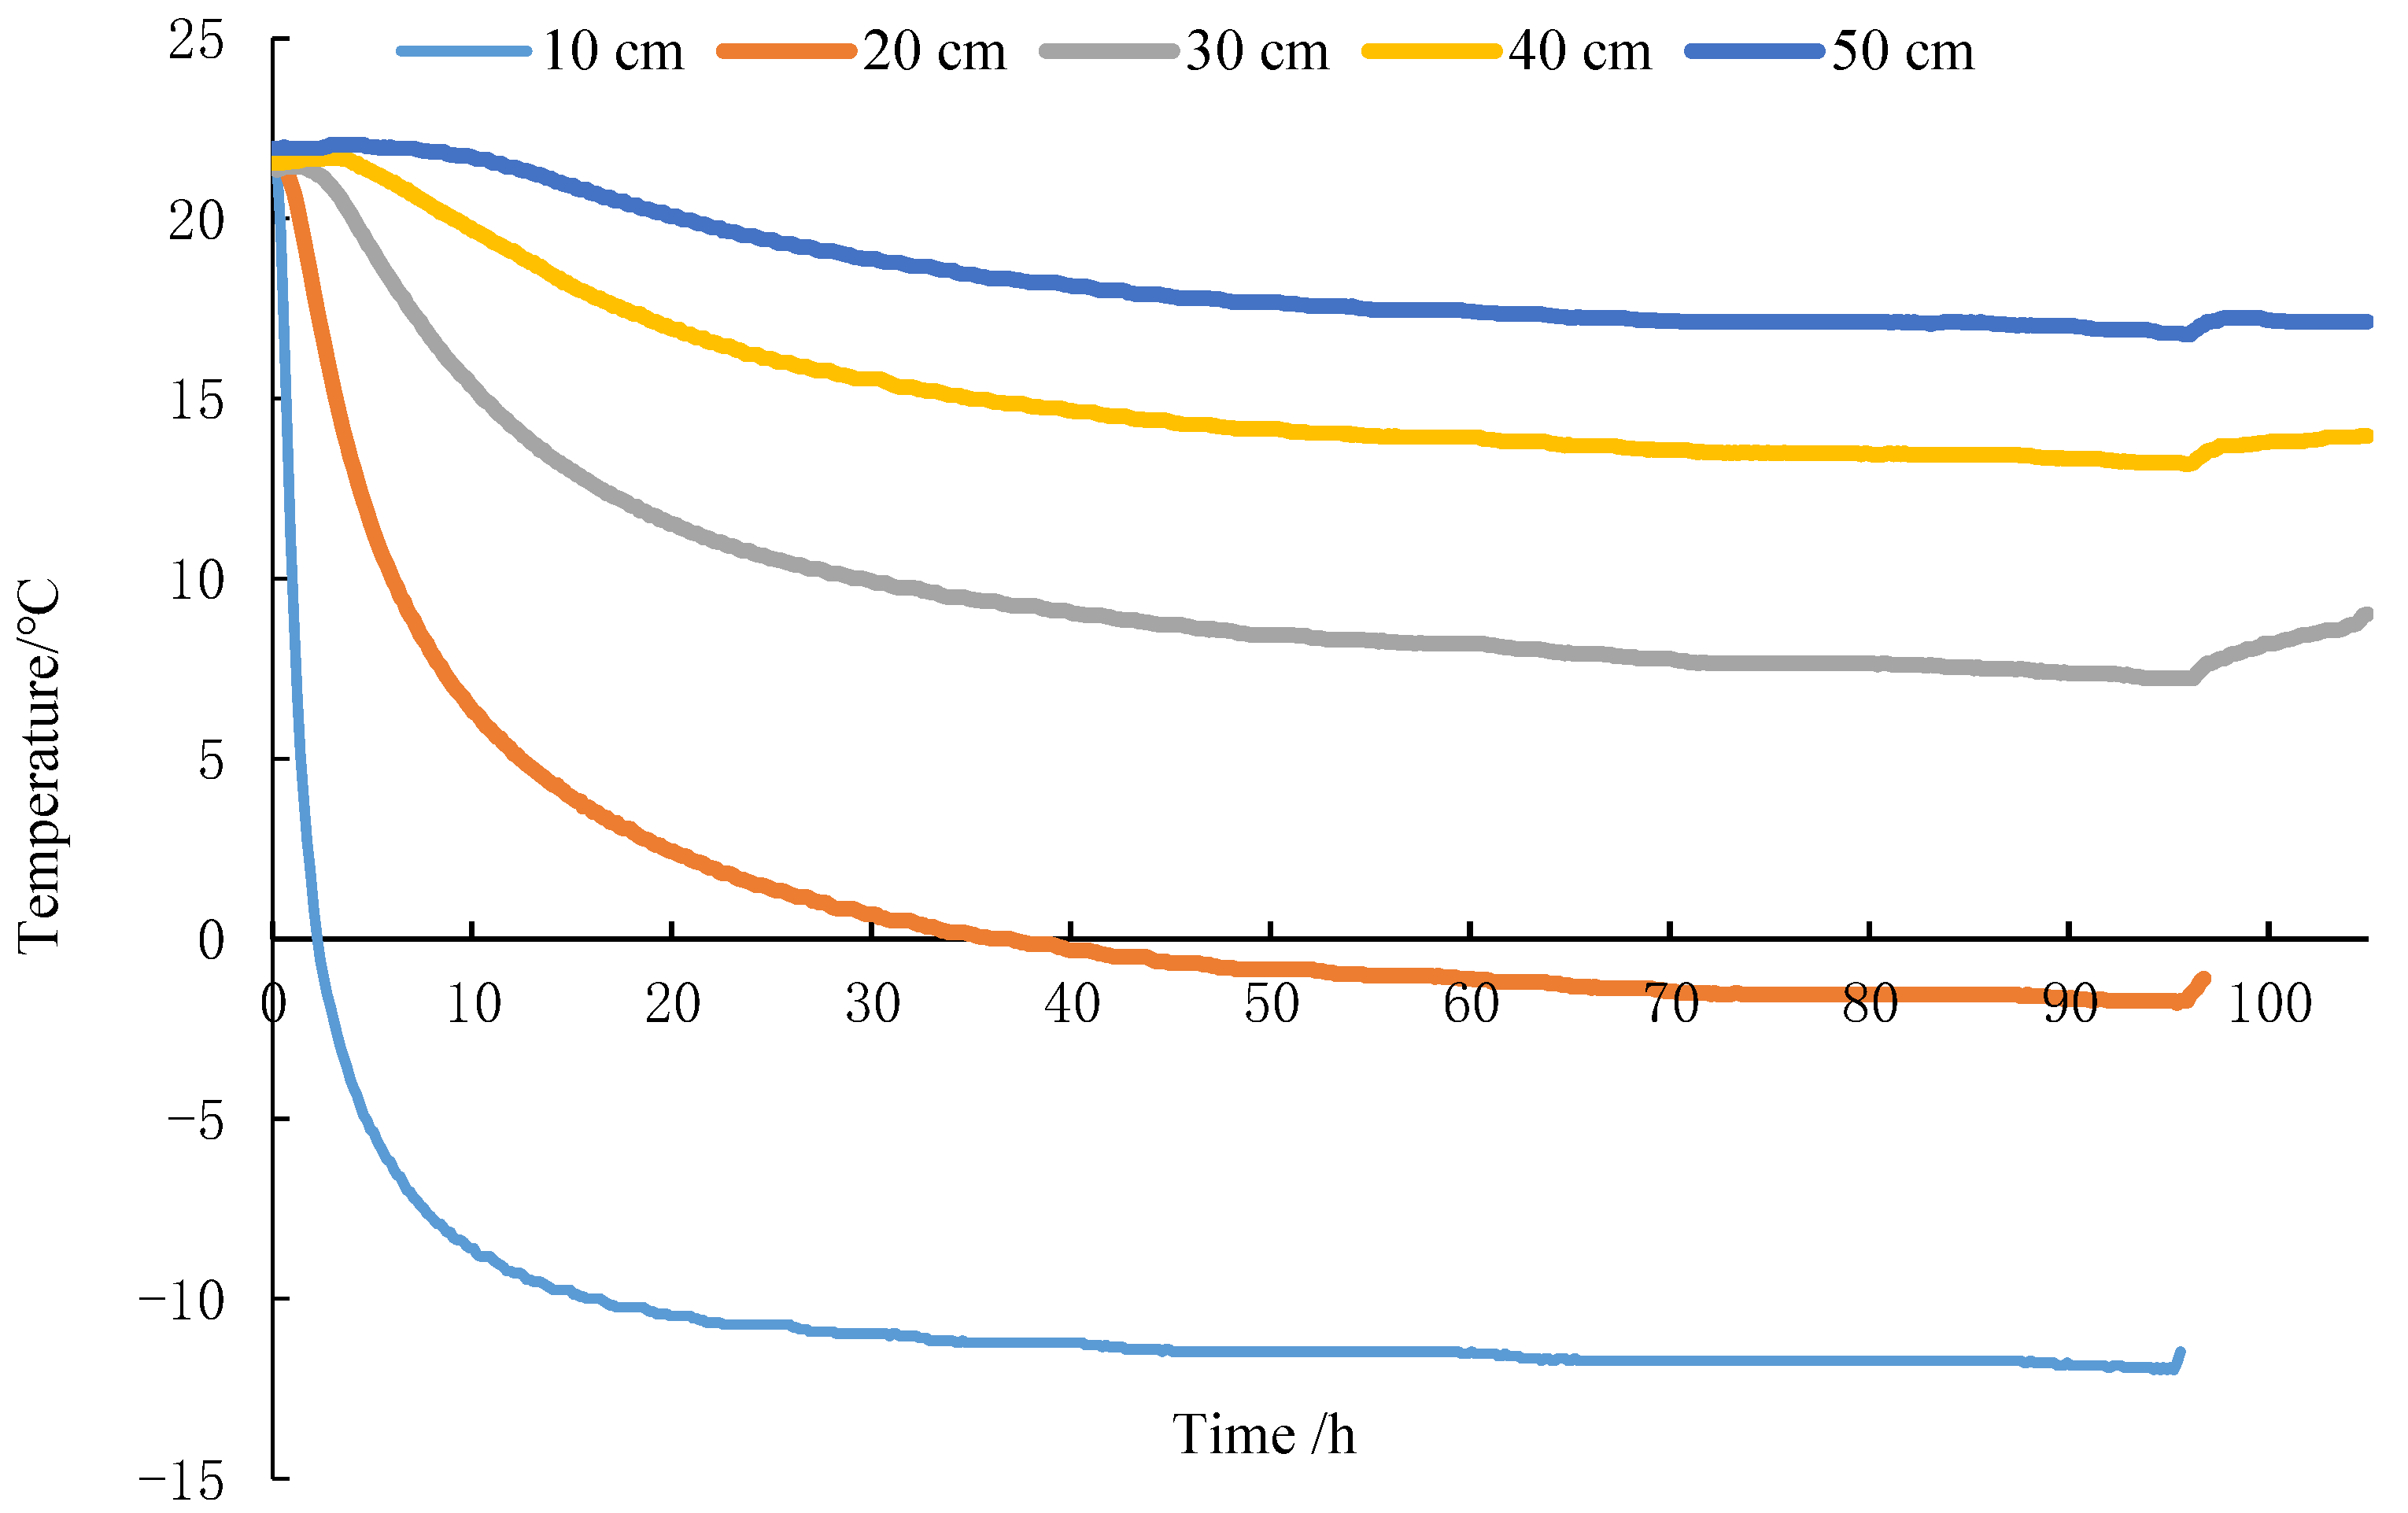
The temperature changes at different freezing temperatures of each layer in real-time, as measured by the TDR sensor, are shown in Figure 3 and Figure 4. The two figures show that the temperature field of each soil sample tends to stabilize after 100 h, and the temperature change over time can be divided into sharp, slow, and stable stages. During the sharp cooling stage of 0–12 h, the soil samples froze faster in the shortest time and the slowest time at 50 cm from the freezing plate. A slow cooling stage occurred at 12–73 h, and the temperature remained stable from 73 h to the end of the experimental phase. The closer the test soil sample was to the freezing plate, the more significant the temperature change. The water in the soil sample turned into ice, causing the soil sample to freeze, and the temperature sharply decreased over a short period, releasing a large amount of heat. When the different freezing temperatures were compared, the sharp cooling phase at −35 °C was shorter than the sharp cooling phase at −20 °C. This is because lower temperatures at the cold end led to a faster freezing speed and a shorter duration of the rapid freezing stage.
3.2. Effect of Different Freezing Conditions on Water Migration in the Soil
3.2.1. Freezing Temperature
The water migration curves of the soil under different freezing temperatures, initial moisture contents, soil densities, freezing times, solute concentrations, and solute species are shown in Figure 5. As can be seen from Figure 5, the water content of soil samples at −35 °C and −20 °C changes under the influence of low temperatures and is generally higher than the initial water content of the soil samples. This is because the soil freezes, and the water in the soil turns into ice and fills the pores, decreasing soil porosity and increasing soil water content. The lower the freezing temperature near the cold end, the faster the soil sample temperature drops quickly; the larger the frozen area, the lower the water content. The change in soil water content is more obvious when the freezing temperature is −35 °C than when the freezing temperature is −20 °C, indicating that low temperature is an important factor affecting soil–water migration. The lower the temperature, the more significant the soil–water migration change. In addition, it can be seen from the figure that when the freezing temperature is −20 °C, the soil water content is the highest at 10 cm, while when the freezing temperature is −35 °C, the soil water content is the highest at 20 cm, indicating that the position of the freezing front is different under low temperature. The lower the temperature, the deeper the freezing front. Some researchers have found that the freezing front moves downward with decreasing temperature, and the liquid water content of the soil decreases at all depths [19]. Some researchers have found that soil water moves towards the freezing front, and the decrease in liquid water is related to the location of the freezing front [17]. The results are relatively consistent.
3.2.2. Freezing Time
The soil–water migration curves for different freezing times at the same freezing temperature, initial moisture content, soil density, solute concentration, and solute type are shown in Figure 6. As shown in Figure 6, when the soil samples were frozen for 104 and 198 h and the freezing front was stable, there was little difference in the soil water content at the buried depth after freezing, and the maximum difference in water content was 3.71%. Overall, the variation trend of soil moisture under different freezing time conditions is the same, indicating that when the freezing time is sufficiently long, and freezing reaches a stable state, the influence of the soil moisture at each buried depth under the same conditions is relatively weak. The freezing time is no longer the main factor affecting the soil moisture content because a longer freezing time only slightly affects soil moisture. As time passes, water transfer in the unfrozen soil layer decreases. In addition, it can be seen from the figure that the soil water content is greater at 30 cm, and the water migrates to this place to form a freezing front, indicating that in the early freezing period, the soil water content changes significantly under the influence of temperature, but after freezing stability, the soil water content changes significantly less than in the earlier period, which is because the temperature in the soil tends to be stable with the further development of the freezing front. A large number of ice crystals fill the soil void, which greatly reduces the soil permeability coefficient. The rate of water moving in from below is greatly reduced. When the temperature reaches a stable level, the matrix potential difference in the region disappears, and no more free water freezes in the soil, making the water field stable.
3.3. Effect of Different Soil Characteristics on Water Migration in the Soil
3.3.1. Initial Moisture Content
Figure 7 shows the water migration curves of soil with different initial water contents under the same freezing temperature, soil density, freezing time, solute concentration, and solute type. The soil sample with a larger initial moisture content had a higher moisture content at each buried depth after freezing, indicating that the initial moisture content influenced the frozen soil moisture content. At the same time, the moisture content of the soil sample with an initial moisture content of 13% was higher at 20 cm after freezing, whereas that of the soil sample with an initial moisture content of 10% was higher at 30 cm after freezing, indicating that the initial moisture content affected the position of the freezing front. The initial water content somewhat affected the freezing front’s advance speed and position. The lower the initial water content, the farther the position of the freezing front. When the distance from the cold end is greater, the freezing time is longer, and the change rate of unfrozen water is slow; however, there is enough time for a certain amount of migration. In general, when the initial soil moisture content was high, the change in soil moisture content distribution after freezing was relatively insignificant. This is because the soil water supply is faster when the soil water content is greater. Far from the cold end, freezing is more challenging, making it harder to clearly detect the water content distribution of unfrozen soil. However, a lower soil water content slows down the soil water supply, and the water content distribution of the unfrozen samples is clearly revealed.
3.3.2. Dry Density
Figure 8 shows water migration curves for soils with different dry densities under the same freezing temperature, initial moisture content, freezing time, solute concentration, and solute species. The figure reveals that the soil density influences the frozen soil sample’s water content and the freezing position’s water content. When the soil density was low, the freezing level was 20 cm from the cold end. When the soil density was high, the freezing level was 30 cm away from the cold end, and the greater the soil density, the slower the formation of the freezing front. At different soil densities, the water content significantly increased at the frozen front and decreased in the unfrozen layer. Different soil densities can affect the microstructure of the soil samples. The smaller the soil density, the larger the pores between soil particles, and the poorer the continuity of the unfrozen water film between soil particles; increasing the soil density provides more migration opportunities for unfrozen water and soil samples with a large soil density before 38 cm from the cold end position. Thus, the greater the soil density, the more rapid the thermal conductivity of the soil sample is and the closer the contact between the soil particles is. The lack of sufficient space hinders and reduces water migration. In contrast, at lower soil densities, the thermal conductivity of the soil samples is lower, and the soil particles are looser, thereby increasing the volume content of the soil sample pores. At low densities, water can move freely within the large pore spaces. The water content of the soil samples with a high dry density at 38 cm from the cold end was less than that of the soil samples with a low soil density.
3.4. Effect of Different Solute Conditions on Water Migration in the Soil
3.4.1. Solute Concentration
Figure 9 displays the soil–water migration curves for different solute concentrations (NaCl solutes) at the same freezing temperature, initial water content, freezing time, soil density, and solute type. As the figure shows, the soil water content at 20 cm differs significantly according to the solute concentration; the higher the solute concentration, the higher the soil water content. However, the soil water content remained the same at all the other sites. Overall, the changes in soil–water migration were not significant. When the solute concentration is high, the freezing front appears first. The cold end becomes closer with a higher solute concentration in the soil sample. The reduction in temperature caused the soil water to partially freeze, leading to the precipitation of some NaCl solutes and an increase in solute concentration. This caused the osmotic pressure to increase, increasing the attraction to water, which migrated to the higher-concentration solution and accumulated on the frozen surface.
3.4.2. Solute Species
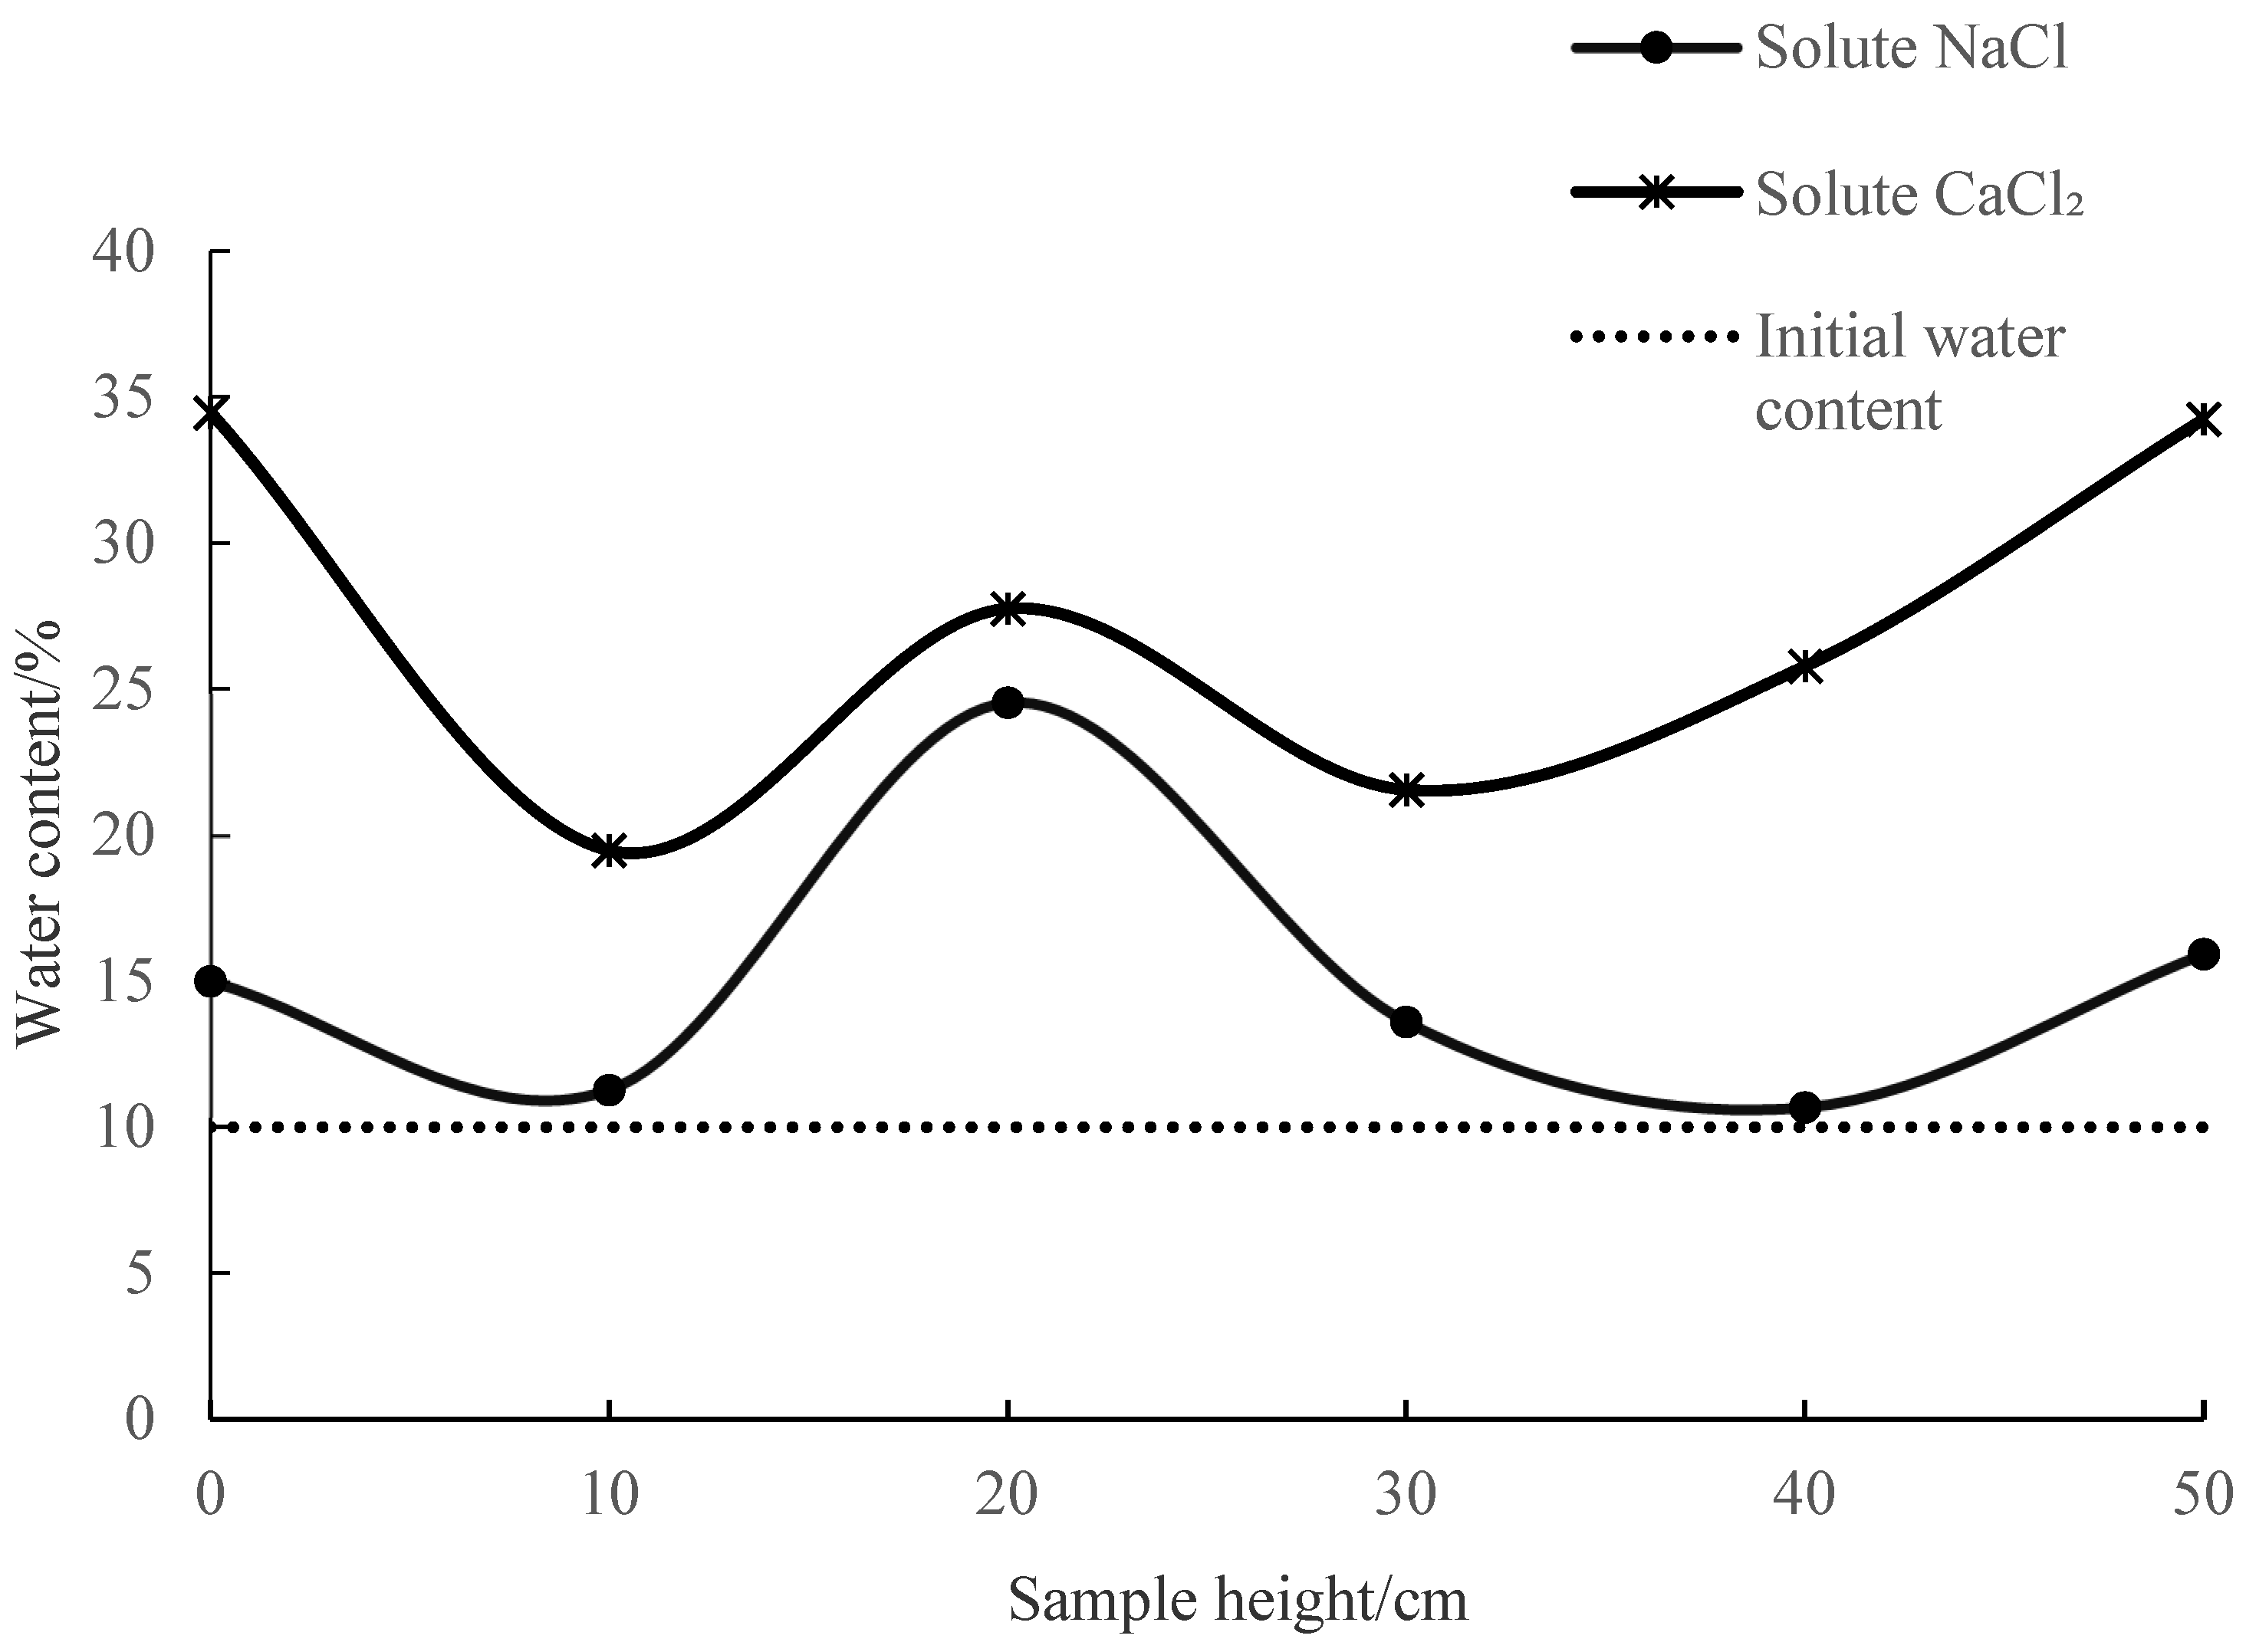
Figure 10 shows the water migration curves in the soil for different solute species at the same freezing temperature, initial water content, freezing time, solute concentration, and soil density. The figure shows that adding different types of salt to the soil sample significantly affected soil sample water migration. The water migration curves were similar regardless of whether the solute species was NaCl or CaCl2. When the solute was CaCl2, the soil sample water content fell rapidly at the cold end, from 34.47% to 19.48%. When it was NaCl, the soil water content decreased slowly from 14.99% to 11.27% at the cold end. The water content of the cold and warm sections was almost the same, regardless of whether the solute was CaCl2 or NaCl. When the solute was CaCl2, it was 34.47% and 34.25%, respectively. When it was NaCl, the water contents were 14.99% and 15.93%, respectively. Furthermore, it was found that NaCl had the strongest water transfer capacity. By contrast, CaCl2 blocks water movement and has poor water transfer capacity. The soil water content with a CaCl2 solute is always higher than when the solute is NaCl.
4. Conclusions
Using an indoor one-directional freezing test, this study investigated water migration trends at different freezing temperatures, soil densities, initial moisture contents, freezing times, solute concentrations, and solute species. The test results were as follows:
(1) The temperature field of the soil tended to stabilize after 100 h, and the temperature change over time could be divided into sharp, slow, and stable stages;
(2) Water migration in soil is affected by the freezing temperature, initial water content, freezing time, and soil density. Lower freezing temperatures led to higher levels of water migration. The higher the initial water content, the greater the water migration, whereas the higher the soil density, the lower the water migration. The longer the freezing time, the smoother the soil–water migration curve;
(3) Solute concentration and type also affect water migration in frozen soil. The higher the solute concentration, the greater the water migration. Compared with CaCl2, NaCl has a stronger effect on water migration, accumulates more water migration, and leads to a higher water content;
(4) In this study, only two values were set for each condition. In the future, we plan to combine numerical simulations to conduct further research.
Author Contributions
Conceptualization, M.C. and Y.G.; methodology, M.C.; formal analysis, Y.G.; experiment, J.M. and K.S.; investigation, J.M. and K.S.; writing—original draft preparation, J.M., K.S. and Y.G.; supervision, M.C. All authors have read and agreed to the published version of the manuscript.
Funding
We are grateful to Project UNPYSCT-2020012 Supported by the University Nursing Program for Young Scholars with Creative Talents in Heilongjiang Province and the Basic Scientific Research Fund of Heilongjiang Provincial Universities (2021-KYYWF-0049) for financial support.
Institutional Review Board Statement
Not applicable.
Informed Consent Statement
Not applicable.
Data Availability Statement
The data presented in this study are available on request from the corresponding author.
Conflicts of Interest
All authors declare no conflicts of interest.
References
- Zhou, Y.W.; Guo, D.X.; Qiu, G.Q.; Cheng, G.D.; Li, S.D. Chinese Permafrost; Science Press: Beijing, China, 2000. [Google Scholar]
- Xu, X.Z.; Deng, Y.S. Experimental Study of Water Migration in Permafrost; Science Press: Beijing, China, 1991. [Google Scholar]
- Wang, T.X.; Wang, J.J.; Zhang, L.D. Study of unsaturated loess under freezing. J. Xi’an Univ. Archit. Technol. Nat. Sci. Ed. 2012, 1, 7–13. [Google Scholar]
- Zhang, H.; Wang, T.X.; Luo, Y. Study of unsaturated loess under freezing. J. Eng. Geol. 2015, 1, 73–77. [Google Scholar]
- Konrad, J.M.; Morgenstern, N.R. A mechanistic theory of ice lens formation in fine-grained soils. Can. Geotech. J. 1980, 17, 476–486. [Google Scholar] [CrossRef]
- Gilpin, R.R. A model for the prediction of ice lensing and frost heave in soils. Wat. Resour. Res. 1980, 16, 918–930. [Google Scholar] [CrossRef]
- Mao, X.S.; Hou, Z.J.; Ma, B. Numerical analysis of water migration during unsaturated soil hydration process. Chin. Foreign Highw. 2006, 3, 36–38. [Google Scholar]
- Zhao, G.; Tao, X.X.; Liu, B. Study on water transfer test during freeze and thaw of in situ soil. Geotech. Eng. 2009, 12, 1952–1957. [Google Scholar]
- Xu, J.; Niu, F.J.; Niu, Y.H.; Hou, Z.J. Analysis of the subgrade and soil moisture migration characteristics during the freezing process. J. Chongqing Univ. 2013, 4, 150–158. [Google Scholar]
- Zhang, T.; Yang, P. Effect of unidirectional freezing of the soil on water migration in the soil. J. Nanjing For. Univ. (Nat. Sci. Ed.) 2013, 1, 117–121. [Google Scholar]
- Cao, C.; Lu, J.F.; Li, Q.T. Experimental study on one-way frozen water migration of indoor soil bodies. Sci. Technol. Eng. 2015, 9, 114–118. [Google Scholar]
- Prat, M. Analysis of experiments of moisture migration caused by temperature differences in unsaturated porous medium by means of two-dimensional numerical simulation. Int. J. Heat Mass Transf. 1986, 7, 1033–1039. [Google Scholar] [CrossRef]
- Nassar, I.N.; Horton, R.; Globus, A.M. Thermally induced water transfer in salinized unsaturated soil. Soil Sci. Soc. Am. J. 1997, 6, 1293–1298. [Google Scholar] [CrossRef]
- Wang, T.H.; Su, L.J. Experimental study on moisture migration in unsaturated loess under effect of temperature. J. Cold Reg. Eng. 2010, 3, 77–86. [Google Scholar] [CrossRef]
- Mao, X.; Miller, C.; Hou, Z.J.; Khandker, A.; Xiao, X. Experimental Study of Soil Water Migration in Freezing Process. Geotech. Test. J. 2014, 37, 436–446. [Google Scholar] [CrossRef]
- Fu, Q.; Jiang, R.Q.; Wang, Z.L.; Li, T.X.; Ma, Z.X. Soil moisture movement during freezing-thawing period under different snow covers. Trans. Chin. Soc. Agric. Mach. 2015, 46, 152–159. [Google Scholar]
- Rui, D.H.; Zhai, J.B.; Li, G.Y.; Zhang, J.; Teruyuki, S. Field experimental study of the characteristics of heat and water transfer during frost heaving. Cold Reg. Sci. Technol. 2019, 168, 102892. [Google Scholar] [CrossRef]
- Hou, R.J.; Li, T.X.; Fu, Q.; Liu, D.; Li, M.; Zhou, Z.Q.; Yan, J.W.; Zhang, S. Research on the distribution of soil water, heat, salt and their response mechanisms under freezing conditions. Soil Tillage Res. 2020, 196, 104486. [Google Scholar] [CrossRef]
- Liu, X.C.; Kang, Y.D.; Chen, H.N.; Lu, H. Hydrothermal effects of freeze-thaw in the Taklimakan Desert. Sustainability 2021, 13, 1292. [Google Scholar] [CrossRef]
- Sun, L.B.; Chang, X.M.; Yu, X.X.; Jia, G.D.; Chen, L.H.; Wang, Y.S.; Liu, Z.Q. Effect of freeze-thaw processes on soil water transport of farmland in a semi-arid area. Agric. Water Manag. 2021, 252, 106876. [Google Scholar] [CrossRef]
- Chen, M.; Chen, H.B.; Lou, A.Y. Effect of freezing temperature and initial water content on hydrothermal migration of silty soil under freezing. Arab. J. Geosci. 2022, 15, 207. [Google Scholar]
- Chen, M.; Liu, R.S.; Dong, Z. Effect of Different Chloride Salts on the Transport of Water, Heat, and Solutes in Sandy Soil under Freezing Conditions. J. Cold Reg. Eng. 2023, 37, 04023013. [Google Scholar] [CrossRef]
- Dong, Z. Solute Migration Test and Numerical Simulation Analysis of Unsaturated Soil in Cold Region. Master’s Thesis, Heilongjiang University, Harbin, China, 2020. [Google Scholar]
- Lu, S. Test and Numerical Simulation Analysis of Water Thermal Migration of Silty Soil in Cold Area under Freezing Action. Master’s Thesis, Heilongjiang University, Harbin, China, 2020. [Google Scholar]
- GB/T 50123-2019; Standard for Geotechnical Testing Method. China Planning Press: Beijing, China, 2019.
Figure 1.
Test device.

Figure 2.
Soil particle size accumulation curve.

Figure 3.
Variation curves of temperature with time under −35 °C. Note: ω = 10%, ρ = 1.23 g/cm³, c = 0.3 mol/L, solute NaCl, after 104 h of freezing.
Figure 3.
Variation curves of temperature with time under −35 °C. Note: ω = 10%, ρ = 1.23 g/cm³, c = 0.3 mol/L, solute NaCl, after 104 h of freezing.

Figure 4.
Variation curves of temperature with time under −20 °C. Note: ω = 10%, ρ = 1.23 g/cm3, c = 0.3 mol/L, solute NaCl, after 104 h of freezing.
Figure 4.
Variation curves of temperature with time under −20 °C. Note: ω = 10%, ρ = 1.23 g/cm3, c = 0.3 mol/L, solute NaCl, after 104 h of freezing.

Figure 5.
The moisture migration curve in soil under different freezing temperatures. Note: ω = 10%, ρ = 1.23 g/cm3, c = 0.3 mol/L, solute NaCl, after 104 h of freezing.
Figure 5.
The moisture migration curve in soil under different freezing temperatures. Note: ω = 10%, ρ = 1.23 g/cm3, c = 0.3 mol/L, solute NaCl, after 104 h of freezing.

Figure 6.
The moisture migration curve in the soil of different freezing times. Note: ω = 10%, ρ = 1.4 g/cm³, c = 0.3 mol/L, solute NaCl, freezing temperature −35 °C.
Figure 6.
The moisture migration curve in the soil of different freezing times. Note: ω = 10%, ρ = 1.4 g/cm³, c = 0.3 mol/L, solute NaCl, freezing temperature −35 °C.

Figure 7.
The moisture migration curve in the soil of different initial water content. Note: ρ = 1.53 g/cm3, c = 0.1 mol/L, solute NaCl, freezing temperature −35 °C, after 104 h of freezing.
Figure 7.
The moisture migration curve in the soil of different initial water content. Note: ρ = 1.53 g/cm3, c = 0.1 mol/L, solute NaCl, freezing temperature −35 °C, after 104 h of freezing.

Figure 8.
The moisture migration curve in the soil of different dry density soil. Note: ω = 10%, c = 0.3 mol/L, solute NaCl, freezing temperature −35 °C, after 104 h of freezing.
Figure 8.
The moisture migration curve in the soil of different dry density soil. Note: ω = 10%, c = 0.3 mol/L, solute NaCl, freezing temperature −35 °C, after 104 h of freezing.

Figure 9.
The moisture migration curve in the soil of different solute concentrations. Note: ω = 13%, ρ = 1.53 g/cm3, solute NaCl, freezing temperature −35 °C, after 104 h of freezing.
Figure 9.
The moisture migration curve in the soil of different solute concentrations. Note: ω = 13%, ρ = 1.53 g/cm3, solute NaCl, freezing temperature −35 °C, after 104 h of freezing.

Figure 10.
The moisture migration curve in the soil of different solute species. Note: ω = 10%, ρ = 1.23 g/cm3, c = 0.3 mol/L, freezing temperature −35 °C, after 104 h of freezing.
Figure 10.
The moisture migration curve in the soil of different solute species. Note: ω = 10%, ρ = 1.23 g/cm3, c = 0.3 mol/L, freezing temperature −35 °C, after 104 h of freezing.


Table 1.
Test reagent parameters.
| Name | Water Solubility | Relative Molecular Mass (g/mol) | Purity (%) |
|---|---|---|---|
| NaCl | Soluble in water | 58.45 | ≥99.5 |
| CaCl2 | Soluble in water | 111.00 | ≥96.0 |
| Anhydrous ethanol | Soluble in water | 46.07 | ≥99.7 |
| Ethylene glycol | Soluble in water | 62.07 | ≥99.0 |
Table 2.
Test scheme design.
| Soil Sample Number | Freezing Temperature/°C | Water-Solubility/% | Soil Density ρ/(g/cm³) | Soluble Concentration /(mol/L) | Soluble Type | Freeze Time/(h) |
|---|---|---|---|---|---|---|
| 1 | −35 | 10 | 1.23 | 0.3 | NaCl | 104 |
| 2 | −20 | 10 | 1.23 | 0.3 | NaCl | 104 |
| 3 | −35 | 10 | 1.53 | 0.1 | NaCl | 104 |
| 4 | −35 | 13 | 1.53 | 0.1 | NaCl | 104 |
| 5 | −35 | 10 | 1.23 | 0.3 | NaCl | 104 |
| 6 | −35 | 10 | 1.4 | 0.3 | NaCl | 104 |
| 7 | −35 | 13 | 1.53 | 0.2 | NaCl | 104 |
| 8 | −35 | 13 | 1.53 | 0.3 | NaCl | 104 |
| 9 | −35 | 10 | 1.23 | 0.3 | CaCl2 | 104 |
| 10 | −35 | 10 | 1.4 | 0.3 | NaCl | 198 |
Disclaimer/Publisher’s Note: The statements, opinions and data contained in all publications are solely those of the individual author(s) and contributor(s) and not of MDPI and/or the editor(s). MDPI and/or the editor(s) disclaim responsibility for any injury to people or property resulting from any ideas, methods, instructions or products referred to in the content. |
© 2024 by the authors. Licensee MDPI, Basel, Switzerland. This article is an open access article distributed under the terms and conditions of the Creative Commons Attribution (CC BY) license (https://creativecommons.org/licenses/by/4.0/).
Share and Cite
MDPI and ACS Style
Chen, M.; Mei, J.; Shen, K.; Gao, Y. Response of Sandy Soil–Water Migration to Different Conditions under Unidirectional Freezing. Sustainability 2024, 16, 3597. https://0-doi-org.brum.beds.ac.uk/10.3390/su16093597
AMA Style
Chen M, Mei J, Shen K, Gao Y. Response of Sandy Soil–Water Migration to Different Conditions under Unidirectional Freezing. Sustainability. 2024; 16(9):3597. https://0-doi-org.brum.beds.ac.uk/10.3390/su16093597
Chicago/Turabian StyleChen, Mo, Jiaheng Mei, Kai Shen, and Yu Gao. 2024. "Response of Sandy Soil–Water Migration to Different Conditions under Unidirectional Freezing" Sustainability 16, no. 9: 3597. https://0-doi-org.brum.beds.ac.uk/10.3390/su16093597
Note that from the first issue of 2016, this journal uses article numbers instead of page numbers. See further details here.