Article

Pre-Stack Fracture Prediction in an Unconventional Carbonate Reservoir: A Case Study of the M Oilfield in Tarim Basin, NW China

1
School of Geosciences, China University of Petroleum (East China), Qingdao 266580, China
2
SINOPEC Geophysical Research Institute Co., Ltd., Nanjing 211103, China
3
PetroChina Tarim Oilfield Company, Korla 841000, China
*
Author to whom correspondence should be addressed.
Submission received: 15 March 2024 / Revised: 19 April 2024 / Accepted: 19 April 2024 / Published: 26 April 2024

Abstract

:
The reservoir of the M oilfield in Tarim Basin is an unconventional fracture-cave carbonate rock, encompassing various reservoir types like fractured, fracture-cave, and cave, exhibiting significant spatial heterogeneity. Despite the limited pore space in fractures, they can serve as seepage pathways, complicating the connectivity between reservoirs. High-precision fracture prediction is critical for the effective development of these reservoirs. The conventional post-stack seismic attribute-based approach, however, is limited in its ability to detect small-scale fractures. To address this limitation, a novel pre-stack fracture prediction method based on azimuthal Young’s modulus ellipse fitting is introduced. Offset Vector Tile (OVT) gather is utilized, providing comprehensive information on azimuth and offset. Through analyzing azimuthal anisotropies, such as travel time, amplitude, and elastic parameters, smaller-scale fractures can be detected. First, the original OVT gather data are preprocessed to enhance the signal-to-noise ratio. Subsequently, these data are partially stacked based on different azimuths and offsets. On this basis, pre-stack inversion is carried out for each azimuth to obtain the Young’s modulus in each direction, and, finally, the ellipse fitting algorithm is used to obtain the orientation of the long axis of the ellipse and the ellipticity, indicating the fracture orientation and density, respectively. The fracture prediction results are consistent with the geological structural features and fault development patterns of the block, demonstrating good agreement with the imaging logging interpretations. Furthermore, the results align with the production dynamics observed in the production wells within the block. This alignment confirms the high accuracy of the method and underscores its significance in providing a robust foundation for reservoir connectivity studies and well deployment decisions in this region.

1. Introduction

Fractures are widely distributed underground, and they can serve as both oil and gas storage spaces and percolation channels for oil and gas migration, playing an important role in the formation and distribution of oil and gas reservoirs. Especially in recent years, with the continuous discoveries of unconventional reservoirs, such as shale, tight sandstone, and complex carbonate rocks, fracture prediction has become a hot topic for geophysical researchers.
The M oilfield is located in the Tabei uplift of the Tarim Basin and is a fractured-vuggy carbonate oil reservoir with an anticline structural background. Overall, the oil–water interface is relatively uniform, but it also exhibits strong “one cave, one reservoir” heterogeneity. Studies have suggested that, due to the influence of tectonic and fault evolution and karstification, fractured, fractured-vuggy, and cave reservoirs have generally developed in the M oilfield. Although the fractures are usually small in scale and have limited pore space, they have a significant impact on the connectivity between oil reservoir units. Therefore, high-precision fracture prediction is crucial for the later development and adjustment of the oil reservoir. At present, there are numerous seismic fracture prediction methods in the geophysical field. Based on the type of reflected wave, they can be divided into shear wave fracture prediction methods and compressional wave fracture prediction methods. Of these, the shear wave or converted shear wave methods, which exploit the shear wave splitting phenomenon induced by fractures, are theoretically the most direct and efficient approach for fracture prediction [1,2,3,4,5]. However, despite its theoretical superiority, the application of this type of method has not become widespread due to the stringent requirements it imposes on field data acquisition and seismic processing, particularly in multi-wave or multi-component exploration settings. This has limited its utilization as a mainstream fracture prediction method. Utilizing compressional waves for fracture prediction is currently a more commonly used approach among major oil and gas fields. Based on the source data and methodological principles employed, it can be categorized as post-stack and pre-stack fracture prediction. For post-stack fracture prediction, commonly used methods involve calculating geometric attributes such as coherence, curvature, and variance from post-stack seismic data. The fundamental principle is that, when faults and fractures develop underground, seismic events may appear discontinuous or curved. Detecting these geological features helps identify fractures. To highlight the seismic response characteristics of fractures and enhance the accuracy of post-stack attribute fracture prediction, numerous scholars have conducted extensive research on seismic data preprocessing. This includes techniques such as structure-oriented filtering [6,7,8,9,10,11,12], seismic spectral decomposition processing [13,14,15,16], and curvelet transform multi-scale decomposition [17]. Concurrently, research on attributes such as maximum likelihood, ant tracking, and AFE has further diversified the methods for post-stack attribute fracture prediction [18,19,20,21,22,23,24,25,26,27]. However, different attributes have their own advantages and disadvantages in characterizing various types and scales of fractures. A single attribute is often insufficient for comprehensively representing the development patterns of fractures. Therefore, methods utilizing the fusion of multiple attributes have been proposed to improve the accuracy of post-stack attribute fracture prediction [28,29]. Nevertheless, due to the limitations of seismic resolution, post-stack attribute fracture prediction is primarily suitable for identifying large-scale fractures associated with structures or faults, and the prediction results cannot be quantified. In recent years, with the promotion and application of wide-azimuth seismic acquisition techniques and the advancements in OVT processing techniques, pre-stack fracture prediction based on OVT-domain seismic data has become a research hotspot [30,31]. The primary advantage of this methodology is its ability to detect fractures of smaller scale and quantitatively delineate their orientation and density, thereby providing significant technical assistance in oil and gas exploration and development. In terms of the theoretical study for fracture prediction, the azimuthal anisotropy characteristics of physical quantities such as travel time, velocity, amplitude, frequency, and phase exhibited by compressional waves (P-waves) propagating through fractured media play a pivotal role [32,33,34]. Grechka et al. [35] derived the travel time expression for compressional waves propagating in HTI media, revealing that travel time exhibits periodic variations with azimuth in HTI media. Rüger et al. [36,37,38] conducted a study based on the theory of weak anisotropy and derived formulas for the azimuthal variation of compressional wave reflection coefficients in anisotropic media, laying a theoretical foundation for predicting fractures using dynamic parameters such as amplitude. Mallick et al. [39] observed a cosine-like variation in seismic amplitudes with respect to azimuth in fractured strata, enabling the accurate indication of fracture orientation. These theoretical studies have provided crucial guidance for subsequent fracture prediction practices. In practical field applications, numerous scholars have successfully utilized the azimuthal anisotropy characteristics of compressional waves to predict fractures. Qu et al. [40] introduced a quantitative approach for predicting fracture orientation and density through analyzing the variation in P-wave impedance with azimuth, and they successfully applied it in practical field blocks. Li et al. [41] proposed an anisotropic gradient inversion method based on zero constraints, utilizing the maximum likelihood solution of anisotropic gradients to predict fracture development. The prediction results match well with the drilling data. Zhang et al. [42] simplified and linearized the Rüger approximation, obtaining anisotropic strength parameters through maximum likelihood inversion. Model tests demonstrated that the algorithm exhibited good noise resistance. Wang et al. [43] conducted a comprehensive prediction of fractures in practical field blocks by utilizing travel time anisotropy and AVO gradient attributes. Zhou et al. [44] conducted an analysis of amplitude azimuthal anisotropy and frequency azimuthal anisotropy based on OVT-domain gather data and predicted the intensity and orientation of small-scale fractures. Chen et al. [45] introduced a statistics-based anisotropic strength prediction technique, achieving good results in predicting fractured reservoirs in the subsurface of the Bongor Basin in Chad. These application cases fully demonstrate the practical value of the azimuthal anisotropy of P-waves in fracture prediction. Moreover, in addition to directly utilizing the azimuthal anisotropy characteristics of P-waves, the Young’s modulus—an essential physical parameter for evaluating rock brittleness and fracturing capability—also plays a significant role in fracture prediction [46,47,48]. Sayers [49] conducted studies and revealed the anisotropy of the Young’s modulus in fractured media. Specifically, the Young’s modulus along the axis of symmetry was consistently smaller than that along the strike direction of the fractures. Zong et al. [50] and Wang et al. [51] used pre-stack inversion to obtain the Young’s modulus and ellipse fitting to predict fractures, and they achieved good results. These studies provide novel ideas and methodologies for utilizing Young’s modulus in fracture prediction.
High-angle single-group fractures are extensively developed within the target layer of the M oilfield in the study area, serving as significant permeability channels and storage spaces for hydrocarbons within the block. For this study, we first optimized the pre-tack OVT gather data to suppress random noise, eliminate travel time disparities, and formulate an appropriate stacking scheme based on azimuth angle and offset. Subsequently, we applied pre-stack inversion techniques to the processed pre-stack OVT data to obtain the Young’s modulus for each azimuth. Then, ellipse fitting was carried out, and the ellipticity and direction of the major axis obtained from the fitting indicated the density and orientation of the fractures, thus realizing the pre-stack fracture prediction of the M oilfield in Tarim Basin, facilitating the subsequent enhanced oil recovery study of unconventional carbonate reservoirs [52,53].

2. Geological Setting

The primary exploration and development stratum in the study area is the Yijianfang Formation of the Ordovician, exhibiting a nearly northeast–southwest trending anticline structure. This is a typical fractured-vuggy carbonate reservoir (Figure 1). The study area has experienced multi-stage tectonic movements, leading to the development of diverse fault types and an intricate faulting pattern. Within the Ordovician strata, three primary groups of faults are particularly prominent. The first group comprises strike-slip faults and their associated branch faults, which were formed during the middle Caledonian. These faults trend northwest and are arranged in a nearly parallel fashion within the study area. The second group of faults was mainly developed in the Hercynian period, which was affected by the lateral intrusion of the Mana igneous rock on the northwest side of the study area into the Middle Cambrian plastic strata and was formed by the arching of the supra-salt strata. This group of normal faults presents a northwest–southeast radial distribution pattern on the plane. Under the influence of tensile stress, this group of normal faults developed numerous fractures, thereby improving the quality of the reservoir and further enhancing the connectivity of the fractured-vuggy reservoir. The third group consists of thrust faults that formed during the late Hercynian to early Indosinian, which control the formation of the NE-trending asymmetric long-axis anticline of the M oilfield.
The sedimentary sequence of the Ordovician strata in the M oilfield is relatively complete, with the development of the Santamu Formation, Lianglitage Formation, Tumuxiuke Formation, Yijianfang Formation, and Yingshan Formation in sequential order. Among them, the Yijianfang Formation and the upper part of the Yingshan Formation are the main reservoir development intervals. The lithology of the Yijianfang Formation is mainly composed of sparry oolitic limestone and sparry bioclastic limestone. The lithology of the upper part of the Yingshan Formation is dominated by micritic limestone and psammitic limestone (Figure 1c). The formation of high-quality reservoirs in the Yijianfang–Yingshan Formation is primarily controlled by the combined effects of high-energy facies belts, faulting, and karstification [54,55,56]. The reservoir spaces are dominated by fractures and small-scale dissolved pores and fractures, with a small number of cave-type reservoirs. The rock matrix has poor physical properties, with porosity mostly less than 1%, mainly concentrated around 0.4% to 0.7%, and an average porosity of 0.5%. The permeability is generally less than 0.1 mD. Drilling core and thin section observations reveal the presence of high-angle fractures and dissolved pores developed along these fractures (Figure 2). Based on the interpretation results of micro-resistivity imaging logging in the study area, fractures in this region are primarily composed of single-set high-angle oblique and vertical fractures. The fracture widths generally range from 0.01 to 0.1 mm. Nearly 52% of the fractures are filled, primarily with calcite. However, the overall fracture aperture is relatively good, with an average aperture of 77 μm [57]. From the regression relationship between fracture aperture, permeability, and single-well production, it is evident that single-well production positively correlates with both factors (Figure 3). Therefore, high-precision fracture prediction is very important for efficient well deployment and later reservoir development technology policy formulation.

3. Data and Methods

3.1. Data Set

In the study area, high-density 3D seismic data were acquired with a wide azimuth, a bin size of 15 m × 15 m, full coverage of 320 times, and a shot-trace density of 1.4222 million traces per square kilometer. The data exhibited a favorable aspect ratio of 0.8, indicating good spatial coverage. Furthermore, the data quality was excellent, having undergone targeted amplitude-preserving and fidelity-enhancing processing in the OVT domain. This ensured the data’s suitability for subsequent pre-stack fracture prediction. After preprocessing, the OVT gather data were fully stacked and partially stacked based on azimuth and incident angles, generating multiple sets of 3D seismic data volumes.
The fully stacked seismic data volume Is employed for conducting detailed horizon interpretation, from which post-stack attributes are extracted to facilitate the analysis of fault systems and reservoir development characteristics. On the other hand, the partially stacked data volumes are utilized for azimuthal pre-stack reservoir inversion, serving as a basis for estimating the Young’s modulus and fracture prediction. To comprehensively assess the accuracy of the fracture prediction results, imaging logging interpretation data from four wells, along with drilling, logging, and production data from one well, were collected. Subsequently, these data sets were rigorously compared and analyzed with the prediction results, ensuring robust validation of the methodologies and enhancing the reliability of the predictions.

3.2. Methods

3.2.1. Azimuthal Young’s Modulus Calculation

Geophysicists generally agree that the anisotropy of media in the Earth’s crust is primarily caused by oriented fractures and thin interbeds. Specifically, the formation of HTI media (horizontally transverse isotropic media) is often associated with vertically aligned and parallel fractures. Based on the results of core observation and imaging logging statistics from the M oilfield, it is evident that the block primarily exhibits the development of high-angle fractures, so it can be approximately regarded as HTI media. The formula for calculating the equivalent Young’s modulus of HTI media is as follows [50]:
E = ρ v s 2 ( 3 v p 2 4 v s 2 ) / ( v p 2 v s 2 )
where ρ represents density, v s represents shear wave velocity, and v p represents compressional wave velocity.
To calculate the Young’s modulus at any given azimuth, pre-stack inversion techniques are applied to obtain density and compressional and shear wave velocities. These values are then substituted into Formula (1) so as to obtain the Young’s modulus of the corresponding azimuth.

3.2.2. Principle of Fracture Prediction Based on Elliptical Fitting of Young’s Modulus

Sayers’ experimental research revealed the directional characteristics of the Young’s modulus in fractured media: along the direction of the fracture, the Young’s modulus reaches its maximum, whereas it reaches its minimum along the symmetrical axis of the fracture [49]. In terms of theoretical research, Zong et al. [50] constructed a series of layered models with varying fracture densities based on Thomsen’s fracture theory. Through model analysis, it was found that the Young’s modulus exhibits periodic fluctuations similar to a cosine curve as the azimuth angle changes. This variation pattern is consistent with Sayers’ experimental results. Furthermore, when the Young’s modulus is projected onto a polar coordinate system based on the azimuth angle, it exhibits an elliptical shape. The long axis of the ellipse aligns with the orientation of the fracture, and as the fracture density increases, the ellipse becomes flatter. Based on this pattern, the equivalent Young’s modulus at different azimuths can be calculated by using Formula (1), and subsequently, the ellipticity and the direction of the ellipse’s long axis can be obtained through ellipse fitting algorithms such as least squares. This approach enables not only quantitative prediction of the orientation of fractures but also qualitative assessment of their density.

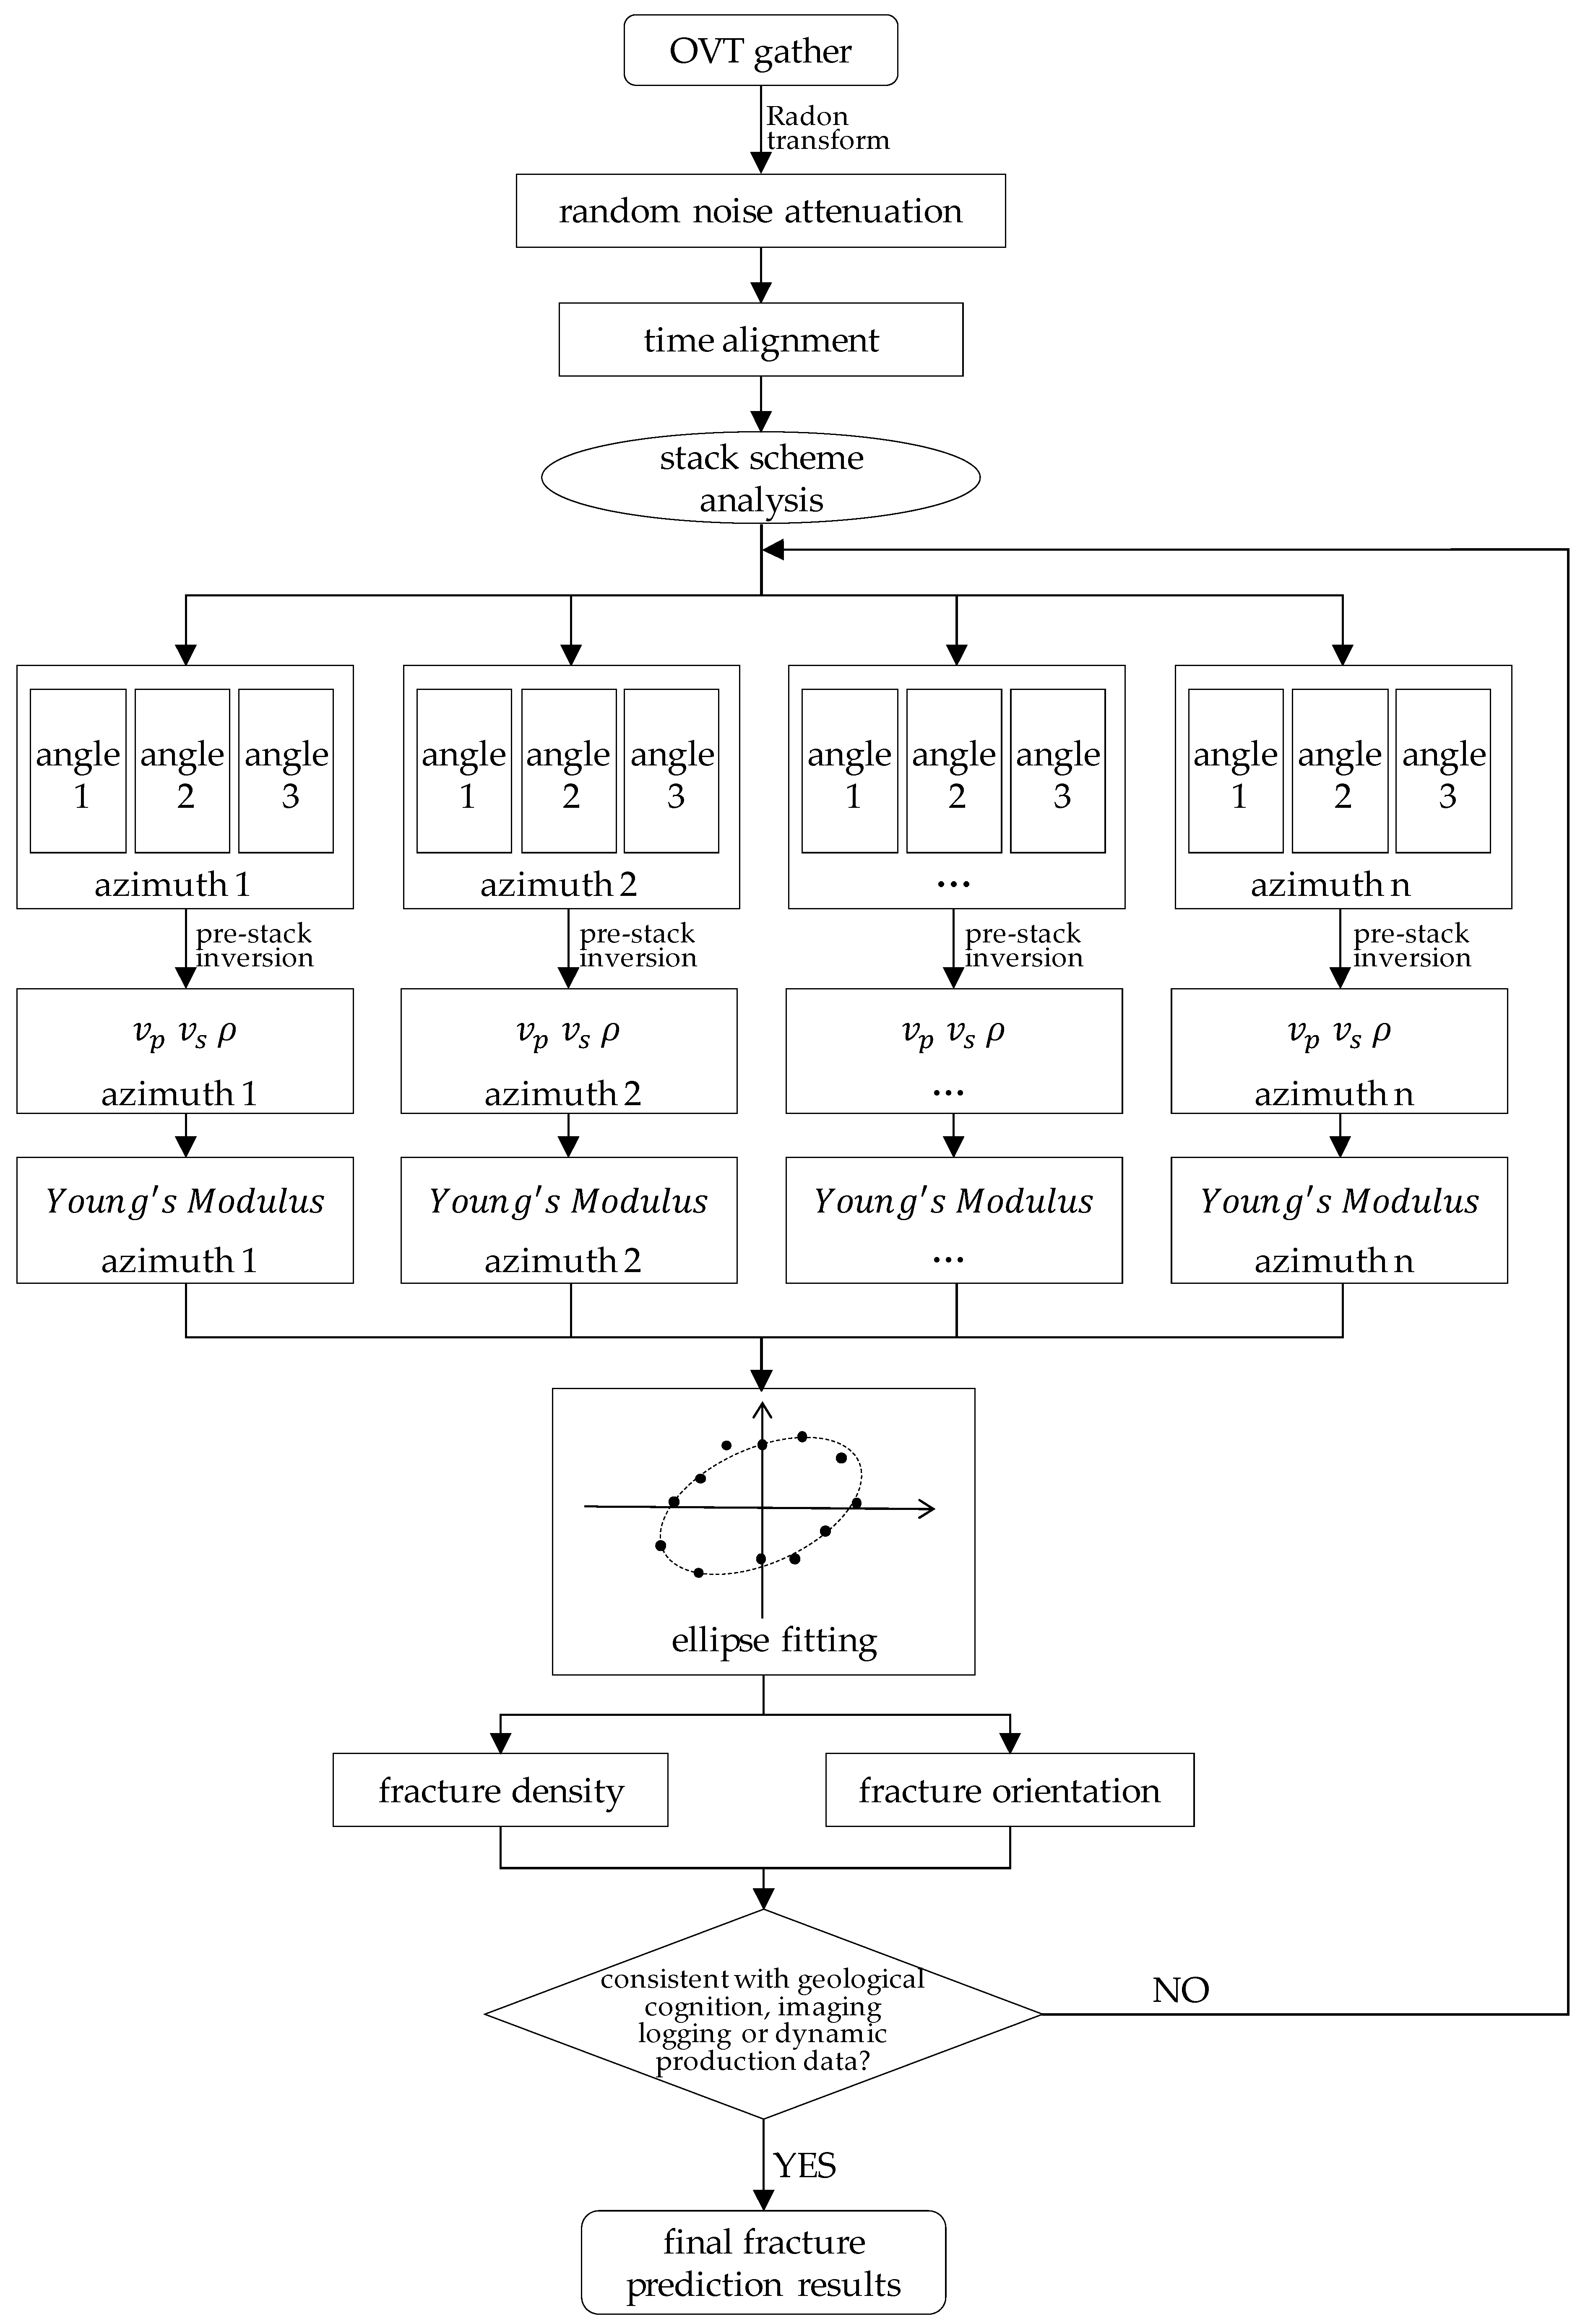
3.2.3. Fracture Prediction Workflow

The research is completed in five steps (Figure 4).
Step 1: Initially, the original OVT gather data are optimized, which mainly includes two pivotal steps: random noise attenuation and anisotropic time alignment. This optimization aims to enhance the signal-to-noise ratio of the data, mitigate the travel time disparities arising from anisotropy, maintain azimuthal amplitude variations, and ensure the robustness of pre-stack elastic parameter inversion and Young’s modulus ellipse fitting. Consequently, this process facilitates the generation of reliable fracture prediction outcomes.
Step 2: The OVT gather data are analyzed to formulate a reasonable stacking scheme, followed by partial stacking based on azimuth and incident angle (offset).
Step 3: Utilizing pre-stack inversion techniques, the data obtained from each azimuth in Step 2 are processed to derive Young’s modulus data volumes for each azimuth.
Step 4: A least-squares ellipse fitting algorithm is utilized to individually fit each trace and sample within the Young’s modulus data volumes derived from Step 3. The orientation of fractures is represented by the long axis of the fitted ellipse, while the ellipticity provides an indication of the fracture density.
Step 5: The fracture prediction results obtained from Step 4 are compared and validated against geological cognition, imaging logging data, and dynamic production data of the block. If the fracture prediction results do not align, return to Step 3 for modifications. Otherwise, output the final fracture prediction results.

4. Results and Discussion

4.1. OVT Gather Optimization and Processing, and Stacking Scheme Analysis

One of the key steps in pre-stack fracture prediction is to perform azimuthal stacking of the OVT gather data, followed by stacking based on incident angles for each azimuth. Although the OVT gathers have been denoised during the seismic processing, compared with the full stack data, partial stack data are more sensitive to noise. Therefore, it is necessary to optimize the original OVT gather data to improve the signal-to-noise ratio. Figure 5 shows the typical OVT gather data in the study area. Figure 5b shows the original gather record. It can be seen from the extracted observation system that the OVT gather contains both azimuth and offset information. These data are systematically organized in a spiral pattern, as shown in Figure 5a. From Figure 5b, it can be seen that there are obvious random noise and residual time differences in the original data, which need to be further optimized. Firstly, the Radon transform is applied to attenuate the random noise, as depicted in Figure 5c. Analysis of the residual profile in Figure 5d indicates that the denoising process preserves most of the effective signals while effectively eliminating random noise components. Subsequently, time alignment is conducted on the denoised gather data to mitigate travel time variations arising from velocity anisotropy while maintaining amplitude differences associated with azimuth, as illustrated in Figure 5e.
As the fundamental elliptic equation encompasses five variables, it is imperative to input at least five azimuthal Young’s modulus data points for elliptic fitting. Given the central symmetry of the OVT gather, it is partitioned into six azimuthal sectors, as depicted in Figure 6a: 0° to 30°, 30° to 60°, 60° to 90°, 90° to 120°, 120° to 150°, and 150° to 180°. The selection of the maximum offset must strike a balance between ensuring relatively uniform coverage across all azimuths and maximizing the incident angle near the target layer, crucial for preserving the accuracy of pre-stack inversion. In this study, we conducted azimuth-specific stacking tests with maximum offsets of 4500 m, 5000 m, and 6500 m. The results of these tests are presented in Figure 6b–d.
Upon analysis, it is evident that when the maximum offset is set to 6500 m (Figure 6b), there is a significant inhomogeneity in coverage across various azimuths. Although certain azimuths, such as 45°, achieve a maximum incident angle of 40°, azimuths like 75° and 105° only reach a maximum incident angle of approximately 25°, indicating a lack of far-offset data. This inhomogeneity in coverage can introduce spurious anisotropies. On the other hand, when the maximum offset is reduced to 4500 m (Figure 6d), while the coverage across azimuths becomes more uniform, the maximum incident angle is limited to approximately 25°, significantly compromising the accuracy of pre-stack inversion. This, in turn, has a substantial impact on the estimation of the Young’s modulus and subsequent elliptic fitting. Finally, when the maximum offset is set to 5000 m (Figure 6c), the maximum incident angle near the target layer is approximately 30°, and the coverage across various azimuths is relatively uniform. This configuration satisfies the requirements for subsequent pre-stack inversion and elliptic fitting of the Young’s modulus. Therefore, 5000 m was ultimately chosen as the optimal maximum offset.

4.2. Fracture Prediction and Analysis

Based on the determined stacking scheme, the processed OVT gathers were stacked, generating partially stacked seismic data volumes for small, medium, and large incident angles across six azimuths. Using pre-stack inversion techniques, the equivalent Young’s moduli for each of the six azimuths were obtained. Subsequently, the least-squares ellipse fitting algorithm was applied to fit the azimuthal Young’s moduli on a trace-by-trace and sample-by-sample basis, yielding the direction of the ellipse’s major axis and ellipticity for each sample point. The direction of the ellipse’s major axis indicates the orientation of fractures, while the ellipticity reflects the difference in Young’s moduli along and perpendicular to the fracture orientation. Although the absolute value of ellipticity does not directly correspond to the linear or volumetric density of fractures, it does represent the strength of anisotropy induced by fractures [50]. Therefore, ellipticity can indirectly reflect the density of fractures, with higher ellipticity values indicating a higher density of fractures.
The formation and distribution of fractures are usually closely related to structures and faults. Curvature attributes, as an effective post-stack analytical tool, are often used to characterize the morphological features of small-scale faults and large-scale fractures associated with structures and faults. To verify the rationality and accuracy of the fracture prediction method proposed in this study, the curvature attribute of the target layer’s top surface was extracted and compared with the ellipticity attribute. Figure 7a shows a structural map of the top surface of the Yijianfang Formation in the study area (partially enlarged from the black dashed box in Figure 1b). The study area is located at the high part of an anticline structure, where three main fault systems are developed. Figure 7b–d present the curvature attribute map, the ellipticity attribute map, and a superimposed plan view of both attributes for the top surface of the Yijianfang Formation, respectively. It can be observed that the curvature attribute effectively characterizes the faults and the associated fracture development zones in the study area. From the superimposed image of ellipticity and curvature attributes, it can be seen that the predicted results of fracture density have a good correlation with the faults, generally showing a trend that the more developed the faults are, the higher the fracture density is. Different types of faults exert varying degrees of control over fracture development. Specifically, the fracture development zones influenced by thrust faults are relatively narrow and tend to concentrate near the fault planes. This phenomenon may be related to the local compressive stress environment. In contrast, strike-slip faults produce broader fracture zones, which extend a significant distance from the main fault plane, aligning with field observations of strike-slip fault geological structures. On the plane, the fractures surrounding the radially distributed tensile normal faults exhibit the most significant development, forming complex networks of fractures. By incorporating the tectonic evolution background of the block, it is speculated that this system of normal faults and fractures is closely related to the deformation and arching mechanisms of the brittle limestone strata overlying the salt layer. Overall, the prediction results of fracture density are consistent with the tectonic geological background of this area, which proves that the method adopted in this study is applicable and effective under the geological conditions of this area.
Imaging logging technology is capable of clearly projecting the structural features of rock on the wellbore surface, exhibiting directionality and high resolution. It has been widely applied in the interpretation and evaluation of reservoirs such as fractures and dissolved pores in carbonate formations [58]. To further assess the reliability of the fracture prediction results in this study, we collected and compared the predicted results with fracture interpretation conclusions from imaging logging of four wells in the study area, as shown in Figure 8 and Table 1.
Well M3 is located near the thrust fault F1. The main orientation of fractures within the target layer is predicted to range from N40 °E to N60 °E using this method, and this prediction aligns well with the observed fracture orientation. Wells M4 and M5 are located near the strike-slip fault F2. The main fracture orientation in the target layer of well M4, interpreted from well logging, is N20 °E to N30 °E, which aligns with our prediction. For well M5, the well logging interpretation of its target layer reveals two primary fracture sets with orientations ranging from N10 °E to N20 °E and from N30 °E to N40 °E. However, our prediction for well M5 indicates a fracture orientation of N20 °E to N30 °E. Given the limited resolution of seismic data compared to imaging logging, it is possible that the prediction represents a combined response from both fracture sets. Therefore, the prediction result is considered to be relatively consistent. Well M6 is situated near the normal fault F3. The primary fracture orientation in its target layer, interpreted from well logging, ranges from N10 °E to N30 °E. Our method predicts a similar orientation of N10 °E to 30 °E, indicating a consistent result. Consequently, there is a high degree of agreement between the predicted fracture orientations at the wellbore location using our method and the interpretations from imaging logging. A comprehensive analysis of multiple wells reveals that the primary fractures in the target layer generally trend towards the northeast, which aligns with the northeast-oriented principal stress during the middle-to-late Ordovician in the Tabei uplift [59]. Additionally, this corroborates the effectiveness of our method.
The actual drilling data from the study area indicate that the strong reflections presenting as “beaded” patterns on seismic profiles represent high-quality fractured-vuggy reservoirs, while non-beaded reflections are typically associated with dense surrounding rocks, which function as lateral barriers or capping layers, enclosing the fractured-vuggy reservoirs. The magnitude of Young’s modulus serves as an indicator of the stiffness of the medium; the higher its value, the less susceptible it is to deformability, resulting in a denser and more stable rock formation. Statistics from drilled wells within the study area indicate that the Young’s modulus of high-quality fractured-vuggy reservoirs typically ranges from 6.7 to 7.2 × 10¹⁰ N/m2, whereas the Young’s modulus of compact surrounding rocks falls within the range of 7.2 to 9.0 × 10¹⁰ N/m2. Figure 9a presents the seismic profile of well M7 located within the study area, while Figure 9b–g depict the corresponding Young’s modulus profiles along six different azimuths. The specific locations of these profiles are shown in Figure 10a. As can be observed from Figure 9a, three “beaded” reflections are observed around the wellbore, which manifest as three fractured-vuggy systems on the six corresponding Young’s modulus profiles (indicated by the black dashed boxes). Although there are differences in local details and numerical values across the six azimuths of the Young’s modulus profiles, the overall morphologies are generally similar. The reservoirs are located in regions with low Young’s modulus values. The drilling target of well M7 was bead II. While drilling at depths ranging from 5914.93 to 5915.58 m and from 5917.14 to 5927.1 m, the well experienced void drilling of 0.65 m and 9.96 m, respectively, resulting in a cumulative loss of 142 cubic meters of drilling fluid. This indicated that high-quality fractured-vuggy reservoirs were uncovered, which aligned with the inversion results of the Young’s modulus.
Figure 9h displays a superimposed waveform profile of the Young’s modulus for the six azimuths. It is evident that the variations in Young’s modulus among different azimuths are relatively minor near bead I and bead III, whereas a significant difference is observed near bead II. Figure 10c–e provide enlarged views of the Young’s modulus data for the six azimuths at the centers of the three beads. It is apparent that the Young’s modulus values for different azimuths are generally comparable and do not exhibit significant variations for bead I and bead III. However, notable changes are observed in the Young’s modulus curves for different azimuths near bead II. Figure 10f displays a box plot comparing the Young’s modulus values across six azimuths at the centers of three beads. For bead I, the Young’s modulus ranges from a minimum of 5.82 × 10¹⁰ N/m2 to a maximum of 6.19 × 10¹⁰ N/m2, with a median value of 6.0 × 10¹⁰ N/m2. At bead II, the Young’s modulus exhibits a wider variation, with a maximum of 6.73 × 10¹⁰ N/m2, a minimum of 5.32 × 10¹⁰ N/m2, and a median of 6.32 × 10¹⁰ N/m2. Finally, for bead III, the Young’s modulus varies from a minimum of 6.33 × 10¹⁰ N/m2 to a maximum of 6.56 × 10¹⁰ N/m2, with a median of 6.47 × 10¹⁰ N/m2. Notably, the dispersion of Young’s modulus data across different azimuths is more pronounced for bead II, indicating significant differences in the Young’s modulus among various azimuths. Based on the experimental conclusions of Sayers [49] and Zong et al. [50], a greater difference between the long and short axes of the azimuthal Young’s modulus ellipse indicates stronger anisotropy and a higher density of fractures. Therefore, it is speculated that the anisotropy intensity is relatively low for bead I and bead III, whereas it is significantly high for bead II, suggesting a greater density of fracture within bead II.
Figure 10a displays a plan view of the maximum trough attribute surrounding well M7. The warm colors represent the bead-like geobodies. Figure 10b presents a plan view of the extracted fracture density and fracture orientation attributes around well M7. It can be observed that the fractures surrounding bead II, where well M7 is located, are more developed than those around beads I and III, albeit with limited extension lengths, approximately 100 to 160 m from the center of the bead. Relatively less developed fractures are observed around beads I and III. Based on the fracture prediction results, it is evident that these three beads are not interconnected. Figure 11 depicts the production profile of well M7. Immediately after the commencement of production, the well exhibited a sharp decline in oil pressure and output, with a brief self-flowing period lasting only 11 days. Subsequently, a total of 29 rounds of water injection were executed to stimulate oil displacement, resulting in a cumulative water injection volume of 0.51 million tons and a cumulative oil production of 0.49 million tons, indicating excellent oil enhancement through water injection. The production characteristics of well M7 closely resemble those exhibited by a single-cavity, constant-volume well [60], thereby reinforcing the conclusion of limited connectivity between well M7 and its surrounding reservoirs. This observation aligns with the previously mentioned fracture prediction results. Based on a comprehensive analysis of static fracture prediction results and dynamic production characteristics, it is concluded that bead II, where well M7 is located, is not connected to beads I and III. Consequently, a sidetrack drilling operation was designed to target bead I. After sidetracking, the wellbore was tested with a 5 mm choke at the target layer, achieving an oil pressure of 5.7 MPa and a daily oil production equivalent of 133 cubic meters, confirming the disconnectedness of bead I and bead II. This demonstrates that the reservoir associated with bead I remains untapped and validates the high precision and reliability of the fracture prediction method employed in this study.
According to the fracture prediction results, a secondary sidetrack drilling operation can be considered in the future to tap into the reserves associated with bead III. Employing the volumetric method based on carving techniques, the geological reserves of bead III are estimated to be approximately 86,000 tons, with an expected cumulative oil production of 12,900 tons, indicating significant economic potential. The fracture prediction methodology introduced in this study can be further promoted and utilized to guide the deployment of infill wells and the exploitation of untapped potential in fractured-vuggy carbonate reservoirs, ultimately maximizing the exploitation of geological reserves.

5. Conclusions

In this study, we conducted research on a pre-stack fracture prediction method based on azimuthal Young’s modulus ellipse fitting for the M oilfield. Based on the obtained results, the following conclusions were drawn:
(1)
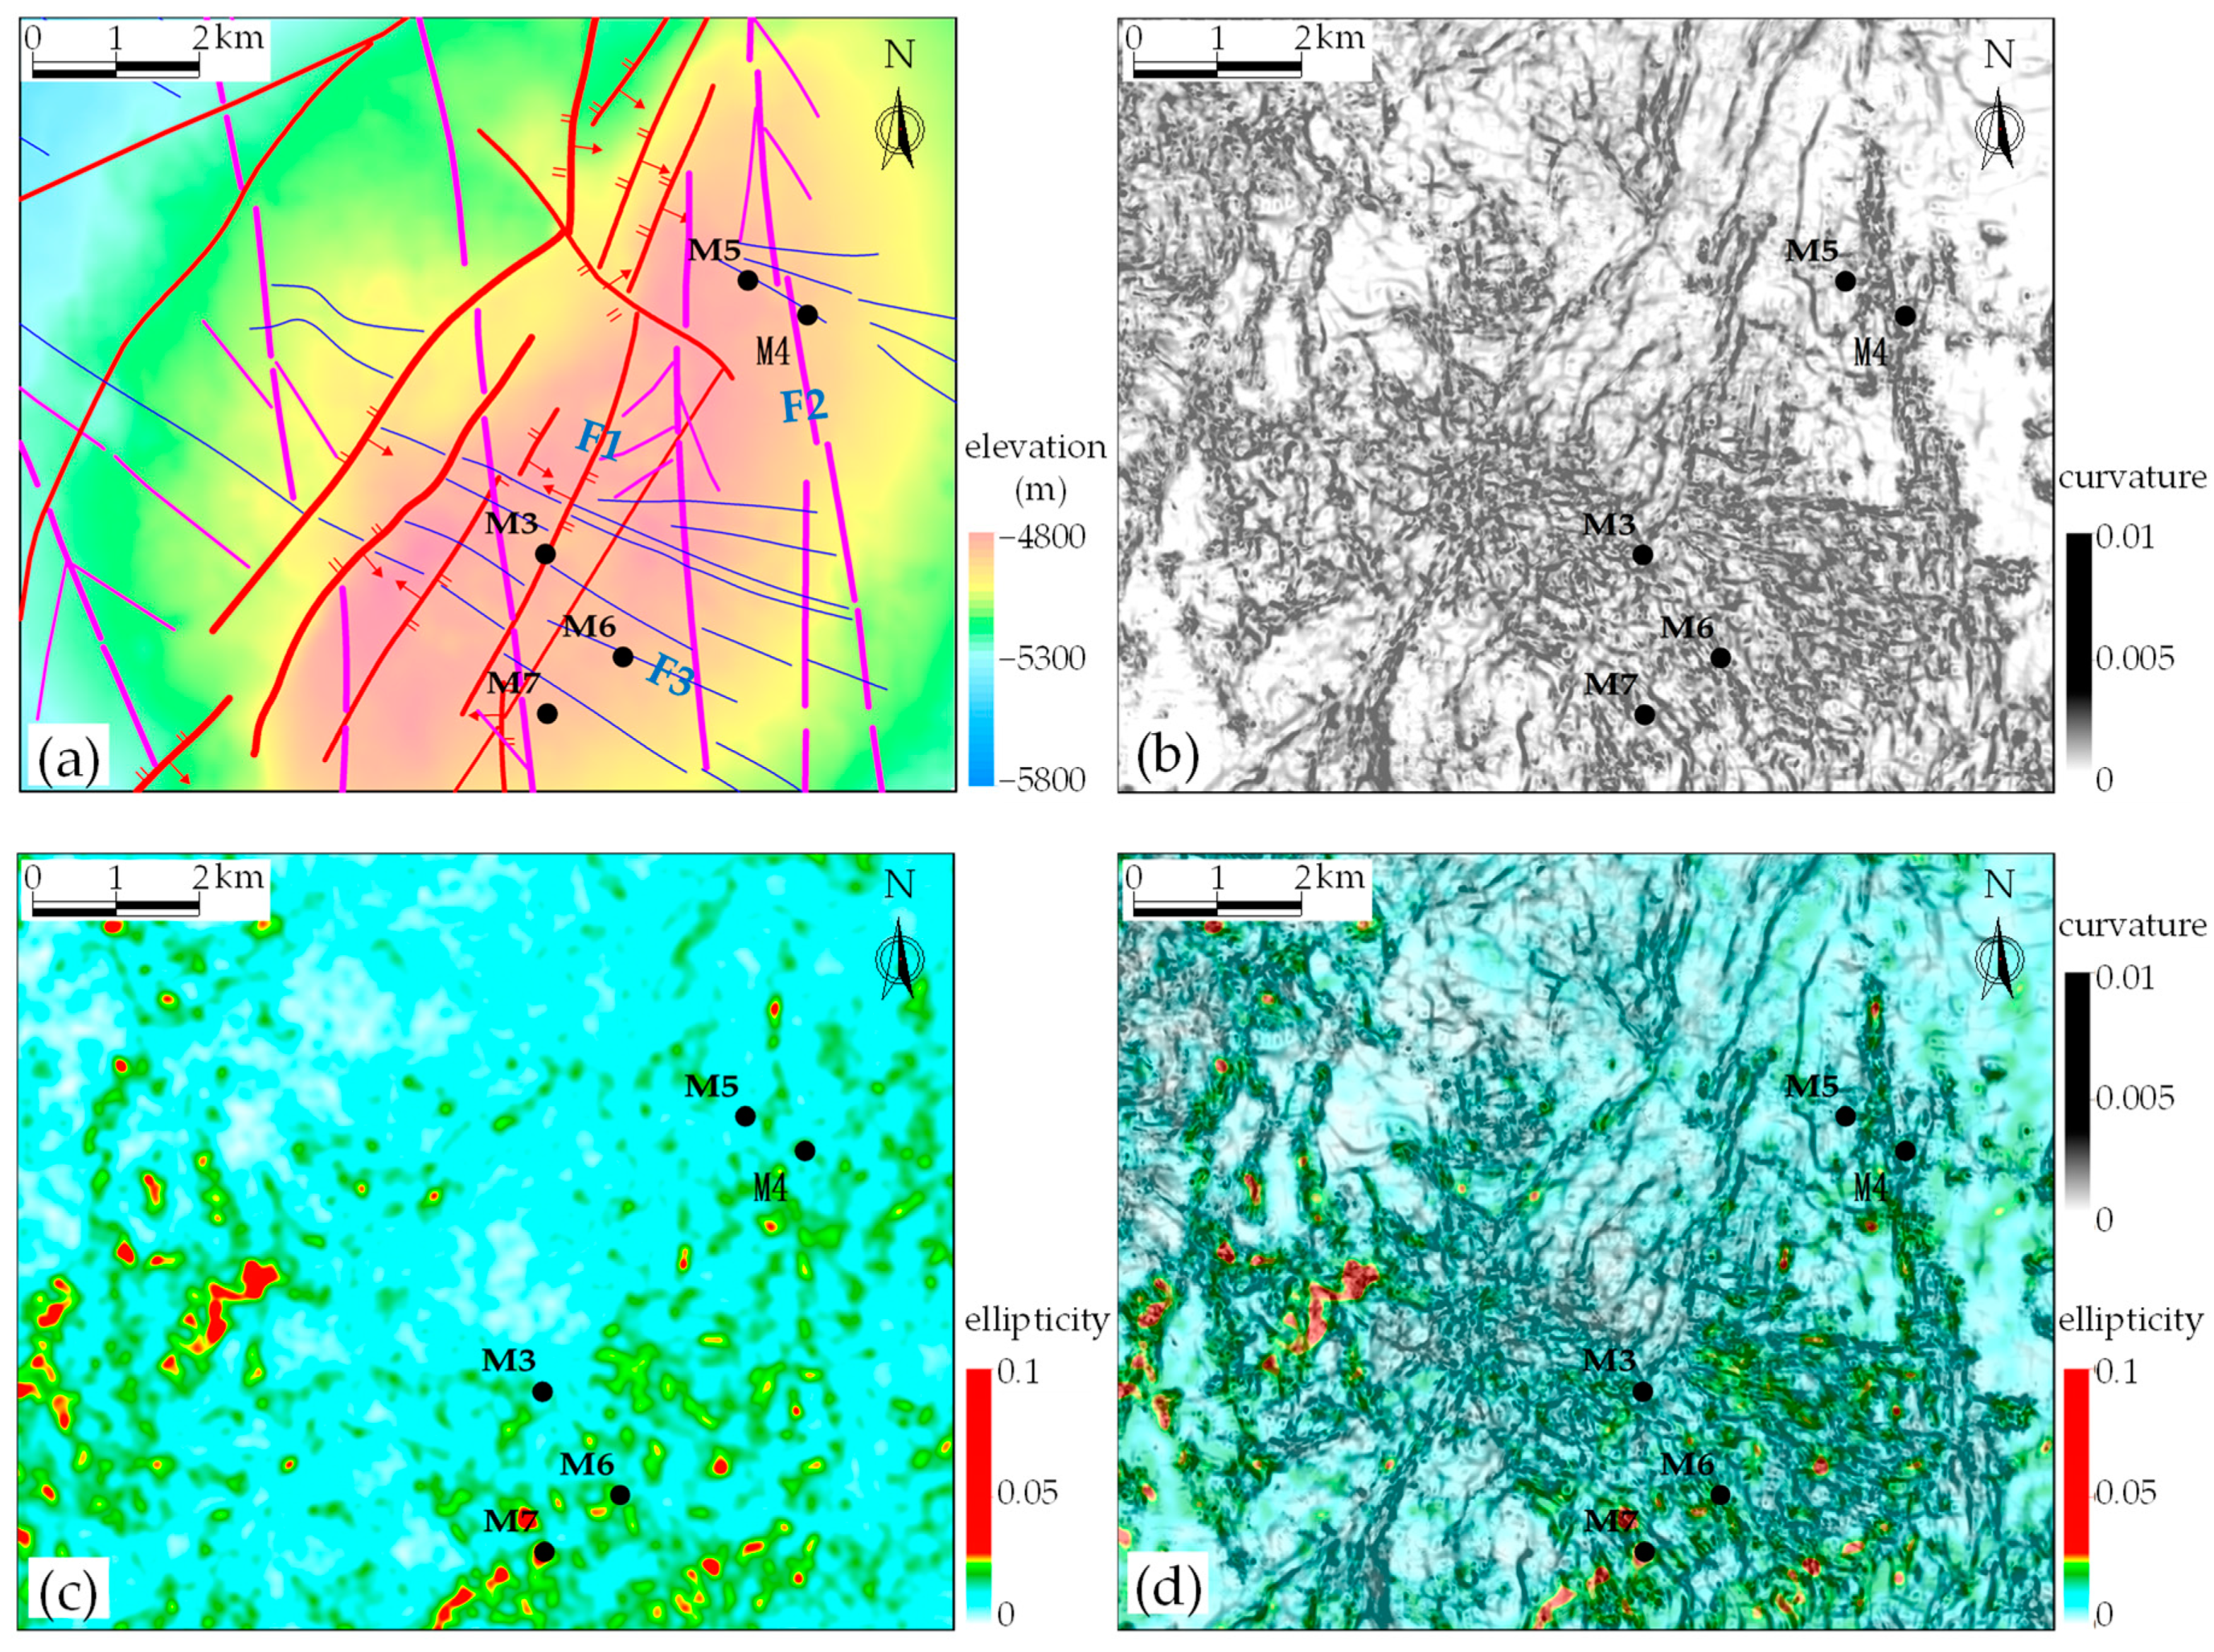
Compared with traditional post-stack attribute-based fracture prediction methods, such as curvature analysis, the fracture prediction method utilizing OVT (Offset Vector Tile) gather data can predict fractures of smaller scales and quantitatively characterize fracture development.
(2)
The pre-stack technology employed in this study primarily relies on azimuthal variations in Young’s modulus. Consequently, it has higher requirements for amplitude-preserving and fidelity-enhancing processing in the seismic processing stage, as well as optimized preprocessing of OVT gather data in the interpretation stage.
(3)
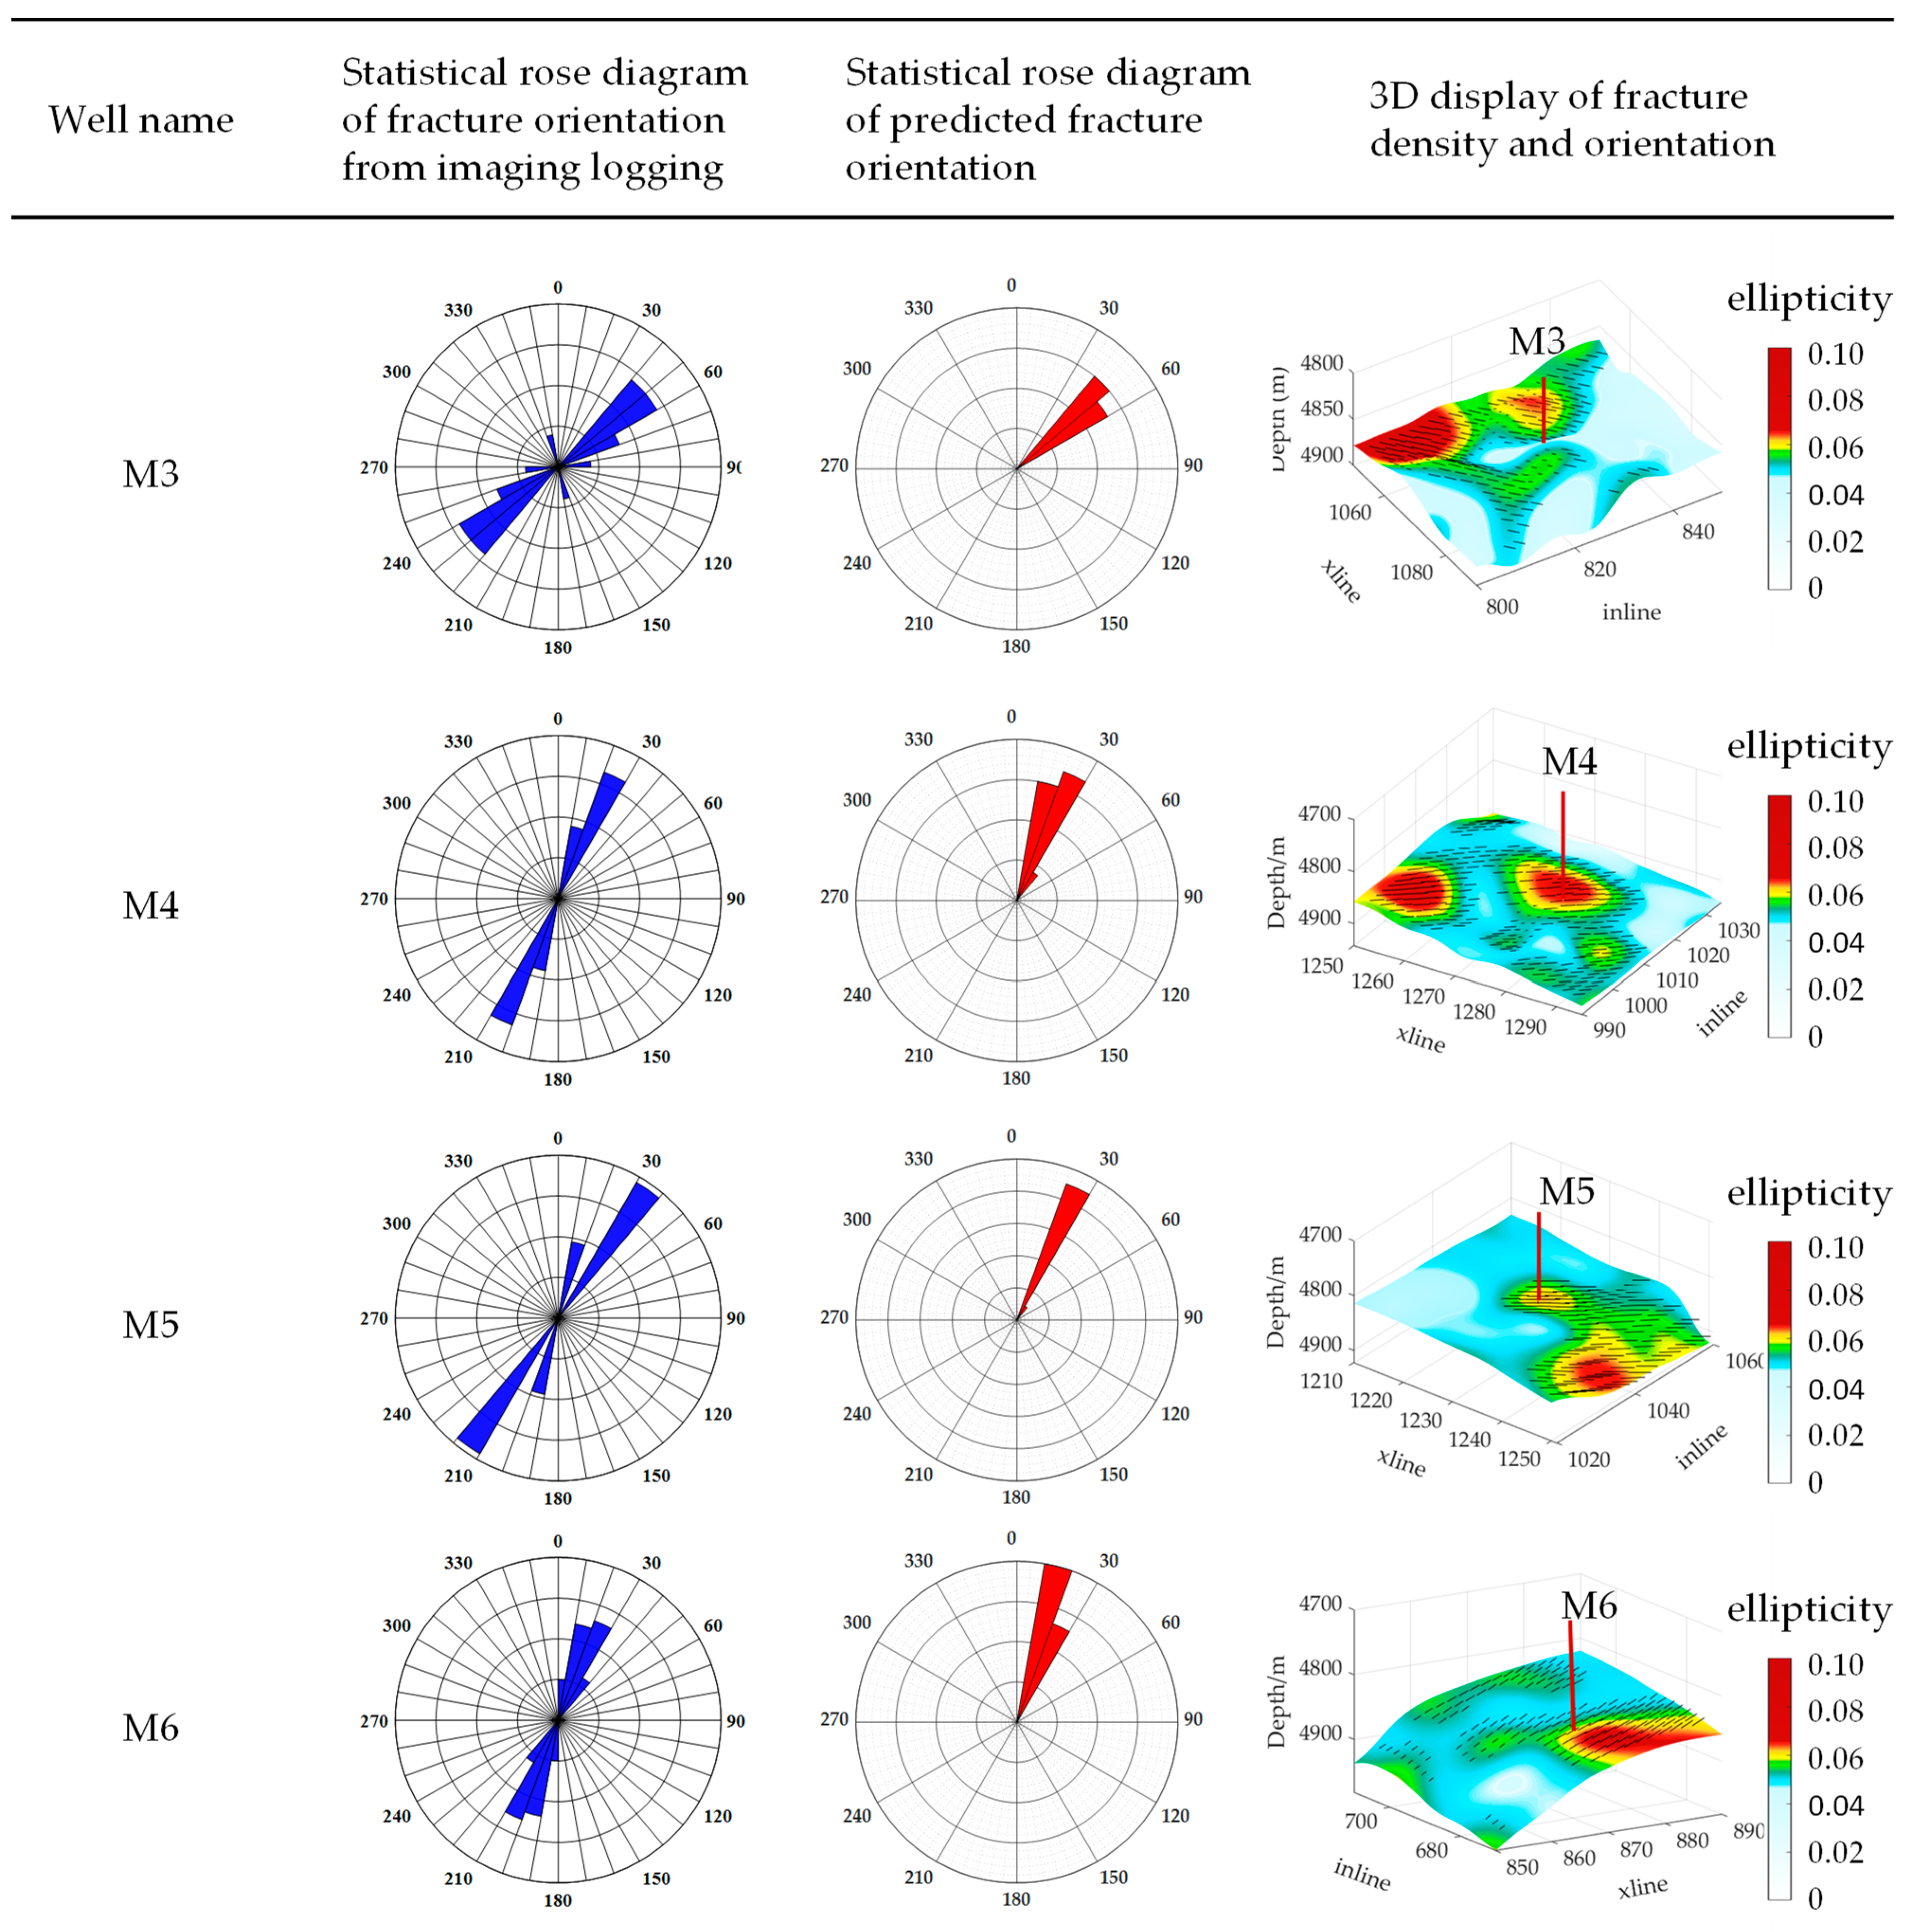
The method adopted in this study is primarily suitable for scenarios involving the development of a single set of high-angle fractures. In cases where two or more sets of high-angle fractures exist, such as in well M5, the prediction results may manifest as a combined response from multiple sets of fractures due to resolution limitations. For complex areas with the simultaneous development of low-angle and multiple sets of fractures, further research is needed on the azimuthal response characteristics of parameters such as the Young’s modulus.
(4)
A pre-stack fracture prediction technical workflow in the OVT domain for ultra-deep unconventional fractured-vuggy carbonate reservoirs is established in this paper. The fracture prediction results were subsequently tested against the geological cognition, imaging logging data, and dynamic production data of the block. This validation process confirms the applicability and reliability of the technique in unconventional fractured-vuggy carbonate reservoirs, providing valuable insights for future fracture prediction in similar geological settings.

Author Contributions

Conceptualization, G.Z.; methodology, B.L. and F.Y.; software, B.L.; investigation, B.L. and F.Y.; data curation and visualization, L.Z. and F.Y.; writing, B.L.; supervision, G.Z. All authors have read and agreed to the published version of the manuscript.

Funding

This research received no external funding.

Data Availability Statement

The original contributions presented in the study are included in the article, further inquiries can be directed to the corresponding author.

Acknowledgments

The authors thank the editor and reviewers for their comments regarding manuscript improvement. We also thank Kuanzhi Zhao, Suo Cheng and Yongjian Zeng for their help.

Conflicts of Interest

Author Fengying Yang was employed by the company SINOPEC Geophysical Research Institute Co., Ltd. Author Longfei Zhao was employed by the PetroChina Tarim Oilfield Company. The remaining authors declare that the research was conducted in the absence of any commercial or financial relationships that could be construed as a potential conflict of interest.

References

  1. Garotta, R.; Granger, P.Y. Acquisition and Processing of 3C × 3-D Data Using Converted Waves. In SEG Technical Program Expanded Abstracts 1988; SEG Technical Program Expanded Abstracts; Society of Exploration Geophysicists: Anaheim, CA, USA, 1988; pp. 995–997. [Google Scholar]
  2. Garotta, R. Detection of Azimuthal Anisotropy. In SEG Technical Program Expanded Abstracts 1989; SEG Technical Program Expanded Abstracts; Society of Exploration Geophysicists: Dallas, TX, USA, 1989; pp. 861–863. [Google Scholar]
  3. Gaiser, J.E. Enhanced PS-Wave Images and Attributes Using Prestack Azimuth Processing. In SEG Technical Program Expanded Abstracts 1999; SEG Technical Program Expanded Abstracts; Society of Exploration Geophysicists: Houston, TX, USA, 1999; pp. 699–702. [Google Scholar]
  4. Bale, R.A.; Li, J.; Mattocks, B. Robust Estimation of Fracture Directions from 3-D Converted-Waves. In SEG Technical Program Expanded Abstracts 2005; SEG Technical Program Expanded Abstracts; Society of Exploration Geophysicists: Houston, TX, USA, 2005; pp. 889–892. [Google Scholar]
  5. Mattocks, B.; Li, J.; Roche, S.L. Converted-Wave Azimuthal Anisotropy in a Carbonate Foreland Basin. In SEG Technical Program Expanded Abstracts 2005; SEG Technical Program Expanded Abstracts; Society of Exploration Geophysicists: Houston, TX, USA, 2005; pp. 897–900. [Google Scholar]
  6. Fehmers, G.C.; Höcker, C.F.W. Fast Structural Interpretation with Structure-oriented Filtering. Geophysics 2003, 68, 1286–1293. [Google Scholar] [CrossRef]
  7. Lu, Y.; Lu, W. Edge-Preserving Polynomial Fitting Method to Suppress Random Seismic Noise. Geophysics 2009, 74, V69–V73. [Google Scholar] [CrossRef]
  8. AlBinHassan, N.M.; Luo, Y.; Al-Faraj, M.N. 3D Edge-Preserving Smoothing and Applications. Geophysics 2006, 71, P5–P11. [Google Scholar] [CrossRef]
  9. Ashraf, H.; Mousa, W.A.; Al Dossary, S. Sobel Filter for Edge Detection of Hexagonally Sampled 3D Seismic Data. Geophysics 2016, 81, N41–N51. [Google Scholar] [CrossRef]
  10. Guo, L.; Liu, Y.; Liu, C.; Zheng, Z. Structure-Oriented Filtering for Seismic Images Using Nonlocal Median Filter. In SEG Technical Program Expanded Abstracts 2018; SEG Technical Program Expanded Abstracts; Society of Exploration Geophysicists: Anaheim, CA, USA, 2018; pp. 4623–4627. [Google Scholar]
  11. Chopra, S.; Marfurt, K.J. Structure-Oriented Filtering and Image Enhancement. In Seismic Attributes for Prospect Identification and Reservoir Characterization; Geophysical Developments Series; Society of Exploration Geophysicists and European Association of Geoscientists and Engineers: Denver, CO, USA, 2007; pp. 187–218. [Google Scholar]
  12. Steklain, A.F.; Ganacim, F.; Adames, M.R.; Gonçalves, J.L.; Oliveira, D.S. Structure-Oriented Filtering in Unsupervised Multiattribute Seismic Facies Analysis. Lead. Edge 2022, 41, 366–436. [Google Scholar] [CrossRef]
  13. Barbato, U.; Castagna, J.; Portniaguine, O.; Fagin, S. Composite Attribute from Spectral Decomposition for Fault Detection. In SEG Technical Program Expanded Abstracts 2014; SEG Technical Program Expanded Abstracts; Society of Exploration Geophysicists: Denver, CO, USA, 2014; pp. 2542–2546. [Google Scholar]
  14. Yuan, Z.; Huang, H.; Jiang, Y.; Tang, J.; Li, J. An Enhanced Fault-Detection Method Based on Adaptive Spectral Decomposition and Super-Resolution Deep Learning. Interpretation 2019, 7, T713–T725. [Google Scholar] [CrossRef]
  15. Miao, X.; Todorovic-Marinic, D.; Klatt, T. Enhancing Seismic Insight by Spectral Decomposition. In SEG Technical Program Expanded Abstracts 2007; SEG Technical Program Expanded Abstracts; Society of Exploration Geophysicists: San Antonio, TX, USA, 2007; pp. 1437–1441. [Google Scholar]
  16. Jahan, I.; Castagna, J. Spectral Decomposition Using Time-Frequency Continuous Wavelet Transforms for Fault Detection in the Bakken Formation. In SEG Technical Program Expanded Abstracts 2017; SEG Technical Program Expanded Abstracts; Society of Exploration Geophysicists: Houston, TX, USA, 2017; pp. 2190–2194. [Google Scholar]
  17. Liu, S.; Wen, X.; Li, L.; Yang, J.; Chen, X. Fault Analysis of Azimuth Curvature Attribute Based on Curvelet Transform. In SEG 2018 Workshop: Reservoir Geophysics, Daqing, China, 5–7 August 2018; SEG Global Meeting Abstracts; Society of Exploration Geophysicists and the Chinese Geophysical Society: Daqing, China, 2018; pp. 1–4. [Google Scholar]
  18. Brito, L.S.B.; Alaei, B.; Torabi, A.; Leopoldino-Oliveira, K.M.; Vasconcelos, D.L.; Bezerra, F.H.R.; Nogueira, F.C.C. Automatic 3D Fault Detection and Characterization—A Comparison between Seismic Attribute Methods and Deep Learning. Interpret.-J. Subsurf. Charact. 2023, 11, T793–T808. [Google Scholar] [CrossRef]
  19. Islam, M.M.; Babikir, I.; Elsaadany, M.; Elkurdy, S.; Siddiqui, N.A.; Akinyemi, O.D. Application of a Pre-Trained CNN Model for Fault Interpretation in the Structurally Complex Browse Basin, Australia. Appl. Sci. 2023, 13, 11300. [Google Scholar] [CrossRef]
  20. Rodriguez-Pradilla, G.; Verdon, J.P. Quantifying the Variability in Fault Density across the UK Bowland Shale with Implications for Induced Seismicity Hazard. Geomech. Energy Environ. 2024, 38, 100534. [Google Scholar] [CrossRef]
  21. Hale, D. Methods to Compute Fault Images, Extract Fault Surfaces, and Estimate Fault Throws from 3D Seismic Images. Geophysics 2013, 78, O33–O43. [Google Scholar] [CrossRef]
  22. Basir, H.M.; Javaherian, A.; Yaraki, M.T. Multi-Attribute Ant-Tracking and Neural Network for Fault Detection: A Case Study of an Iranian Oilfield. J. Geophys. Eng. 2013, 10, 015009. [Google Scholar] [CrossRef]
  23. Xie, Q.; Zhao, C.; Rui, Z.; Guan, S.; Zheng, W.; Fan, H. An Improved Ant-Tracking Workflow Based on Divided-Frequency Data for Fracture Detection. J. Geophys. Eng. 2022, 19, 1149–1162. [Google Scholar] [CrossRef]
  24. Li, S.; Zhao, Y.; Xian, C.; Liang, X.; Zhang, J.; Qiao, Q.; Yan, L.; Shen, Y.; Cao, H. Small-Scale Fracture Detection via Anisotropic Bayesian Ant-Tracking Colony Optimization Driven by Azimuthal Seismic Data. IEEE Trans. Geosci. Remote Sens. 2023, 61, 1–12. [Google Scholar] [CrossRef]
  25. Ge, X.; Guo, T.; Ma, Y.; Wang, G.; Li, M.; Zhao, P.; Yu, X.; Li, S.; Fan, H.; Zhao, T. Fracture Development and Inter-Well Interference for Shale Gas Production from the Wufeng-Longmaxi Formation in a Gentle Syncline Area of Weirong Shale Gas Field, Southern Sichuan, China. J. Pet. Sci. Eng. 2022, 212, 110207. [Google Scholar] [CrossRef]
  26. Luo, J.; Yang, X.; Wang, L.; Li, X.; Xu, M.; Guo, H.; Wang, Z.; Deng, W. Finely Description for Fractured Reservoir and Comprehensive Evaluation of Seismic. In Proceedings of the 2021 International Petroleum and Petrochemical Technology Conference, Beijing, China, 8–10 June 2021; Lin, J., Ed.; Springer: Singapore, 2022; pp. 166–173. [Google Scholar]
  27. Wang, R.; Liu, T.; Zhang, C. Fault Interpretation for Carbonate Reservoir and Its Application for Reservoir Connectivity. In SEG Technical Program Expanded Abstracts 2019; Society of Exploration Geophysicists: San Antonio, TX, USA, 2019; pp. 3479–3482. [Google Scholar]
  28. Li, K.; Zong, J.; Fei, Y.; Liang, J.; Hu, G. Simultaneous Seismic Deep Attribute Extraction and Attribute Fusion. IEEE Trans. Geosci. Remote Sens. 2022, 60, 1–10. [Google Scholar] [CrossRef]
  29. Jiang, W.; Zhang, D.; Hui, G. A Dual-Branch Fracture Attribute Fusion Network Based on Prior Knowledge. Eng. Appl. Artif. Intell. 2024, 127, 107383. [Google Scholar] [CrossRef]
  30. Yin, X.; Zhang, H.; Zong, Z. Research status and progress of 5D seismic data interpretation in OVT domain. Geophys. Prospect. Pet. 2018, 57, 155–178, (In Chinese with English Abstract). [Google Scholar]
  31. Pei, J.; Guo, X.; Hu, Y.; Guo, F.; Liu, B.; Hao, L.; Zhang, R.; Zheng, F. Research and Application of 5D Seismic Prediction Technology. Interpretation 2023, 11, T189–T197. [Google Scholar] [CrossRef]
  32. Williams, M.; Jenner, E. Interpreting Seismic Data in the Presence of Azimuthal Anisotropy; or Azimuthal Anisotropy in the Presence of the Seismic Interpretation. Lead. Edge 2002, 21, 771–774. [Google Scholar] [CrossRef]
  33. Pan, X.; Li, L.; Zhang, G. Multiscale Frequency-Domain Seismic Inversion for Fracture Weakness. J. Pet. Sci. Eng. 2020, 195, 107845. [Google Scholar] [CrossRef]
  34. Pan, X.; Zhang, D.; Zhang, P. Fracture Detection from Azimuth-Dependent Seismic Inversion in Joint Time–Frequency Domain. Sci. Rep. 2021, 11, 1269. [Google Scholar] [CrossRef] [PubMed]
  35. Grechka, V.; Tsvankin, I. 3-D Description of Normal Moveout in Anisotropic Inhomogeneous Media. Geophysics 1998, 63, 1079–1092. [Google Scholar] [CrossRef]
  36. Rüger, A. P-wave Reflection Coefficients for Transversely Isotropic Models with Vertical and Horizontal Axis of Symmetry. Geophysics 1997, 62, 713–722. [Google Scholar] [CrossRef]
  37. Rüger, A.; Tsvankin, I. Using AVO for Fracture Detection: Analytic Basis and Practical Solutions. Lead. Edge 1997, 16, 1429–1434. [Google Scholar] [CrossRef]
  38. Rüger, A. Reflection Coefficients and Azimuthal AVO Analysis in Anisotropic Media; Society of Exploration Geophysicists: Tulsa, OK, USA, 2002; ISBN 1-56080-10-7. [Google Scholar]
  39. Mallick, S.; Craft, K.L.; Meister, L.J.; Chambers, R.E. Chambers Determination of the Principal Directions of Azimuthal Anisotropy from P-Wave Seismic Data. Geophysics 1998, 63, 692–706. [Google Scholar] [CrossRef]
  40. Qu, S.L.; Ji, Y.X.; Wang, X.; Wang, X.L.; Chen, X.R.; Shen, G.Q. Seismic method for using full-azimuth P wave attribution to detct fracture. Oil Geophys. Prospect. 2021, 36, 390–397, (In Chinese with English Abstract). [Google Scholar]
  41. Li, C.P.; Yin, X.Y.; Liu, Z.G.; Li, A.S.; Yuan, F. An anisotropic gradient inversion for fractured reservoir prediction. Geophys. Prospect. Pet. 2017, 56, 835–840, (In Chinese with English Abstract). [Google Scholar]
  42. Zhang, G.Z.; Chen, H.Z.; Yin, X.Y.; Li, N.; Yang, B.Y. Method of Fracture Elastic Parameter Inversion Based on Anisotropic AVO. J. Jilin Univ. (Earth Sci. Ed.) 2012, 42, 845–851, (In Chinese with English Abstract). [Google Scholar]
  43. Wang, H.Q.; Yang, W.Y.; Xie, C.H.; Zheng, D.M.; Wang, H.L.; Zhang, X.M.; Jiang, C.L. Azimuthal anisotropy analysis of different seismic attributes and fracture prediction. Oil Geophys. Prospect. 2014, 49, 925–931, (In Chinese with English Abstract). [Google Scholar]
  44. Zhou, L.; Zou, J.H.; Dai, R.X.; Zhang, Y.; Lan, X.M.; Wu, Y.; Wang, H.Q.; Liu, S.M. Application of OVT-domain 5-dimensional seismic attributes in fracture prediction in the Qixia Formation of the Shuangyushi area. Earth Sci. Front. 2023, 30, 213–228, (In Chinese with English Abstract). [Google Scholar]
  45. Chen, Z.G.; Li, F.; Wang, X.; Wu, R.K.; Sun, X.; Zhao, Q.; Song, D.C.; Ma, H. Application of prestack anisotropic intensity attribute in prediction of P Buried hill fractured reservoir in Bongor Basin, Chad. Chin. J. Geophys. 2018, 61, 4625–4634, (In Chinese with English Abstract). [Google Scholar]
  46. Zong, Z.Y.; Yin, X.Y.; Wu, G.C. Model Parameterization and EVA-DSVD Inversion with Young’s Modulus and Poisson’s Ratio. In SEG Technical Program Expanded Abstracts 2013; SEG Technical Program Expanded Abstracts; Society of Exploration Geophysicists: Houston, TX, USA, 2013; pp. 408–412. [Google Scholar]
  47. Zong, Z.Y.; Yin, X.Y.; Wu, G.C. Elastic Impedance Parameterization and Inversion with Young’s Modulus and Poisson’s Ratio. Geophysics 2013, 78, N35–N42. [Google Scholar] [CrossRef]
  48. Yaojie, C.; Shulin, P. Calculation Example of Brittleness Index of Tight Glutenite Based on Prestack Seismic Inversion. In SEG Integration of Geophysics, Geology, and Engineering Workshop, Chengdu, China, 26–28 June 2023; SEG Global Meeting Abstracts; Society of Exploration Geophysicists: Houston, TX, USA, 2023; pp. 18–21. [Google Scholar]
  49. Sayers, C.M. The Effect of Anisotropy on the Young’s Moduli and Poisson’s Ratios of Shales. In SEG Technical Program Expanded Abstracts 2010; Society of Exploration Geophysicists: Denver, CO, USA, 2010; pp. 2606–2611. [Google Scholar]
  50. Zong, Z.; Sun, Q.; Li, C.; Yin, X. Young’s Modulus Variation with Azimuth for Fracture-Orientation Estimation. Interpretation 2018, 6, T809–T818. [Google Scholar] [CrossRef]
  51. Wang, J.H.; Zhang, J.M.; Wu, G.C. Wide-azimuth Young’s modulus inversion and fracture prediction: An example of H structure in Bozhong sag. Oil Geophys. Prospect. 2021, 56, 593–602, (In Chinese with English Abstract). [Google Scholar]
  52. Vakhin, A.V.; Khelkhal, M.A.; Tajik, A.; Ignashev, N.E.; Krapivnitskaya, T.O.; Peskov, N.Y.; Glyavin, M.Y.; Bulanova, S.A.; Slavkina, O.V.; Schekoldin, K.A. Microwave Radiation Impact on Heavy Oil Upgrading from Carbonate Deposits in the Presence of Nano-Sized Magnetite. Processes 2021, 9, 2021. [Google Scholar] [CrossRef]
  53. Al-Mishaal, O.F.; Suwaid, M.A.; Al-Muntaser, A.A.; Khelkhal, M.A.; Varfolomeev, M.A.; Djimasbe, R.; Zairov, R.R.; Saeed, S.A.; Vorotnikova, N.A.; Shestopalov, M.A.; et al. Octahedral Cluster Complex of Molybdenum as Oil-Soluble Catalyst for Improving In Situ Upgrading of Heavy Crude Oil: Synthesis and Application. Catalysts 2022, 12, 1125. [Google Scholar] [CrossRef]
  54. Zhao, Y.; Wu, G.; Zhang, Y.; Scarselli, N.; Yan, W.; Sun, C.; Han, J. The Strike-Slip Fault Effects on Tight Ordovician Reef-Shoal Reservoirs in the Central Tarim Basin (NW China). Energies 2023, 16, 2575. [Google Scholar] [CrossRef]
  55. Zhu, Y.; Zhang, Y.; Zhao, X.; Xie, Z.; Wu, G.; Li, T.; Yang, S.; Kang, P. The Fault Effects on the Oil Migration in the Ultra-Deep Fuman Oilfield of the Tarim Basin, NW China. Energies 2022, 15, 5789. [Google Scholar] [CrossRef]
  56. Chen, L.; Jiang, Z.; Sun, C.; Ma, B.; Su, Z.; Wan, X.; Han, J.; Wu, G. An Overview of the Differential Carbonate Reservoir Characteristic and Exploitation Challenge in the Tarim Basin (NW China). Energies 2023, 16, 5586. [Google Scholar] [CrossRef]
  57. He, G.Z. Study on Controlling Effectes of Faults on Ordovician Carbonate Hydrocarbon Accumulation in the YM2 Area. Master’s Thesis, China University of Petroleum, Beijing, China, 2017. (In Chinese with English Abstract). [Google Scholar]
  58. Zhang, J.; Nie, X.; Xiao, S.; Zhang, C.; Zhang, C.; Zhang, Z. Generating Porosity Spectrum of Carbonate Reservoirs Using Ultrasonic Imaging Log. Acta Geophys. 2018, 66, 191–201. [Google Scholar] [CrossRef]
  59. Zhao, R.; Deng, S.; Yun, L.; Lin, H.; Zhao, T.; Yu, C.; Kong, Q.; Wang, Q.; Li, H. Description of the reservoir along strike-slip fault zones in China T-Sh oilfield, Tarim Basin. Carbonates Evaporites 2020, 36, 2. [Google Scholar] [CrossRef]
  60. Deng, X.L.; Luo, X.S.; Liu, Y.F.; Huang, L.M.; Xiong, C. Forming Mechanism and Development Measures of Constant-Volume Fractured-Vuggy Carbonate Oil Reservoirs. Xinjiang Pet. Geol. 2019, 40, 79–83, (In Chinese with English Abstract). [Google Scholar]
Figure 1. (a) Structural location map of the study area; (b) structural map of the top surface of the Yijianfang Formation in the target layer; (c) stratigraphic column of the Ordovician series.
Energies 17 02061 g001
Figure 2. Core photos and a thin section of the target layer of typical wells in the study area: (ac) core photos of M1, M2, and M3 wells, respectively; (d) thin section of M8 well. M1: residual dissolution pores developed along high-angle fractures; M2: crude oil extravasation along high-angle unfilled fractures; M3: crude oil extravasation along vertical unfilled fractures; M8: bright crystal psammitic limestone with visible fractures.
Energies 17 02061 g002
Figure 3. (a) Statistical diagram of fracture angle; (b) relationship between fracture development and production; and (c) relationship between fracture permeability and production in the study area. The scatter points presented in (b) depict the measured fracture aperture and production rate data for a well within the study area. Analogously, the scatter points in (c) illustrate the measured fracture permeability and production rate data for a well (potentially the same or a different one) within the study area. The dashed curves approximate the underlying trends within these measurements.
Energies 17 02061 g003
Figure 4. Workflow of pre-stack fracture prediction based on OVT gather.
Energies 17 02061 g004
Figure 5. Typical OVT gather display: (a) spiral arrangement display of azimuth and offset for OVT gather; (b) original OVT gather; (c) gather after Radon transform denoising; (d) display of random noise; (e) gather after time alignment.
Energies 17 02061 g005
Figure 6. Analysis of azimuth angle and offset division scheme: (a) azimuth and offset distribution of OVT gather; (bd) gather on each azimuth when the maximum offset is 6500 m, 5000 m, and 4500 m, respectively.
Energies 17 02061 g006
Figure 7. Sub-maps of the top surface of the Yijianfang formation: (a) structural map; (b) curvature attribute map; (c) ellipticity attribute map; (d) superimposed plan view displaying both ellipticity and curvature attributes. Black dots represent the well locations, red lines indicate thrust faults, purple lines indicate strike-slip faults, and blue lines indicate normal faults, which are consistent with Figure 1.
Energies 17 02061 g007
Figure 8. Comparison between imaging logging fracture interpretation conclusions and prediction results for wells such as M3 within the study area. For a given well, the sub-diagrams presented from left to right are the statistical rose diagram of fracture orientation from imaging logging, the statistical rose diagram of predicted fracture orientation, and the superimposed three-dimensional display of the geological structure, fracture orientation, and density around the well area. The locations of the wells are shown in Figure 7a.
Energies 17 02061 g008
Figure 9. (a) Seismic profile; (bg) azimuthal Young’s modulus profiles; and (h) superimposed waveform display of azimuthal Young’s modulus for well M7 in the study area. The locations of the diagrams (ah) are indicated as shown by the dashed arrows in Figure 10a.
Energies 17 02061 g009
Figure 10. (a,b) Maximum trough attribute and ellipticity attribute plans for the M7 well area, respectively. The purple dashed line boxes indicate the development zones of beaded reservoirs; (ce) enlarged local views of the 6-azimuthal Young’s modulus data extracted from the centers of three beaded reservoirs; (f) a box plot depicting the statistical distribution of the Young’s modulus values measured in six azimuths at the centers of the three beaded reservoirs.
Energies 17 02061 g010
Figure 11. Production curves of well M7.
Energies 17 02061 g011
Table 1. Statistical table of imaging logging fracture orientations and predicted fracture orientations for wells M3, M4, M5, and M6.
Well NameOrientations
from Imaging Logging
Orientations
from Prediction
Match
M3N40°E~N60°EN40°E~N60°EMatching
M4N20°E~N30°EN20°E~N30°EMatching
M5N10°E~N20°E
N30°E~N40°E
N20°E~N30°ENot matching well
M6N10°E~N30°EN10°E~N30°EMatching
Disclaimer/Publisher’s Note: The statements, opinions and data contained in all publications are solely those of the individual author(s) and contributor(s) and not of MDPI and/or the editor(s). MDPI and/or the editor(s) disclaim responsibility for any injury to people or property resulting from any ideas, methods, instructions or products referred to in the content.

