
Signal Injection-Based Topology Identification for Low-Voltage Distribution Networks Considering Missing Data

1
College of Electrical Engineering, Hunan Industry Polytechnic, Changsha 410208, China
2
College of Electrical and Information Engineering, Hunan University, Changsha 410082, China
*
Author to whom correspondence should be addressed.
Energies 2024, 17(9), 2060; https://0-doi-org.brum.beds.ac.uk/10.3390/en17092060
Submission received: 30 March 2024
/
Revised: 22 April 2024
/
Accepted: 23 April 2024
/
Published: 26 April 2024
(This article belongs to the Special Issue ICT in Smart Grids)
Abstract
:With the widespread use of new equipment such as distributed photovoltaics, distributed energy storage, electric vehicles, and distributed wind power, the control of low-voltage distribution networks (LVDNs) has become increasingly complex. Acquiring the most recent topological structure is essential for conducting accurate analysis and real-time control of LVDNs. The signal injection-based topology identification algorithm is favored for its speed and efficiency. This research introduces an innovative topology identification algorithm based on signal injection, specifically designed to address the challenges of incomplete and inaccurate identifications caused by the missing data in feature signal records (FSRs). Based on the correlations among FSRs at various devices, the algorithm introduces a dual-axis completion strategy—both vertical and horizontal—to effectively address missing data. Subsequently, an inclusion detection process is devised to process the completed FSRs, culminating in an accurate topology of LVDNs. Based on the study of actual LVDN data, the results indicate that the proposed algorithm markedly enhances the completeness and accuracy of topology identification. This advancement offers a robust solution tailored to accommodate the dynamic and swiftly changing topological configurations of LVDNs.
1. Introduction
With the rapid development of user-side equipment such as distributed photovoltaics, distributed energy storage, and electric vehicles, the functions performed by LVDNs are becoming more complex. Accurately determining LVDNs’ topology structure is becoming increasingly important for power grid managers. First, accurate topology information is the basis for conducting analyses such as power flow calculation, state estimation, fault location, and early warning; it can be used to detect and handle abnormal situations in a timely manner and improve power supply reliability. Secondly, topology information is instrumental in estimating line parameters and analyzing losses, which enables the monitoring of line operating status and loss levels, aids in preventing electricity theft, and contributes to enhanced economic efficiency. Finally, with the large-scale access to distributed energy sources in LVDNs, it is necessary to perform stability analysis and real-time control on the grid, and the network topology structure is among the key data. Therefore, identifying the topology of LVDNs has theoretical and practical significance.
Currently, there are two main types of topology identification methods for LVDNs [1]. The first type is based on measurement data. This method mainly uses physical parameters such as voltage, current, and power to determine the connection relationships between different devices through relevance analysis, clustering analysis, linear programming, neural networks, and other technologies [2,3,4,5,6,7,8,9,10,11,12,13]. The advantage of this method is that it can use data provided by existing measurement devices. The disadvantage is that it requires a lot of measurement data support, it has high requirements for data quality and completeness, and the calculation process may be complex and time-consuming. The other method is based on signal transmission; it mainly injects feature signals into the power cable and determines the connection relationships of devices by tracking and analyzing feature signals in power lines [14,15,16,17,18,19,20]. The advantages of this method are that it requires small amounts of data, provides fast results, and has low computational requirements. The disadvantage is that it requires the installation of a large number of devices, which increases costs and implementation difficulties. Particularly, topology identification based on power line communication (PLC) technology, as a special type of signal injection topology identification technique, has developed very rapidly. This method uses low-cost PLC modules to achieve communication and topology identification functions simultaneously, making construction costs and difficulty no longer an issue. This method is used to identify transformer-to-house relationships [14].
In recent years, a new generation of intelligent power equipment, such as intelligent integration terminals (IITs), intelligent low-voltage circuit breakers (ILVCBs), and smart energy meters (SEMs), has been widely used in LVDNs, following the development of communication and edge computing technology. These devices can fully realize the signal injection-based topology identification method without the need for additional equipment. As a result, many universities and enterprises are once again paying attention to and continuing to research this technology.
The authors of [15] proposed a record-based low-voltage topology identification method that utilizes broadband PLC technology and current topology pulse technology to quickly and accurately identify the consumer–transformer relationships and hierarchical relationships in LVDNs. This scheme can sense topology changes and adapt to dynamic environments, characterized by low algorithm complexity, high real-time performance, and reliability. In [16], the authors used phase voltage zero-crossing modulation and the alternating-direction multiplier method to achieve the dynamic identification and model comparison of LVDNs. The proposed scheme, while implementing topology identification using hardware, can also perform topology verification with the main station system, enhancing the model’s accuracy and reliability. The authors of [17] introduced a physical topology identification method for LVDNs based on pulse current feature analysis, utilizing pulse current communication technology, Hilbert–Huang transform algorithms, and spatiotemporal charge feature verification algorithms based on edge computing to safely, quickly, and accurately map the physical topology. In [18], the authors presented a topology identification technology based on intelligent measurement switches, using modulation, demodulation, and encoding methods of feature current signals to accurately identify the physical topology of low-voltage distribution substations and generate self-portrait structural diagrams of the online substations. The authors of [19] introduced a method for identifying the topology of low-voltage substation areas in distribution networks. This method utilizes feature signals from intelligent terminals, reactive power compensation, and edge computing to enhance efficiency and real-time capabilities in topology identification. The authors of [20] employed high-speed PLC communication technology and external electrical frequency signals, automatically completing topology identification through the correlation of characteristic information collected by intelligent monitoring units and voltage zero-crossing offset characteristics.
In the multitude of studies mentioned above, although various topology identification methods based on signal injection have been developed, they generally overlook the impact of signal integrity on identification accuracy. In the complex and dynamically changing system of LVDNs, injected signals face numerous influences such as signal attenuation, user load impacts, and natural environmental interference, making the stable reception of injected signals a significant challenge. The incompleteness of the signal may lead to incorrect judgments on the part of the topology structure, thereby affecting the network’s analysis and real-time control.
The signal injection-based topology identification process involves two types of information: network communication and topological features. Moreover, there is redundant information in the topological feature data of each device. Therefore, a viable approach is to find the correlation between network communication and topological features, using redundant information to complete missing data. Based on this approach, this paper focuses on the following three aspects: exploring the correlation features between devices’ communication information and topological information, studying strategies for completing missing data using redundant information, and a rapid topology identification method based on edge computing technology. Through these studies, the accuracy and efficiency of signal injection-based topology identification methods in practical engineering applications can be improved.
The rest of this paper is organized as follows: Section 2 provides a detailed introduction to the principles and processes of signal injection-based topology identification and examines the interconnectivity of data among devices. In Section 3, the data completion algorithm and the rapid topology identification algorithm are presented. Section 4 investigates a real topology identification project for LVDNs and analyzes and discusses the engineering data of the project, including graphical representations and comparisons. Finally, Section 5 concludes the study.
2. Signal Injection-Based Topology Identification
2.1. Topology Identification Principle
LVDNs usually refer to power networks that deliver electricity from transformers to end users, such as homes and businesses, with voltage levels of 1000 V and below in urban and rural areas. The structure of LVDNs is generally a multilayered tree. After power lines emerge from the transformer, the equipment to which they usually connect includes switches, protection devices, and cables, all of which have very little impact on the injected signal due to their small internal resistances. Therefore, a feature signal such as feature current or feature power injected into power lines via an end device can be detected by all of its upstream devices. Such features can be used to identify the connectivity of a specified branch. FSRs are the set of records composed of these topological feature signals received by a device. It includes the feature signal information, such as the capture time and value of each feature signal. After all devices have completed signal injection, the edge computing device collects FSRs of all devices and performs topological identification analysis to determine the latest topology structure.
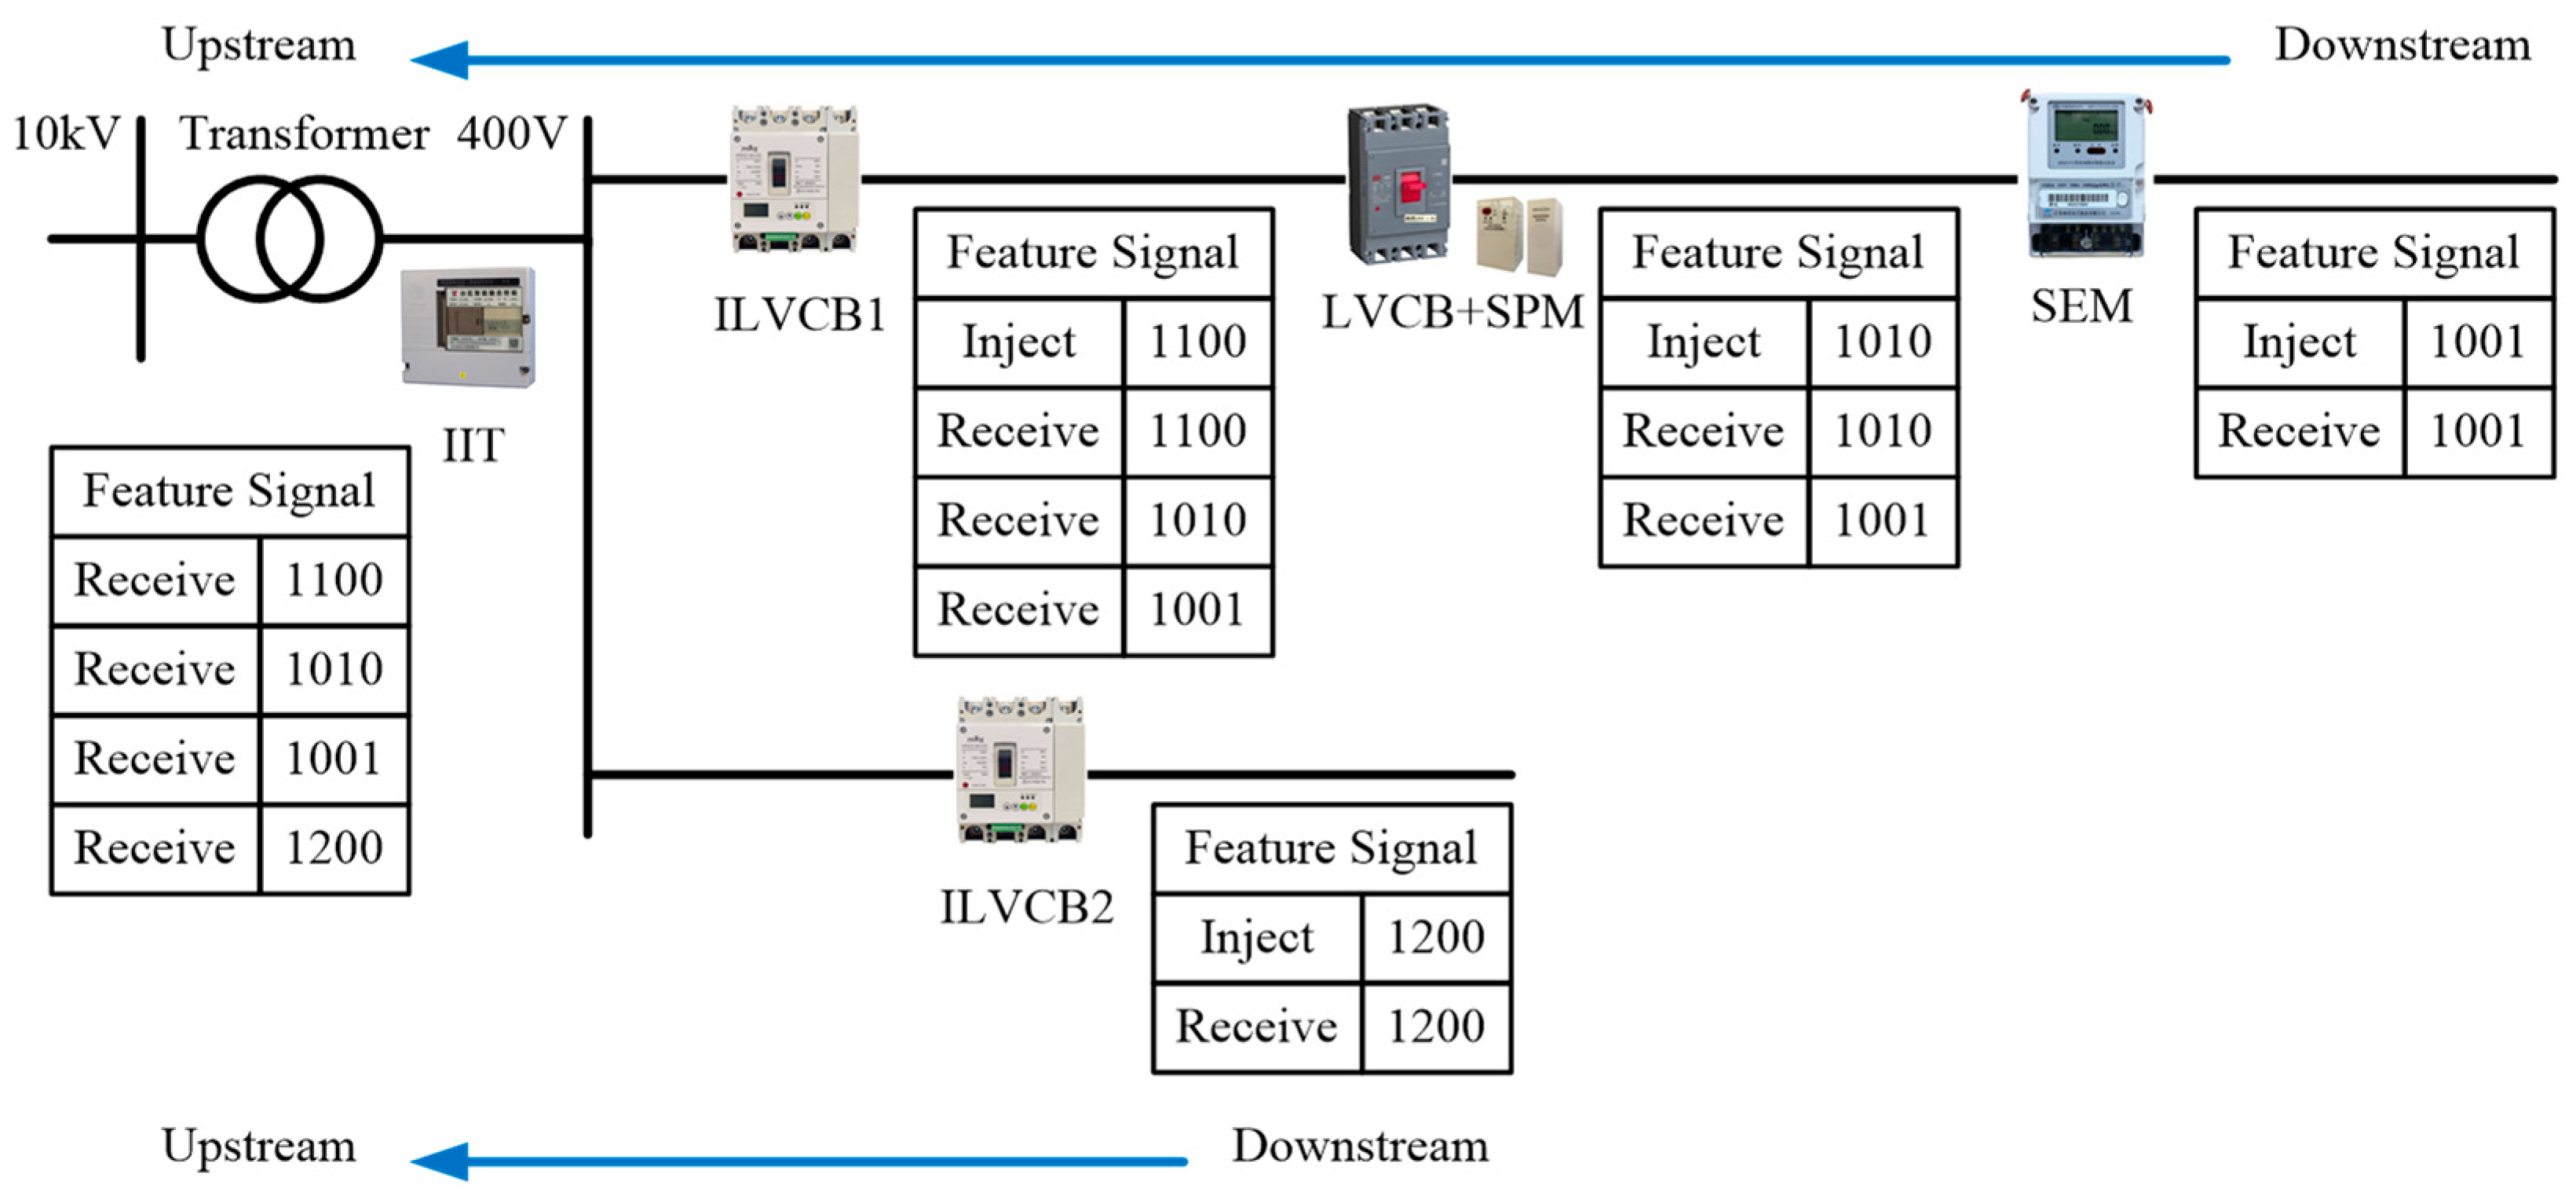
Two types of devices are required to complete signal injection-based topology identification in practical engineering: The first type is a topology identification device (TID), which mainly completes the injection and reception of feature signals. This type of device can be independently installed in LVDNs or integrated into intelligent equipment to achieve this function, such as a signal processing module (SPM), ILVCB, and SEM. The second type is a signal analysis device, which is generally installed on the low-voltage output side of the transformer. These devices control TID remotely through a specific communication channel, such as PLC, wireless, or blockchain-based secure communication [21]. Their main function is to send commands, collect FSRs from all TIDs, and execute the topology identification algorithm. Figure 1 shows the installation and data processing of each device in an actual LVDN.
As shown in Figure 1, the ILVCB, SEM, and the combination of LVCB and SPM are used for signal processing, installed in different positions of LVDNs. The IIT near the transformer is used for signal analysis. When the SEM injects signal “1001” into the power line, upstream devices such as the SPM, ILVCB1, and IIT will all receive signal “1001”. Similarly, the ILVCB1 and IIT can receive signal “1010” injected by the SPM, while only the IIT can receive signal “1100” injected by the ILVCB1. Since the ILVCB2 is located on another branch, only the IIT can receive signal “1200” when ILVCB2 injects it.
2.2. Topology Identification Process
The topology identification process for LVDNs via signal injection unfolds in three distinct phases: the initialization phase, the signal injection and detection phase, and the data processing phase. A comprehensive illustration of this process is presented in Figure 2.
After the topology identification process starts, the IIT reads the information of all TIDs installed in LVDNs. This TID information includes the total number of TIDs (T), the identification number, the device type (e.g., ILVCB, SPM, SEM), and the communication channel.
By obtaining this information, the IIT sends an initialization command to each TID to command them to clear their FSRs queue. After entering the feature signal injection and detection stage, the IIT will sequentially send a signal injection command to each TID, controlling them to inject feature signals representing themselves into the power line. At the same time, TIDs located upstream on the same line will receive this feature signal and record it in their local queue.
Following the completion of signal injection by each TID, the IIT will initiate a command to gather the FSRs from all TIDs. Subsequently, it will analyze the accumulated data and execute a topological identification algorithm to ultimately generate the most recent topology structure of LVDNs.
2.3. Impacts of FSR Completeness on Topology Identification
The most important data in the entire topology identification process are the FSRs of each TID. However, obtaining complete FSRs is not easy in practical engineering, as it is affected by the following factors:
- Communication quality: Reliable communication between the IIT and TID is fundamental for the operation of topology identification. If this communication fails, the IIT cannot send commands to the TID to initiate the signal injection and detection process, rendering the entire topology identification system inoperative.
- Feature signal injection equipment: In the event that a TID’s feature signal injection circuit malfunctions, the other TIDs within the same line are unable to receive the feature signal. This scenario renders the affected TID “invisible” to the topological identification algorithm, which consequently cannot ascertain its position.
- Feature signal reception equipment: When the feature signal sampling sensor works abnormally, the corresponding TID will not recognize any feature signals. As in the case of communication failure, the FSRs of that TID will become empty.
- Environmental interference: LVDNs are connected to a multitude of electrical devices, making the characteristics of their current or power extremely complex. Although the feature signals emitted by TIDs are specially designed, it cannot be guaranteed that they will be effective at all times and in all places. When a TID misses one or more feature signals, the FSRs will correspondingly decrease. Since this type of data loss is random and unpredictable, it has the most significant impact on topological identification.
For actual LVDNs, the probability of the above four factors occurring is not small. Especially for the fourth factor, it cannot be avoided every time topology identification is performed. Therefore, how to correctly supplement these missing data through algorithms to ensure the completeness and correctness of topology identification is one of the key points for signal injection-based topology identification for LVDNs.
3. Topology Identification Algorithm Considering Data Loss
3.1. Mathematical Terms Definitions
To ensure a clear understanding of the article content, mathematical terms in the topology identification algorithm below are defined in Table 1.
3.2. Feature Signal Record Matrix
The feature model of TIDt, which is used to record the information of the TID and the FSRs that it receives, can be represented as follows:
where IDt is the device identifier of TIDt, used to describe the unique identification of the TID; Nt represents the total number of feature signals recorded by TIDt; St acts as the position marker for the device, with varying values assigned to it, each denoting the node’s topology type; and Xt is the FSR vector for TIDt, recording all feature signal values. Following the collection of feature models from all TIDs by the IIT, these data are transformed into an FSR matrix for further processing.
3.3. Characteristics of FSRs
The FSRs of LVDNs have the following characteristics:
- Existence: If the communication is normal, the TID’s FSRs will definitely have a record describing it, regardless of whether it has been detected or not. This is because as long as there are no issues with the communication, the device physically exists, and even without FSRs, its impact on the topology must be considered.
- Inclusiveness: If a TID is capable of receiving the FSRs from others, this indicates that the former is situated upstream of the latter. Since an LVDN is a tree-shaped topological structure, its current and power converge towards the root of the tree. According to Kirchhoff’s current law (KCL), the feature signal emitted by a TID on a branch will definitely produce a feature current of the same magnitude but in the opposite direction on its upstream branch. Based on this principle, all TIDs corresponding to the FSRs are downstream devices that possess these FSRs.
- Transitivity: If a TID can receive the FSRs of its downstream devices, then all devices upstream of that device must also have those FSRs. By identifying a primary trunk within the tree-shaped topology of LVDNs, it can be found that any TID’s FSR comprises both its individual record and the collective FSRs of all subordinate devices. Therefore, the FSRs have an inclusive relationship with the FSRs of all downstream devices. Conversely, if a record appears in the queue of a downstream device, due to the transitivity of that trunk, the record must be present in the queues of all of its upstream devices.
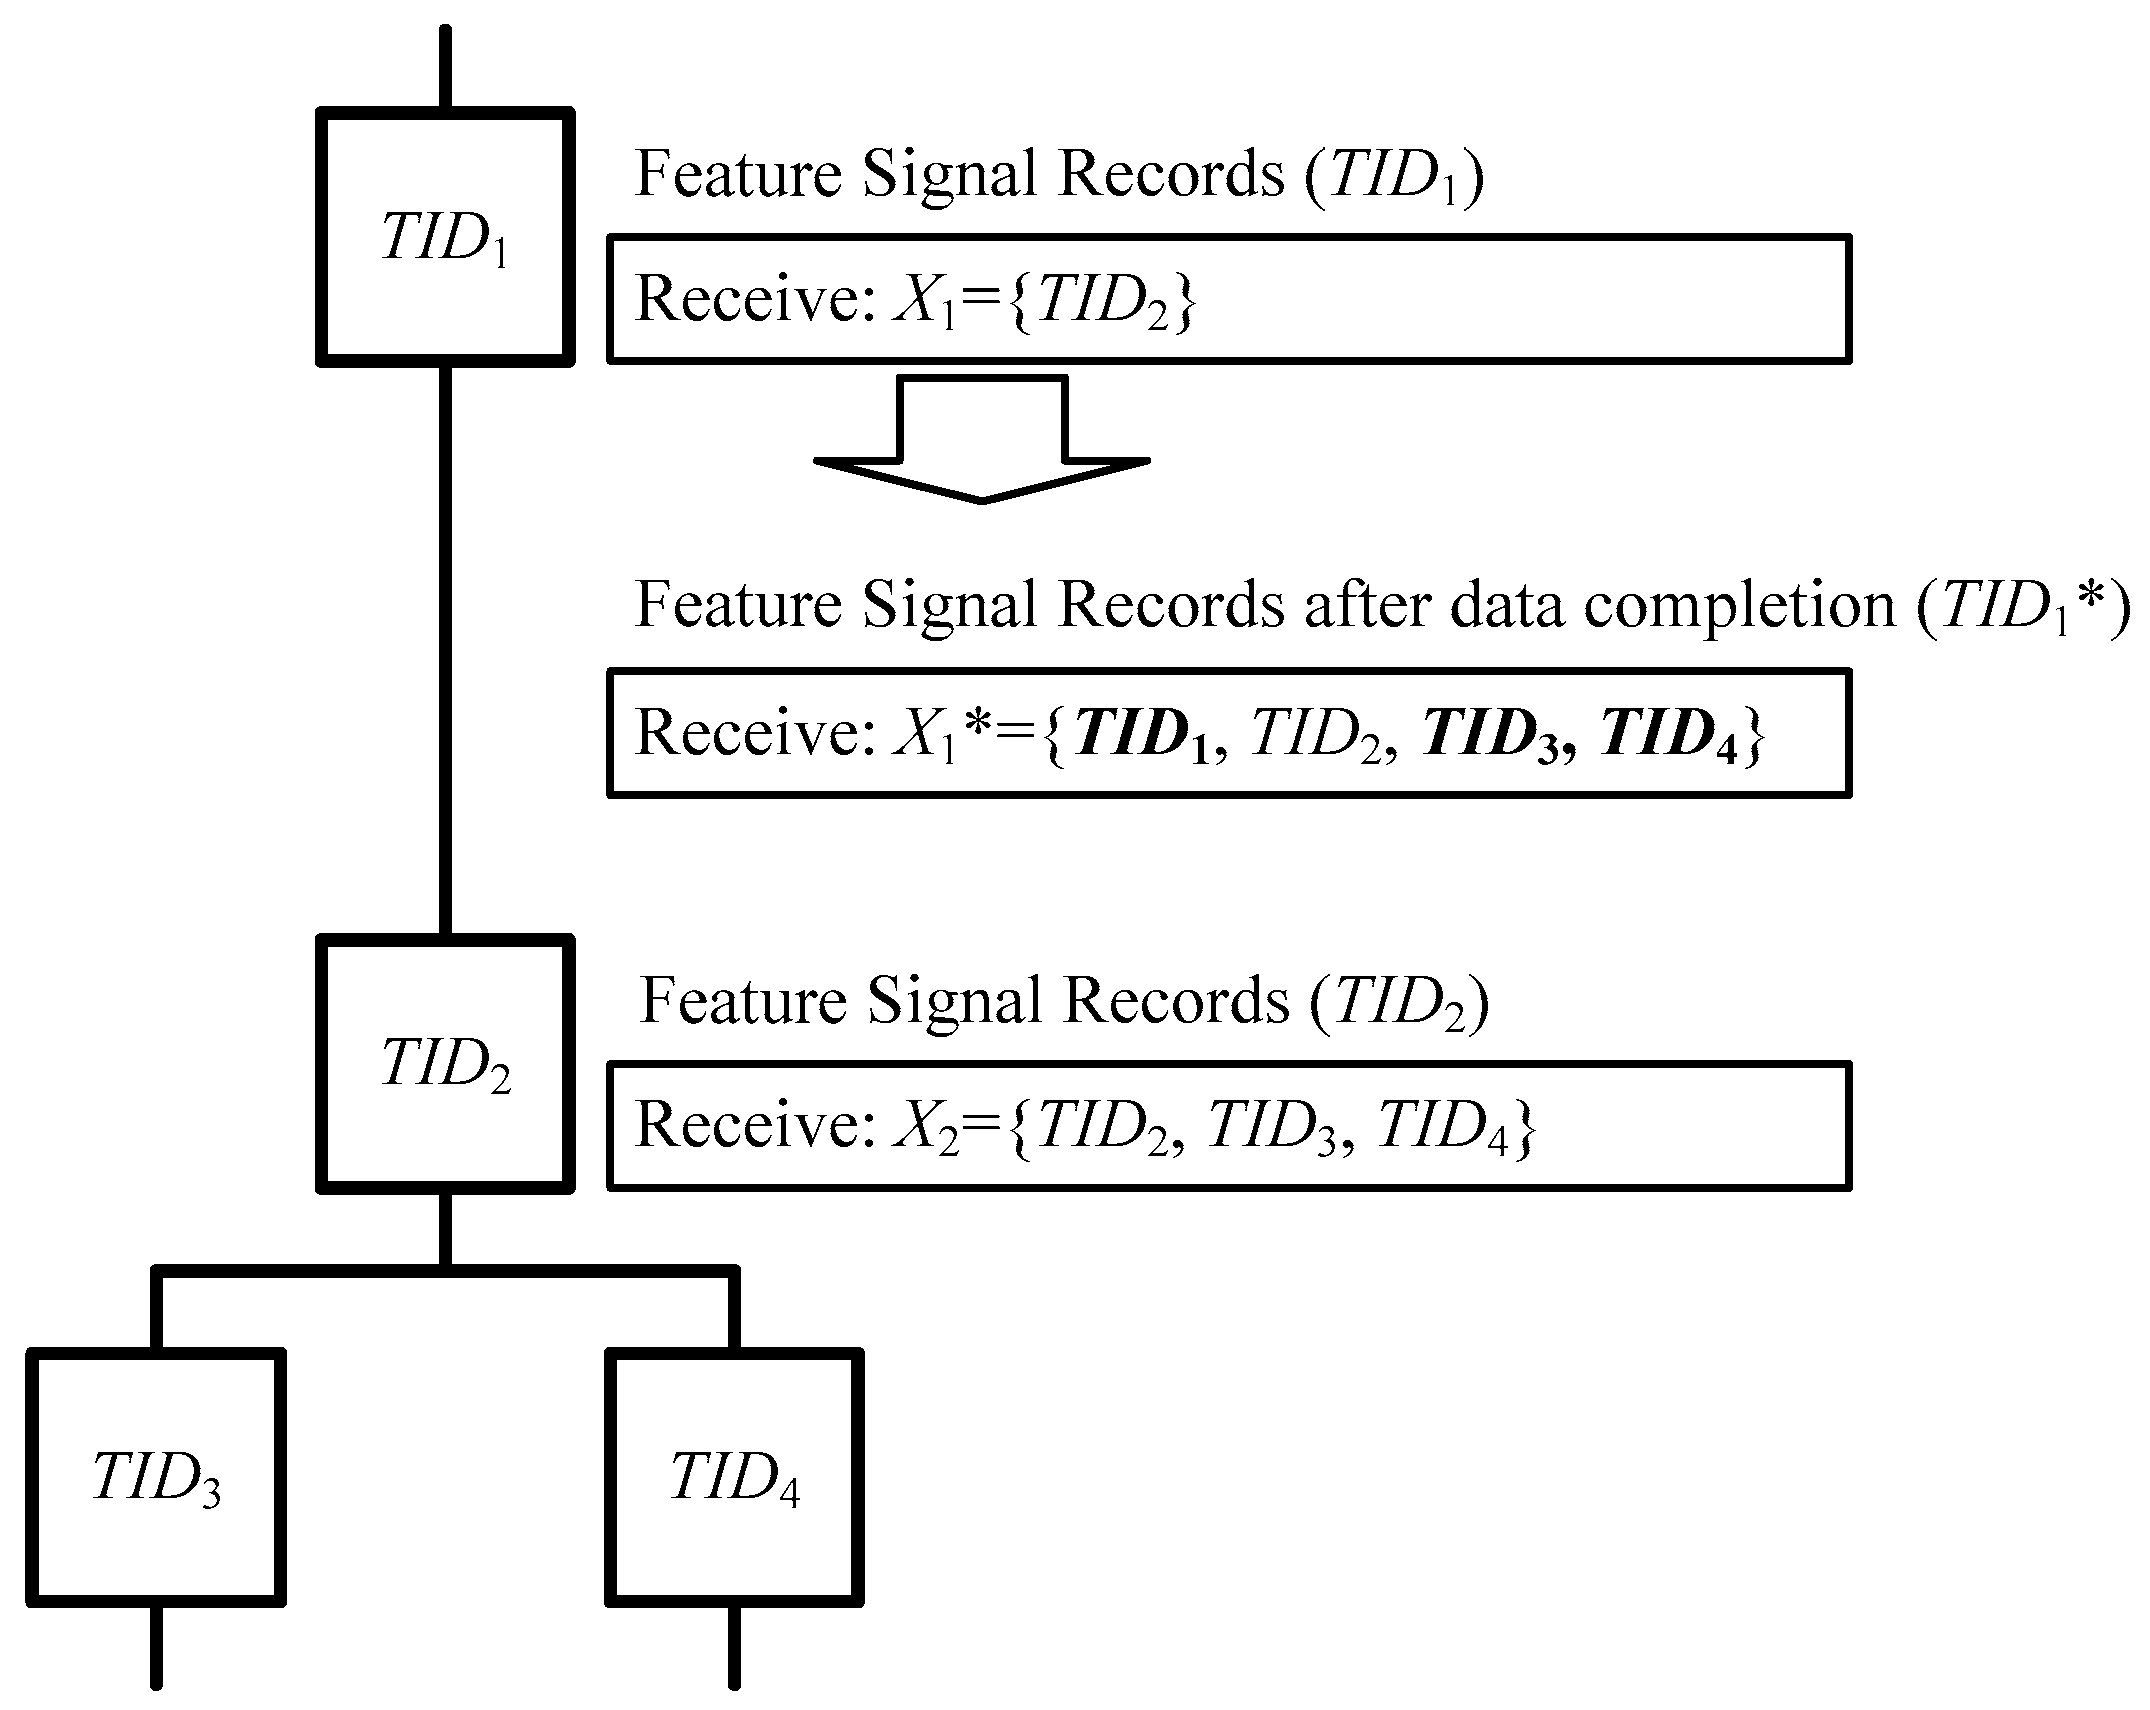
Figure 3 illustrates how to use these characteristics to complete the FSR data. The topology diagram contains four TIDs, where TID1 is the upstream device of TID2, and TID2 is the upstream device of TID3 and TID4. After completing a round of feature signal reception, the FSR vectors of TID1 and TID2 are X1 and X2, and their values are shown in Figure 3. Firstly, it can be observed that TID1’s FSRs lack their own record, which can be supplemented according to Characteristic 1. Secondly, since TID1’s FSRs include the record of TID2, it can be determined that TID1 is the upstream device of TID2 according to Characteristic 2. Since TID2’s FSRs include the records of TID3 and TID4, these two records can be added to TID1’s FSRs according to Characteristic 3. Finally, by integrating all of the data, the completed FSR vector X1* for TID1 can be obtained, and its value is shown in Figure 3.
Based on these three FSR characteristics, it is possible to perform the vertical and horizontal completion of the existing FSR vectors, minimizing the impact of missing data on topology identification.
3.4. Vertical Completion of the FSR Vectors
The vertical completion algorithm for the FSR vectors is based on a recursive process, and its formula is expressed as follows:
where Xt′ is the FSR vector after the vertical completion, xt is an element in the original FSR vector Xt, and Nt is the total number of elements in Xt. The function fV is a reconstruction function that uses recursion to achieve the vertical completion of Xt, which can be expressed as follows:
where the function returns null when the feature signal xt already exists in the dataset Xt, indicating that the recursive search for xt can end at this branch. When the number of feature signals in Xi is not greater than 1, and the given xt does not exist in the dataset Xt, the function returns {xt, i}, which is the feature signal itself, indicating that the current dataset of the recursive search only has the feature signal itself as valid data, and there is no need to enter an iterative search. When the number of feature signals in Xi is greater than 1, the recursive function fV is called, indicating that there are multiple valid data in the current dataset, and the recursive search is needed for each feature signal and their corresponding TID’s FSR vector.
3.5. Horizontal Completion of the FSR Vectors
For some FSR vectors after vertical completion, there is also a transitive relationship between each pair, which is reflected in the inclusion property between the two vectors. As shown in Figure 4a, when two FSR vectors have no intersection, their data are independent of one another, without transitivity, and cannot be completed. When one FSR vector completely belongs to another FSR vector, as shown in Figure 4b, the relevant data of one vector already exist in the upstream vector, and there is no need for data completion. When two FSR vectors have an intersection but no inclusion relationship, as shown in Figure 4c, according to the inclusiveness of the FSRs, it can be determined that the actual situation must be that one vector includes the other; therefore, the non-communicative part can be directly copied to another vector, forming an inclusive form, and achieving the horizontal completion of the data.
There is an issue here: when it comes to data completion, the vector to which the data are copied is uncertain. According to the inclusiveness characteristic of the FSRs, the vector that receives new data also moves upstream in its physical position, which can impact the correctness of topological recognition. Therefore, the data copy cannot be designated arbitrarily. Analyzing the FSR characteristics reveals that the intersection between two vectors exists because neither vector contains the TID information of the other. To determine which vector represents the upstream device, one must analyze the historical topological structure. For algorithms running on signal analysis devices, this method is overly complex and resource-intensive. Therefore, the algorithm in this study does not determine which vector corresponds to the upstream device; instead, it marks all relevant vectors for further analysis via the main station system.
Nevertheless, the success rate of guessing the upstream device can still be improved through the simple analysis of some data features. An important feature is the number of records in the FSR vector. Theoretically, the data received by the upstream topological devices in tree-shaped LVDNs are likely to be more than those received by the downstream devices, so supplementing the data to the vector with more records has a good chance of matching reality. According to the description above, the formula for the horizontal completion algorithm is as follows:
where Xt″ is the FSR vector after horizontal completion, Xt′ is the characteristic signal vector of Xt after vertical completion, and Xi′ is the FSR vector of other devices after the vertical completion of Xi. The function fH is a merging function, which is expressed as follows:
where the merging function compares the FSR vectors of all other devices with its own vector. The two vectors are merged only if they intersect but are not identical, and the record count of the function’s own vector is greater than that of the other vector, forming a new vector for the device itself. In this formula, the merging function evaluates the FSR vector against those of other devices. A new vector is formed for the device only when there is an intersection—yet no identity—between vectors, and when the record count of the device’s vector surpasses that of the others.
3.6. Inclusion Detection Process
After completing both vertical and horizontal data completion, the next step is to analyze the topological hierarchy. According to the inclusiveness of FSRs, there is a direct relationship between the topology among TIDs and the inclusion of FSR vectors. By analyzing the inclusion relationships among the vectors, the topological structure can be organized systematically.
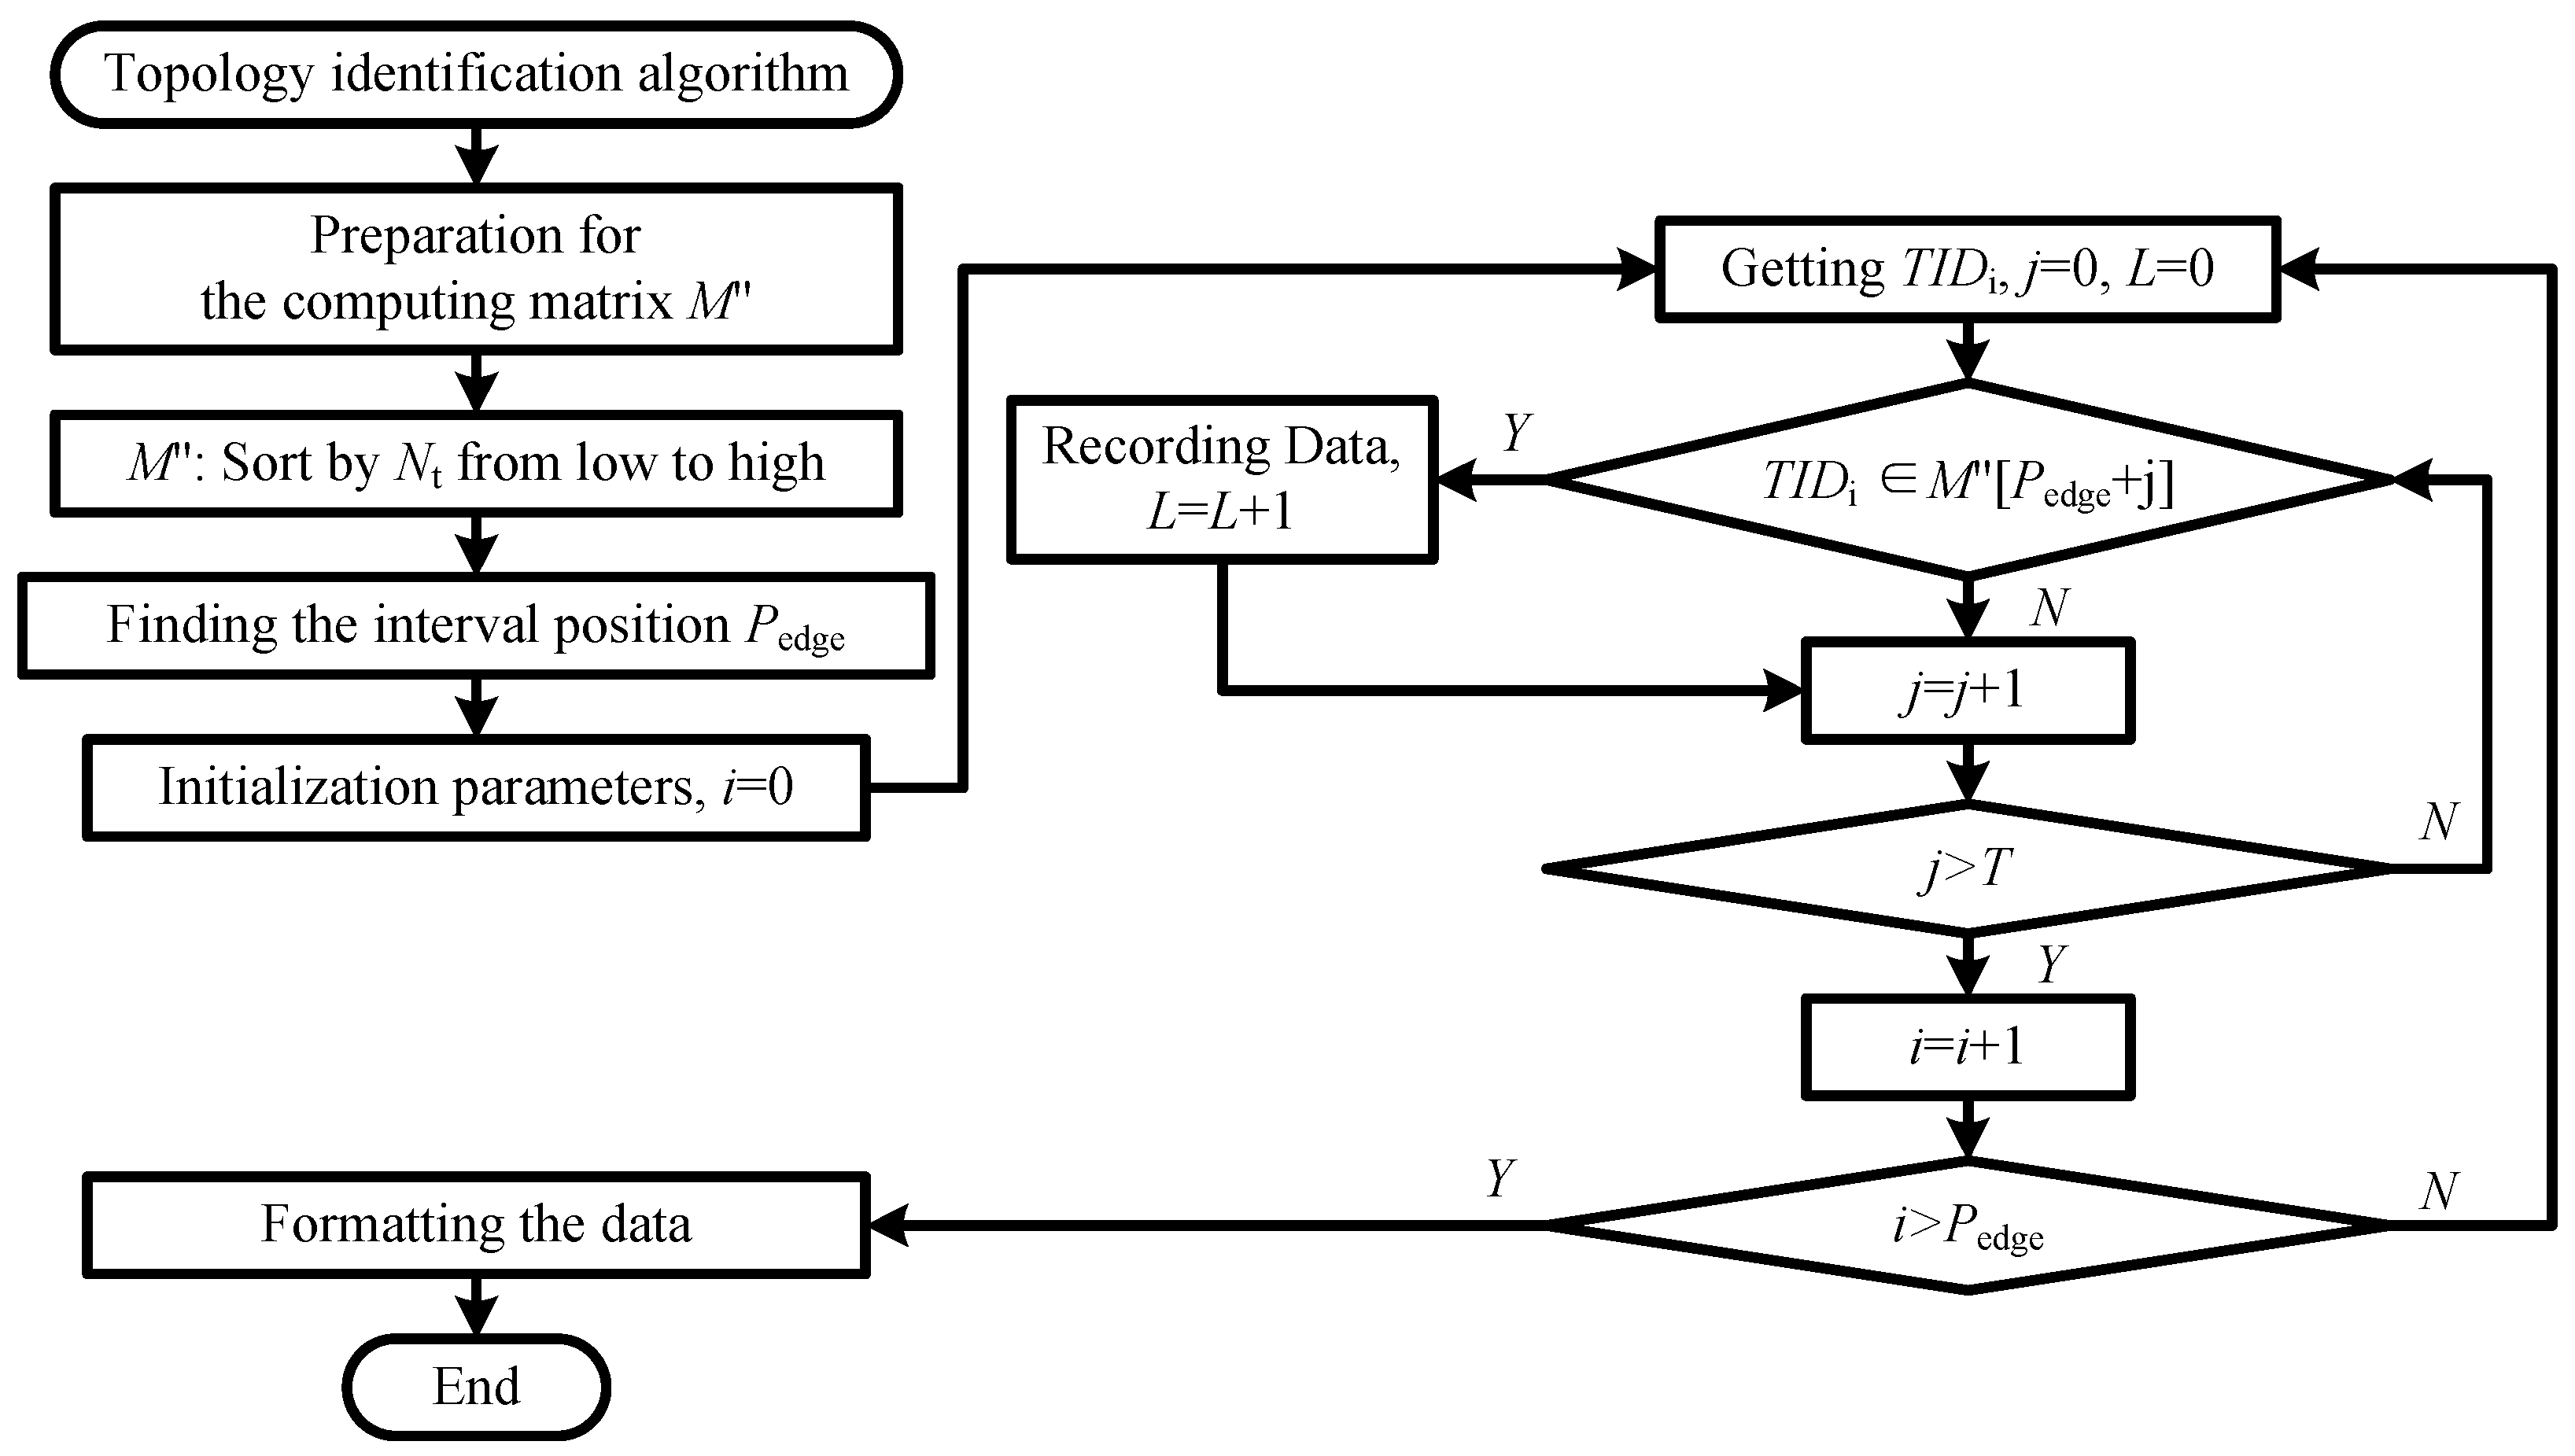
During the process of topology identification, TIDs are divided into two categories: edge nodes and channel nodes. Edge nodes are those at the end of the topology; during signal injection and reception, they can only detect their own feature signal; hence, the length of their FSR vector is always 1. Channel nodes are all nodes other than edge nodes; since they receive feature signals from more than one other node, the length of their FSR vector is greater than 1. To implement the topology identification algorithm, it is necessary to perform inclusion detection—that is, to ascertain which channel nodes contain the edge nodes within their vectors and, subsequently, to arrange these vectors in descending order so as to obtain topological branches. After the inclusion detection, by further integrating the topological branches, the final topological structure can be determined. The process of the topology identification algorithm is shown in Figure 5.
Firstly, the algorithm distinguishes between edge nodes and channel nodes to create matrix M″ using all of the completed FSR vectors {X1″, …, XT″} and then sorts them by the element number of each FSR vector in ascending order. Since edge nodes have only one record, the boundary between edge nodes and channel nodes can be found by searching for the last vector with a record count of one and marking that position as Pedge.
Next, the algorithm advances to the primary process of inclusion detection for edge nodes. The steps are as follows:
- Initialize parameters related to inclusion detection, setting both the loop count i and the hierarchical parameter L to 0.
- Extract the device identifier (TIDi) of the i-th edge node matrix from M″.
- Check whether this device identifier is included in the vector of the channel nodes.
- If the channel node vector contains TIDi, this indicates that the node is an upstream node of TIDi. Record the position of this channel node vector and the hierarchical parameter in the topology matrix MTOPO, and then increase the hierarchical parameter L by 1.
- If the channel node vector does not contain TIDi, continue searching in the next vector until all channel node vectors have been checked.
In this way, the various topological branches are identified. The topological structure data of LVDNs can be obtained through the subsequent data processing of the topology matrix MTOPO. The pseudocode for the inclusion detection process has been placed in Appendix A, where more details can be obtained.
4. Experimental Analysis
4.1. Application of the Topology Identification Algorithm in Practice
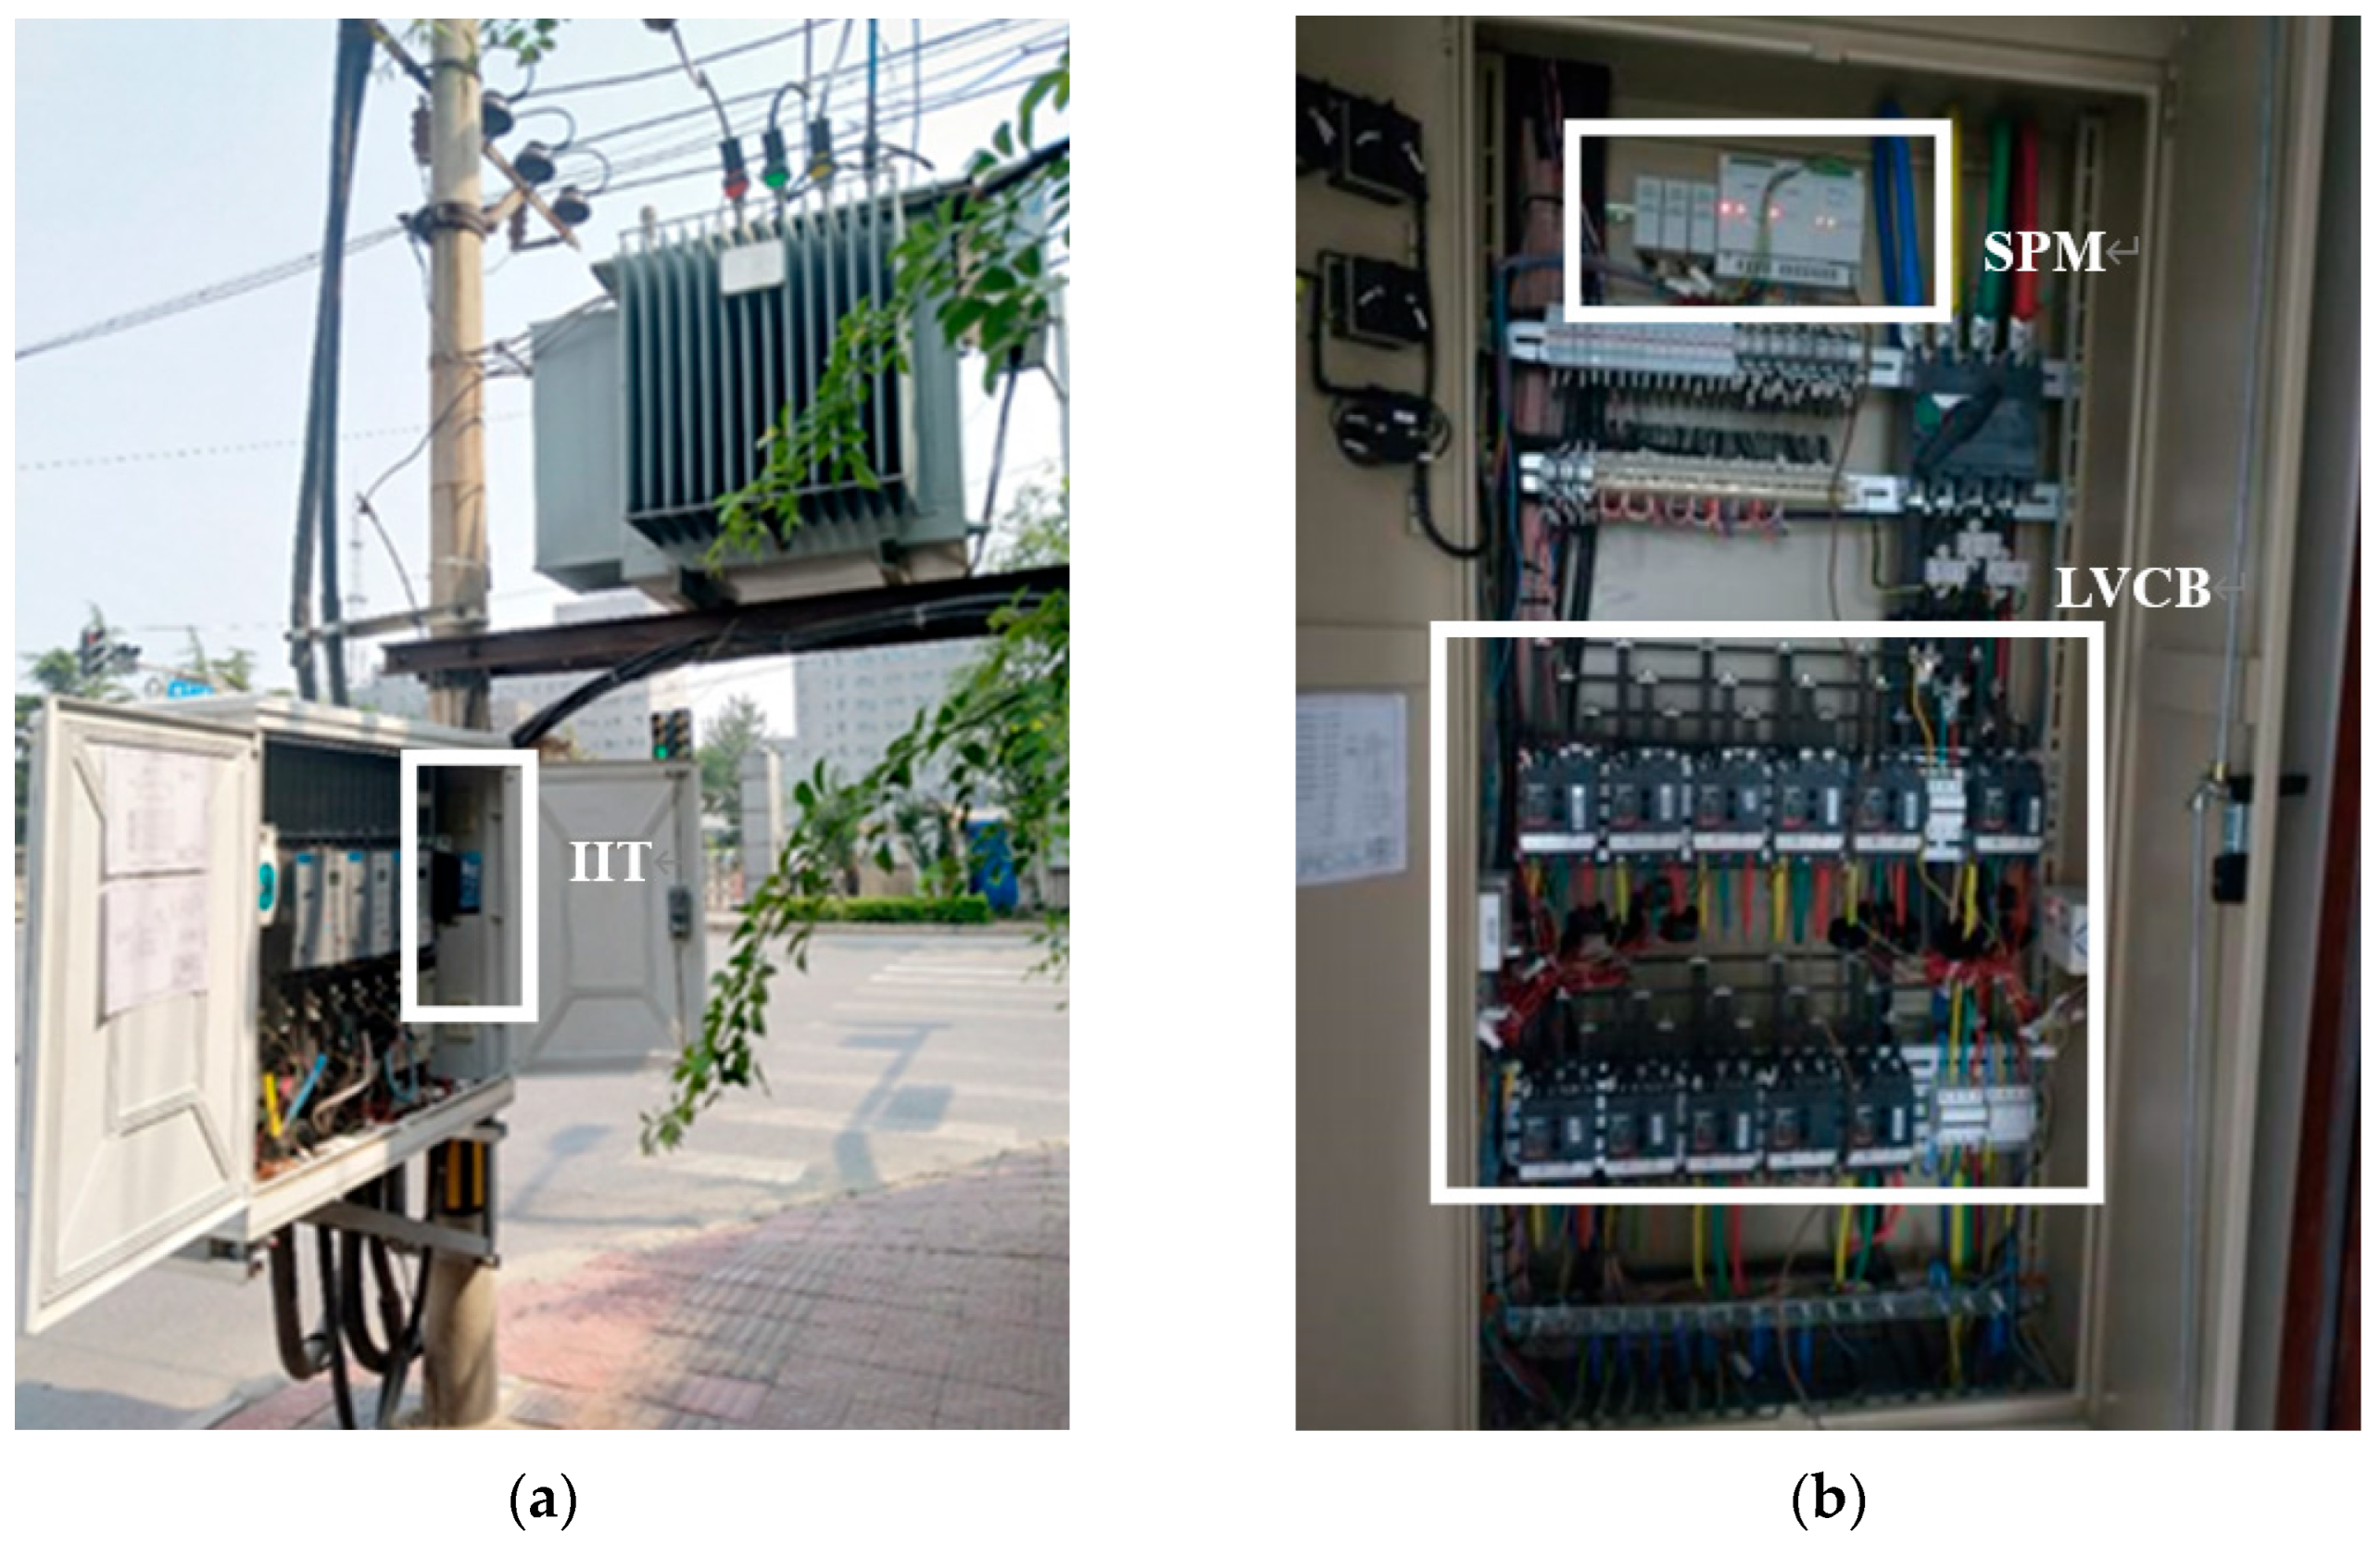
The signal injection-based topology identification algorithm proposed in this paper for LVDNs, which accounts for data loss, has been applied in actual LVDNs in Northern China. An IIT was installed on the transformer’s low-voltage side, and the topology identification algorithm runs on this terminal, as shown in Figure 6a. In the branch boxes connected to the supply line, LVCB and SPM are installed, which can communicate with the IIT via power line communication to complete topology identification operations, as shown in Figure 6b. As TID devices, each LVCB and SPM has a four-digit ID number, which is unique within that low-voltage distribution network. In this project, the topology feature signal is injected and detected by encoding current. The TID converts its own ID number into current sequences with varying amplitudes, injects them into the power line through the circuit, and at the same time, the device at the detection end identifies and receives these current sequences within a specified time, parses the corresponding ID number, and puts it into its own FSR. When all TIDs have completed the signature signal transmission, IIT collects the FSRs of all devices and performs topology recognition calculations. Since all communication and computation are performed automatically on edge devices, the time to complete a topology identification can be shortened to 1 min. Compared with the topology identification algorithm based on data analysis, signal injection-based topology identification has great advantages in terms of real-time performance.
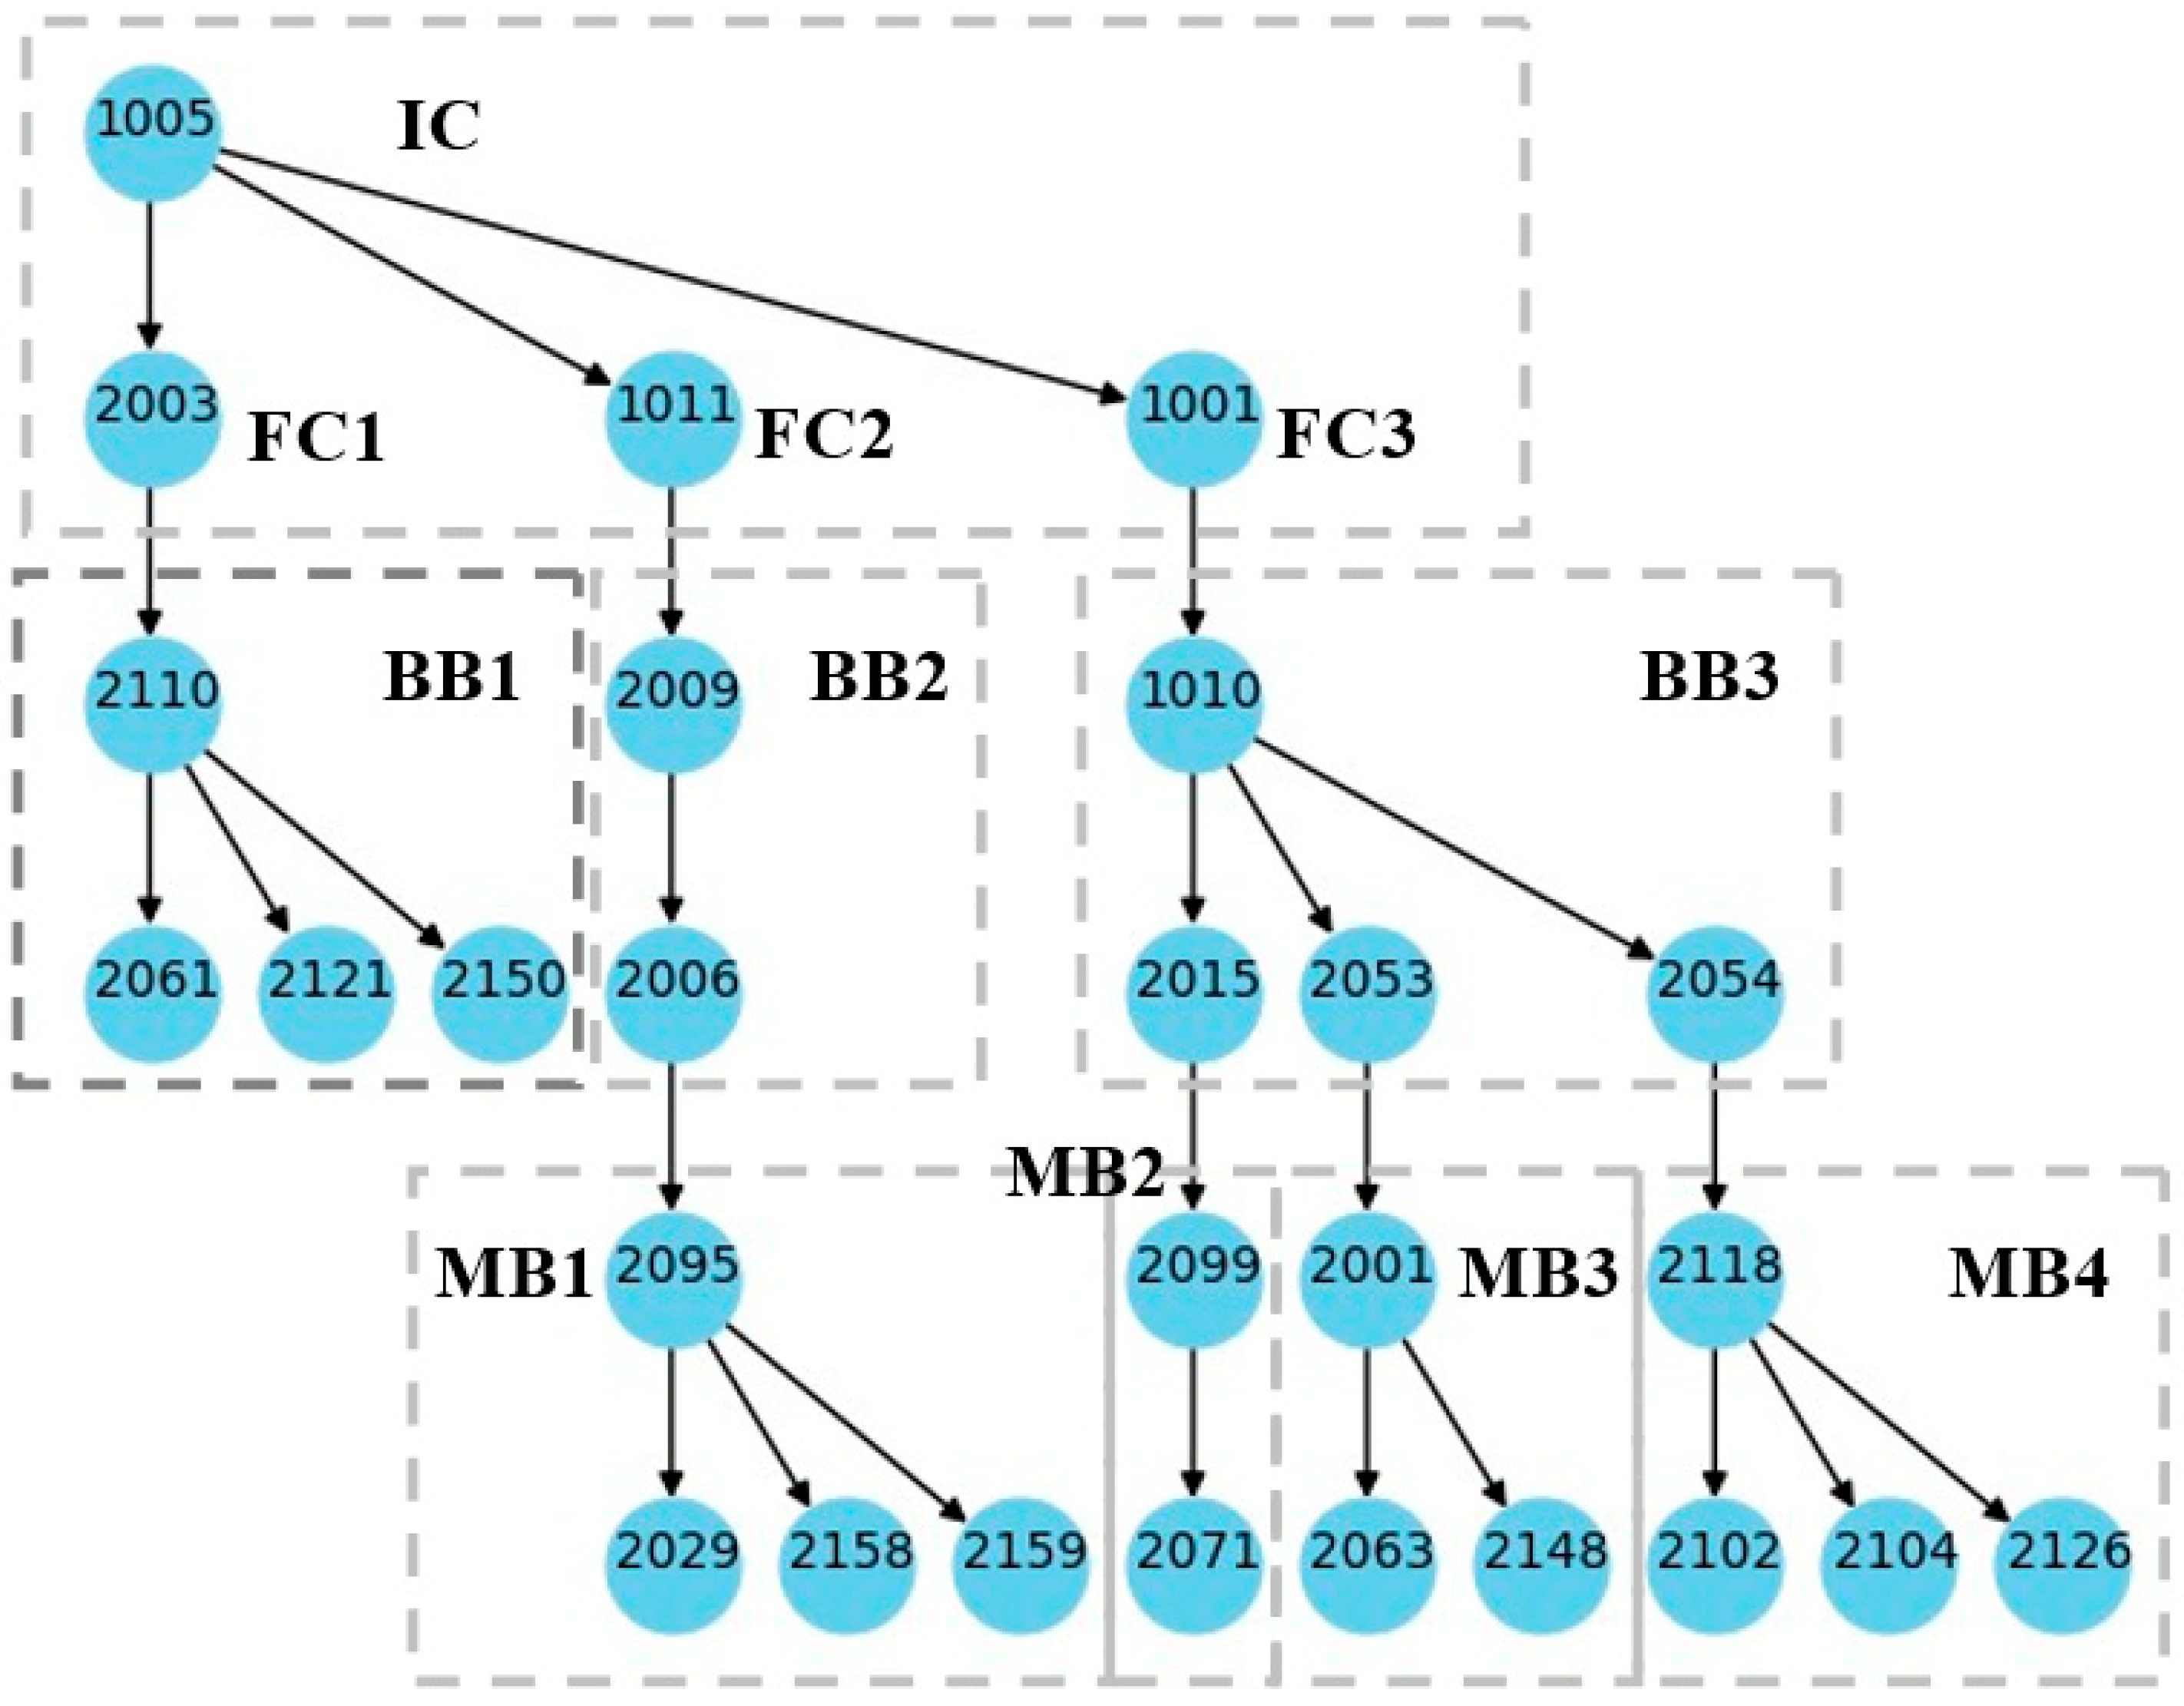
The algorithm’s application scenario consists of one low-voltage incoming cabinet, three outgoing cabinets, three branch boxes, and four meter boxes. The low-voltage incoming cabinet (IC) is connected to the low-voltage side of the transformer and has an SPM installed to monitor the transformer’s operation data (1005). The three feeder cabinets (FCs) connected to the incoming cabinet are equipped with smart circuit breakers (2003, 1011, and 1001) to monitor and control each feeder line. Downstream, each of the three feeder lines is connected to a branch box (BB) equipped with smart circuit breakers, which are BB1 (2110, 2061, 2121, 2150), BB2 (2009, 2006), and BB3 (1010, 2015, 2053, 2054). As the second-layer link, the branch boxes are connected to meter boxes (MBs), with BB2 connected to MB1 (2095, 2029, 2158, 2159), and BB3 connected to MB2 (2099, 2071), MB3 (2001, 2063, 2148), and MB4 (2118, 2102, 2104, 2126). The topology structure of LVDNs is shown in Figure 7.
4.2. Data Analysis
After all devices were installed, the process of signal injection-based topology identification was initiated. Following the steps of feature signal emission, reception, and data collection, the FSR vector was received by the IIT. The data are shown in Table 2.
By analyzing the data, it can be seen that nine devices did not receive any feature signals, and the number of feature signals received by other devices was relatively low compared to theoretical expectations. Such situations are quite common in the process of topology identification field testing. The results of topology identification without data completion are shown in Figure 8. It can be seen that for nine devices with empty FSRs, their locations cannot be identified, and for devices 1011, 1001, and 2015, due to missing records, their hierarchical relationships are also incorrect. In this scenario, the traditional topology identification algorithm yields poor results in terms of completeness and correctness, and such outcomes cannot meet LVDNs’ requirements.
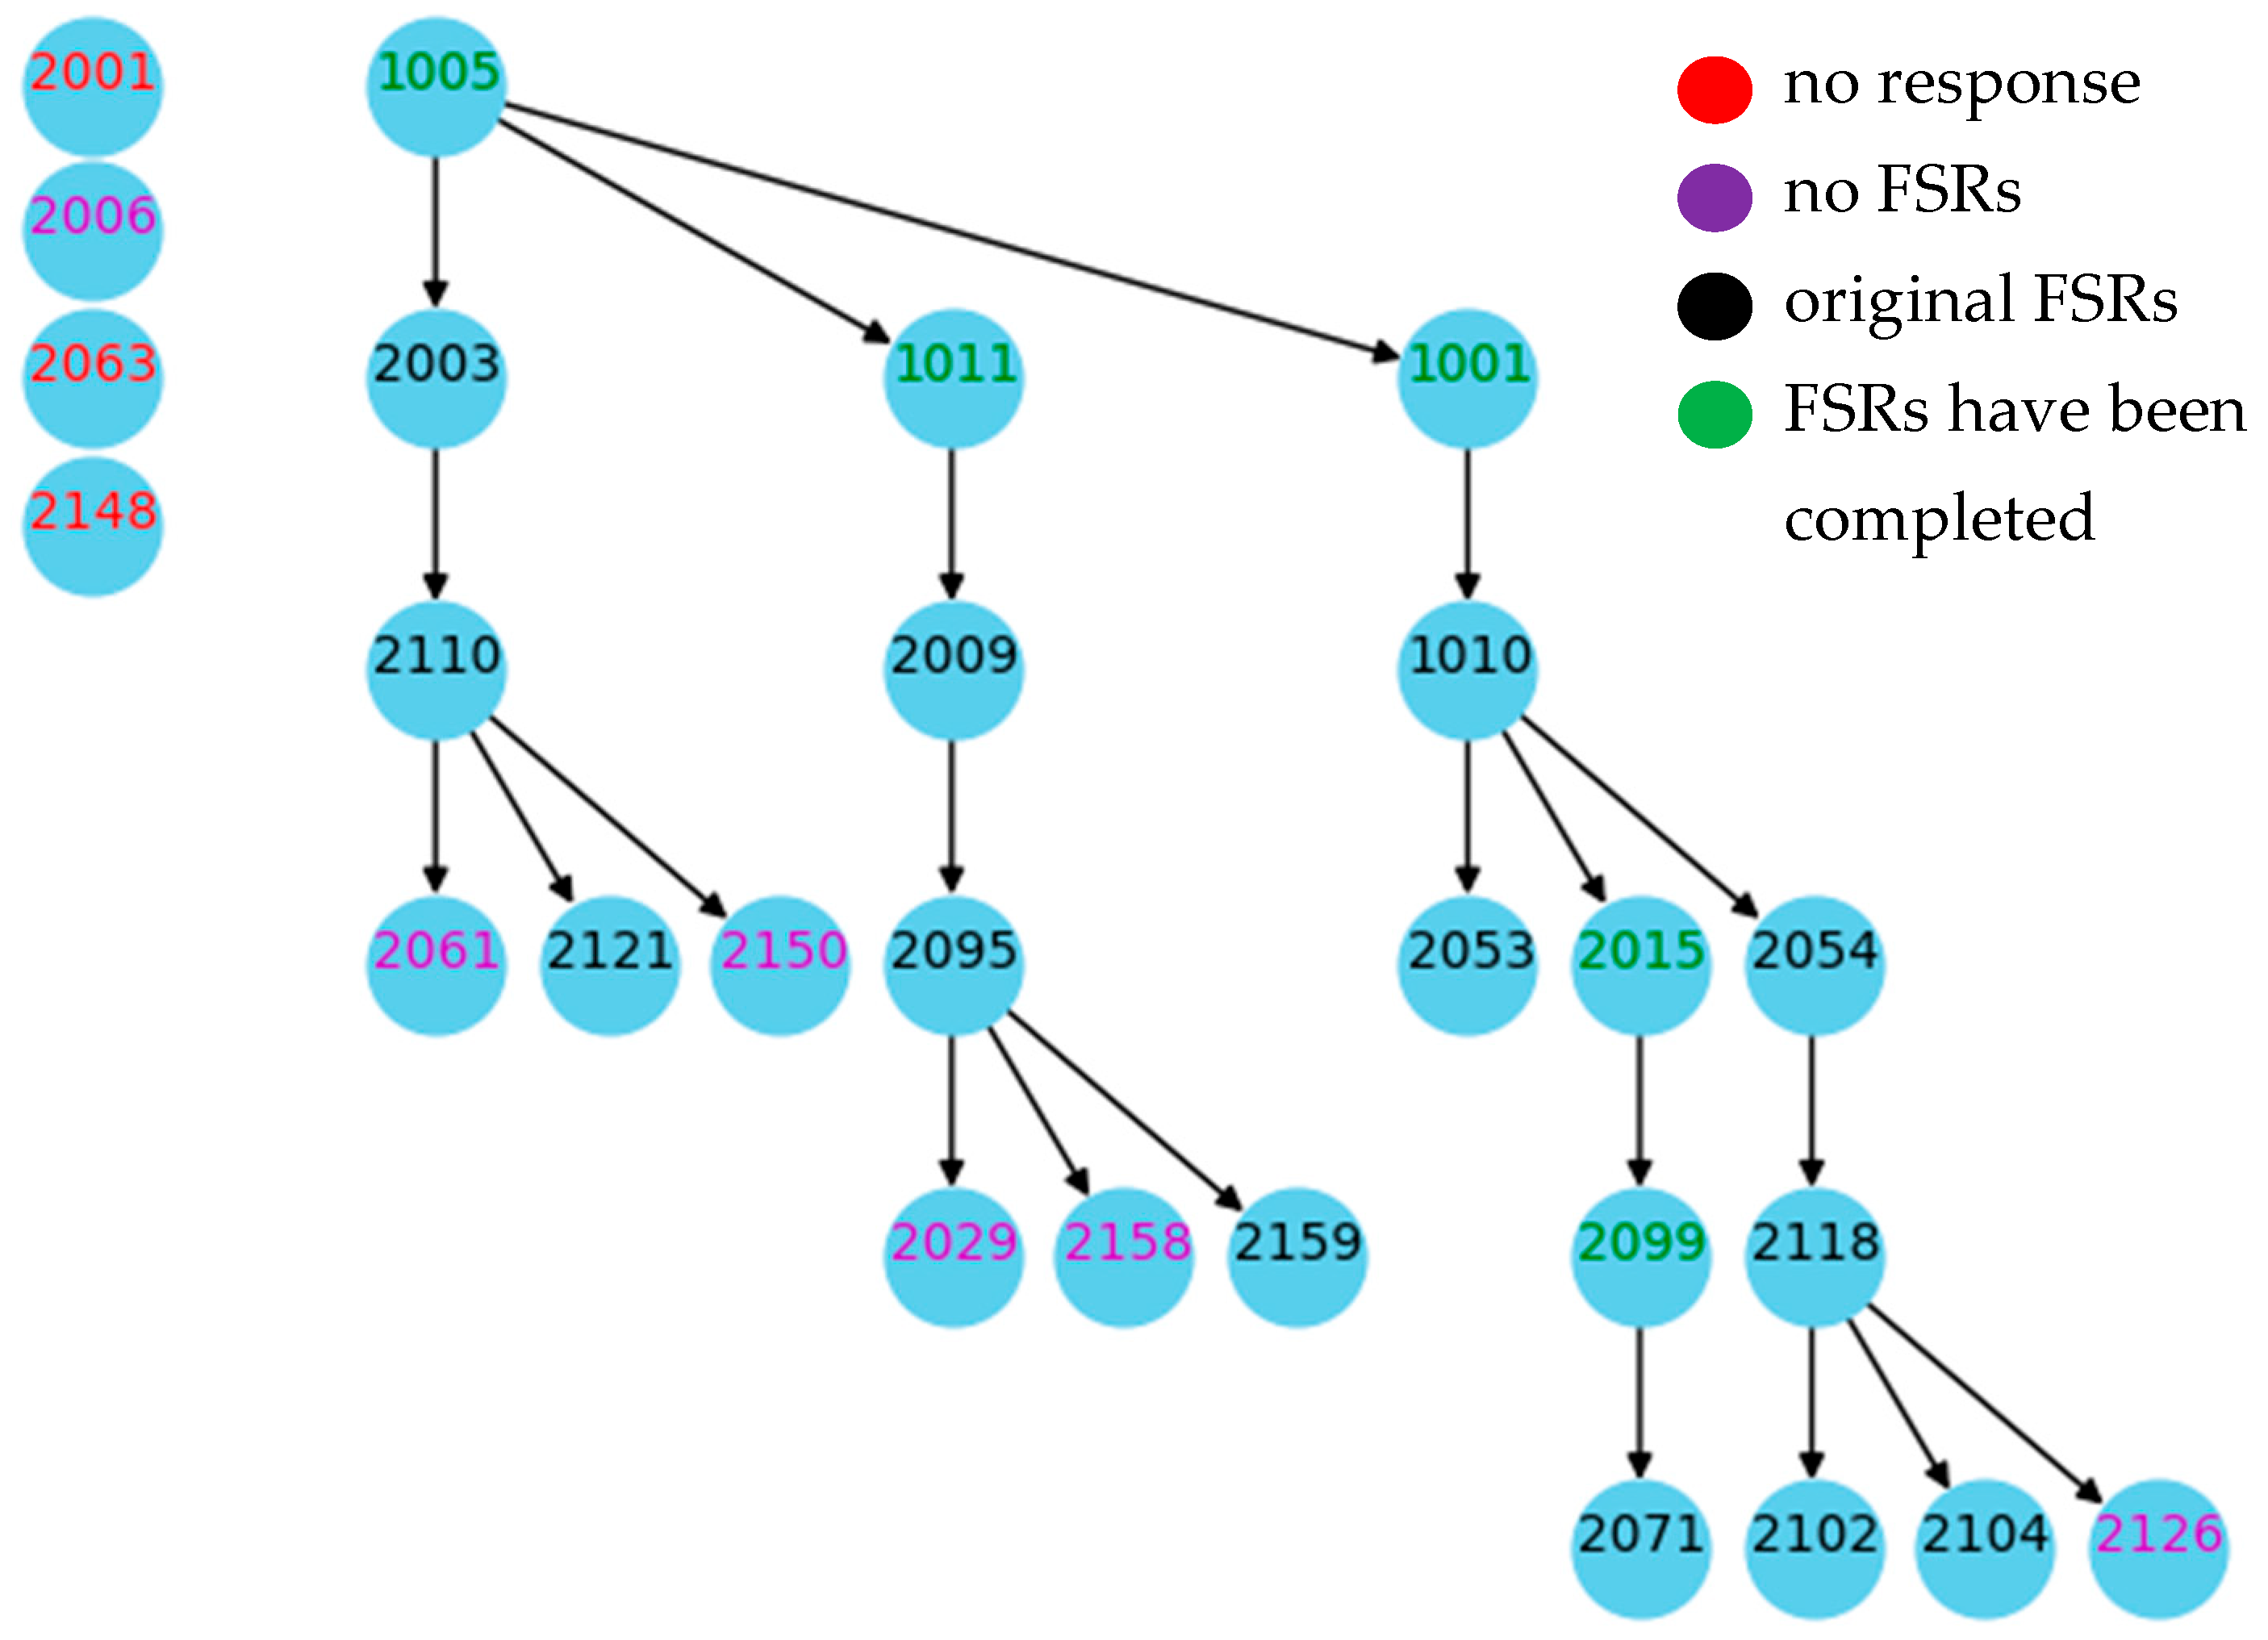
Compared with traditional algorithms, the topology identification algorithm proposed in this paper leads to better outcomes. The results are shown in Figure 9.
In Figure 9, TIDs are divided into four categories by color: red TIDs indicate no response in communication; purple TIDs are those without any FSRs; black TIDs have original FSRs that have not been completed; and green TIDs are those whose FSRs have been completed. Analyzing the topology identification results, it can be seen that the new algorithm has brought about two changes to the identification results: Firstly, channel nodes whose positions could not be previously determined can now find their correct positions through data completion. For example, by completing the data for nodes 1005, 1011, and 1001, the topological positions of all nodes in the outgoing and feeder cabinets can be correctly identified; in the topology identification of BB3 and MB2, by completing the data for nodes 2015 and 2099, their positions can also be correctly identified. Secondly, edge nodes can be correctly discovered through data completion. For instance, in BB1, MB1, and MB4, although some nodes did not receive feature signals, they could be determined to be edge nodes through completion; thus, their positions could also be correctly identified.
There are two particularly notable points in these topology identification results. The first is in BB2, where TID 2006 did not receive any feature signals, and other devices also did not receive any feature signals emitted by it, so it was ultimately treated as an unidentified node. Although the topology identification for this node was unsuccessful due to insufficient data, the phenomenon itself indicates a high probability of signal injection and detection of hardware faults in the device. Upon actual onsite inspection, it was found that the SPM device of this place was not connected to the line, so neither injection nor reception could be achieved, consistent with the results of topology identification. The second point is that the IIT was unable to establish communication with TIDs 2001, 2063, and 2148, resulting in the inability to determine the topological positions of these three devices. After an actual line inspection, it was discovered that the line where these three TIDs were located had a power outage. Consequently, communication between the devices was not possible. This observation is consistent with the identification findings.
In summary, even with a significant amount of missing data in the FSR vector, the topology identification algorithm proposed in this paper can accurately determine the actual topology structure of LVDNs through data completion, and the analysis based on actual measurement data has demonstrated its effectiveness. Further analysis of the identification results can also provide the state of abnormal devices, which is not available in other topology recognition algorithms. All these analyses show that the algorithm proposed in this paper can enhance the applicability of the signal injection-based topology identification method and has broad prospects for application in LVDNs.
5. Conclusions
This study introduced a novel signal injection-based topology identification algorithm tailored for LVDNs. The proposed algorithm can effectively complete missing feature signal data, which is crucial for maintaining the completeness and correctness of topology identification. Through the innovative use of vertical and horizontal completion techniques, coupled with inclusion detection, the algorithm ensures the precise mapping of the topological structure. The application of this algorithm to real-world distribution network data has demonstrated its capability, not only by way of enhancing the completeness and correctness of topology identification but also by offering insights into the state of abnormal devices.
The algorithm detailed in this study advances the signal injection-based topology identification method, broadening its potential for integration into LVDNs. This robust solution is tailored to seamlessly align with the dynamic and ever-evolving topological structures of LVDNs.
Author Contributions
Conceptualization, Y.D., Z.L., Y.L. (Yuanyuan Liu) and Y.L. (Yong Li); methodology, Y.D.; software, Y.D. and Y.L. (Yuanyuan Liu); validation, Y.D., Z.L. and Y.L. (Yuanyuan Liu); formal analysis, Y.D. and Z.L.; investigation, Y.D.; resources, Y.D.; data curation, Y.L. (Yuanyuan Liu); writing—original draft preparation, Y.D.; writing—review and editing, Y.L. (Yong Li); visualization, Y.L. (Yuanyuan Liu); supervision, Z.L.; project administration, Y.D.; funding acquisition, Y.D. All authors have read and agreed to the published version of the manuscript.
Funding
This work was supported by the Scientific Research Fund of Hunan Provincial Education Department, China, under Grant 21B0867.
Data Availability Statement
The original contributions presented in the study are included in the article, further inquiries can be directed to the corresponding author.
Conflicts of Interest
The authors declare no conflicts of interest.
Appendix A
This pseudocode describes the inclusion detection process in detail.
| Algorithm A1: Inclusion Detection Process |
| Input: The matrix of all FSRs after data completion M″. Output: Device information matrix MDI, topological matrix MTOPO.
|
References
- Qi, C.; Liu, Y.; Xu, D.; Yang, X.; Bi, C.; Hu, B. Overview of Topology Identification for Low-Voltage Distribution Network. In Proceedings of the 2023 8th Asia Conference on Power and Electrical Engineering (ACPEE), Tianjin, China, 14–16 April 2023; pp. 2486–2490. [Google Scholar]
- Sun, L.; Chen, Y.; Du, Q.; Ding, R.; Liu, Z.; Cheng, Q. Topology Identification of Low-Voltage Power Lines Based on IEC 61850 and the Clustering Method. Energies 2023, 16, 1126. [Google Scholar] [CrossRef]
- Ni, Q.; Jiang, H. Topology Identification of Low-Voltage Distribution Network Based on Deep Convolutional Time-Series Clustering. Energies 2023, 16, 4274. [Google Scholar] [CrossRef]
- Wang, C.; An, J.; Mu, G. Power System Network Topology Identification Based on Knowledge Graph and Graph Neural Network. Front. Energy Res. 2021, 8, 613331. [Google Scholar] [CrossRef]
- Pappu, S.J.; Bhatt, N.; Pasumarthy, R.; Rajeswaran, A. Identifying Topology of Low Voltage Distribution Networks Based on Smart Meter Data. IEEE Trans. Smart Grid 2018, 9, 5113–5122. [Google Scholar] [CrossRef]
- Cunha, V.C.; Freitas, W.; Trindade, F.C.L.; Santoso, S. Automated Determination of Topology and Line Parameters in Low Voltage Systems Using Smart Meters Measurements. IEEE Trans. Smart Grid 2020, 11, 5028–5038. [Google Scholar] [CrossRef]
- Hu, Y.; Cao, Q.; Wang, L.; Huang, T.; Hu, Z.; Fan, Z. Low Voltage Transformer Topology Identification Method Based on De-Noised Differential Evolution. In Proceedings of the 2020 10th International Conference on Power and Energy Systems (ICPES), Chengdu, China, 25 December 2020; pp. 356–360. [Google Scholar]
- Tong, L.; Chai, W.; Wu, D. Topology and Impedance Identification Method of Low-Voltage Distribution Network Based on Smart Meter Measurements. Front. Energy Res. 2022, 10, 895397. [Google Scholar] [CrossRef]
- Zhou, L.; Ma, J.; Huang, H.; Xia, T.; Ma, X. Automatic Identification Method of Topology Structure of Low-Voltage Distribution Station Area Based on Multi-Point Measurement Data. J. Phys. Conf. Ser. 2022, 2355, 012015. [Google Scholar] [CrossRef]
- Abubakar, M.; Che, Y.; Faheem, M.; Bhutta, M.S.; Mudasar, A.Q. Intelligent Modeling and Optimization of Solar Plant Production Integration in the Smart Grid Using Machine Learning Models. Adv. Energy Sustain. Res. 2024, 5, 2300160. [Google Scholar] [CrossRef]
- Liao, Z.; Liu, Y.; Wang, B.; Tao, W. Topology Identification of Active Low-Voltage Distribution Network Based on Regression Analysis and Knowledge Reasoning. Energies 2024, 17, 1762. [Google Scholar] [CrossRef]
- Wang, C.; Lou, Z.; Li, M.; Zhu, Z.; Jing, D. Identification of Distribution Network Topology and Line Parameter Based on Smart Meter Measurements. Energies 2024, 17, 830. [Google Scholar] [CrossRef]
- Yang, Z.; Han, J.; Wang, Q.; Zhang, K.; Deng, Y.; Yang, F.; Lei, Y.; Hu, W.; Min, H. Edge–Cloud Collaboration-Based Plug and Play and Topology Identification for Microgrids: The Case of Jingshan Microgrid Project in Hubei, China. Electronics 2023, 12, 3699. [Google Scholar] [CrossRef]
- Sendin, A.; Berganza, I.; Arzuaga, A.; Osorio, X.; Urrutia, I.; Angueira, P. Enhanced Operation of Electricity Distribution Grids Through Smart Metering PLC Network Monitoring, Analysis and Grid Conditioning. Energies 2013, 6, 539–556. [Google Scholar] [CrossRef]
- Xu, C.; Lei, Y.; Zou, Y. A Method of Low Voltage Topology Identification. In Proceedings of the 2020 IEEE Conference on Telecommunications, Optics and Computer Science (TOCS), Shenyang, China, 11 December 2020; pp. 318–323. [Google Scholar]
- Lu, H.; Cai, Y.; Liu, M.; Ying, J.; Feng, S. Topology Identification and Check Method for Low-voltage Distribution Areas. Electr. Autom. 2020, 42, 95–98. [Google Scholar]
- Xian, H.; Li, J.; Song, W.; Zhao, C.; Liu, H.; Mao, H.; Wang, Q. A Topology Identification Monitoring Terminal Based on the Pulse Current Characteristic Analysis. J. Phys. Conf. Ser. 2021, 1972, 012013. [Google Scholar] [CrossRef]
- Xiong, D.; Du, J. Research on Topology Recognition Technology Based on Intelligent Measurement Switches. Electronics 2022, 11, 3903. [Google Scholar] [CrossRef]
- Wang, R.; Wu, Y.; Wei, H.; Wang, C. Topology Identification Method for a Distribution Network Area based on the Characteristic Signal of a Smart Terminal Unit. Power Syst. Prot. Control 2021, 49, 83–89. [Google Scholar] [CrossRef]
- Zhang, X.; Yang, X.; Liu, Z.; Zhang, Z. Research on Low Voltage Topology Recognition Based on Relevance of Feature Information. In Proceedings of the 2021 6th International Conference on Power and Renewable Energy (ICPRE), Shanghai, China, 17 September 2021; pp. 749–754. [Google Scholar]
- Faheem, M.; Kuusniemi, H.; Eltahawy, B.; Bhutta, M.S.; Raza, B. A Lightweight Smart Contracts Framework for Blockchain-based Secure Communication in Smart Grid Applications. IET Gener. Trans. Dist. 2024, 18, 625–638. [Google Scholar] [CrossRef]
Figure 1.
The installation and data processing of each device in LVDNs.

Figure 2.
The topology identification process for LVDNs via signal injection.

Figure 3.
Completing the FSR data within a branch consisting of four TIDs.

Figure 4.
The inclusion relationship between two feature signal records: (a) feature signal record A and feature signal record B have no intersection. (b) feature signal record A includes feature signal record B. (c) feature signal record A and feature signal record B have an intersection.
Figure 4.
The inclusion relationship between two feature signal records: (a) feature signal record A and feature signal record B have no intersection. (b) feature signal record A includes feature signal record B. (c) feature signal record A and feature signal record B have an intersection.

Figure 5.
Topology identification algorithm flowchart.

Figure 6.
Application of signal injection-based low-voltage power distribution network topology identification in power distribution networks: (a) IIT onsite installation situation; (b) LVCB and SPM onsite installation situation.
Figure 6.
Application of signal injection-based low-voltage power distribution network topology identification in power distribution networks: (a) IIT onsite installation situation; (b) LVCB and SPM onsite installation situation.

Figure 7.
Topology structure of LVDNs.

Figure 8.
Topology identification results without data completion.

Figure 9.
Topology identification results using data completion.


Table 1.
Definitions of mathematical terms in topology identification algorithm.
| Term | Definition |
|---|---|
| IDt | The device identifier of TIDt. |
| Nt | The total number of feature signals recorded by TIDt. |
| St | The position marker for the TID. |
| Xt | The FSRs of TIDt. |
| Ct | The feature model of TIDt. |
| Xt′ | The output vector after Xt is vertically completed. |
| Xt″ | The output vector after Xt is horizontally completed. |
| M″ | The matrix of all Xt″. |
| MTOPO | The topology matrix of LVDNs. |
Table 2.
Feature signal records vector.
| No. | Device ID | Communication Status | Number of Records | Records |
|---|---|---|---|---|
| 1 | 1001 | Normal | 1 | 1010 |
| 2 | 2001 | Abnormal | 0 | |
| 3 | 2003 | Normal | 5 | 2150, 2121, 2110, 2061, 2003 |
| 4 | 2006 | Normal | 0 | |
| 5 | 1010 | Normal | 10 | 2126, 2118, 2104, 2102, 2099, 2071, 2054, 2053, 2015, 1010 |
| 6 | 2015 | Normal | 2 | 2099, 2071 |
| 7 | 2029 | Normal | 0 | |
| 8 | 2053 | Normal | 1 | 2053 |
| 9 | 2054 | Normal | 5 | 2126, 2118, 2104, 2102, 2054 |
| 10 | 2061 | Normal | 0 | |
| 11 | 2063 | Abnormal | 0 | |
| 12 | 2071 | Normal | 1 | 2071 |
| 13 | 2095 | Normal | 4 | 2159, 2158, 2095, 2029 |
| 14 | 2099 | Normal | 1 | 2071 |
| 15 | 2102 | Normal | 1 | 2102 |
| 16 | 2104 | Normal | 1 | 2104 |
| 17 | 2110 | Normal | 4 | 2150, 2121, 2110, 2061 |
| 18 | 2118 | Normal | 4 | 2126, 2118, 2104, 2102 |
| 19 | 2121 | Normal | 1 | 2121 |
| 20 | 2126 | Normal | 0 | |
| 21 | 2148 | Abnormal | 0 | |
| 22 | 2150 | Normal | 0 | |
| 23 | 2158 | Normal | 0 | |
| 24 | 2159 | Normal | 1 | 2159 |
| 25 | 1011 | Normal | 1 | 2009 |
| 26 | 2009 | Normal | 5 | 2009, 2159, 2158, 2095, 2029 |
| 27 | 1005 | Normal | 12 | 2126, 2118, 2104, 2102, 2099, 2071, 2054, 2053, 2015, 1010, 1011, 2003 |
Disclaimer/Publisher’s Note: The statements, opinions and data contained in all publications are solely those of the individual author(s) and contributor(s) and not of MDPI and/or the editor(s). MDPI and/or the editor(s) disclaim responsibility for any injury to people or property resulting from any ideas, methods, instructions or products referred to in the content. |
© 2024 by the authors. Licensee MDPI, Basel, Switzerland. This article is an open access article distributed under the terms and conditions of the Creative Commons Attribution (CC BY) license (https://creativecommons.org/licenses/by/4.0/).
Share and Cite
MDPI and ACS Style
Duan, Y.; Liu, Z.; Liu, Y.; Li, Y. Signal Injection-Based Topology Identification for Low-Voltage Distribution Networks Considering Missing Data. Energies 2024, 17, 2060. https://0-doi-org.brum.beds.ac.uk/10.3390/en17092060
AMA Style
Duan Y, Liu Z, Liu Y, Li Y. Signal Injection-Based Topology Identification for Low-Voltage Distribution Networks Considering Missing Data. Energies. 2024; 17(9):2060. https://0-doi-org.brum.beds.ac.uk/10.3390/en17092060
Chicago/Turabian StyleDuan, Yilong, Zheng Liu, Yuanyuan Liu, and Yong Li. 2024. "Signal Injection-Based Topology Identification for Low-Voltage Distribution Networks Considering Missing Data" Energies 17, no. 9: 2060. https://0-doi-org.brum.beds.ac.uk/10.3390/en17092060
Note that from the first issue of 2016, this journal uses article numbers instead of page numbers. See further details here.