
Analysis of the Energy, Environmental and Economic Efficiency of Multi-Family Residential Buildings in Poland


Abstract
:1. Introduction
2. Research Methodology
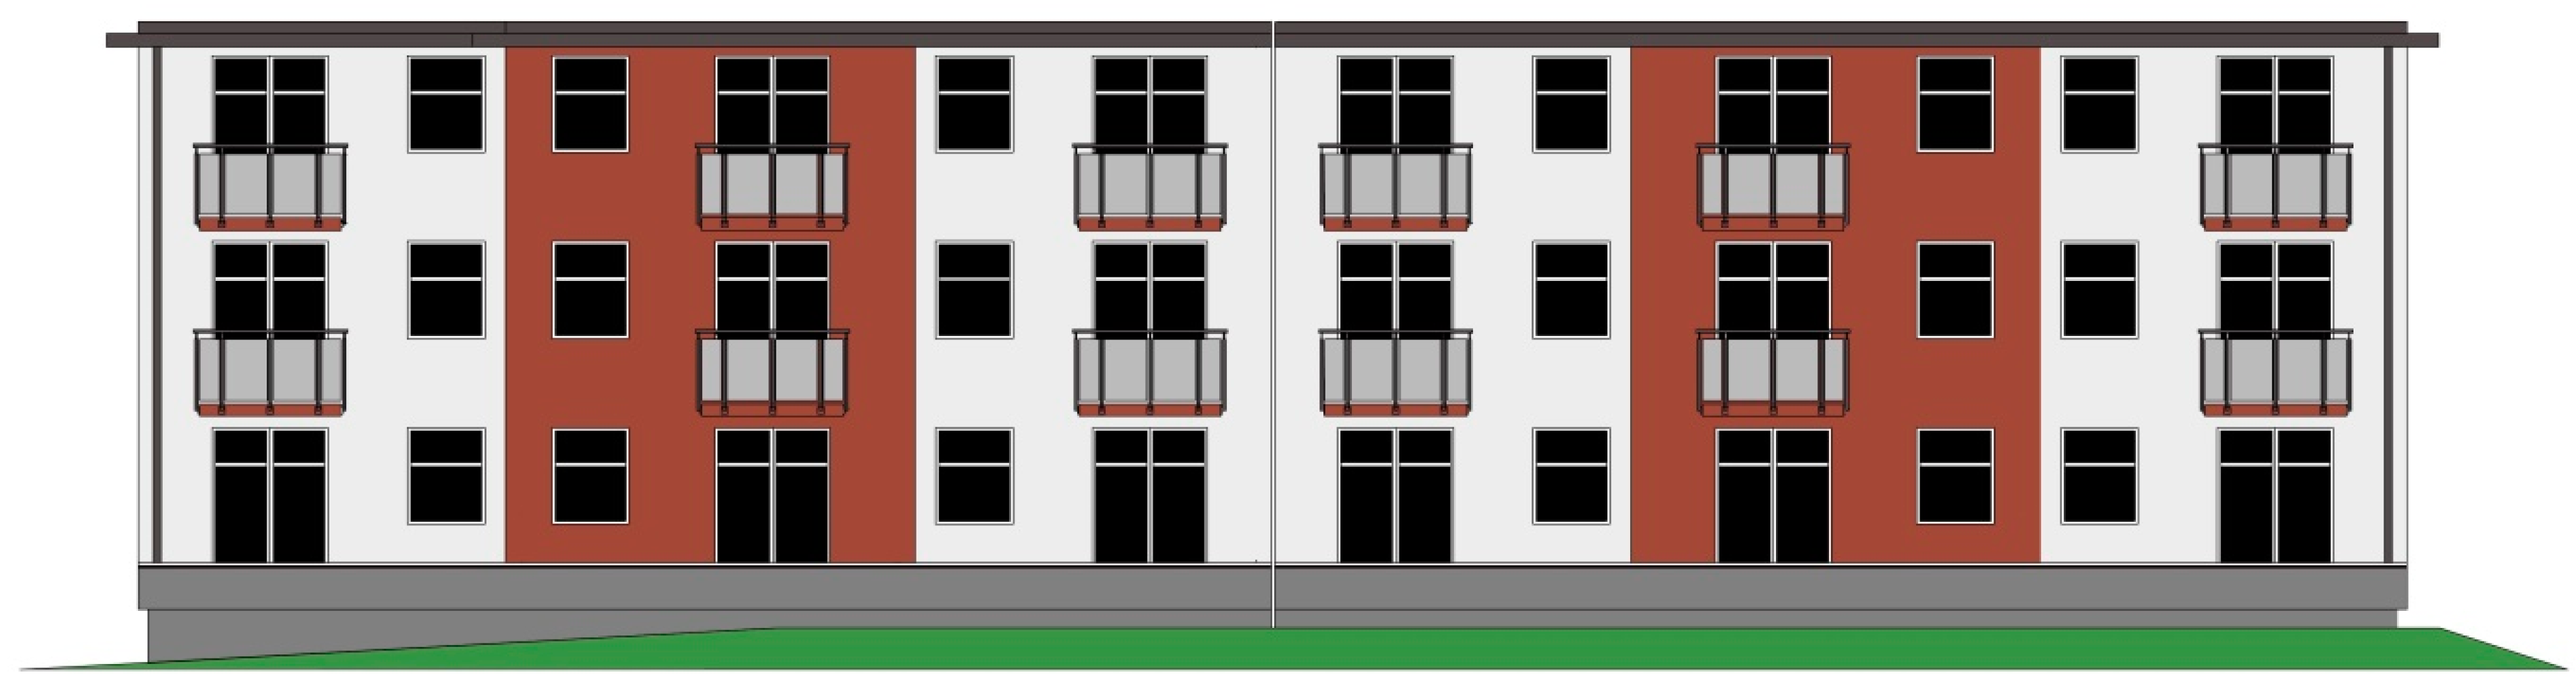
2.1. Description of the Analyzed Multi-Family Residential Building
2.2. Analysis of the Usable Energy Demand for Heating EUH
2.3. Energy Analysis of the Building
- Electric energy from the external grid = 2.5;
- Renewable solar energy (photovoltaic panels) = 0.0.
2.4. Environmental Analysis
- Electric energy from the external grid 0.708 kg/kWh;
- Renewable solar energy (photovoltaic panels) 0.0 kg/kWh.
2.5. Economic Analysis
- I0—investment costs related to the construction of the heat source [EUR];
- QK,m—annual final energy demand for heating, hot water preparation and auxiliary equipment [kWh/year];
- QZ,m—unit price of energy [EUR/kWh];
- i—discount rate;
- n—years of operation.
3. Results and Analysis
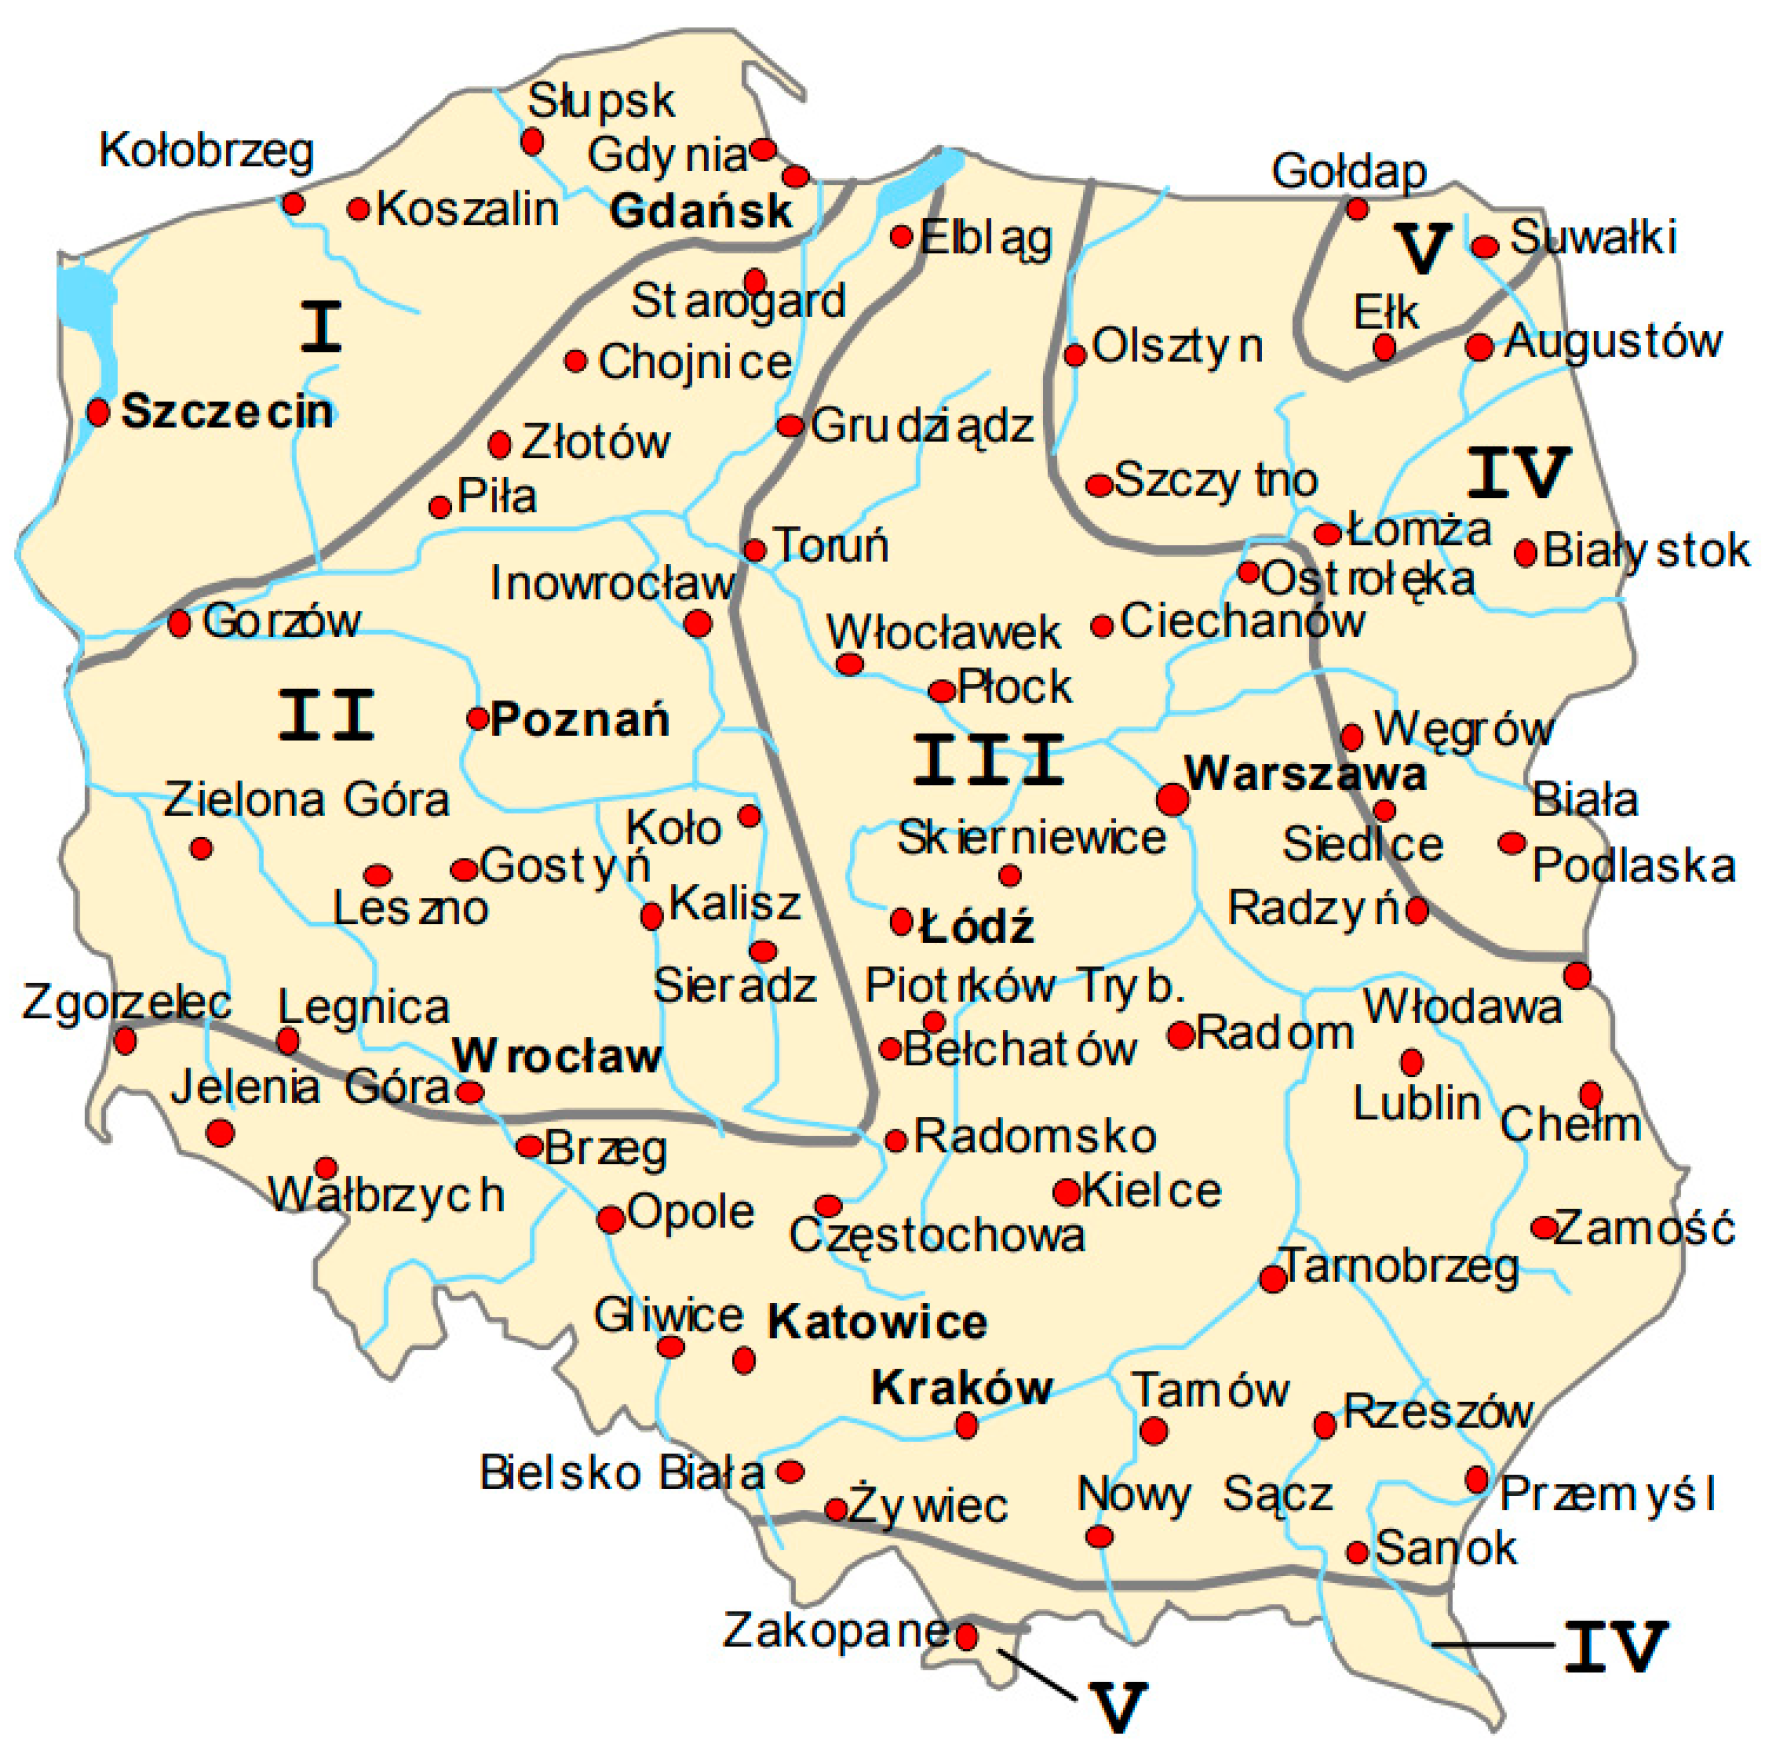
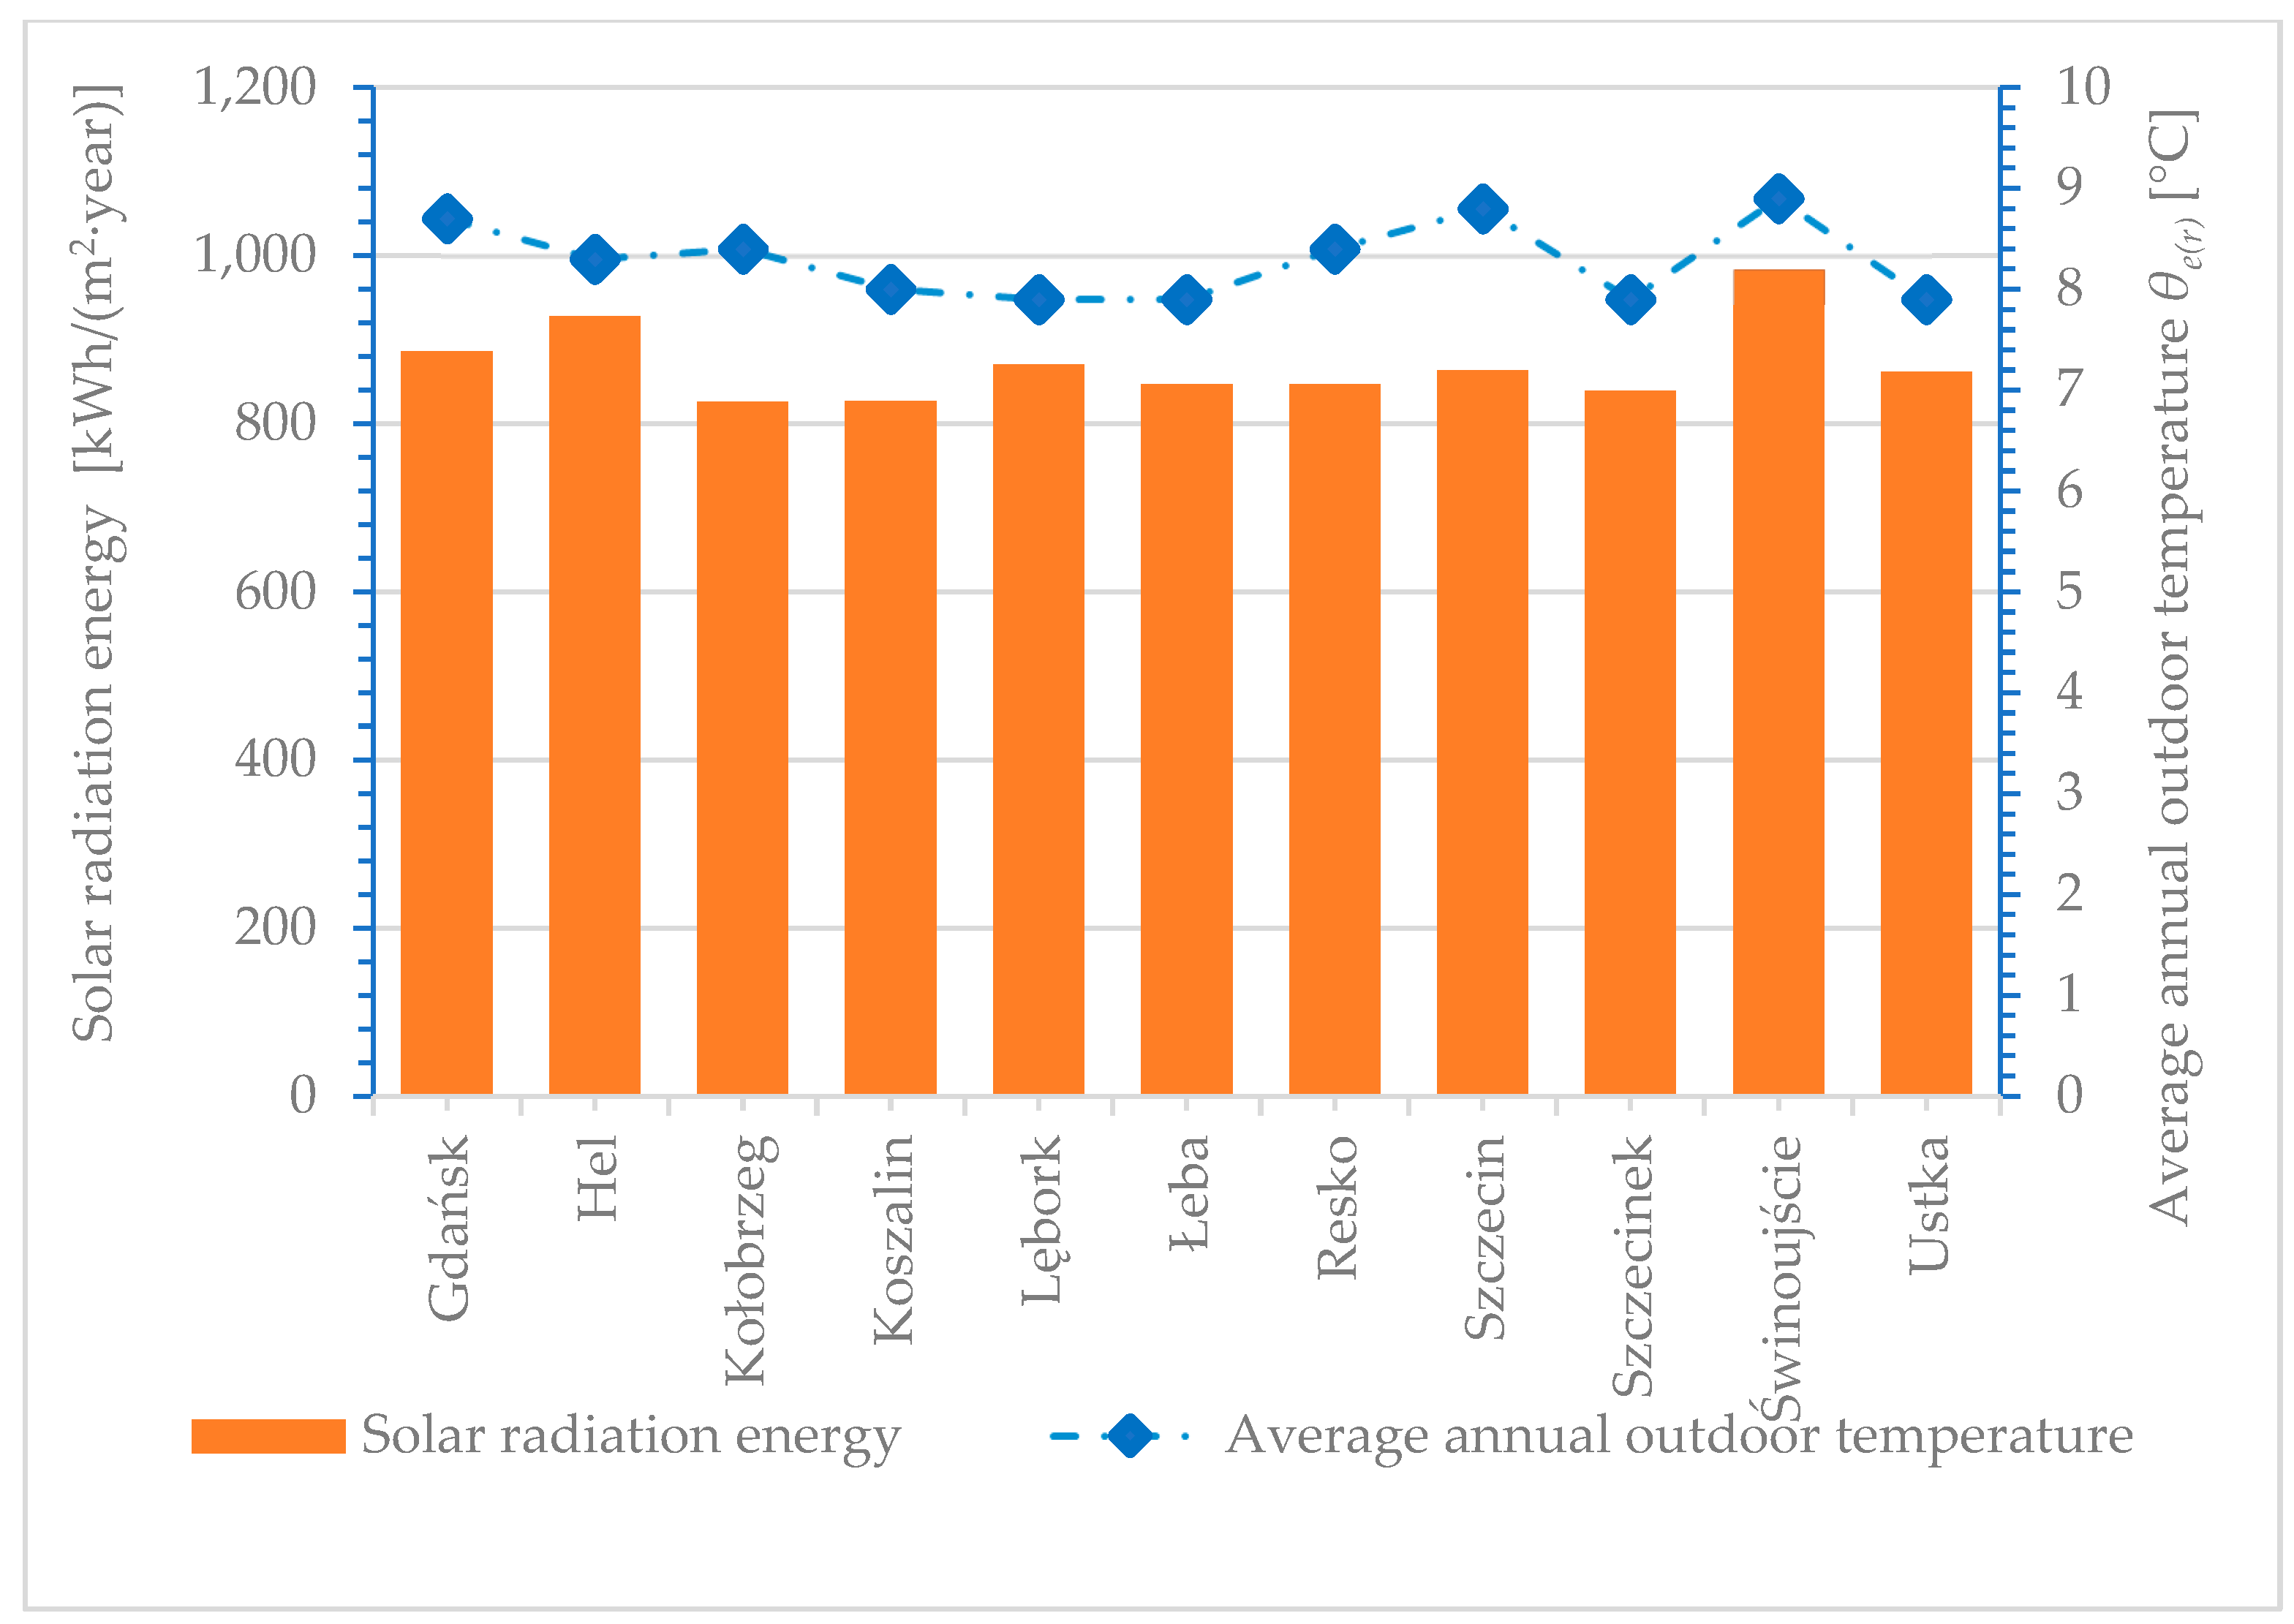
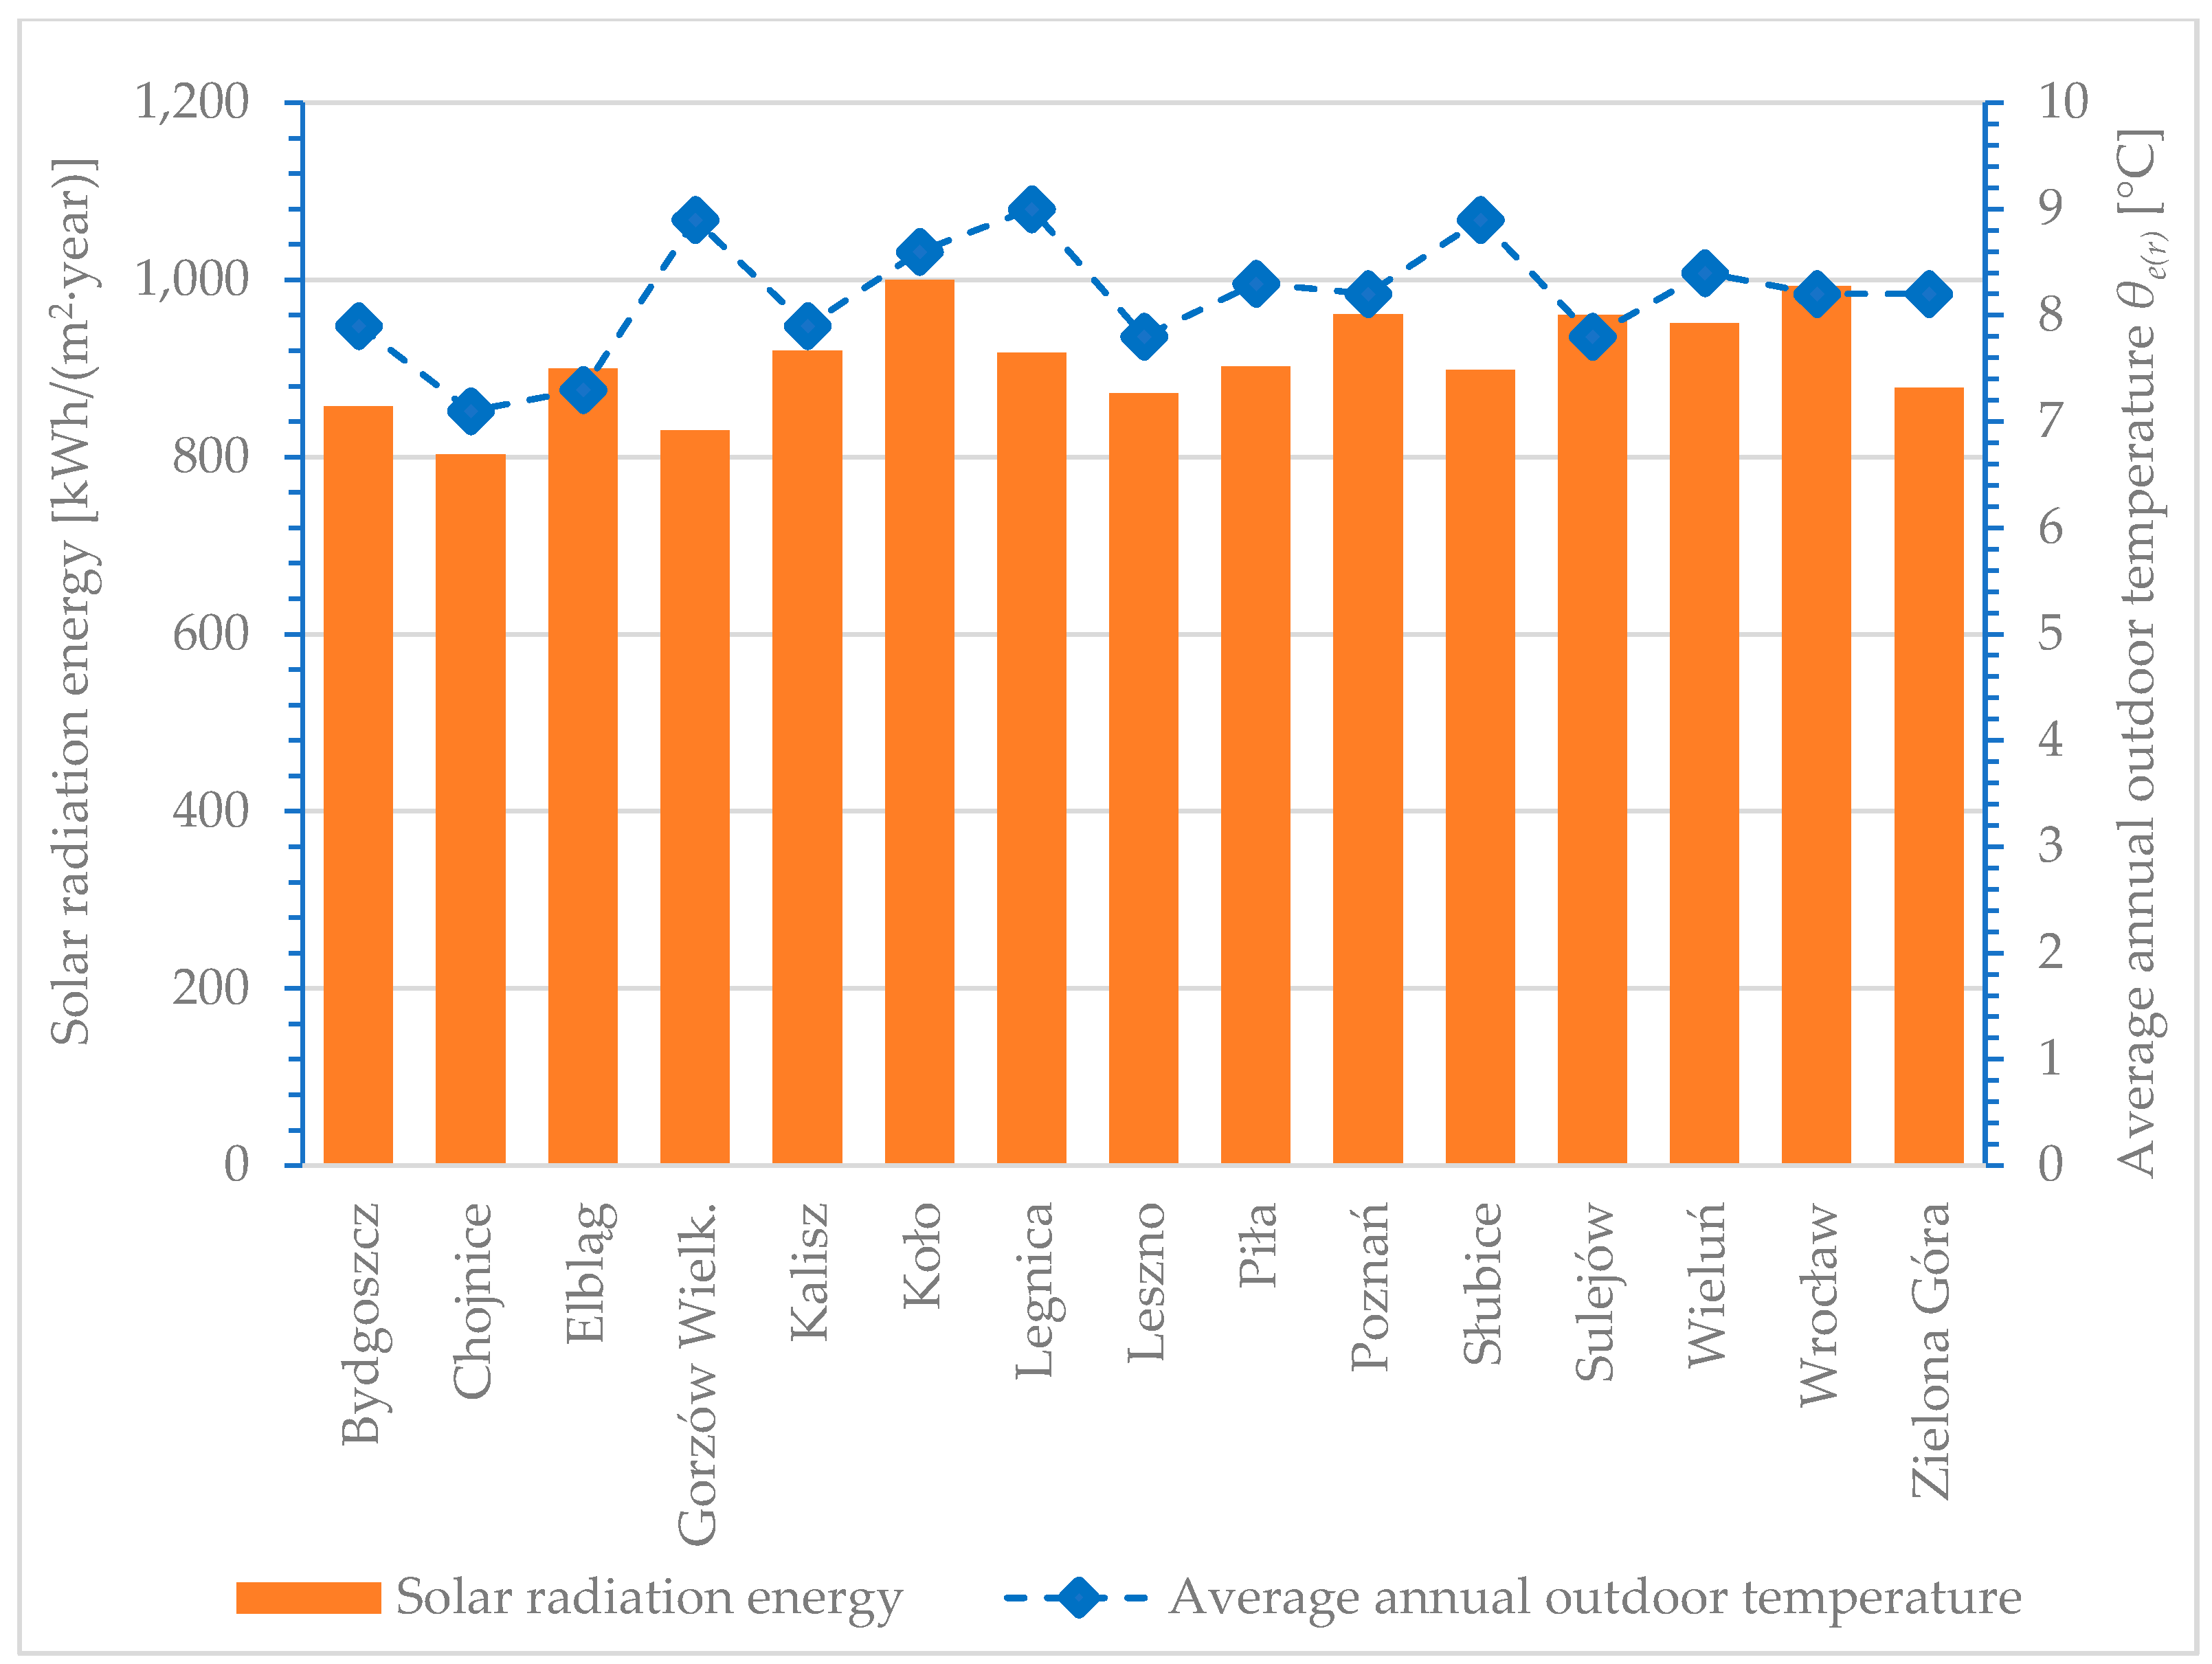
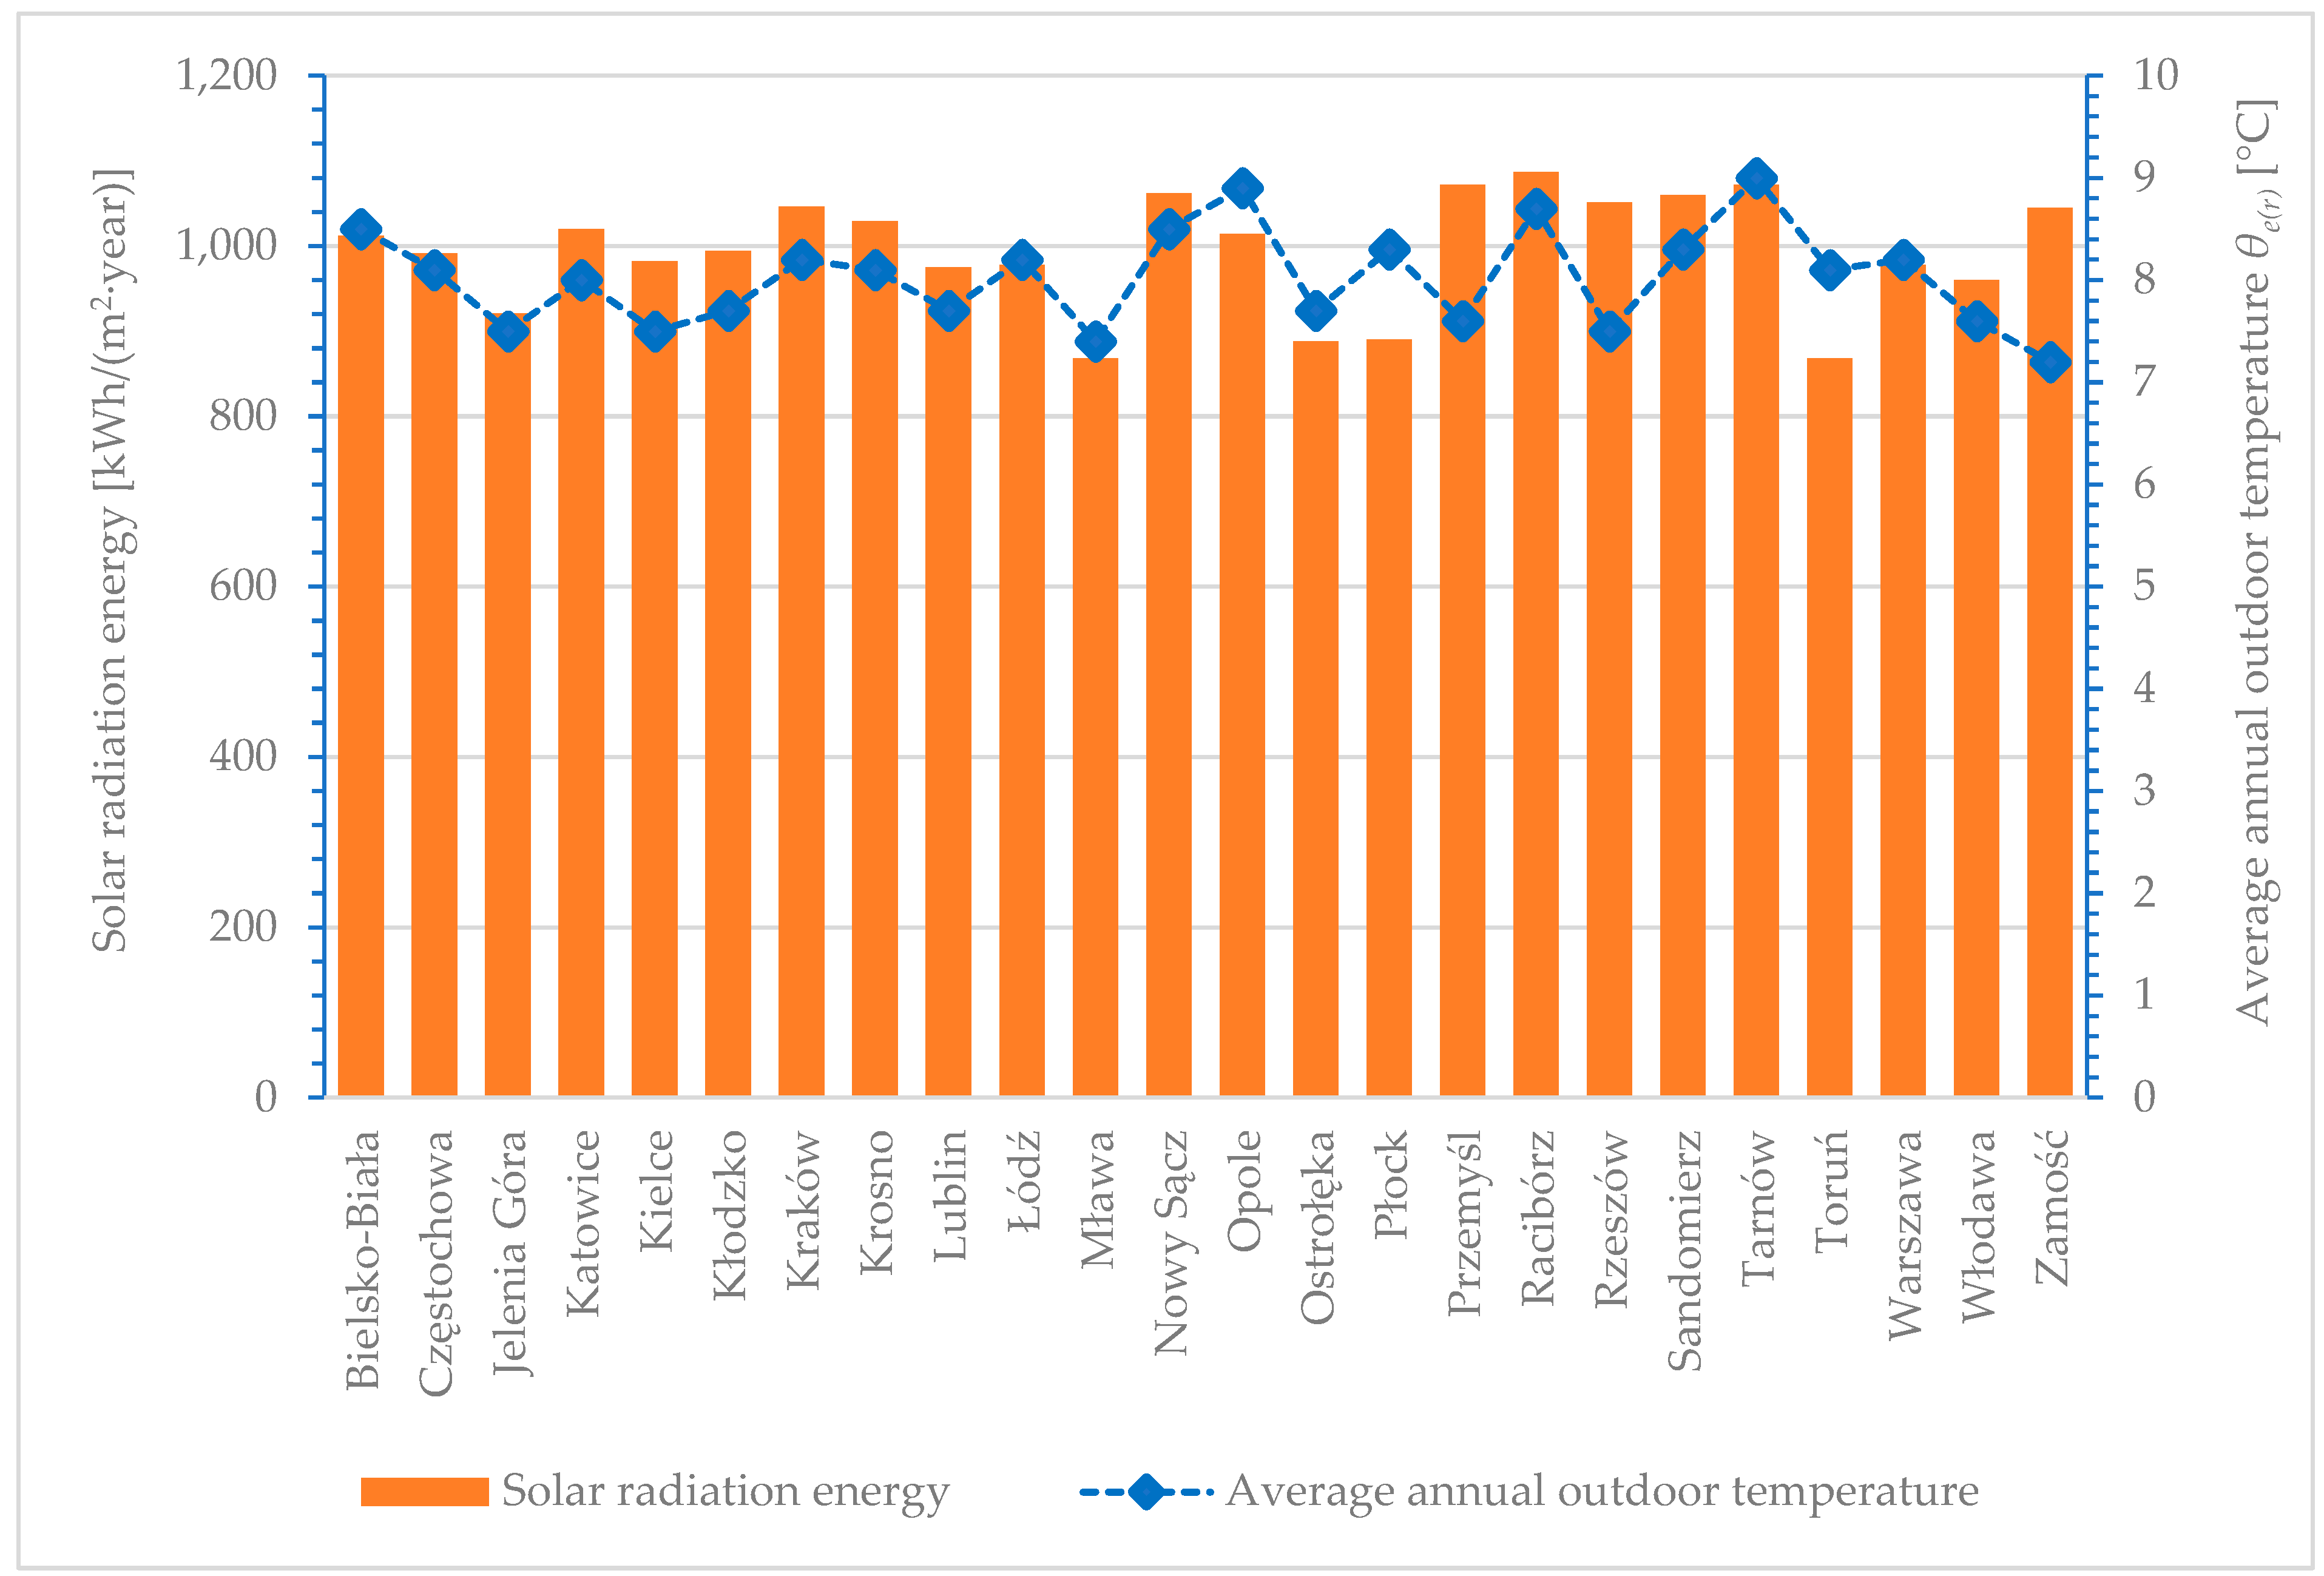
3.1. Climate Conditions in Poland
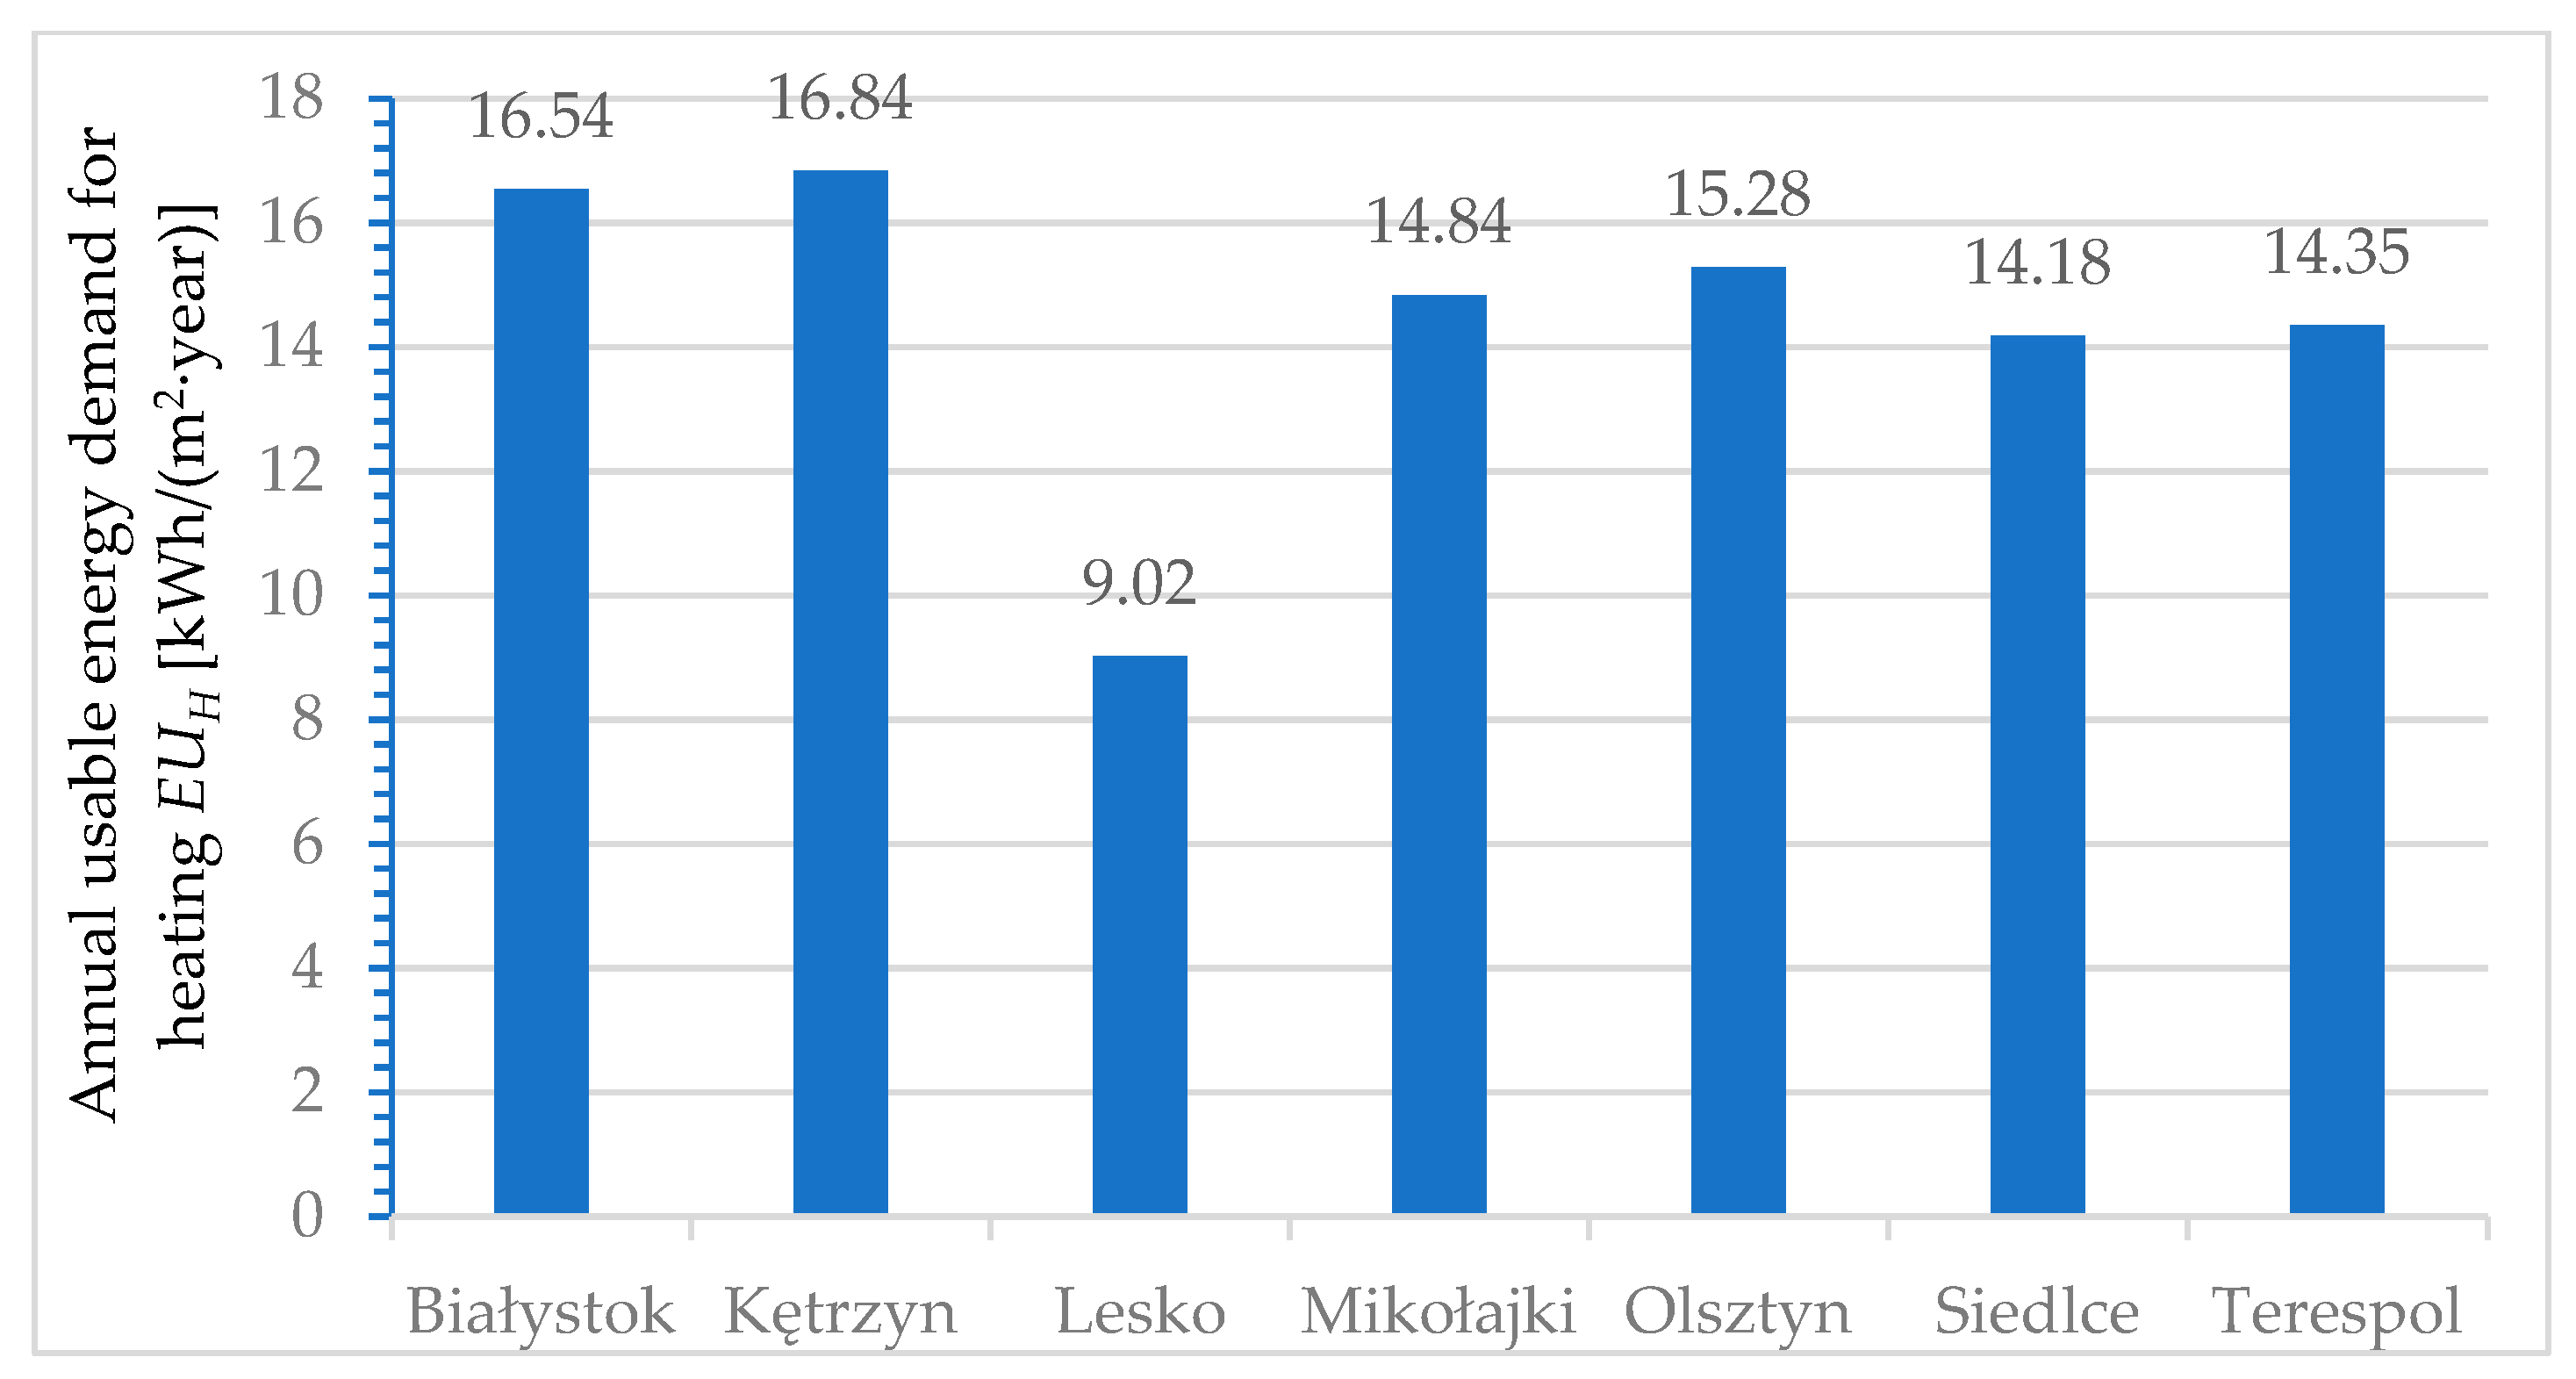
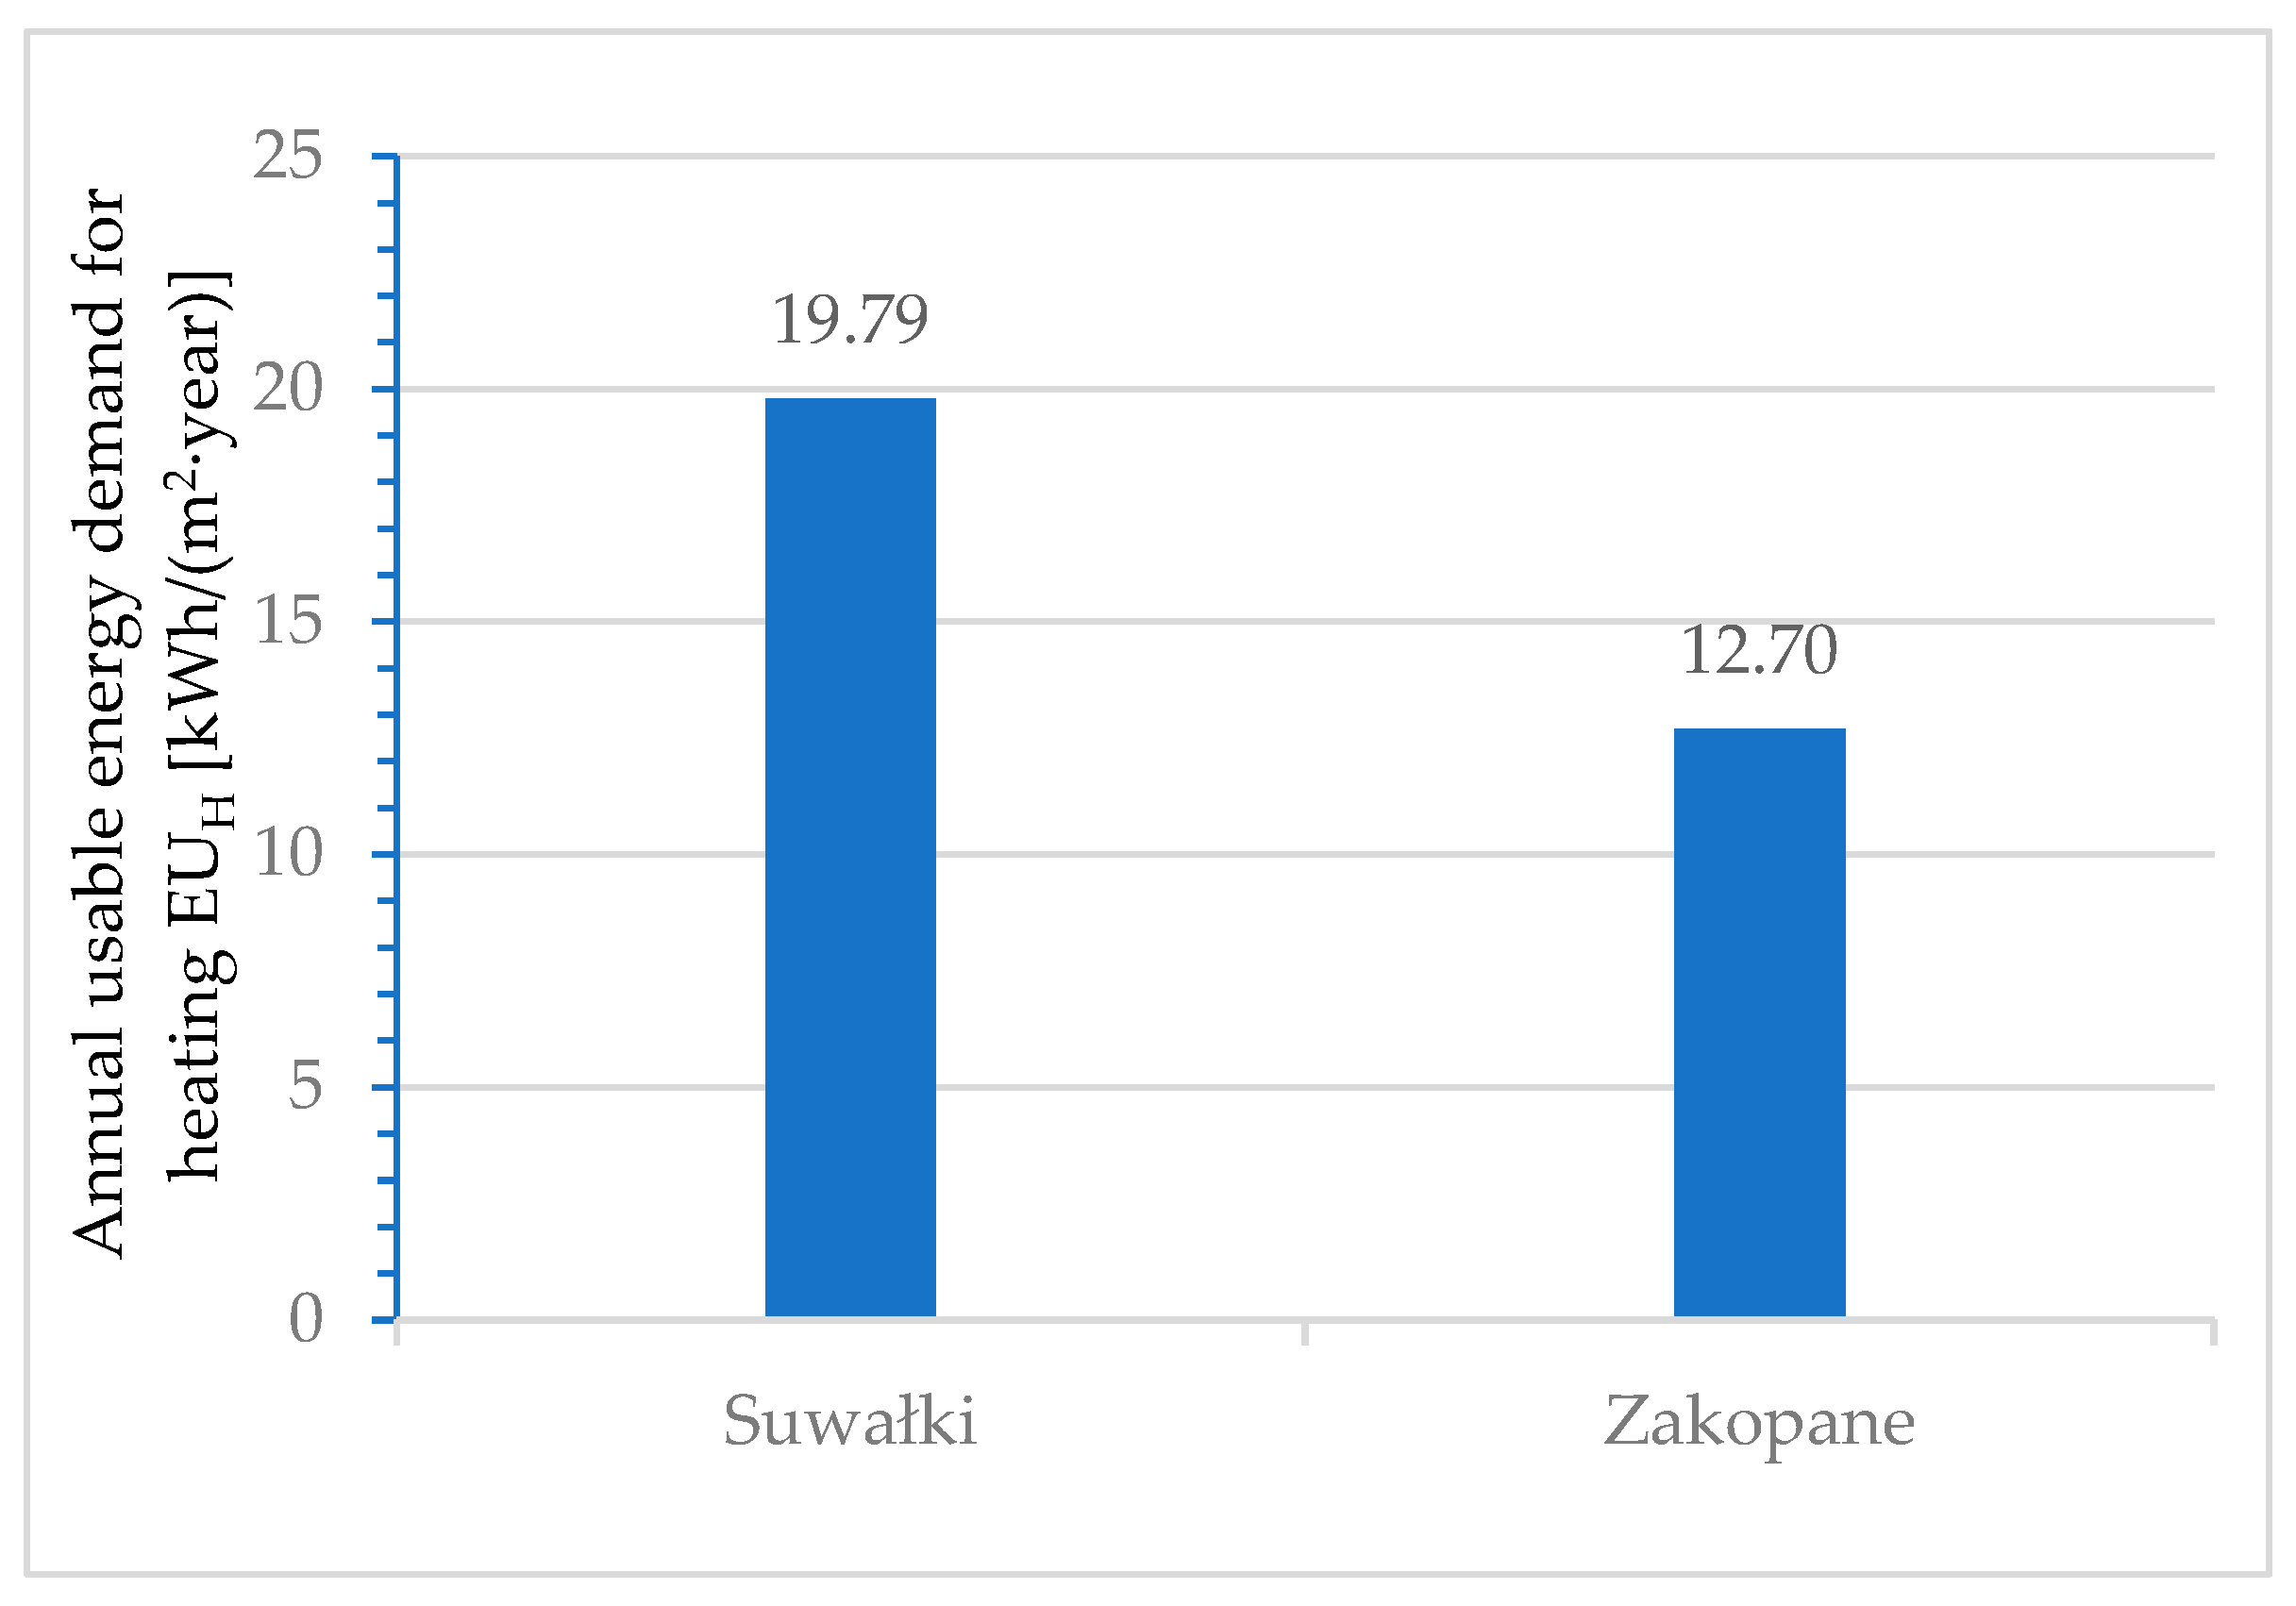
3.2. Usable Energy Demand for Heating in Different Climate Zones
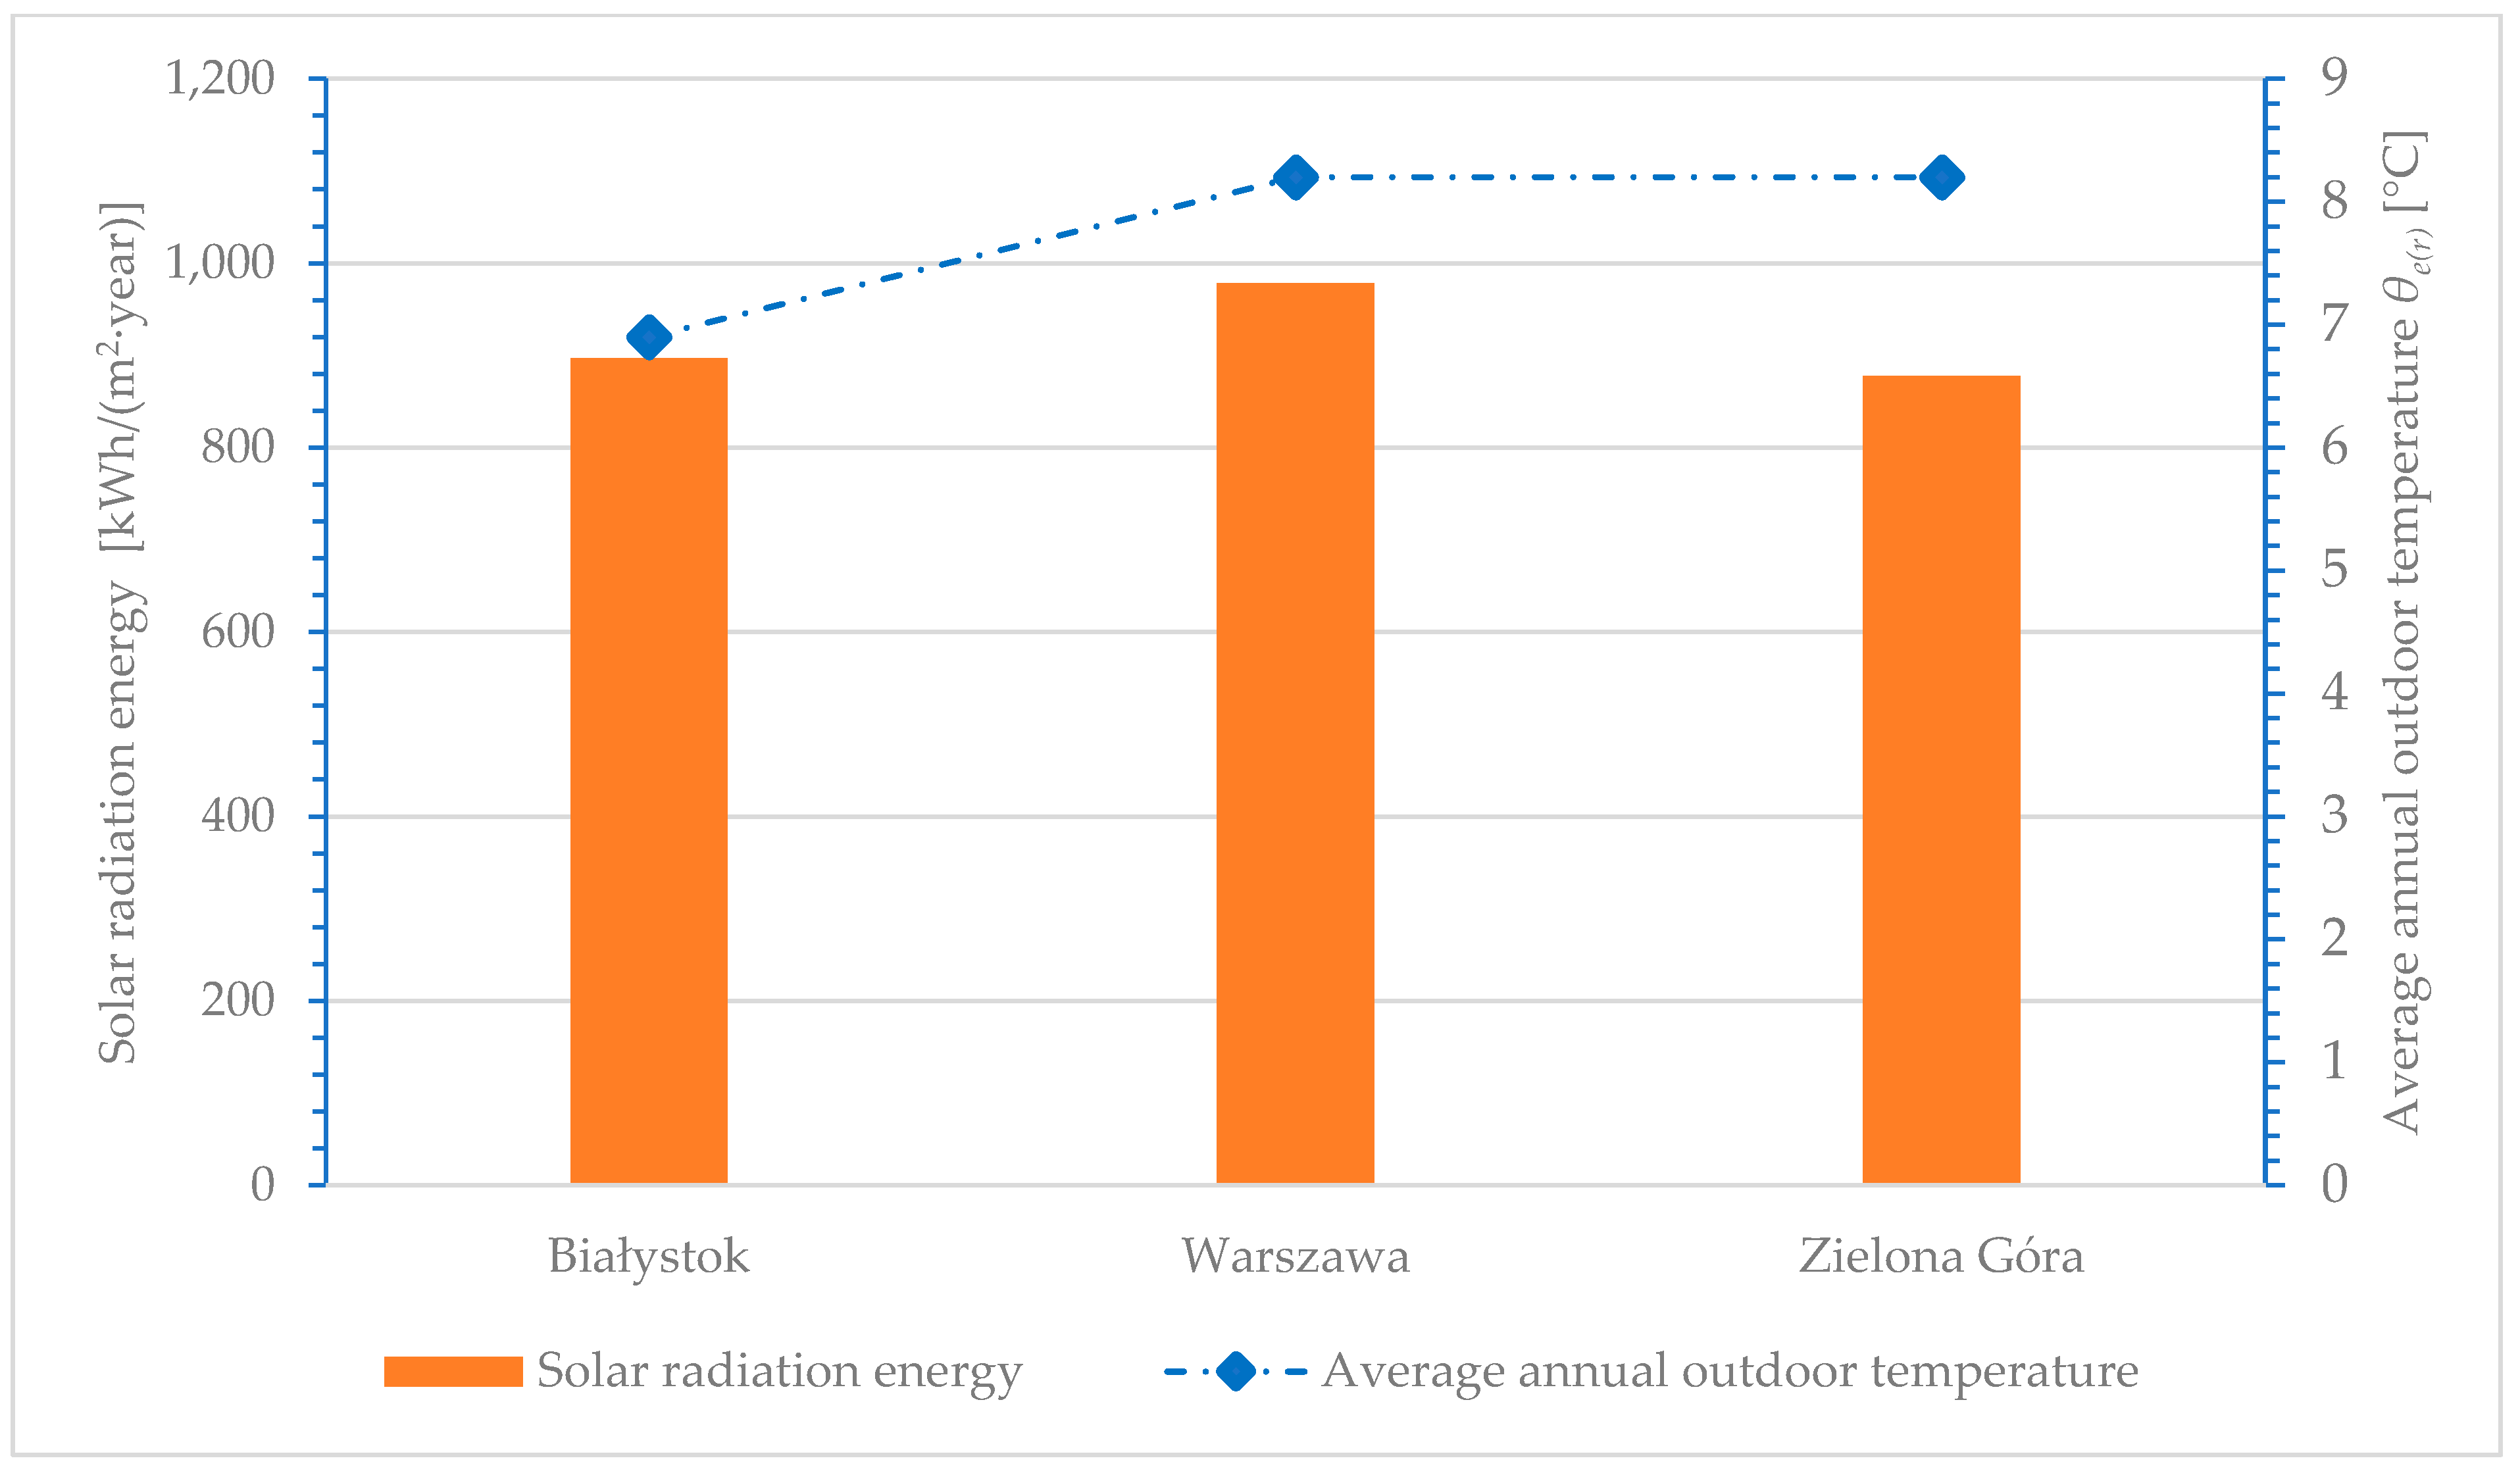
3.3. Usable Energy Demand for Heating and Domestic Hot Utility Water for the Three Selected Locations in Poland
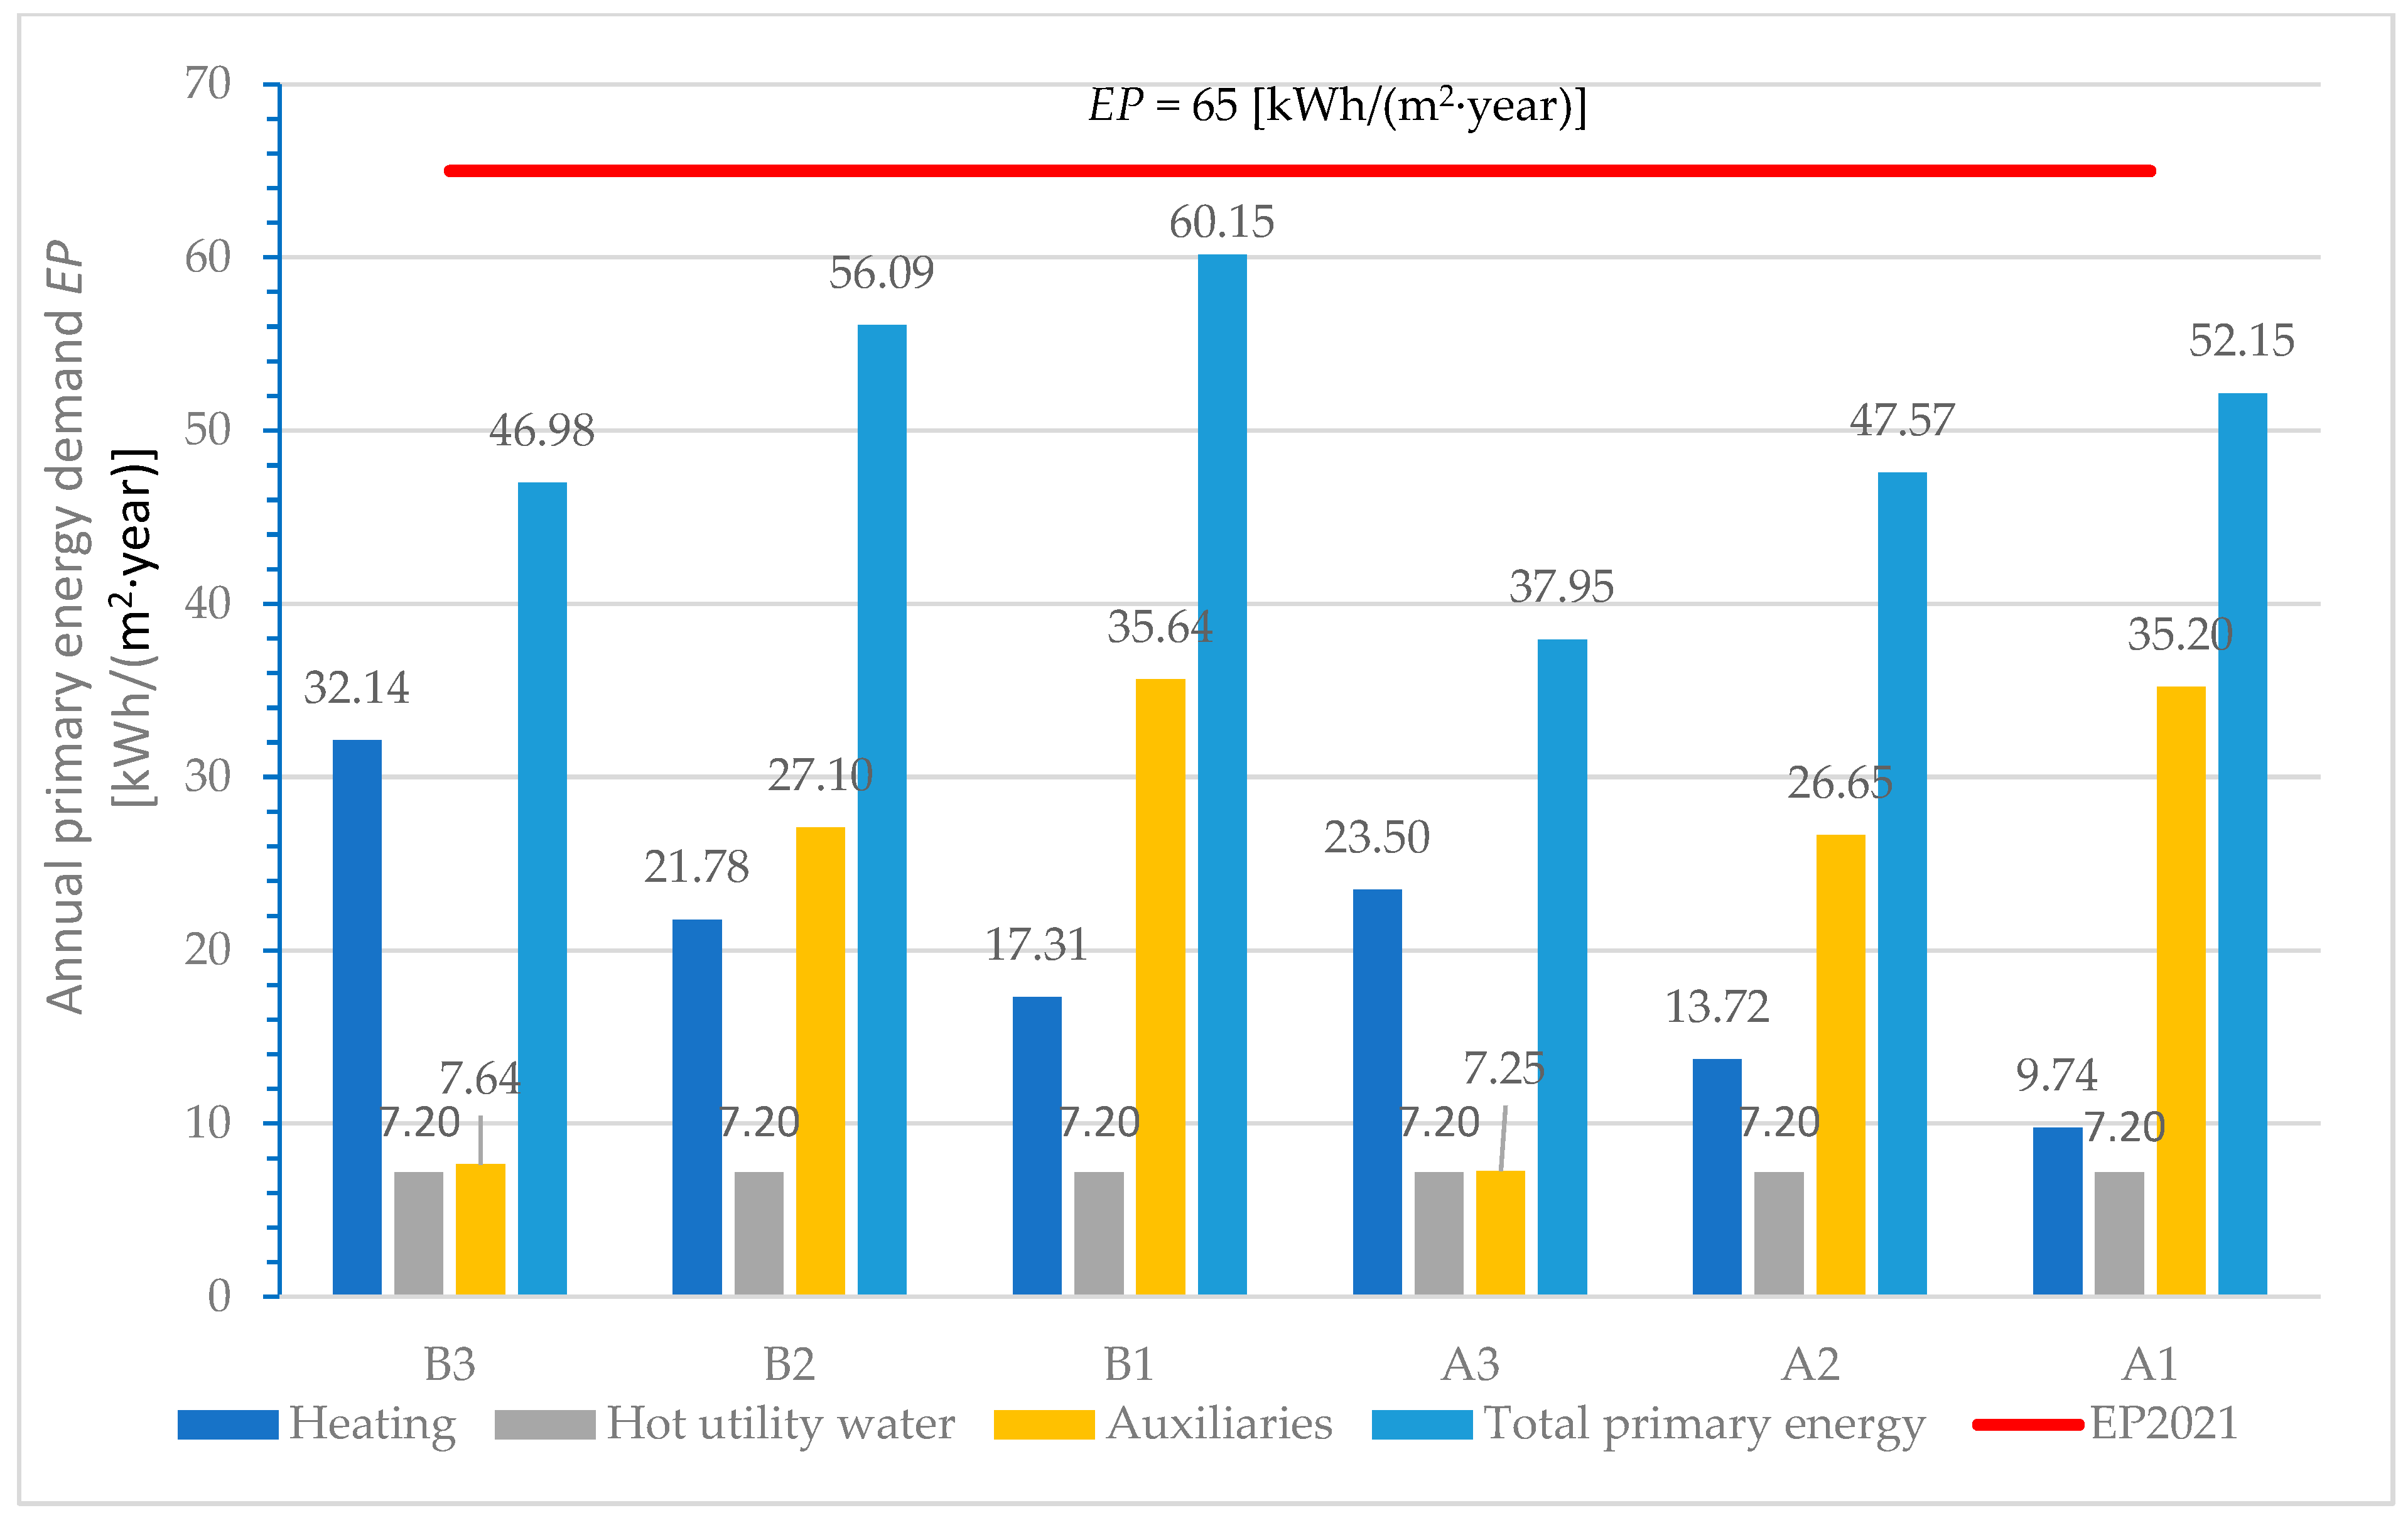
3.4. Energy, Environmental and Economic Analysis for a Building in Different Energy Classes
3.4.1. Energy Analysis
3.4.2. Environmental Analysis
3.4.3. Economic Analysis
3.5. Energy, Environmental and Economic Analyses for Selected Locations in Poland
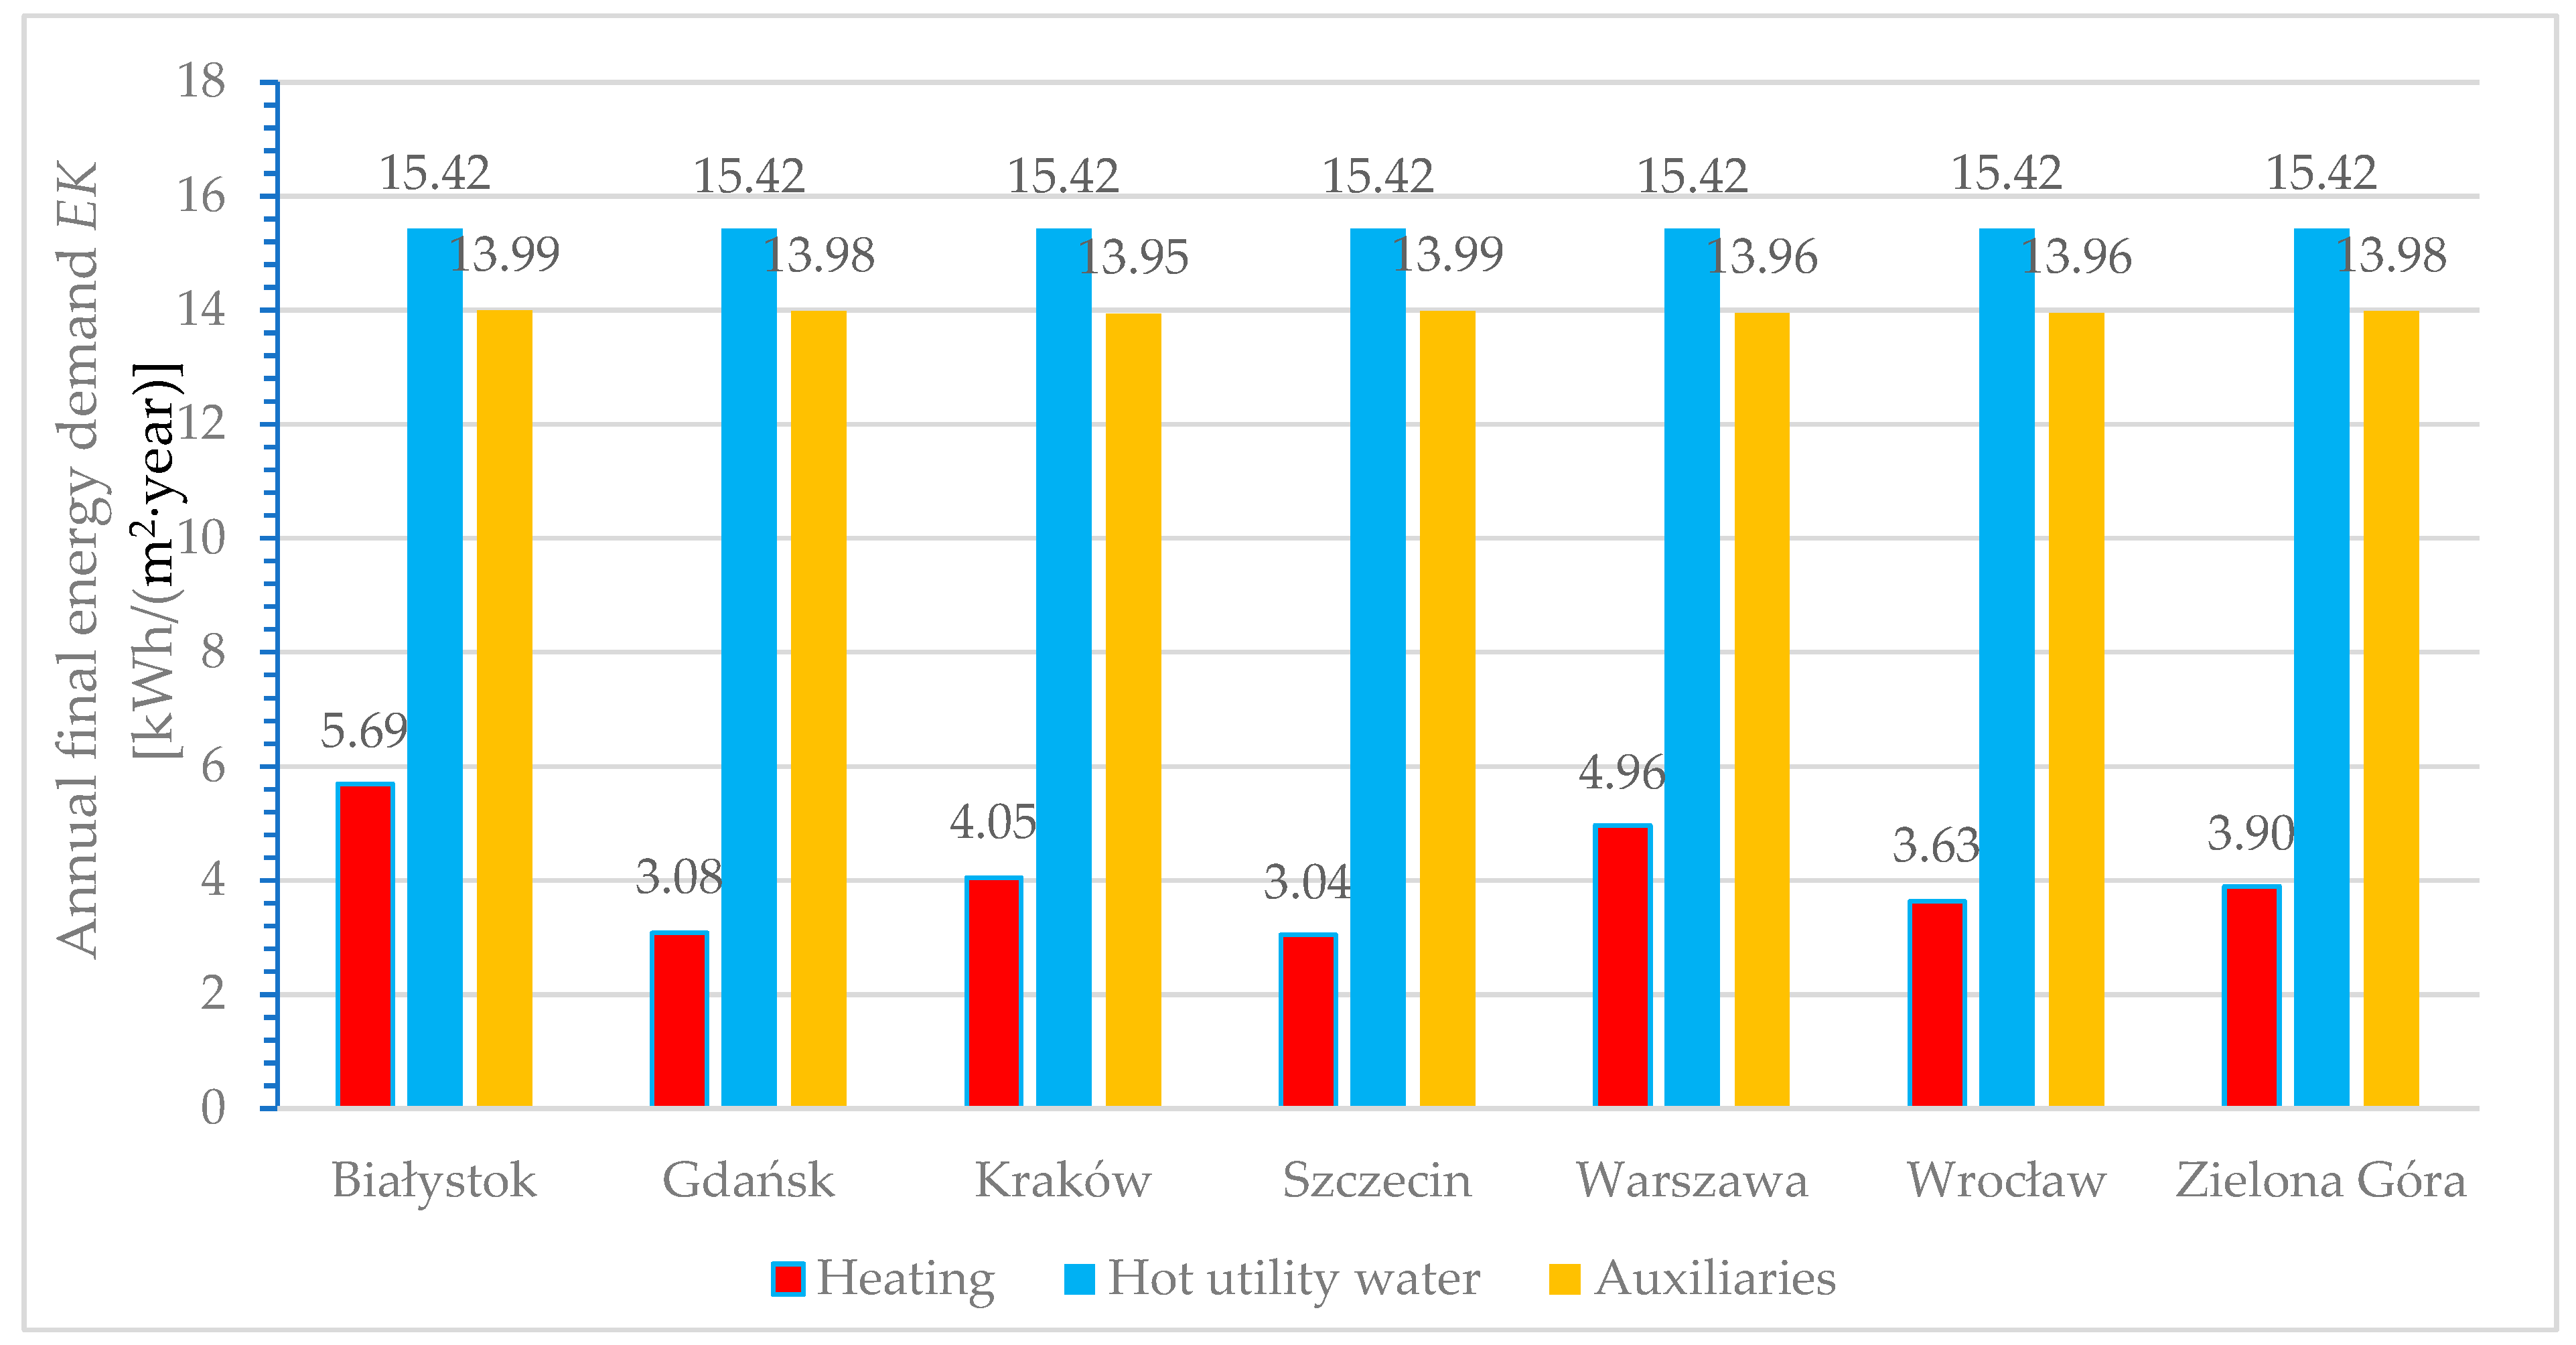
3.5.1. Energy Analysis
3.5.2. Environmental Analysis
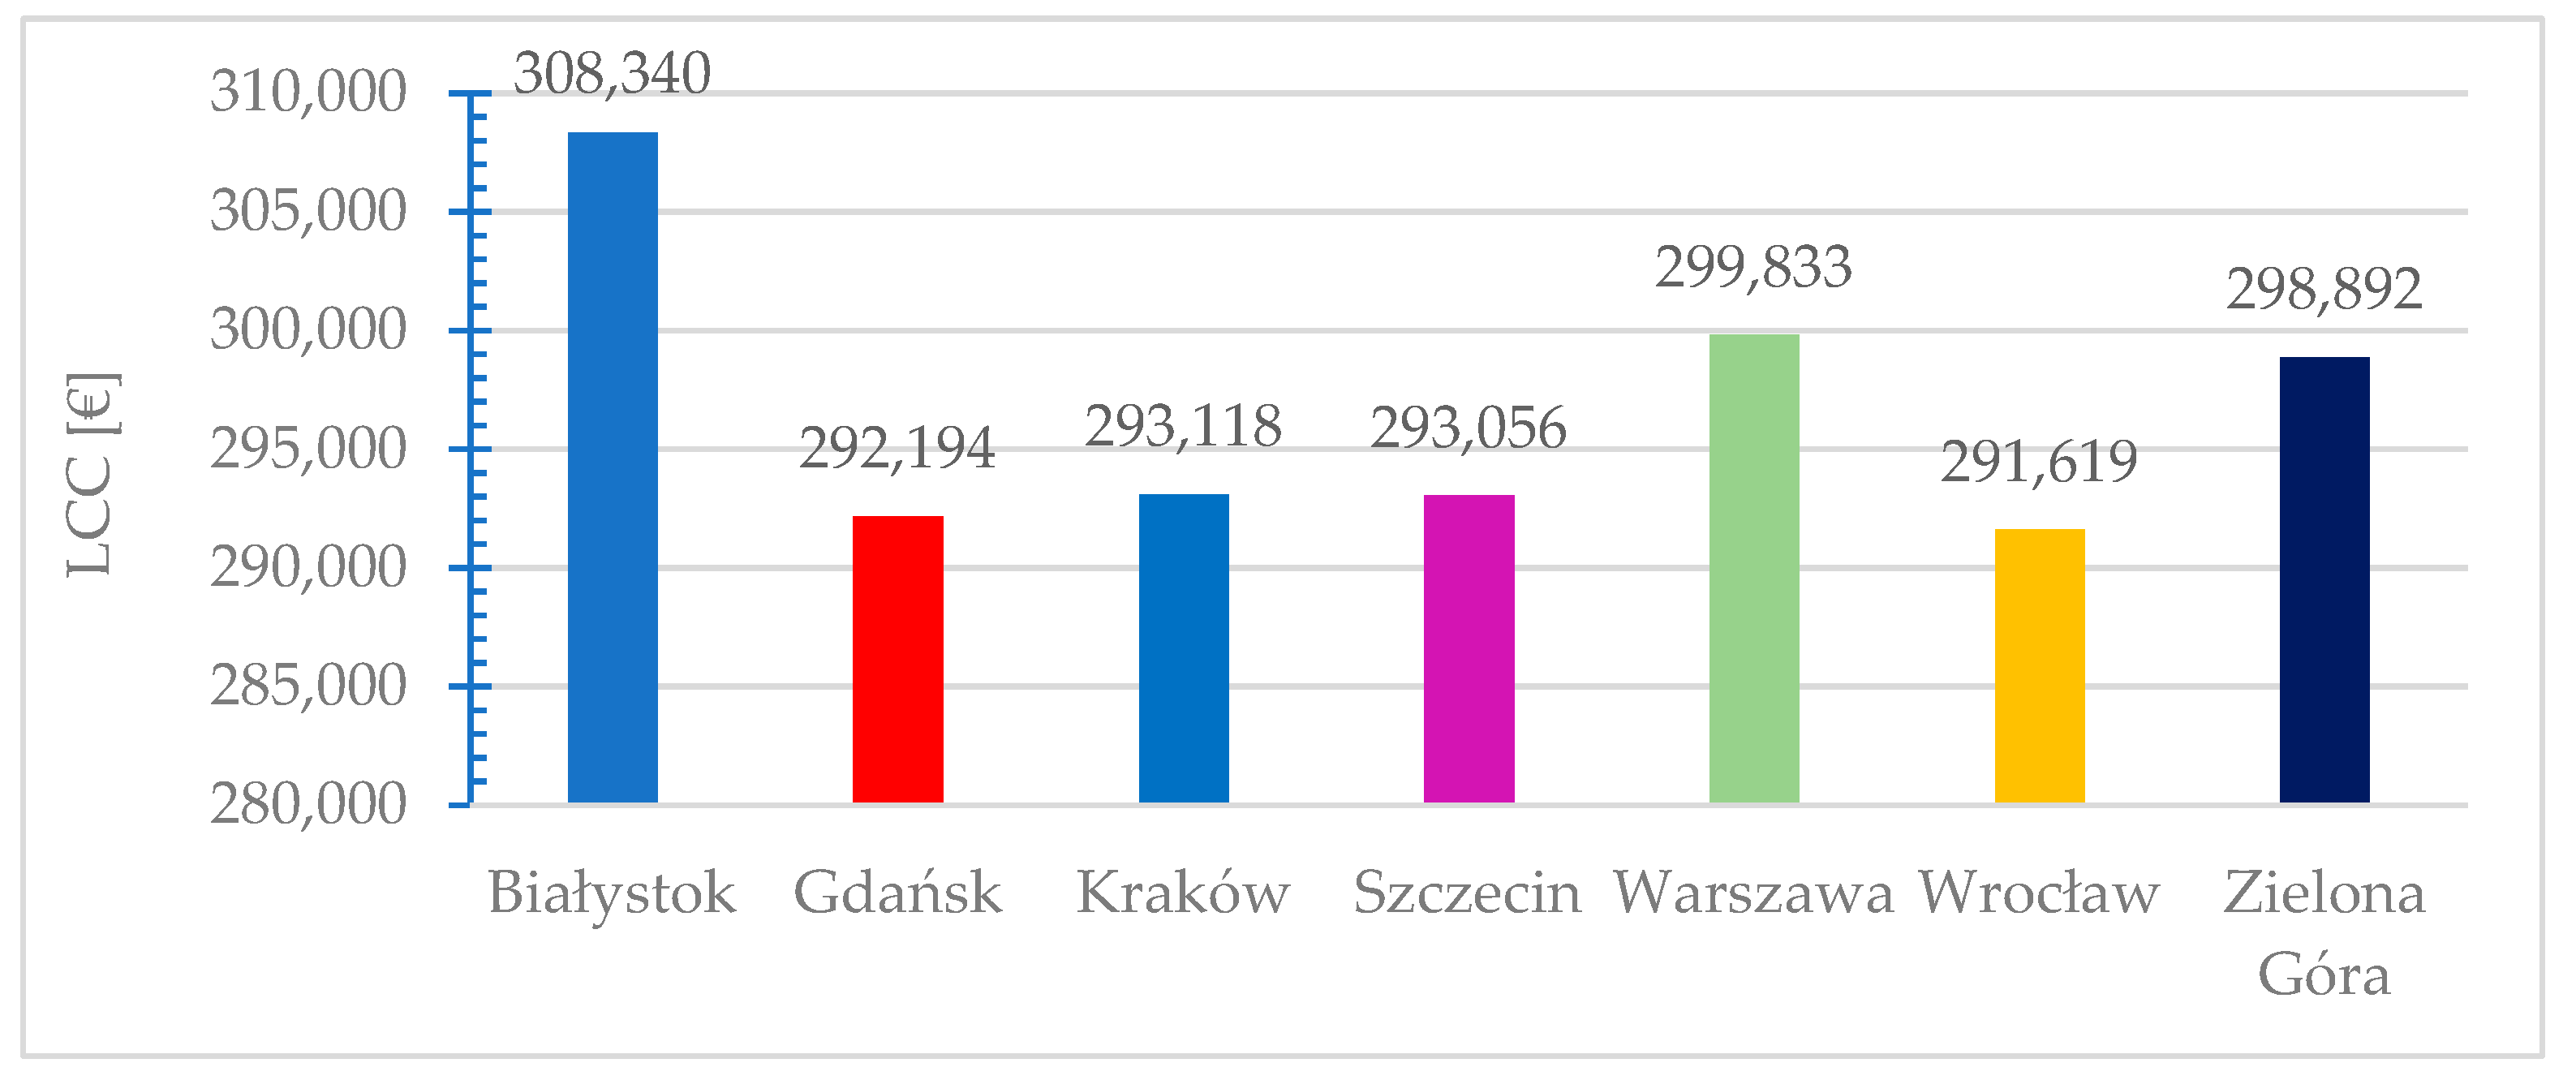
3.5.3. Economic Analysis
3.6. Summary of Analysis Results
4. Discussion and Development of Research
5. Conclusions
Supplementary Materials
Author Contributions
Funding
Data Availability Statement
Conflicts of Interest
References
- Green Paper, A 2030 Framework for Climate and Energy Policies, COM, 2013, p. 169. Taking Stock of the Europe 2020 Strategy for Smart Sustainable and Inclusive Growth, Brussels, 19/3/2014. 2014. Available online: http://ec.europa.eu/energy/consultations/20130702_green paper_2030en.htm_European_Commission (accessed on 27 March 2013).
- IEA International Energy Agency. World Energy Outlook. Available online: http://www.iea.org (accessed on 20 June 2017).
- Alexander, L. At all. Climate change 2013: The Physical Science Basis, in Contribution of Working Group I (WGI) to the Fifth Assessment Report (AR5) of the Intergovernmental Panel on Climate Change (IPCC). Available online: https://www.researchgate.net/publication/266208027_Climate_change_2013_The_physical_science_basis_in_contribution_of_Working_Group_I_WGI_to_the_Fifth_Assessment_Report_AR5_of_the_Intergovernmental_Panel_on_Climate_Change_IPCC (accessed on 21 January 2014).
- D’Agostino, D. Assessment of the progress towards the establishment of definitions of nearly zero energy buildings (nZEBs) in European member States. J. Build. Eng. 2015, 1, 20–32. [Google Scholar] [CrossRef]
- D’Agostino, D.; Parker, D.; Melia, P. Environmental and economic implications of energy efficiency in new residential buildings: A multi-criteria selection approach. Energy Strategy Rev. 2019, 26, 100412. [Google Scholar] [CrossRef]
- Griego, D.; Krarti, M.; Hernandez-Guerrero, A. Optimization of energy efficiency and thermal comfort measures for residential buildings in Salamanca, Mexico. Energy Build. 2012, 54, 540–549. [Google Scholar] [CrossRef]
- Gratia, E.; De Herde, A. Design of low energy office buildings. Energy Build. 2003, 35, 473–491. [Google Scholar] [CrossRef]
- Borgstein, E.H.; Lamberts, R. Developing energy consumption benchmarks for buildings: Bank branches in Brazil. Energy Build. 2014, 82, 82–91. [Google Scholar] [CrossRef]
- Perez, I.O.; Rodriguez, A.H.; Lopez, C.B. Adaptive thermal comfort in the main Mexican climate conditions with and without passive cooling. Energy Build. 2016, 145, 251–258. [Google Scholar] [CrossRef]
- Invidiata, A.; Ghisi, E. Impact of climate change on heating and cooling energy demand in houses in Brazil. Energy Build. 2016, 130, 20–32. [Google Scholar] [CrossRef]
- Assaf, S.; Nour, S.M. Potential of energy and water efficiency improvement in Abu Dhabi’s building sector–analysis of Estidama pearl rating system. Renew. Energy 2015, 82, 100–107. [Google Scholar]
- Szymańska, E.J.; Kubacka, M.; Woźniak, J.; Polaszczyk, J. Analysis of Residential Buildings in Poland for Potential Energy Renovation toward Zero-Emission Construction. Energies 2022, 15, 9327. [Google Scholar] [CrossRef]
- Klemeš, J.J.; Varbanov, P.S.; Ocłoń, P.; Chin, H.H. Towards Efficient and Clean Process Integration: Utilisation of Renewable Resources and Energy-Saving Technologies. Energies 2019, 12, 4092. [Google Scholar] [CrossRef]
- Huang, C.; Ma, J.; Song, K. Homeowners’ Willingness to Make Investment in Energy Efficiency Retrofit of Residential Buildings in China and Its Influencing Factors. Energies 2021, 14, 1260. [Google Scholar] [CrossRef]
- Rosak-Szyrocka, J.; Zywiołek, J. Qualitative Analysis of Household Energy Awareness in Poland. Energies 2022, 15, 2279. [Google Scholar] [CrossRef]
- Vilcekova, S.; Kridlova Burdova, E. Multi-criteria analysis of building assessment regarding energy performance using a life-cycle approach. Int. J. Energy Environ. Eng. 2014, 5, 83. [Google Scholar] [CrossRef]
- Moayedi, H.; Mosavi, A. Double-Target Based Neural Networks in Predicting Energy Consumption in Residential Buildings. Energies 2021, 14, 1331. [Google Scholar] [CrossRef]
- EU. Directive 2012/27/EU. European Parliament and of the Council of 25 October 2012 on Energy Efficiency, Amending Directives 2009/125/EC and 2010/30/EU and Repealing Directives 2004/8/EC and 2006/32/EC. Available online: https://eur-lex.europa.eu/eli/dir/2012/27/oj (accessed on 12 November 2012).
- EU. Directive 2009/28/EU. European Parliament and of the Council of 23 April 2009 on the Promotion of the Use of Energy from Renewable Sources and Amending and Subsequently Repealing Directives 2001/77/EC and 2003/30/EC. Available online: https://eur-lex.europa.eu/eli/dir/2009/28/oj (accessed on 4 June 2009).
- EU. Directive 2010/31/EU. European Parliament and of the Council of 19 May 2010 on the Energy Performance of Buildings (Recast). 2010, pp. 13–35. Available online: https://eur-lex.europa.eu/LexUriServ/LexUriServ.do?uri=OJ:L:2010:153:0013:0035:en:PDF (accessed on 16 June 2010).
- Tori, F.; Bustamante, W.; Vera, S. Analysis of Net Zero Energy Buildings public policies at the residential building sector: A comparison between Chile and selected countries. Energy Policy 2022, 161, 112707. [Google Scholar] [CrossRef]
- Li, X.; Lin, A.; Young, C.-H.; Dai, C.-H.; Wang, C.-H. Energetic and economic evaluation of hybrid solar energy systems in a residential net-zero energy building. Appl. Energy 2019, 254, 113709. [Google Scholar] [CrossRef]
- Bandeiras, F.; Gomes, M.; Coelho, P.; Fernandes, J. Towards net zero energy in industrial and commercial buildings in Portugal. Renew. Sustain. Energy Rev. 2020, 119, 109580. [Google Scholar] [CrossRef]
- Ma, Y.; Zedan, S.; Liu, A.; Miller, W. Impact of a Warming Climate on Hospital Energy Use and Decarbonization: An Australian Building Simulation Study. Buildings 2022, 12, 1275. [Google Scholar] [CrossRef]
- Almutairi, K.; Aungkulanon, P.; Algarni, S.; Alqahtani, T.; Keshuov, S.A. Solar irradiance and efficient use of energy: Residential construction toward net-zero energy building. Sustain. Energy Technol. Assess. 2022, 53, 102550. [Google Scholar] [CrossRef]
- Paoletti, G.; Pascual Pascuas, R.; Pernetti, R.; Lollini, R. Nearly zero energy buildings: An overview of the main construction features across Europe. Buildings 2017, 7, 43. [Google Scholar] [CrossRef]
- Nindartin, A.; Moon, H.-W.; Park, S.-J.; Lee, K.-T.; Im, J.-B.; Kim, J.-H. Influencing of the Building Energy Policies upon the Efficiency of Energy Consumption: The Case of Courthouse Buildings in South Korea. Energies 2022, 15, 6679. [Google Scholar] [CrossRef]
- Kwiatkowski, J.; Rucińska, J. Estimation of energy efficiency class limits for multi-family residential buildings in Poland. Energies 2020, 13, 6234. [Google Scholar] [CrossRef]
- Directive 2010/31/EU of the European Parliament and of the Council of 19 May 2010 on the Energy Performance of Buildings (europa.eu). Available online: https://eur-lex.europa.eu/legal-content/EN/TXT/?uri=celex%3A32010L0031 (accessed on 21 April 2024).
- Gokarakonda, S.; Venjakob, M.; Thomas, S. Report on Local EPC Situation and Cross-Country Comparison Matrix. QualDeEPC H2020 Project; Wuppertal Institut: Wuppertal, Germany, 2020; Available online: https://qualdeepc.eu/wp-content/uploads/2020/04/QualDeEPC_D2.1_Final_V2.pdf (accessed on 23 September 2020).
- Congedo, P.M.; Balivo, C.; D’Agostino, D.; Zaca, I. Cost-optimal design for nearly zero energy office buildings located in warm climates. Energy 2015, 91, 967–982. [Google Scholar] [CrossRef]
- Ferrara, M.; Fabrizio, E.; Virgone, J.; Filippi, M. A simulation based optimization method for cost-optimal analysis. Energy Build. 2014, 84, 442–457. [Google Scholar] [CrossRef]
- D’Agostino, D.; Cuniberti, B.; Bertoldi, P. Data on European non-residential buildings. Data Brief 2017, 14, 759–762. [Google Scholar] [CrossRef] [PubMed]
- D’Agostino, D.; Cuniberti, B.; Bertoldi, P. Energy consumption and efficiency technology measures in European non-residential buildings. Energy Build. 2017, 153, 72–86. [Google Scholar] [CrossRef]
- Azari, R.; Abbasabadi, N. Embodied energy of buildings: A review of data, methods, challenges, and research trends. Energy Build. 2018, 168, 225–235. [Google Scholar] [CrossRef]
- Kale, N.N.; Joshi, D.; Menon, R. Life cycle cost analysis of commercial buildings with energy efficient approach. Perspect. Sci. 2016, 8, 452–454. [Google Scholar] [CrossRef]
- Atmaca, A.; Atmaca, N. Comparative life cycle energy and cost analysis of post-disaster temporary housings. Appl. Energy 2016, 171, 429–443. [Google Scholar] [CrossRef]
- Ascione, F.; Bianco, N.; De Masi, R.F.; Mauro, G.M.; Vanoli, G.P. Design of the building envelope: A novel multi-objective approach for the optimization of energy performance and thermal comfort. Sustainability 2015, 7, 10809–10836. [Google Scholar] [CrossRef]
- Jaber, S.; Ajib, S. Optimum, technical and energy efficiency design of residential building in Mediterranean region. Energy Build. 2011, 43, 1829–1834. [Google Scholar] [CrossRef]
- Invidiata, A.; Ghisi, E. Life-cycle energy and cost analyses of window shading used to improve the thermal performance of houses. J. Clean. Prod. 2016, 133, 1371–1383. [Google Scholar] [CrossRef]
- Islam, H.; Jollands, M.; Setunge, S.; Haque, N.; Bhuiyan, M.A. Life cycle assessment and life cycle cost implications for roofing and floor designs in residential buildings. Energy Build. 2015, 104, 250–263. [Google Scholar] [CrossRef]
- Pal, S.K.; Takano, A.; Alanne, K.; Palonen, M.; Siren, K. A multi-objective life cycle approach for optimal building design: A case study in Finnish context. J. Clean. Prod. 2017, 143, 1021–1035. [Google Scholar] [CrossRef]
- Braulio-Gonzalo, M.; Bovea, M.D. Environmental and cost performance of building’s envelope insulation materials to reduce energy demand: Thickness optimization. Energy Build. 2017, 150, 527–545. [Google Scholar] [CrossRef]
- Udawattha, C.; Halwatura, R. Life cycle cost of different walling material used for affordable housing in tropics. Case Stud. Constr. Mater. 2017, 7, 15–29. [Google Scholar] [CrossRef]
- Kaynakli, O. Parametric investigation of optimum thermal insulation thickness for external walls. Energies 2011, 4, 913–927. [Google Scholar] [CrossRef]
- Alsayed, M.F.; Tayeh, R.A. Life cycle cost analysis for determining optimal insulation thickness in Palestinian buildings. J. Build. Eng. 2019, 22, 101–112. [Google Scholar] [CrossRef]
- Bichiou, Y.; Krarti, M. Optimization of envelope and HVAC systems selection for residential buildings. Energy Build. 2011, 43, 3373–3382. [Google Scholar] [CrossRef]
- Harkouss, F.; Fardoun, F.; Biwole, P.H. Multi-objective optimization methodology for net zero energy buildings. J. Build. Eng. 2018, 16, 57–71. [Google Scholar] [CrossRef]
- Chastas, P.; Theodosiou, T.; Kontoleon, K.J.; Bikas, D. The effect of embodied impact on the cost-optimal levels of nearly zero energy buildings: A case study of a residential building in Thessaloniki, Greece. Energies 2017, 10, 740. [Google Scholar] [CrossRef]
- Kang, H.J. Development of an nearly zero emission building (nZEB) life cycle cost assessment tool for fast decision making in the early design phase. Energies 2017, 10, 59. [Google Scholar] [CrossRef]
- Moran, P.; Goggins, J.; Hajdukiewicz, M. Super-insulate or use renewable technology? Life cycle cost, energy and global warming potential analysis of nearly zero energy buildings (nZEB) in a temperate oceanic climate. Energy Build. 2017, 139, 590–607. [Google Scholar] [CrossRef]
- Marszal, A.J.; Heiselberg, P. Life cycle cost analysis of a multi-storey residential Net Zero Energy Building in Denmark. Energy 2011, 36, 5600–5609. [Google Scholar] [CrossRef]
- Audenaert, A.; De Cleyn, S.H.; Vankerckhove, B. Economic analysis of passive houses and low-energy houses compared with standard houses. Energy Policy 2008, 36, 47–55. [Google Scholar] [CrossRef]
- Harkouss, F.; Fardoun, F.; Biwole, P.H. Passive design optimization of low energy buildings in different climates. Energy 2018, 165, 591–613. [Google Scholar] [CrossRef]
- Neofytou, H.; Sarafidis, Y.; Gkonis, N.; Mirasgedis, S.; Askounis, D. Energy Efficiency contribution to sustainable development: A multi-criteria approach in Greece. Energy Sources Part B Econ. Plan. Policy 2020, 15, 572–604. [Google Scholar] [CrossRef]
- Invidiataa, A.; Lavagnab, M.; Ghisi, E. Selecting design strategies using multi-criteria decision making to improve the sustainability of buildings. Build. Environ. 2018, 139, 58–68. [Google Scholar] [CrossRef]
- Zvaigznitis, K.; Rochas, C.; Zogla, G.; Kamenders, A. Energy efficiency in multi-family residential buildings in Latvia. Cost benefit analysis comparing different business models. Energy Procedia 2015, 72, 245–249. [Google Scholar] [CrossRef]
- Abu Qadourah, J.; Al-Falahat, A.A.; Alrwashdeh, S.S.; Nytsch-Geusen, C. Improving the energy performance of the typical multi-family buildings in Amman, Jordan. City Territ. Archit. 2022, 9, 6. [Google Scholar] [CrossRef]
- Bataineh, A.M.; Ali, H.H. Improving Energy Efficiency of Multi-Family Apartment Buildings Case of Jordan. Int. J. Energy Econ. Policy 2021, 11, 244–254. [Google Scholar] [CrossRef]
- Mazur, Ł.; Bać, A.; Vaverková, M.D.; Winkler, J.; Nowysz, A.; Koda, E. Evaluation of the Quality of the Housing Environment Using Multi-Criteria Analysis That Includes Energy Efficiency: A Review. Energies 2022, 15, 7750. [Google Scholar] [CrossRef]
- Alsabry, A.; Szymański, K.; Michalak, B. Energy, Economic and Environmental Analysis of Alternative, High-Efficiency Sources of Heat and Energy for Multi-Family Residential Buildings in Order to Increase Energy Efficiency in Poland. Energies 2023, 16, 2673. [Google Scholar] [CrossRef]
- Alsabry, A.; Szymański, K. Energy Analyses of Multi-Family Residential Buildings in Various Locations in Poland and Their Impact on the Number of Heating Degree Days. Energies 2023, 16, 4648. [Google Scholar] [CrossRef]
- Regulation of the Minister of Development and Technology of March 28, 2023 Amending the Regulation on the Methodology for Determining the Energy Performance of a Building or Part of a Building and Energy Performance Certificates. Available online: https://isap.sejm.gov.pl/isap.nsf/download.xsp/WDU20230000697/O/D20230697.pdf (accessed on 28 April 2023).
- PN-B-03430:1983/Az3:2000; Ventilation in Residential, Common Living and Public Buildings-Requirements. Polish Normalization Committee: Warsaw, Poland, 2000. Available online: https://sklep.pkn.pl/pn-b-03430-1983-az3-2000p.html (accessed on 23 September 2020).
- Regulation of the Minister of Infrastructure of 12 April 2002 on Technical Conditions, Which Should Correspond to the Buildings and Their Location-Technical Conditions-as Amended. Available online: https://isap.sejm.gov.pl/isap.nsf/download.xsp/WDU20220001225/O/D20221225.pdf (accessed on 14 February 2022).
- ISO 52016-1; Energy Performance of Buildings—Energy Needs for heating and Cooling, Internal Temperatures and Sensible and Latent Head Loads—Part 1: Calculation Procedures. ISO: Geneva, Switzerland, 2017.
- NCEB&M: Calorific Values (CA) and CO2 Emission Factors (WE) in 2020 for Reporting under the Emissions Trading System for 2023. Available online: https://www.kobize.pl/uploads/materialy/materialy_do_pobrania/monitorowanie_raportowanie_weryfikacja_emisji_w_eu_ets/WO_i_WE_do_monitorowania-ETS-2023.pdf (accessed on 29 December 2022).
- NCEB&M: Emission Indicators of CO2, SO2, NOx, CO and Total Dust for Electricity Based on Information Contained in the National Database on Emissions of Greenhouse Gases and Other Substances for 2021. Available online: https://www.kobize.pl/uploads/materialy/materialy_do_pobrania/wskazniki_emisyjnosci/Wska%C5%BAniki_emisyjno%C5%9Bci_dla_energii_elektrycznej_grudzie%C5%84_2022.pdf (accessed on 15 December 2022).
- PN-EN 12831:2006; Heating Installations in Buildings. Calculation Method of Designed Heat Load. Polish Comitee of Normalisation: Warsaw, Poland, 2006.
- Maps. Annual Radiation in Poland. Institute of Meteorology and Water Management. Available online: https://www.imgw.pl/ (accessed on 21 April 2024).
- Directive 2002/91/EC. Directive 2002/91/EC of the European Parliament and of the Council 6 December 2002 on the Energy Performance of Buildings; OJ L 1, 4 January 2003; pp. 65–71. Available online: https://eur-lex.europa.eu/legal-content/EN/TXT/PDF/?uri=CELEX:32002L0091&from=EN (accessed on 23 September 2020).
- Lupato, G.; Manzan, M. Italian TRYs: Wpływ nowych danych pogodowych na symulacje energetyczne budynków. Budowa Energii 2019, 185, 287–303. [Google Scholar]


| Energy Class of Building Envelopes | Heat Transfer Coefficients of Building Envelopes |
|---|---|
| A | exterior walls: flat roofs: ceiling above the garage: windows: exterior doors: |
| B | exterior walls: flat roofs: ceiling above the garage: windows: exterior doors: |
| Indices Indicating the Type of Ventilation | Type of Ventilation |
|---|---|
| 1 | mechanical exhaust ventilation with heat recovery |
| 2 | mechanical exhaust ventilation |
| 3 | gravity ventilation |
| Efficiency | Values |
|---|---|
| Generation efficiency | 4.00 |
| Accumulation efficiency | 0.95 |
| Transmission efficiency | 0.90 |
| Regulation and use efficiency | 0.85 |
| Efficiency | Values |
|---|---|
| Generation efficiency | 3.00 |
| Accumulation efficiency | 0.85 |
| Transmission efficiency | 0.70 |
| Climate Zone | [°C] |
|---|---|
| I | −16 |
| II | −18 |
| III | −20 |
| IV | −22 |
| V | −24 |
| Climate Zones | Energy Demand | Location | Location Characteristics | ||
|---|---|---|---|---|---|
| Ⅰ | −16 | Minimum | 7.92 | Northwest | Świnoujście, seaside town, flat terrain, warm temperate climate |
| Maximum | 12.53 | North | Łeba, seaside town, center of the Polish coast, warm temperate climate | ||
| ⅠI | −18 | Minimum | 8.8 | Southwest | Legnica, town west of Wrocław, flat terrain, warm temperate climate |
| Maximum | 14.3 | North | Chojnice, town in Pomerania, flat area, warm temperate climate | ||
| ⅠII | −20 | Minimum | 7.82 | South | Nowy Sącz, mountainous terrain, continental temperate climate |
| Maximum | 15.28 | East | Włodawa, flat terrain, eastern border of Polish, cool temperate climate | ||
| ⅠV | −22 | Minimum | 9.02 | Southeast | Lesko, foothills, continental temperate climate |
| Maximum | 16.84 | Northeast | Kętrzyn, flat terrain with moraine hills, cool temperate climate | ||
| V | −24 | Minimum | 12.7 | South | Zakopane, mountain terrain, temperate climate |
| Maximum | 19.79 | Northeast | Suwałki, flat terrain with moraine hills, cool temperate climate | ||
Disclaimer/Publisher’s Note: The statements, opinions and data contained in all publications are solely those of the individual author(s) and contributor(s) and not of MDPI and/or the editor(s). MDPI and/or the editor(s) disclaim responsibility for any injury to people or property resulting from any ideas, methods, instructions or products referred to in the content. |
© 2024 by the authors. Licensee MDPI, Basel, Switzerland. This article is an open access article distributed under the terms and conditions of the Creative Commons Attribution (CC BY) license (https://creativecommons.org/licenses/by/4.0/).
Share and Cite
Alsabry, A.; Szymański, K.; Backiel-Brzozowska, B. Analysis of the Energy, Environmental and Economic Efficiency of Multi-Family Residential Buildings in Poland. Energies 2024, 17, 2057. https://0-doi-org.brum.beds.ac.uk/10.3390/en17092057
Alsabry A, Szymański K, Backiel-Brzozowska B. Analysis of the Energy, Environmental and Economic Efficiency of Multi-Family Residential Buildings in Poland. Energies. 2024; 17(9):2057. https://0-doi-org.brum.beds.ac.uk/10.3390/en17092057
Chicago/Turabian StyleAlsabry, Abdrahman, Krzysztof Szymański, and Beata Backiel-Brzozowska. 2024. "Analysis of the Energy, Environmental and Economic Efficiency of Multi-Family Residential Buildings in Poland" Energies 17, no. 9: 2057. https://0-doi-org.brum.beds.ac.uk/10.3390/en17092057