
Not All about the Money: The Role of Financial Information in Promoting Residential Rooftop Photovoltaics


1
School of Environmental Sciences, University of Haifa, Haifa 3498838, Israel
2
Department of Economics and Management, Yezreel Valley College, Emek Yezreel 1930600, Israel
3
NRERC—Natural Resources and Environmental Research Center, University of Haifa, Haifa 3498838, Israel
*
Author to whom correspondence should be addressed.
Energies 2024, 17(9), 2043; https://0-doi-org.brum.beds.ac.uk/10.3390/en17092043
Submission received: 24 February 2024
/
Revised: 29 March 2024
/
Accepted: 17 April 2024
/
Published: 25 April 2024
(This article belongs to the Special Issue Renewable Energy Sources towards a Zero-Emission Economy)
Abstract
:This study investigates the role of financial information in shaping the intention to adopt (ITA) Residential Rooftop Photovoltaic (RPV) systems in Israel—a country with a surprisingly low RPV adoption rate given the high solar irradiance, and significant governmental support for RPV. We used an online survey of 899 respondents to examine how different presentations of RPV revenues impact both RPV deal comprehension and ITA. Our results align with existing literature on the roles of early technology adopters and pro-environmental characteristics while introducing two novel findings. First, households value their roofs—especially flat ones used for leisure. This negatively impacts ITA. Second, we found a positive correlation between trust in government entities and ITA, underscoring the importance of trust in institutions. Although financial information does enhance RPV deal comprehension, it does not significantly influence ITA. This study concludes that RPV penetration should not be promoted solely by financial incentives, but also by other motivations like environmental concerns, novelty seeking, and improved institutional trust.
1. Introduction
In the milieu of rising global apprehension over climate change, nations are increasingly pivoting towards renewable energy sources. Residential Photovoltaic (RPV) systems, characterized by their favorable energy life cycle, have become central to this environmental mitigation strategy. Despite governmental incentives and the demonstrated financial viability of these systems, their adoption remains disappointingly low. We hypothesized that one of the barriers for RPV adoption is the lack of understanding of the financial benefits of the RPV deal by roof owners’ households. This study, conducted in the Israeli context, examines the question whether clarifying the financial aspects of the RPV deal would increase RPV adoption among households.
PV systems can be incorporated in a centralized or distributed fashion, including dual-land-usage sites, such as rooftops, parking lots, cemeteries, and water reservoirs. The interplay between ground and dual-use facilities presents a complex quandary: larger, centralized ground facilities offer cheaper electricity production through economies of scale, albeit with significant land usage [1]. Conversely, dual-use PV facilities are costlier but less land intensive. Decentralized small PV sources also have several distinct advantages, including reliable power supply, minimized energy transmission losses due to proximity to consumption areas, the potential for deferring costly transmission network upgrades, distributed profit-sharing opportunities, job creation, and enhanced energy-saving awareness [2,3].
Considering these benefits and notwithstanding higher initial costs, several countries actively encourage residents to become prosumers (producers–consumers of energy) by installing small, distributed RPV systems on their rooftops. Feed-in tariffs, which are pre-agreed, long-term rates that state entities commit to buying electricity, are the most common incentive for prosumers [4,5]. These tariffs are set based on system size, technology, quality, and grid connection type, and are designed to ensure a satisfactory return on investment.
From the household’s point of view, installing RPV systems requires substantial initial capital expenditure, making it a high-stakes decision. Potential adopters are confronted with a complex decision matrix, balancing the promised financial returns and environmental contributions against the high initial costs of the system, long payback periods, perceived risks associated with innovative technology, trust in governmental entities, and the lack of knowledge and uniformity, often leading individuals to default to the status quo in times of uncertainty [6]. Table 1 and Table 2 outline the literature on household motivations and barriers to RPV adoption.
Our research offers a unique dimension by investigating the role of visual financial cues in shaping ITA RPV, presented through artificial fictive electricity bills. Grounded in Larrick et al.’s [40] recommendations of using expanded scales when presenting metrics of expensive energy-related products and drawing inspiration from Allcott’s [41] behavioral inquiries using electricity bills, this study hypothesizes that incorporating long-term financial benefits into monthly bills may enhance prospective adopters’ perception of the RPV investment.
Additionally, we scrutinize an overlooked factor in RPV adoption: the perceived value of existing rooftop usages [19]. We hypothesize that the type and utilization of a rooftop—whether for leisure, gardening, or storage—could influence its perceived value, thereby negatively affecting the ITA RPV.
Yet another unique dimension of our study is the exploration of the link between households’ trust in institutional entities, specifically the government and the electricity company, and ITA RPV systems. This extends the findings of Petrovich et al. [36], who noted that the ITA RPV declines when there’s a perception of increased policy risk. Our research investigates whether trust in these critical institutions could significantly influence long-term investment decisions in this area.
This study employs a stated preference approach, utilizing an online survey to evaluate whether the presentation of a revenue graph, detailed financial information, or a combination thereof impacts ITA RPV. These innovative methods aim to provide answers to pivotal queries from potential RPV adopters, such as the expected total revenue, return on investment, and payback period.
Situated in Israel—a country with ambitious renewable energy targets but low RPV adoption rates—this research holds implications for energy policy in other countries. Through the focus on financial nudges and the under-investigated variable of perceived rooftop value, this study offers a nuanced understanding of the complex decision-making processes behind RPV adoption.
As presented in Figure 1, the state of Israel has incentivized small PV systems since 2008 (the tariff declines in correspondence with the decline in PV panel prices—aiming to be attractive for the households, and yet to minimize its effect on the cost of living). Yet, till 2022, approximately 3% of Israel’s attached houses are covered by PV panels (see calculation in Appendix A). The Israeli backdrop serves as a compelling case study given its combination of high solar irradiance, and significant governmental backing for renewable energy. Government Decision 465 (2020) underscores Israel’s targets: 20% renewable energy by 2025 and 30% by 2030. Therefore, understanding the behavioral nuances that influence RPV adoption in such an environment is not just nationally relevant, but holds wider implications for countries with similar characteristics or aspirations.
Feed-in tariffs in Israel are designed to incentivize the adoption of smaller RPV systems, encouraging residents to become energy producers. However, despite these tariffs, there is a significant gap between policy goals and the actual adoption rates, prompting a need for further investigation. We conclude that the decision on RPV adoption is “not all about the money”, and other factors are playing important role. The study conclusions might also apply to other countries willing to promote RPV penetration without harming the cost of living.
This study also embarks few methodological innovations. We employed fictive electricity bills to simulate real-world conditions, thus bypassing the limitations associated with an inability to alter actual utility bills. By doing so, it aims to gauge the influence of financial nudges more accurately on ITA, offering a robust methodological framework for similar studies in the future. This research also contributes to the field by focusing on the often-neglected aspect of perceived rooftop value. With its multifaceted approach, this study enriches the scholarly conversation on renewable energy adoption and provide practical insights for policy-making and public engagement strategies.
The rest of this paper is structured as follows: First, we describe the variables and the examined hypotheses on the relations among them. Then, we present the methods we used to collect and test our hypotheses and a description of the sample. This is followed by the results, a discussion, and a conclusion section summarizing the main research findings, recommendations for action, research limitations, and future research.
2. Materials and Methods
To evaluate whether explicitly presenting financial information could accelerate the diffusion of the innovation to potential adopters, this study utilized a stated preference approach. The section outlines the variables and hypotheses, methodology, and data.
2.1. Variables and Hypotheses
In this study, we expanded upon the model proposed by Wolske et al. [12] for intent to install RPV systems. We incorporated additional independent variables related to the respondents’ characteristics, inspired by the model’s original variables: novelty seeking, pro-environmental behavior, trust in government and electricity companies, gender, income, education, age, urban or rural residence, proximity to other PV systems, and acquaintances with PV. We further introduced two additional independent variables related to roof features: roof type (e.g., flat or tiles) and roof usage (e.g., storage or leisure). We hypothesized that these variables could significantly influence the decision-making process for RPV adoption.
Our study examined two dependent variables:
- The level of financial comprehension of the deal was measured through three quantitative open-ended questions regarding average monthly revenue, total accumulated revenues over the system’s lifetime, and the payback period in years.
- The ITA an RPV system, measured similarly to [12,15], as the average of three 1 to 5 Likert scale questions. Similarly to Mundaca and Samahita [15] and Ahmar et al. [42], we constructed an ordinal logistic regression model to predict the ITA of a roof owner given the explanatory variables. The model is defined as:where is the ITA RPV of household i; α is the constant regression cut; is the value of explanatory variable k for household i, with the coefficient , and the stochastic standard error .
Our research, presented in Figure 2 investigates the following hypotheses:
- H1. The presentation of accumulated financial information about the RPV deal directly increases the ITA RPV.
- H2. The presentation of accumulated financial information affects the comprehension of the RPV deal.
- H3. For a financially viable RPV deal, better comprehension of the deal increases the ITA of an RPV project.
- H4. RPV-specific beliefs and attitudes have an impact on the ITA an RPV project.
- H5. Respondents’ characteristics influence the ITA an RPV project.
- H6. Roof characteristics influence the ITA an RPV project.
- H7. Respondents’ characteristics have an impact on the perceived roof value.
- H8. Roof characteristics have an impact on the perceived roof value.
- H9. Households that perceive high value to their roof have lower ITA an RPV project.
2.2. Data Acquisition
To test these hypotheses, we conducted an online survey. The target population consisted of households in Israel that own detached houses and have not installed a PV system. The survey flow included stratified sampling according to known demographic distribution, consent to participate, screening questions, socio-demographic characteristics, roof characteristics, and a series of questions related to RPV adoption, financial comprehension, and RPV-specific beliefs and attitudes.
We designed a fictive April 2022 electricity bill simulating a resident with a 15 kW PV system installed 25 months ago. The hypothetic purchase is based on characteristics of an actual system: Purchasing and installing such a system cost approximately ILS 80,000 (approximately 23,000 USD, in 2022 prices). Assuming 1700 effective sunlight hours per year, a conservative degradation rate of 1% per year in panels efficiency [43], maintenance costs of 1% per year, and a constant feed-in tariff (FIT) of ILS 0.48 per generated kWh, with 3% annual real interest rate and project duration of 25 years. The conservative estimation reveals RPV as a highly profitable endeavor. The expected return on investment (ROI) is estimated to reach 140%, a net present value (NPV) of 112,000 ILS (more than 30,000 USD), an internal rate of return (IRR) of 12.7%, and a payback period of approximately 9 years. Yet this information is not evident to the average household. A typical electricity bill summarizes the periodic (monthly) electricity consumption and electricity generation, but it does not contain the accumulated revenues from the PV system.
To examine H1, we designed four electricity bills, with various types of information regarding revenues from RPV. Each respondent was randomly assigned to one of four groups and was presented with a corresponding electricity bill (see Figure S1 in the Supplementary Materials):
- Control: as-is electricity bill, with no accumulated revenue information.
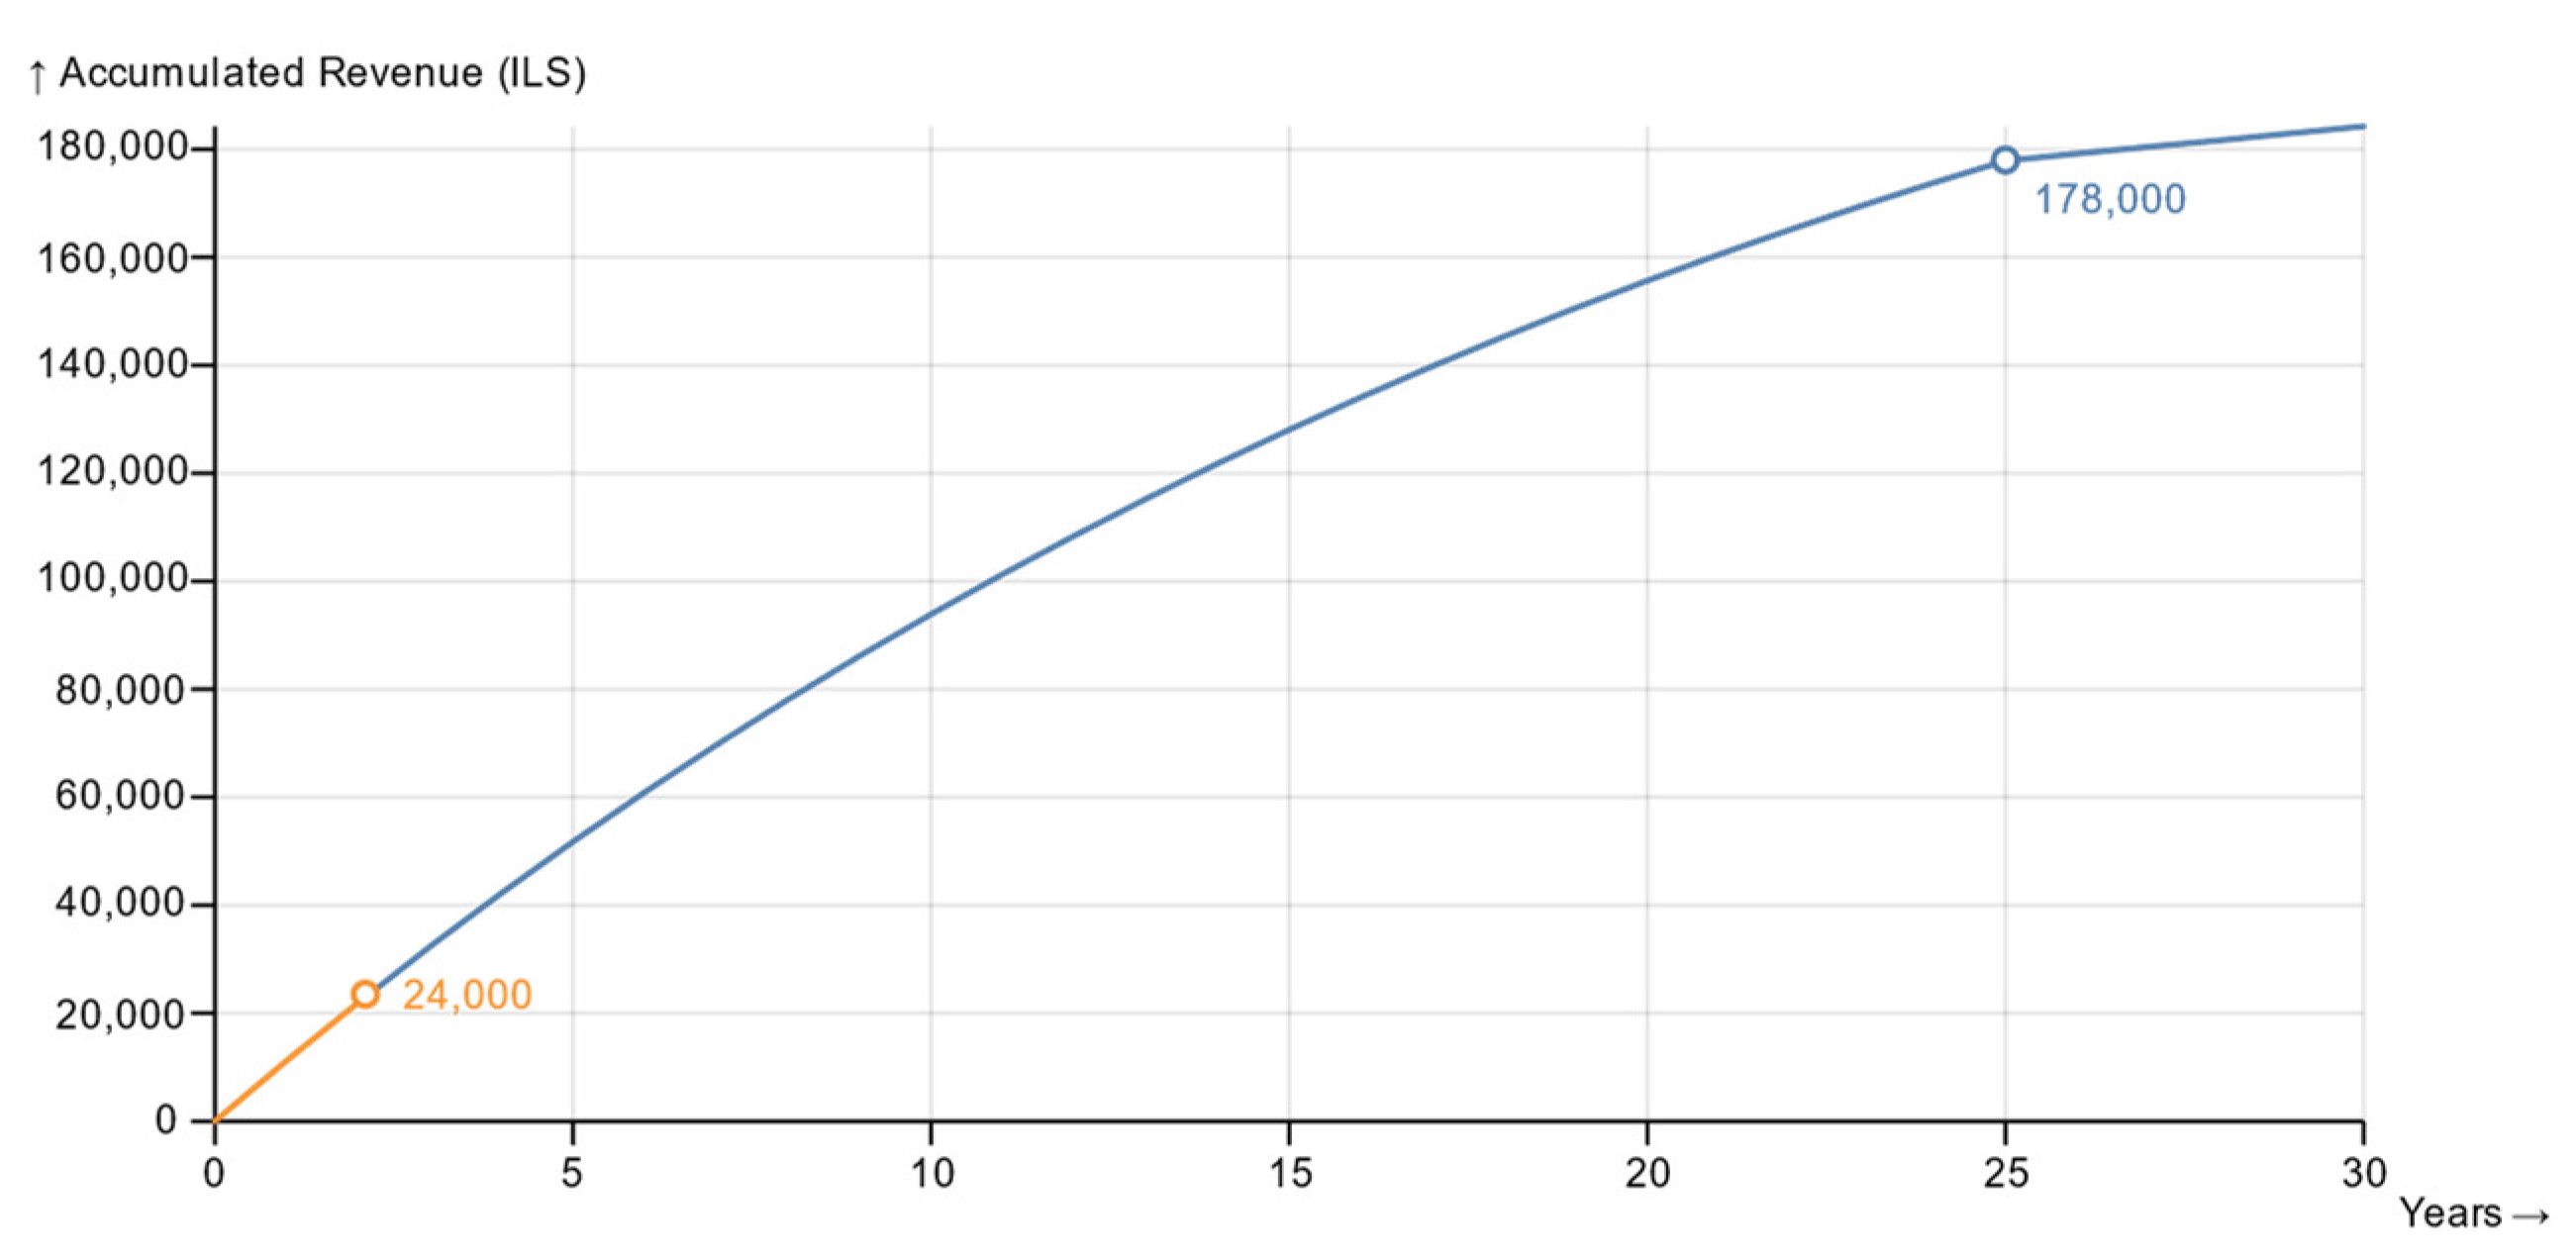
- Graph—as-is bill + past and future revenues flow graph, as presented in Figure 3.
- Text of financial information—as-is bill + the following concise text description summarizing the revenues in accepted financial indices:“The contract with the electricity company is for 25 years in which it undertakes to purchase the electricity you will generate for 0.48 ILS per kWh. Your system capacity is 15 kW. The system was installed 25 months ago. Till today, the system revenues are 23,507 ILS. The system is expected to create a total revenue of 178,000 ILS. Assuming the system cost was 80,000 ILS, the payback period is 9 years, the expected return on investment is 140%, and the internal return rate is 12.7% per year”.
- Both—combined display of graph and financial information.
To test the hypotheses, we designed a questionnaire inspired by similar previous research [12,15,44]. The target population is residential roof owners who don’t have a PV system. Hence, we screened out participants that did not satisfy these two conditions. We made sure to keep the questionnaire at a reasonable length and not tedious. When translating or adapting to Hebrew, we paid attention to wording that is short, specific, neutral, and gender-agnostic. Once we had an initial draft, we validated the questionnaire by ten scholar experts in the fields of economic and environmental behavior. After we compiled the experts’ feedback, we conducted a pilot among ten respondents in the target population. The full questionnaire and the conditional information displays are shown in the Supplementary Materials S1 and S2.
Due to budget constraints, two online surveys were conducted in March 2022 and January 2023 (see Table 3). We worked with a market research company that manages a panel of members willing to participate in questionnaires for a nominal fee (shopping vouchers worth approximately ILS 12). The online panel contains approximately 50,000 active members aged 18 and over. The panel is a representative sample of the Jewish population in Israel. The panel administrators invite members to participate in the sample and validate that there will be no significant deviation from four controlled variables whose distribution has been defined in advance according to their distribution in the population: gender, age group (6 age groups), geographic area code (5 areas) and proximity to religion (4 categories—to avoid overrepresentation of Jews ultra-Orthodox Jews). The average survey response time was 13 min. Participants who completed the questionnaire in less than 5 min were filtered out to avoid guesswork, yielding a unified dataset of 899 valid cases. The two surveys were mostly identical, except few differences, as described below.
Table 4 and Table 5 show descriptive statistics of the sample and compare them to the general Israeli population in the census. The sample distribution does not deviate from the census in terms of gender, age, and the number of persons in a household. The distribution of urban respondents in the sample is smaller compared to the population, as the target population is roof owners who are typically located in rural areas. The household income average was significantly lower than the population mean, possibly due to respondent’s confusion between individual vs. household incomes. Supplementary Material S3 presents the distribution of the respondents among the four condition groups.
3. Results
The report of findings of our research starts with discussing the valuation of perceived roof value and how it correlates with the characteristics of the participants. Next, we delve into the primary reasons cited by participants for not yet RPV systems. Subsequently, we explore the impact of how information was presented on participants’ comprehension of RPV deals. Lastly, we scrutinize the interrelationships between diverse factors and the ITA RPV.
3.1. Perceived Roof Value
We applied a willingness-to-accept (WTA) methodology [47,48] to calculate the value households attribute to their “free” roof. This approach allows us to conduct a comprehensive cost-benefit analysis, factoring in the alternative value of the roof’s use under current conditions. We employed a single-bounded dichotomous choice model for this study. Each participant was presented with a random compensation bid to consider in exchange for relinquishing his current use of the roof. This WTA compensation format was chosen as the most fitting way to guide participants in quantifying the value they place on their current rooftop usage.
The WTA-specific bids to compensate for relinquishing the current use of the roof and the correspondent ITA RPV are presented in Table 6. In all bids, the mean ITA RPV was higher among those who accepted the bid. This difference was statistically significant in four of five bids. Table 7 presents a logistic regression analysis predicting the WTA (“yes” answers) ratio. The model accounted for 69.2% of the variation (C statistic = 0.692, R2 = 11.48%).
Following Hanemann [47], we utilized the regression equation to estimate the value of having a “free” roof (Figure 4). The estimated roof value is computed by the area enclosed between the distribution function and the Y-axis, which yielded 62,134 ILS. The significantly high roof value exceeds four times the median household monthly net income [46].
3.2. Stated Reasons for Non-Adoption
At the beginning of the survey, participants were prompted to “choose the reasons you have not yet installed a PV system” from a pre-established list of options. The results are presented in Figure 5. The most selected reasons were the need for initial capital investment, chosen by 54% of respondents, and a lack of information, selected by 42%. Notably, 17% of participants cited a fear of electromagnetic radiation as a deterrent, a factor that, to the best of our knowledge, has not been previously highlighted in existing literature.
Grouping the selected options according to their main reasons revealed that economic considerations (82% of respondents) and lack of information (52% of respondents) were the leading factors. The high weight of economic reasons supports our research hypothesis that improving financial comprehension of the deal may enhance the ITA a PV system.
3.3. Comprehension of the RPV Deal
We administered three questions that necessitated respondents to scrutinize the displayed electricity bill to provide accurate answers. These questions aimed to gauge the participants’ understanding of three essential aspects of the RPV deal. For each of these questions, we established a range of values that would be considered as correct answers. Table 8 outlines these acceptable ranges and analyzes the variations in comprehension across the four different condition groups using a Chi-square test for statistical evaluation.
A statistically significant difference was observed among the treatment vs. control groups. Respondents in the “Fin” (financial description) and “Both” (financial description and graph) groups provided more accurate answers to the question concerning the cumulative revenue. Consequently, we can confirm Hypothesis 2, which posits that the presentation of cumulative financial information has a meaningful impact on respondents’ comprehension of the RPV deal.
3.4. Intent-to-Adopt RPV
The ITA variable was measured using three items (1 to 5 Likert scale, Cronbach’s alpha = 0.88), as shown in Table S4 (in Supplementary Materials). We found no significant difference between the four groups on any item (Kruskal–Wallis Test).
As the average of the ITA items did not pass normal distribution tests (visual, Shapiro–Wilk, Kolmogorov–Smirnov, Anderson–Darling tests), we transformed the continuous variable (average) into an ordinal variable with four bins: Low (1–2), Medium-low (2–3), Medium-high (3–4), and High (4–5). We then used a-parameterized statistical tests. Tables S4 and S5 (in the Supplementary Materials) present the relationships between the categorical and numeric variables to the ITA.
We applied a stepwise selection method and p-value threshold of 5%. We repeated the analysis in three hierarchy levels of the independent variables, as shown in Table 9. In the first level, we entered only the presented information group (3 condition groups and the control group as a reference) and the three comprehension items. In the second level, we added socio-economic characteristics and roof characteristics. In the third level, we introduced the RPV-specific beliefs and attitudes.
The most robust model for predicting the ITA the RPV systems accounted for 41% of the variance. The analysis underscores the significance of various factors, presented here in descending order of importance. The perception of RPV systems offering personal and financial advantages over the current situation emerged as particularly significant. This was followed by the subjective belief that using RPV is a social norm. The characteristics of the roof, specifically having a pitched, tiled surface that is currently idle, also played a role. For households with lower incomes, the potential revenues from the system carry more weight in the decision-making process. Since RPV is seen as a novel innovation, many prospective users are inclined to experiment on a small scale before fully committing. Understanding RPV’s personal financial and broader environmental benefits necessitates a certain educational background. Additionally, some potential adopters feel hindered by perceived behavioral controls, thinking, “I want to, but I can’t”. The inclination to be an early adopter of new technology, trust in the electric company, existing environmental behavior, and apprehensions about unpredictable maintenance costs due to the technology’s novelty also factored into the intention to adopt RPV systems.
4. Discussion
Figure 6 provides a summary of the statistically significant findings related to our initial hypotheses. Contrary to our central hypothesis (H1), this study found no direct relationship between the way accumulated financial information about RPV systems is presented and the intention to adopt for this sample. Partial support was found for Hypothesis 2 (H2), indicating that presenting accumulated financial data does enhance the precision of understanding cumulative revenue, though it does not necessarily affect the ITA. This lends partial credence to Hypothesis 3 (H3), as a better comprehension of the payback period and monthly revenue correlates positively with ITA. The findings highlight a disconnect between how the RPV deal’s information is presented and understood, and the ensuing ITA, explaining why H1 could not be confirmed in the sample despite partial confirmations for H2 and H3.
For Hypothesis 4 (H4), all RPV-specific beliefs and attitudes stemming from Wolske et al. [12] were confirmed. In terms of Hypothesis 5 (H5), several variables were identified that positively correlate with the ITA, such as early adopters, pro-environmental behavior, men, age between 35 and 60 years, higher education, trust in authorities (governmental and electrical entities) and acquaintances with PV. We confirmed Hypothesis 6 (H6) and found that flat roofs and roofs used for leisure have a negative correlation with ITA, while tiled roofs have a positive correlation. We could not confirm Hypothesis 7 (H7) as we did not find a significant relationship between the respondent characteristics and the “perceived value of the free roof”. We confirmed Hypothesis 8 (H8), showing that both roof usage and roof type affect the perceived roof value which presents the opportunity cost for the RPV system. Notably, leisure usage was the most valuable, discouraging people from adopting RPVs. Hypothesis 9 (H9) revealed that in four out of five bids, significantly higher ITA was observed among those who accepted the offered WTA bid for roof services compared to those who refused. This suggests that the “perceived roof value” as an opportunity cost is an important factor affecting ITA that was previously overlooked.
To summarize, this study confirms the complexity of factors that contribute to RPV adoption, including financial comprehension, social norms, and institutional trust. This study confirmed previous research findings on the relationship between innovative behavior, pro-environmental stance, and ITA for RPV systems [12,15,19]. It also added contextual insights, indicating that the observed lack of trust in governmental and electrical institutions in the Israeli setting [49] could hinder ITA. This aligns with the national political instability and broken promises from politicians.
5. Conclusions
Our research contributes unique and significant insights into the realm of RPV system adoption in Israel, a context where government incentives exist but uptake remains surprisingly low. Despite our conservative estimates revealing a strong financial case for RPV adoption—with a net present value exceeding 100,000 ILS and an internal rate of return of approximately 13% per year—household adoption is not commensurate with these promising financial metrics.
One intriguing finding is the high value that households assign to their roof amenities, calculated as much as 62,134 ILS in our WTA analysis. This consideration substantially erodes the net present value to approximately 40,000 ILS—still financially viable but less attractive if the opportunity costs of roof usage are factored in.
We explored the influence of presenting cumulative financial information to potential adopters, presuming that a clearer depiction of long-term gains would nudge decisions in favor of RPV adoption. Contrary to our hypothesis, the presentation of financial data had no significant impact on the intention to adopt (ITA) an RPV system. While financial considerations are indeed important in making the RPV decision, and the way the financial information was presented did affect the financial comprehension of the RPV deal, we found no relationship between the presented financial information and the ITA an RPV system.
This gap between our hypothesis and the actual results warrants further discussion. Wolske et al. [50] found that customers were not sensitive to financial information in the initial marketing stages of solar systems. This apparent paradox—that financial motivations are crucial yet insufficient—raises critical questions. It suggests that financial metrics may only come into play in later stages of decision making. Indeed, in the Israeli context, with its unique set of circumstances like high living costs and security concerns, households lack an immediate “need or problem recognition” [51] to install solar systems. Climate and renewable energy discussions are notably absent in both social and official channels, leaving renewable energy, quite literally, off the rooftop and out of mind.
Aligned with Petrovich et al. [36] conclusion that mitigating RPV policy risks could be more effective than increasing the level of financial incentives, we recommend enhancing trust in RPV deals through solid contracts or trusted third-party involvement (e.g., banks or insurance companies which are trusted for the long-term). These could be an important step in overcoming skepticism. Policy makers in Israel must also demonstrate unwavering commitment to climate action and sustainable energy, providing consistent policies that cultivate an individual sense of urgency to act.
We acknowledge that this study has some limitations. The interest rate environment at the time of our study in early 2022 was quite different from current conditions. Changes in economic variables like interest rates could affect future research findings. Moreover, our research highlighted a disconnection between financial comprehension and RPV adoption in the sample. Subsequent studies should explore how tweaking the presentation of financial metrics can affect RPV uptake.
To robustly address these issues, we propose future research utilizing experimental economic methods to mimic “real-world” conditions. Specifically, natural experiments where participants are provided with specific, personalized information about their own rooftops, and where their actual decisions are monitored over time. These could offer a more nuanced understanding of the myriad factors influencing RPV adoption and could inform more effective strategies to bolster its uptake.
To conclude, RPV adoption is a high involvement consumer decision. Households’ considerations are complex. Financial aspects are important, but the decision is “not all about the money”. These insights provide valuable guidance for policy makers, researchers, and industry stakeholders, all striving to expedite the shift towards sustainable energy solutions.
Supplementary Materials
The following supporting information can be downloaded at: https://0-www-mdpi-com.brum.beds.ac.uk/article/10.3390/en17092043/s1, S1. Survey Questionnaire; S2. Controlled Information Presentation; S3. Descriptive Statistics of Four Condition Groups in the Sample; S4. Univariate Analysis of ITA RPV.
Author Contributions
Conceptualization, D.B.; Writing—original draft, D.B.; Writing—review & editing, R.R.P. and O.A.; Supervision, R.R.P. and O.A. All authors have read and agreed to the published version of the manuscript.
Funding
This research was funded by a grant from the rector of the University of Haifa for contributing to the UN’s Sustainable Development Goals (SDGs), particularly to SDG 7: affordable and clean energy (date: February 2022).
Data Availability Statement
The original contributions presented in the study are included in the article and Supplementary Materials, further inquiries can be directed to the corresponding author.
Conflicts of Interest
The authors declare no conflicts of interest.
Appendix A
Estimation of the RPV Implementation Ratio in Israel
We estimated the ratio of residential roofs covered with PV systems. According to the electricity company (in reply to an information request), in July 2023, there were 16,290 PV systems with a capacity of less than 20 kW. To estimate the number of residential roofs in Israel, we found that, in 2018, 24% of households lived in detached houses (https://www.cbs.gov.il/he/mediarelease/doclib/2021/445-1/15_21_445t3.pdf, accessed on 1 September 2023), and the number of households was 2,587,100 (https://www.cbs.gov.il/he/publications/LochutTlushim/2020/mb_years.xlsx, accessed on 1 September 2023). Hence, the number of detached houses in 2018 was 620,904. Assuming that the number of detached houses remained constant till 2023, only 2.6% of detached residences are covered by PV systems.
References
- Lakhani, R.; Doluweera, G.; Bergerson, J. Internalizing land use impacts for life cycle cost analysis of energy systems: A case of California’s photovoltaic implementation. Appl. Energy 2014, 116, 253–259. [Google Scholar] [CrossRef]
- Kleiner, A. The Added Benefit of Solar Facilities on Roofs; Israel Minister of Energy: Jerusalem, Israel, 2017. (In Hebrew)
- Israeli Electricity Authority. Increasing the Electricity Production Targets in Renewable Energies for 2030; Israeli Electricity Authority: Haifa, Israel, 2020. Available online: https://www.gov.il/he/departments/publications/reports/2030_final (accessed on 1 September 2023).
- Cots, F. Engaging Citizens and Local Communities in the Solar Revolution; Rooftop solar PV Country Comparison Report; Climate Action Network: Ixelles, Belgium, 2022. [Google Scholar]
- Dijkgraaf, E.; Van Dorp, T.P.; Maasland, E. On the Effectiveness of Feed-in Tariffs in the Development of Solar Photovoltaics. Energy J. 2018, 39, 81–100. [Google Scholar] [CrossRef]
- Samuelson, W.; Zeckhauser, R. Status quo bias in decision making. J. Risk Uncertain. 1988, 1, 7–59. [Google Scholar] [CrossRef]
- Li, L.; Dai, C. Internal and External Factors Influencing Rural Households’ Investment Intentions in Building Photovoltaic Integration Projects. Energies 2024, 17, 1071. [Google Scholar] [CrossRef]
- Stanisławska, M. An Examination of Households’ Attitudes towards Renewable Energy Source Investments in Lower Silesian Voivodeship. Energies 2023, 16, 7100. [Google Scholar] [CrossRef]
- Karneyeva, Y.; Wüstenhagen, R. Solar feed-in tariffs in a post-grid parity world: The role of risk, investor diversity and business models. Energy Policy 2017, 106, 445–456. [Google Scholar] [CrossRef]
- Klein, M.; Deissenroth, M. When do households invest in solar photovoltaics? An application of prospect theory. Energy Policy 2017, 109, 270–278. [Google Scholar] [CrossRef]
- Moezzi, M.; Ingle, A.; Lutzenhiser, L.; Sigrin, B. A Non-Modeling Exploration of Residential Solar Photovoltaic (PV) Adoption and Non-Adoption; National Renewable Energy Laboratory: Golden, CO, USA, 2017; NREL/SR–6A20-67727, 1379469. [CrossRef]
- Wolske, K.S.; Stern, P.C.; Dietz, T. Explaining interest in adopting residential solar photovoltaic systems in the United States. Energy Res. Soc. Sci. 2017, 25, 134–151. [Google Scholar] [CrossRef]
- Jacksohn, A.; Grösche, P.; Rehdanz, K.; Schröder, C. Drivers of renewable technology adoption in the household sector. Energy Econ. 2019, 81, 216–226. [Google Scholar] [CrossRef]
- Bao, Q.; Sinitskaya, E.; Gomez, K.J.; MacDonald, E.F.; Yang, M.C. A human-centered design approach to evaluating factors in residential solar PV adoption: A survey of homeowners in California and Massachusetts. Renew. Energy 2020, 151, 503–513. [Google Scholar] [CrossRef]
- Mundaca, L.; Samahita, M. What drives home solar PV uptake? Subsidies, peer effects and visibility in Sweden. Energy Res. Soc. Sci. 2020, 60, 101319. [Google Scholar] [CrossRef]
- Stauch, A.; Gamma, K. Cash vs. solar power: An experimental investigation of the remuneration-related design of community solar offerings. Energy Policy 2020, 138, 111216. [Google Scholar] [CrossRef]
- Zander, K.K. Unrealised opportunities for residential solar panels in Australia. Energy Policy 2020, 142, 111508. [Google Scholar] [CrossRef]
- Colasante, A.; D’Adamo, I.; Morone, P. Nudging for the increased adoption of solar energy? Evidence from a survey in Italy. Energy Res. Soc. Sci. 2021, 74, 101978. [Google Scholar] [CrossRef]
- Schulte, E.; Scheller, F.; Sloot, D.; Bruckner, T. A meta-analysis of residential PV adoption: The important role of perceived benefits, intentions and antecedents in solar energy acceptance. Energy Res. Soc. Sci. 2022, 84, 102339. [Google Scholar] [CrossRef]
- Ruokamo, E.; Laukkanen, M.; Karhinen, S. Innovators, followers and laggards in home solar PV: Factors driving diffusion in Finland. Energy Res. Soc. Sci. 2023, 102, 103183. [Google Scholar] [CrossRef]
- Karakaya, E.; Sriwannawit, P. Barriers to the adoption of photovoltaic systems: The state of the art. Renew. Sustain. Energy Rev. 2015, 49, 60–66. [Google Scholar] [CrossRef]
- Engelken, M.; Römer, B.; Drescher, M.; Welpe, I. Why homeowners strive for energy self-supply and how policy makers can influence them. Energy Policy 2018, 117, 423–433. [Google Scholar] [CrossRef]
- Karytsas, S.; Vardopoulos, I.; Theodoropoulou, E. Factors Affecting Sustainable Market Acceptance of Residential Microgeneration Technologies. Energies 2019, 12, 3298. [Google Scholar] [CrossRef]
- Dharshing, S. Household dynamics of technology adoption: A spatial econometric analysis of residential solar photovoltaic (PV) systems in Germany. Energy Res. Soc. Sci. 2017, 23, 113–124. [Google Scholar] [CrossRef]
- Palm, A. Peer effects in residential solar photovoltaics adoption—A mixed methods study of Swedish users. Energy Res. Soc. Sci. 2017, 26, 1–10. [Google Scholar] [CrossRef]
- Curtius, H.C.; Hille, S.L.; Berger, C.; Hahnel, U.J.J.; Wüstenhagen, R. Shotgun or snowball approach? Accelerating the diffusion of rooftop solar photovoltaics through peer effects and social norms. Energy Policy 2018, 118, 596–602. [Google Scholar] [CrossRef]
- Barton-Henry, K.; Wenz, L.; Levermann, A. Decay radius of climate decision for solar panels in the city of Fresno, USA. Sci. Rep. 2021, 11, 8571. [Google Scholar] [CrossRef] [PubMed]
- Lukanov, B.R.; Krieger, E.M. Distributed solar and environmental justice: Exploring the demographic and socio-economic trends of residential PV adoption in California. Energy Policy 2019, 134, 110935. [Google Scholar] [CrossRef]
- Reames, T.G. Distributional disparities in residential rooftop solar potential and penetration in four cities in the United States. Energy Res. Soc. Sci. 2020, 69, 101612. [Google Scholar] [CrossRef]
- Wolske, K.S. More alike than different: Profiles of high-income and low-income rooftop solar adopters in the United States. Energy Res. Soc. Sci. 2020, 63, 101399. [Google Scholar] [CrossRef]
- O’Shaughnessy, E.; Barbose, G.; Wiser, R.; Forrester, S.; Darghouth, N. The impact of policies and business models on income equity in rooftop solar adoption. Nat. Energy 2021, 6, 84–91. [Google Scholar] [CrossRef]
- Palm, A.; Lantz, B. Information dissemination and residential solar PV adoption rates: The effect of an information campaign in Sweden. Energy Policy 2020, 142, 111540. [Google Scholar] [CrossRef]
- Bauner, C.; Crago, C.L. Adoption of residential solar power under uncertainty: Implications for renewable energy incentives. Energy Policy 2015, 86, 27–35. [Google Scholar] [CrossRef]
- Sussman, R.; Chikumbo, M.; Gifford, R. Message framing for home energy efficiency upgrades. Energy Build. 2018, 174, 428–438. [Google Scholar] [CrossRef]
- De Groote, O.; Verboven, F. Subsidies and time discounting in new technology adoption: Evidence from solar photovoltaic systems. Am. Econ. Rev. 2019, 109, 2137–2172. [Google Scholar] [CrossRef]
- Petrovich, B.; Carattini, S.; Wüstenhagen, R. The price of risk in residential solar investments. Ecol. Econ. 2021, 180, 106856. [Google Scholar] [CrossRef]
- Sommerfeldt, N.; Lemoine, I.; Madani, H. Hide and seek: The supply and demand of information for household solar photovoltaic investment. Energy Policy 2021, 161, 112726. [Google Scholar] [CrossRef]
- Gillingham, K.; Deng, H.; Wiser, R.; Darghouth, N.; Nemet, G.; Barbose, G.; Rai, V.; Dong, C. Deconstructing Solar Photovoltaic Pricing. Energy J. 2016, 37, 231–251. [Google Scholar] [CrossRef]
- O’Shaughnessy, E.; Margolis, R. The value of price transparency in residential solar photovoltaic markets. Energy Policy 2018, 117, 406–412. [Google Scholar] [CrossRef]
- Larrick, R.P.; Soll, J.B.; Bruner Keeney, R.L. Designing better energy metrics for consumers. Behav. Sci. Policy 2015, 1, 63–75. [Google Scholar] [CrossRef]
- Allcott, H. Social norms and energy conservation. J. Public Econ. 2011, 95, 1082–1095. [Google Scholar] [CrossRef]
- Ahmar, M.; Ali, F.; Jiang, Y.; Alwetaishi, M.; Ghoneim, S.S.M. Households’ Energy Choices in Rural Pakistan. Energies 2022, 15, 3149. [Google Scholar] [CrossRef]
- Deline, C.; Jordan, D.; Sekulic, B.; Parker, J.; McDanold, B.; Anderberg, A. PV Lifetime Project—2021 NREL Annual Report; National Renewable Energy Laboratory: Golden, CO, USA, 2021; NREL/TP-5K00-81172. Available online: https://www.nrel.gov/docs/fy22osti/81172.pdf (accessed on 1 September 2023).
- Abreu, J.; Wingartz, N.; Hardy, N. New trends in solar: A comparative study assessing the attitudes towards the adoption of rooftop PV. Energy Policy 2019, 128, 347–363. [Google Scholar] [CrossRef]
- Israel Census Bureau. Population—Statistical Abstract of Israel 2022—No. 73. 2022. Available online: https://www.cbs.gov.il/en/publications/Pages/2022/Population-Statistical-Abstract-of-Israel-2022-No.73.aspx (accessed on 1 September 2023).
- Israel Census Bureau. Household Income and Expenditure, Data from the 2020 Household Expenditure Survey—General Summary. 2023. Available online: https://www.cbs.gov.il/en/publications/Pages/2023/Household-Income-and-Expenditure-Data-From-the-2020-Household-Expenditure-Survey–General-Summary.aspx (accessed on 1 September 2023).
- Hanemann, M. Welfare Evaluations in Contingent Valuation Experiments with Discrete Responses. Am. J. Agric. Econ. 1984, 66, 332–341. [Google Scholar] [CrossRef]
- Whittington, D.; Adamowicz, W.; Lloyd-Smith, P. Asking Willingness-to-Accept Questions in Stated Preference Surveys: A Review and Research Agenda. Annu. Rev. Resour. Econ. 2017, 9, 317–336. [Google Scholar] [CrossRef]
- Michaels, L.; Parag, Y. Motivations and barriers to integrating ‘prosuming’ services into the future decentralized electricity grid: Findings from Israel. Energy Res. Soc. Sci. 2016, 21, 70–83. [Google Scholar] [CrossRef]
- Wolske, K.S.; Todd, A.; Rossol, M.; McCall, J.; Sigrin, B. Accelerating demand for residential solar photovoltaics: Can simple framing strategies increase consumer interest? Glob. Environ. Chang. 2018, 53, 68–77. [Google Scholar] [CrossRef]
- Bruner, G.C.; Pomazal, R.J. Problem recognition: The crucial first stage of the consumer decision process. J. Serv. Mark. 1988, 2, 43–53. [Google Scholar] [CrossRef]
Figure 1.
History of feed-in tariffs for small PV systems (in ILS, per generated kWh. One ILS is lower than approximately a-quarter of a USD).
Figure 1.
History of feed-in tariffs for small PV systems (in ILS, per generated kWh. One ILS is lower than approximately a-quarter of a USD).

Figure 2.
Research hypotheses.

Figure 3.
Revenues graph we presented in the experiment. Red: past revenues, Blue: future revenues.

Figure 4.
The value of current roof services. The circles indicate the estimated WTA for a given bid. The blue area represents the estimated value (in NIS) households assign to their “free” roofs.
Figure 4.
The value of current roof services. The circles indicate the estimated WTA for a given bid. The blue area represents the estimated value (in NIS) households assign to their “free” roofs.

Figure 5.
Selected reasons for not installing RPV.

Figure 6.
Summary of statistical tests for hypotheses. Statistically significant affecting variables are marked in color and stars * p < 0.05, ** p < 0.01, and *** p ≤ 0.001. Variables are sorted by their strength of effect. Numbers indicate regression coefficients, and +/− signs indicate a positive or negative difference or correlation.


Table 1.
Motivations to adopt RPV.
| Motivation/Factor | Reason | References |
|---|---|---|
| Perceived financial benefits, due to subsidies or electricity bill savings | There is a consensus that this is the most important factor | [7,8,9,10,11,12,13,14,15,16,17,18,19,20] |
| Self-sufficiency | People aspire to supply themselves with their own energy. It fulfills households’ desire to be more independent from the state, their utility provider, conventional energy sources, and rising energy prices | [18,21,22] |
| Novelty seeking, being a technology early adaptor | People with higher novelty seeking have greater interest in pursuing RPV | [12,19] |
| Pro-environmental behavior | Among early market stages | [12,17,18,19,20,22,23] |
| Peers effects and subjective norms | Among later adopters | [12,15,17,19,20,22,24,25,26,27] |
| Age | Younger tend more to adopt RPV | [12,15,23] |
| Gender | Men declared more ITA. But women found to actually adopt | [12,20,23] |
| Education | Education is needed to understand the financial cost and benefits of RPV | [12,20,28] |
| Rural location | Explained by higher distribution tariffs in rural areas of Finland | [20] |
| Socio-economic level, income | High income correlates with actual adoption Low- and moderate-income levels have similar ITA | [8,17,24,28,29,30,31] |
| Information campaigns | Information campaign had a significantly positive effect on PV adoption rates | [32] |
| System and installer reliabilities | Homeowners care about system reliability and ease of maintenance. In- staller’s reliability is potentially key to the long-term savings | [14] |
Table 2.
Barriers to adopting RPV.
| Barrier | Reason | References |
|---|---|---|
| High upfront cost | An RPV system costs tens of thousands of USD—a significant amount | [7,11,13,17] |
| Perceived as an innovation | Lack of trust in the new technology, fear of unexpected failures and high maintenance costs | [11,12,17] |
| Long-term deal and time discounting | The payback period is 5 to 10 years. People value today’s money more than future money | [5,20,33,34,35] |
| Uncertainty in government or market policies | Fear that the government will change the feed-in tariffs in the future, offer better deals, or that the price of energy will decrease | [7,9,15,33,36] |
| Lack of knowledge and poor information | People are not aware to the option of installing RPV | [12,20,37] |
| Lack of uniformity among system installers | A variety of technologies, layouts, and system sizes, making it hard to compare among offers | [38,39] |
Table 3.
Summary of samples.
| Sample | Date | No. of Participants | No. Passed Screening Questions | No. Duration > 5 min |
|---|---|---|---|---|
| A | March 2022 | 980 | 301 | 270 |
| B | January 2023 | 2779 | 822 | 629 |
Table 4.
Distribution of categorical variables in the sample compared to the Israeli Census.
| Sample N = 899, n (%) | Census [45] (%) | ||
|---|---|---|---|
| Gender (% Men) | 477 (53.1) | (49.6) | |
| Up to 35 | Age, years (%) | 244 (27.1) | (32.1) |
| 35 to 61 | 477 (53.1) | (49.1) | |
| 61 and above | 178 (19.8) | (18.7) | |
| Urban (% urban) | 655 (72.9) | (91) | |
| Education (% academic) | 568 (63.2) | (50.1) | |
| Household Income (% High = over the median 15,000 ILS), N = 814 | 147 (18.1) | (50) [46] | |
| Tiles | Roof type (%) * | 407 (45.3) | |
| Flat concrete | 453 (50.4) | ||
| Flat floored | 91 (10.1) | ||
| No use | Roof usage (%) * | 272 (30.3) | |
| Facilities | 545 (60.6) | ||
| Storage | 114 (12.7) | ||
| Leisure | 103 (11.5) |
* Roof type and roof usage were multiple-choice questions. Hence, the sums are greater than 100%.
Table 5.
Distribution of numeric variables in the sample.
| Range | Mean | SD | Median | |
|---|---|---|---|---|
| Household size (census = 3.23) | >1 | 3.9 | 1.9 | 4.0 |
| PV in neighborhood | ≥0 | 1.7 | 0.6 | 2.0 |
| Acquaintances with PV | ≥0 | 1.4 | 3.8 | 0.0 |
| Trust gov. | 1 to 5 | 2.7 | 1.0 | 3.0 |
| Trust IEC | 1 to 5 | 2.6 | 1.0 | 3.0 |
| Novelty seeking | 1 to 5 | 3.7 | 0.8 | 4.0 |
| Pro environmental | 1 to 5 | 3.0 | 0.8 | 3.0 |
Table 6.
Willingness to accept a bid for giving up the roof and its relation to ITA RPV.
| Bid (ILS) | Answer | N | Ratio “Yes” | ITA RPV Mean (SD) |
|---|---|---|---|---|
| 10,000 | “Yes” | 64 | 54.7% | 3.1 (0.9) ** |
| “No” | 53 | 2.8 (0.7) | ||
| 50,000 | “Yes” | 91 | 66.0% | 2.9 (0.8) |
| “No” | 48 | 2.7 (0.9) | ||
| 100,000 | “Yes” | 103 | 75.7% | 3.1 (0.8) *** |
| “No” | 33 | 2.1 (1.1) | ||
| 150,000 | “Yes” | 106 | 75.7% | 3.1 (0.7) ** |
| “No” | 34 | 2.7 (0.9) | ||
| 200,000 | “Yes” | 71 | 73.2% | 2.9 (0.9) *** |
| “No” | 26 | 2.2 (0.9) |
** p < 0.01, and *** p ≤ 0.001.
Table 7.
Logistic regression predicting the willingness to accept bid compensation for current roof services.
Table 7.
Logistic regression predicting the willingness to accept bid compensation for current roof services.
| b (S.E.) | |
|---|---|
| Bid | 0.29 (0.07) *** |
| Gender (Men) | |
| Urban | |
| Education | |
| Income | |
| Household size | |
| Age | |
| Roof type—Tiles | 0.40 (0.20) * |
| Roof type—Flat concrete | |
| Roof type—Flat floored | |
| Roof Usage—No use | 1.01 (0.38) ** |
| Roof usage: Storage | |
| Roof Usage—Facilities | |
| Roof Usage—Leisure | −1.32 (0.32) *** |
* p < 0.05, ** p < 0.01, and *** p ≤ 0.001.
Table 8.
Effect of presented information on deal comprehension.
| Correct Answer Range | Total N = 899 (100%) | Graph N = 217 (24.1%) | Fin N = 221 (24.6%) | Both N = 228 (25.4%) | Control N = 233 (25.9%) | p Value | |
|---|---|---|---|---|---|---|---|
| Monthly revenue (ILS) | 500 to 1500 | 654 (72.8) | 157 (72.4) | 162 (73.3) | 165 (72.4) | 170 (73.0) | 0.995 |
| Cumulative revenue (ILS) | 150,000 to 300,000 | 337 (37.6) | 72 (33.3) | 96 (43.4) | 94 (41.2) | 75 (32.5) | 0.032 |
| Payback period (years) | 6 to 9 | 453 (50.4) | 103 (47.5) | 115 (52.0) | 117 (51.3) | 118 (50.6) | 0.785 |
Table 9.
Ordinal logistic regression predicting ITA from different input variable sets.
| I | II | III | |
|---|---|---|---|
| b (S.E.) | b (S.E.) | b (S.E.) | |
| Information: Graph | |||
| Information: Finance | |||
| Information: Both | |||
| Information: Control | |||
| Comprehension: Monthly revenue | |||
| Comprehension: Cumulative revenue | |||
| Comprehension: Payback period | 0.45 (0.13) *** | 0.42 (0.14) ** | |
| Gender (Men) | 0.28 (0.14) * | ||
| Age | |||
| Urban | |||
| Education | 0.40 (0.15) ** | ||
| Income | −0.46 (0.19) * | ||
| Novelty seeking | 0.46 (0.10) *** | 0.27 (0.10) ** | |
| Trust Gov. | 0.17 (0.08) * | ||
| Trust electricity company | 0.17 (0.08) * | 0.24 (0.08) *** | |
| Pro-environmental | 0.46 (0.09) *** | 0.23 (0.10) * | |
| Household size | |||
| PV in Neighborhood | |||
| Acquaintances with PV | 0.05 (0.02) ** | ||
| Roof type: Tiles | 0.30 (0.14) * | 0.48 (0.15) *** | |
| Roof type: Flat concrete | 0.51 (0.23) * | ||
| Roof type: Flat floored | |||
| Roof usage: Facilities | |||
| Roof usage: Leisure | |||
| Roof usage: Storage | |||
| Roof usage: None | |||
| Relative advantage | 1.31 (0.13) *** | ||
| Expense concerns | |||
| Maintenance costs | |||
| Trialability | 0.45 (0.11) *** | ||
| Subjective norms | 0.93 (0.11) *** | ||
| Perceived behavioral control | −0.28 (0.09) ** | ||
| C statistics † | 0.55 | 0.69 | 0.81 |
| adjR2 | 0.12 | 0.15 | 0.41 |
* p < 0.05, ** p < 0.01, and *** p ≤ 0.001. † C statistics represent the area under the Receiver Operating Characteristic (ROC) curve with values that range between 0.5 to 1.
Disclaimer/Publisher’s Note: The statements, opinions and data contained in all publications are solely those of the individual author(s) and contributor(s) and not of MDPI and/or the editor(s). MDPI and/or the editor(s) disclaim responsibility for any injury to people or property resulting from any ideas, methods, instructions or products referred to in the content. |
© 2024 by the authors. Licensee MDPI, Basel, Switzerland. This article is an open access article distributed under the terms and conditions of the Creative Commons Attribution (CC BY) license (https://creativecommons.org/licenses/by/4.0/).
Share and Cite
MDPI and ACS Style
Boaz, D.; Palatnik, R.R.; Ayalon, O. Not All about the Money: The Role of Financial Information in Promoting Residential Rooftop Photovoltaics. Energies 2024, 17, 2043. https://0-doi-org.brum.beds.ac.uk/10.3390/en17092043
AMA Style
Boaz D, Palatnik RR, Ayalon O. Not All about the Money: The Role of Financial Information in Promoting Residential Rooftop Photovoltaics. Energies. 2024; 17(9):2043. https://0-doi-org.brum.beds.ac.uk/10.3390/en17092043
Chicago/Turabian StyleBoaz, David, Ruslana Rachel Palatnik, and Ofira Ayalon. 2024. "Not All about the Money: The Role of Financial Information in Promoting Residential Rooftop Photovoltaics" Energies 17, no. 9: 2043. https://0-doi-org.brum.beds.ac.uk/10.3390/en17092043
Note that from the first issue of 2016, this journal uses article numbers instead of page numbers. See further details here.