
Numerical Simulations of Thermoacoustic Binary Gas Mixture Batch Separation


Department of Power Engineering Equipment, Faculty of Mechanical Engineering, Technical University of Liberec, 461 17 Liberec, Czech Republic
*
Author to whom correspondence should be addressed.
J. Exp. Theor. Anal. 2024, 2(2), 46-55; https://0-doi-org.brum.beds.ac.uk/10.3390/jeta2020004
Submission received: 27 February 2024
/
Revised: 20 March 2024
/
Accepted: 2 April 2024
/
Published: 25 April 2024
Abstract
:In this paper, 2D simulations were carried out to prove the potential of thermoacoustic technology in separating a binary gas mixture. A 2D model of a gas mixture separator was developed, including a loudspeaker responsible for producing acoustic waves in the separation pipe. As a result of the imposed sound waves propagating inside the separator, main parameters including pressure, temperature, and density undergo oscillations, which in turn drive the light and heavy gas components in opposite directions. Through time, one end of the separator is enriched with the light component while the other end is enriched with the heavy one. Simulations were all performed using ANSYS Fluent. The aim was to separate an ideal gas mixture of Helium–Argon and study the impact of different parameters on the separation process.
1. Introduction
Thermoacoustic applications draw lots of attention due to being eco-friendly and including one to no moving parts [1]. The two major applications of thermoacoustic technology are prime movers (or engines) and heat pumps (or refrigerators). Thermoacoustic prime movers are devices that convert heat into acoustic work, which may then be used to generate electricity. Timmer et al. studied the four main techniques of converting thermoacoustic power into electricity. The authors compared the performance of electromagnetic devices (loudspeakers and linear alternators) with piezoelectric devices, magnetohydrodynamic devices, and bidirectional turbines. Results show linear alternators to be the most viable and efficient option [2]. However, due to the high cost of linear alternators, loudspeakers are the most common choice among researchers for experiments and prototypes.
Extensive research has been carried out to improve the performance and efficiency of thermoacoustic refrigerators and engines. Another breakthrough in this field is the hybrid thermoacoustic electric generator (HTAEG), another example of converting heat into electricity. This device ideally serves space nuclear power systems and other micro-scale energy systems. By heating the hot heat exchanger (HHX) in the HTAEG, the ambient heat exchanger (AHX) rejects heat. Moreover, Helium, being the working gas, undergoes oscillations and thus converts thermal energy to acoustic energy. As a result, acoustic fluctuations exert pressure on a power piston pushing it to move reciprocating in the cylinder. Moving magnets and a stationary coil surround the power piston. Therefore, through electromagnetic induction, acoustic power is converted into electric power [3].
Cooling is another main application of thermoacoustics. A thermoacoustic refrigerator operates in a reverse manner to its engine counterpart; thus, acoustic waves are converted into thermal energy. To produce acoustic pressure, a loudspeaker is attached to the TA device. The sound produced by a loudspeaker causes the working gas in the medium to oscillate. As a result of these pressure oscillations, temperature undergoes oscillations, and a temperature gradient is produced across the regenerator, or the stack of plates present between two heat exchangers. Heat is then absorbed from the space undergoing cooling through a cold heat exchanger (CHX) and waste heat driven out through the HHX [1].
Recorded numbers reveal enhancements in both thermoacoustic devices. Jin et al. achieved a low onset temperature of for an asymmetric looped TA prime mover with being the cold end temperature and working fluid is at 1 MPa or 1.5 MPa [4]. Wu et al. achieved a thermoacoustic efficiency of 35.6% with a maximum output acoustic power of 715 W [5]. In another work, Wu et al. proved that a thermal-to-electric efficiency of 19.8% could be achieved when coupled with a transducer [6]. Bi et al. developed a traveling wave TA electric generator that produced a maximum electric power of 4.69 kW and thermal-to-electric efficiency of 18.4% [7]. As for TARs, the lowest cooling temperature reached was , the highest coefficient of performance (COP) reached was 4.78, and the highest cooling power realized was 3.8 kW [8].
However, not much was achieved in the development of gas mixture separation by thermoacoustic waves. This technique is of great significance for prototypes and mini-scale separations and can serve as a means of prediction for expensive industrial-scale separations [9].
Common gas mixture separation techniques include membrane separation, absorption, adsorption, and cryogenic distillation. Membrane separation first took place in France when Mitchell studied gas permeation on rubber membranes. The membrane acts as a filter that allows the passage of certain molecules while blocking others and hence leads to separation of different gas components. Dialysis, reverse osmosis, forward osmosis, desalination, micro-filtration, and ultra-filtration are all technologies that rely on membrane separation [10]. Absorption is a separation process where a gaseous mixture is brought in contact with a liquid (solvent) and the gas phase is transported into the liquid phase. Absorption process has been applied in natural gas industry for 100 years to separate sour gas from natural gas. Also, it is used to remove impurities and contaminants in gas mixtures to recover valuable products [11]. Adsorption process is when an adsorbent attracts molecules from the gas and those molecules concentrate on the surface of the adsorbent and are removed from the gas phase. This process is widely applied for the large-scale purification or bulk separation of air, chemicals, petrochemicals, and natural gas [12]. Cryogenic distillation is the process of gas mixture separation at low temperature and high pressure [13]. However, there is no single technique that meets all possible demands. For example, the efficiency of separating isotopes, whether by thermoacoustic waves or by conventional methods (thermal or gaseous diffusion), is of the same order of magnitude. Thermoacoustic gas separation has the advantage of excluding moving parts from the separator, which reduces maintenance. Due to the high costs of a distillation unit, other techniques become very useful to explore for small-scale applications. And for this reason, thermoacoustic gas separation is studied [14].
Gas mixture separation via thermoacoustic waves was uncovered by coincidence while Swift and Spoor were performing an experiment on two coupled acoustic engines to achieve a state of vibration cancelation. The working fluid used was a mixture of Xenon–Helium (Xe–He), and, during the experiment, one resonator underwent Helium enrichment while the other resonator with Xenon [15].
The separation process occurs after sufficient thermoacoustic cycles near the boundary layer. Sound waves emitted by a loudspeaker inside the separation pipe force the gas molecules to oscillate. The wavelength for batch separations should be approximately equal to forty times the length of the separator . Therefore, the frequency should be tuned to comply with this relation.
The full process can be seen in Figure 1 below [9]. Beginning with (a) where zero velocity and high pressure in the pipe, thermal diffusion drives the heavy component towards the wall and the light gas away from it. This takes place within the range of the thermal penetration depth . Then, in (b), within the range of the viscous penetration depth , the heavy component is mostly immobilized, while the light component beyond moves upwards. Afterwards, in (c), low pressure shifts the sign of the temperature gradient, causing a reverse in thermal diffusion and therefore reversing the process in (a). Finally, in (d), the light component is mostly immobilized due to viscosity, while the heavy component moves downwards. This process over time increases the separation of the heavy gas from the light one as a more heavily enriched mixture moves downwards, while the light-enriched one moves upwards.
2. Numerical Simulations
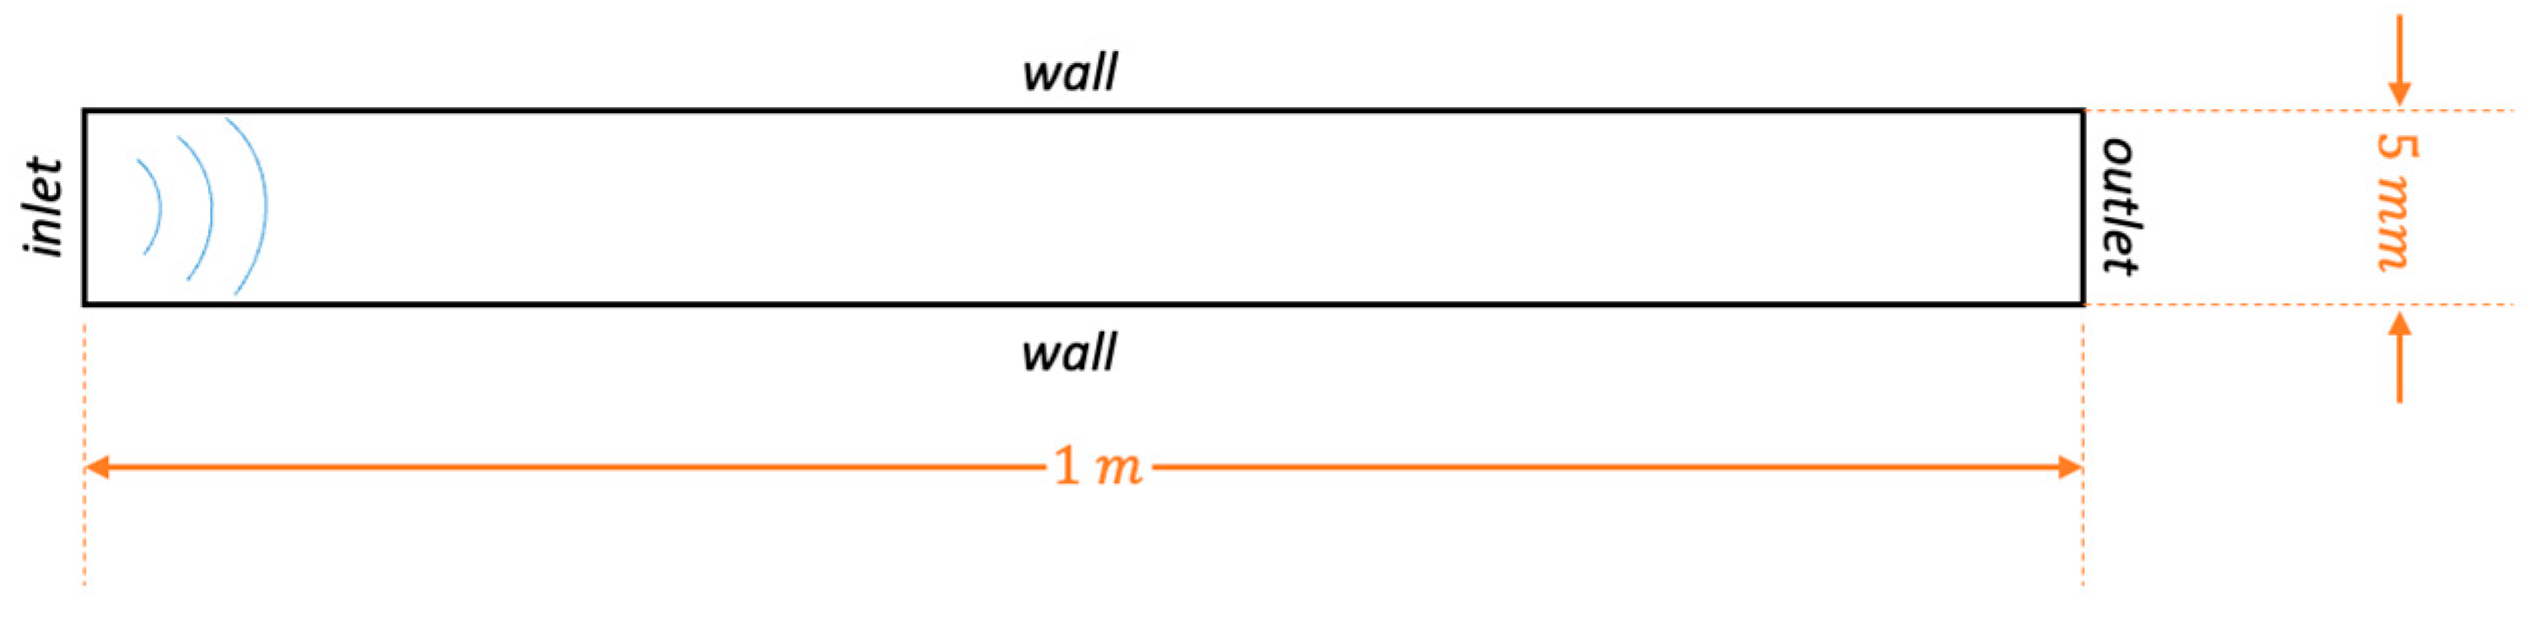
All three simulations are performed on the same separator model of 1 m length and 5 mm diameter. Boundary conditions include an inlet, outlet, and two solid walls as shown in Figure 2. The inlet represents the area where sound waves are produced by a loudspeaker. The solid walls are maintained at a fixed temperature of 300 K. Moreover, the outlet is set to a mass flow rate of 0 to prevent mass from escaping the pipe. The working fluid is an ideal gas mixture of Helium–Argon. The grid is produced by ANSYS ICEM for a high-quality structured mesh of 2400 × 40 cells.
The simulations were performed in Ansys Fluent 2023 R1, and the device running the software is a workstation with AMD Ryzen 5 processor consisting of 6 cores and 12 logical processors.
Species Transport is adopted to allow tracking the trajectory of each gas component. Since ideal gas law is the case, properties of each gas component are subjected to kinetic theory [16]. This introduces vital parameters for calculating viscosity, thermal conductivity, specific heat capacity, and coefficient of mass diffusion. These parameters consist of Lennard–Jones or L–J parameters for each gas, besides the molecular weight and degrees of freedom . The turbulence model implemented is the Realizable for its newly enhanced transport equation for the dissipation rate [17].
The specific heat for each gas is then calculated by Fluent as follows:
And diffusion coefficient of gas in gas is defined by
is an estimated function of molecular interaction in the system.
The oscillating pressure inlet in each simulation takes a sinusoidal form:
2.1. Separation of 50/50 He–Ar at 101.325 kPa
In this case, a simulation is carried out to separate a mixture consisting of 50% Helium and 50% Argon at an atmospheric pressure of 101.325 kPa. The oscillating pressure at inlet in this case is
A pressure of 2000 kPa has to be reached inside the separator at a frequency of 10 Hz. This frequency is obtained from , where the initial speed of sound is
So, as the mixture is initially 50% for each constituent. This means . The ratio of specific heats of the mixture is , , and the mean temperature is . With these values, the speed of sound is .
Then, the wavelength is calculated and is set to 40 times the length of the separator since the aim is to validate the results obtained for an approximation of separator length. Now, given the speed of sound at and , the frequency will be equal to . Nevertheless, it is set to , following the paper by Swift et al. [20], to compare our outcome with the experimental results.
The simulation is then run for a time step of , with being the number of iterations per time step. In this run, , and so the time step is equal to .
During each run, close attention was paid to the fluctuating behavior of the significant parameters, which are mostly a result of the oscillating pressure inside the separator. The oscillating pressure at each end of the separator is shown in Figure 3.
No strange behavior was detected during each simulation; therefore, each case went smoothly and produced normal oscillating temperature, as seen in the zoomed-in section of Figure 4.
Careful monitoring of the velocity also continued to show stable fluctuations, which facilitated the computational process without any obstacles and could be noticed clearly in Figure 5.
2.2. Separation of 50/50 He–Ar at 80 kPa
In the second case, the setup is adjusted for a different atmospheric pressure to study its impact on the separation process. The same formulations of the first case apply to this run. However, a slight reduction was necessary for the frequency down to 8.4 Hz to avoid the emerging mass loss at around .
2.3. Separation of 90/10 He–Ar at 80 kPa
Here, an attempt was made to study if separation takes place at the same above conditions on different gas compositions. The atmospheric pressure was left at 80 kPa after the results revealed an improved level of separation than the first simulation.
3. Results
All three simulations yielded promising results. Case 1 proved that separation is achievable via thermoacoustic waves and therefore validated the results obtained by Swift et al. [20], which are the only results we have found on an experiment of batch separation of gas mixtures via acoustic waves. Hence, we used their paper as a starting point to validate the results within the flowtime and computational power we have. Afterwards, we attempted to study how a change in certain parameters could affect the separation process. Case 2 shows clearly how the change in atmospheric pressure impacts the separation process. By reducing its value to 80 kPa, more separation occurs in less time. Case 3 proves that this technique could be extended and applied to mixtures of different compositions; thus, we simulated the separation process for a He–Ar mixture of 90% Helium and 10% Argon.
3.1. Results for Separation of 50/50 He–Ar at 101.325 kPa
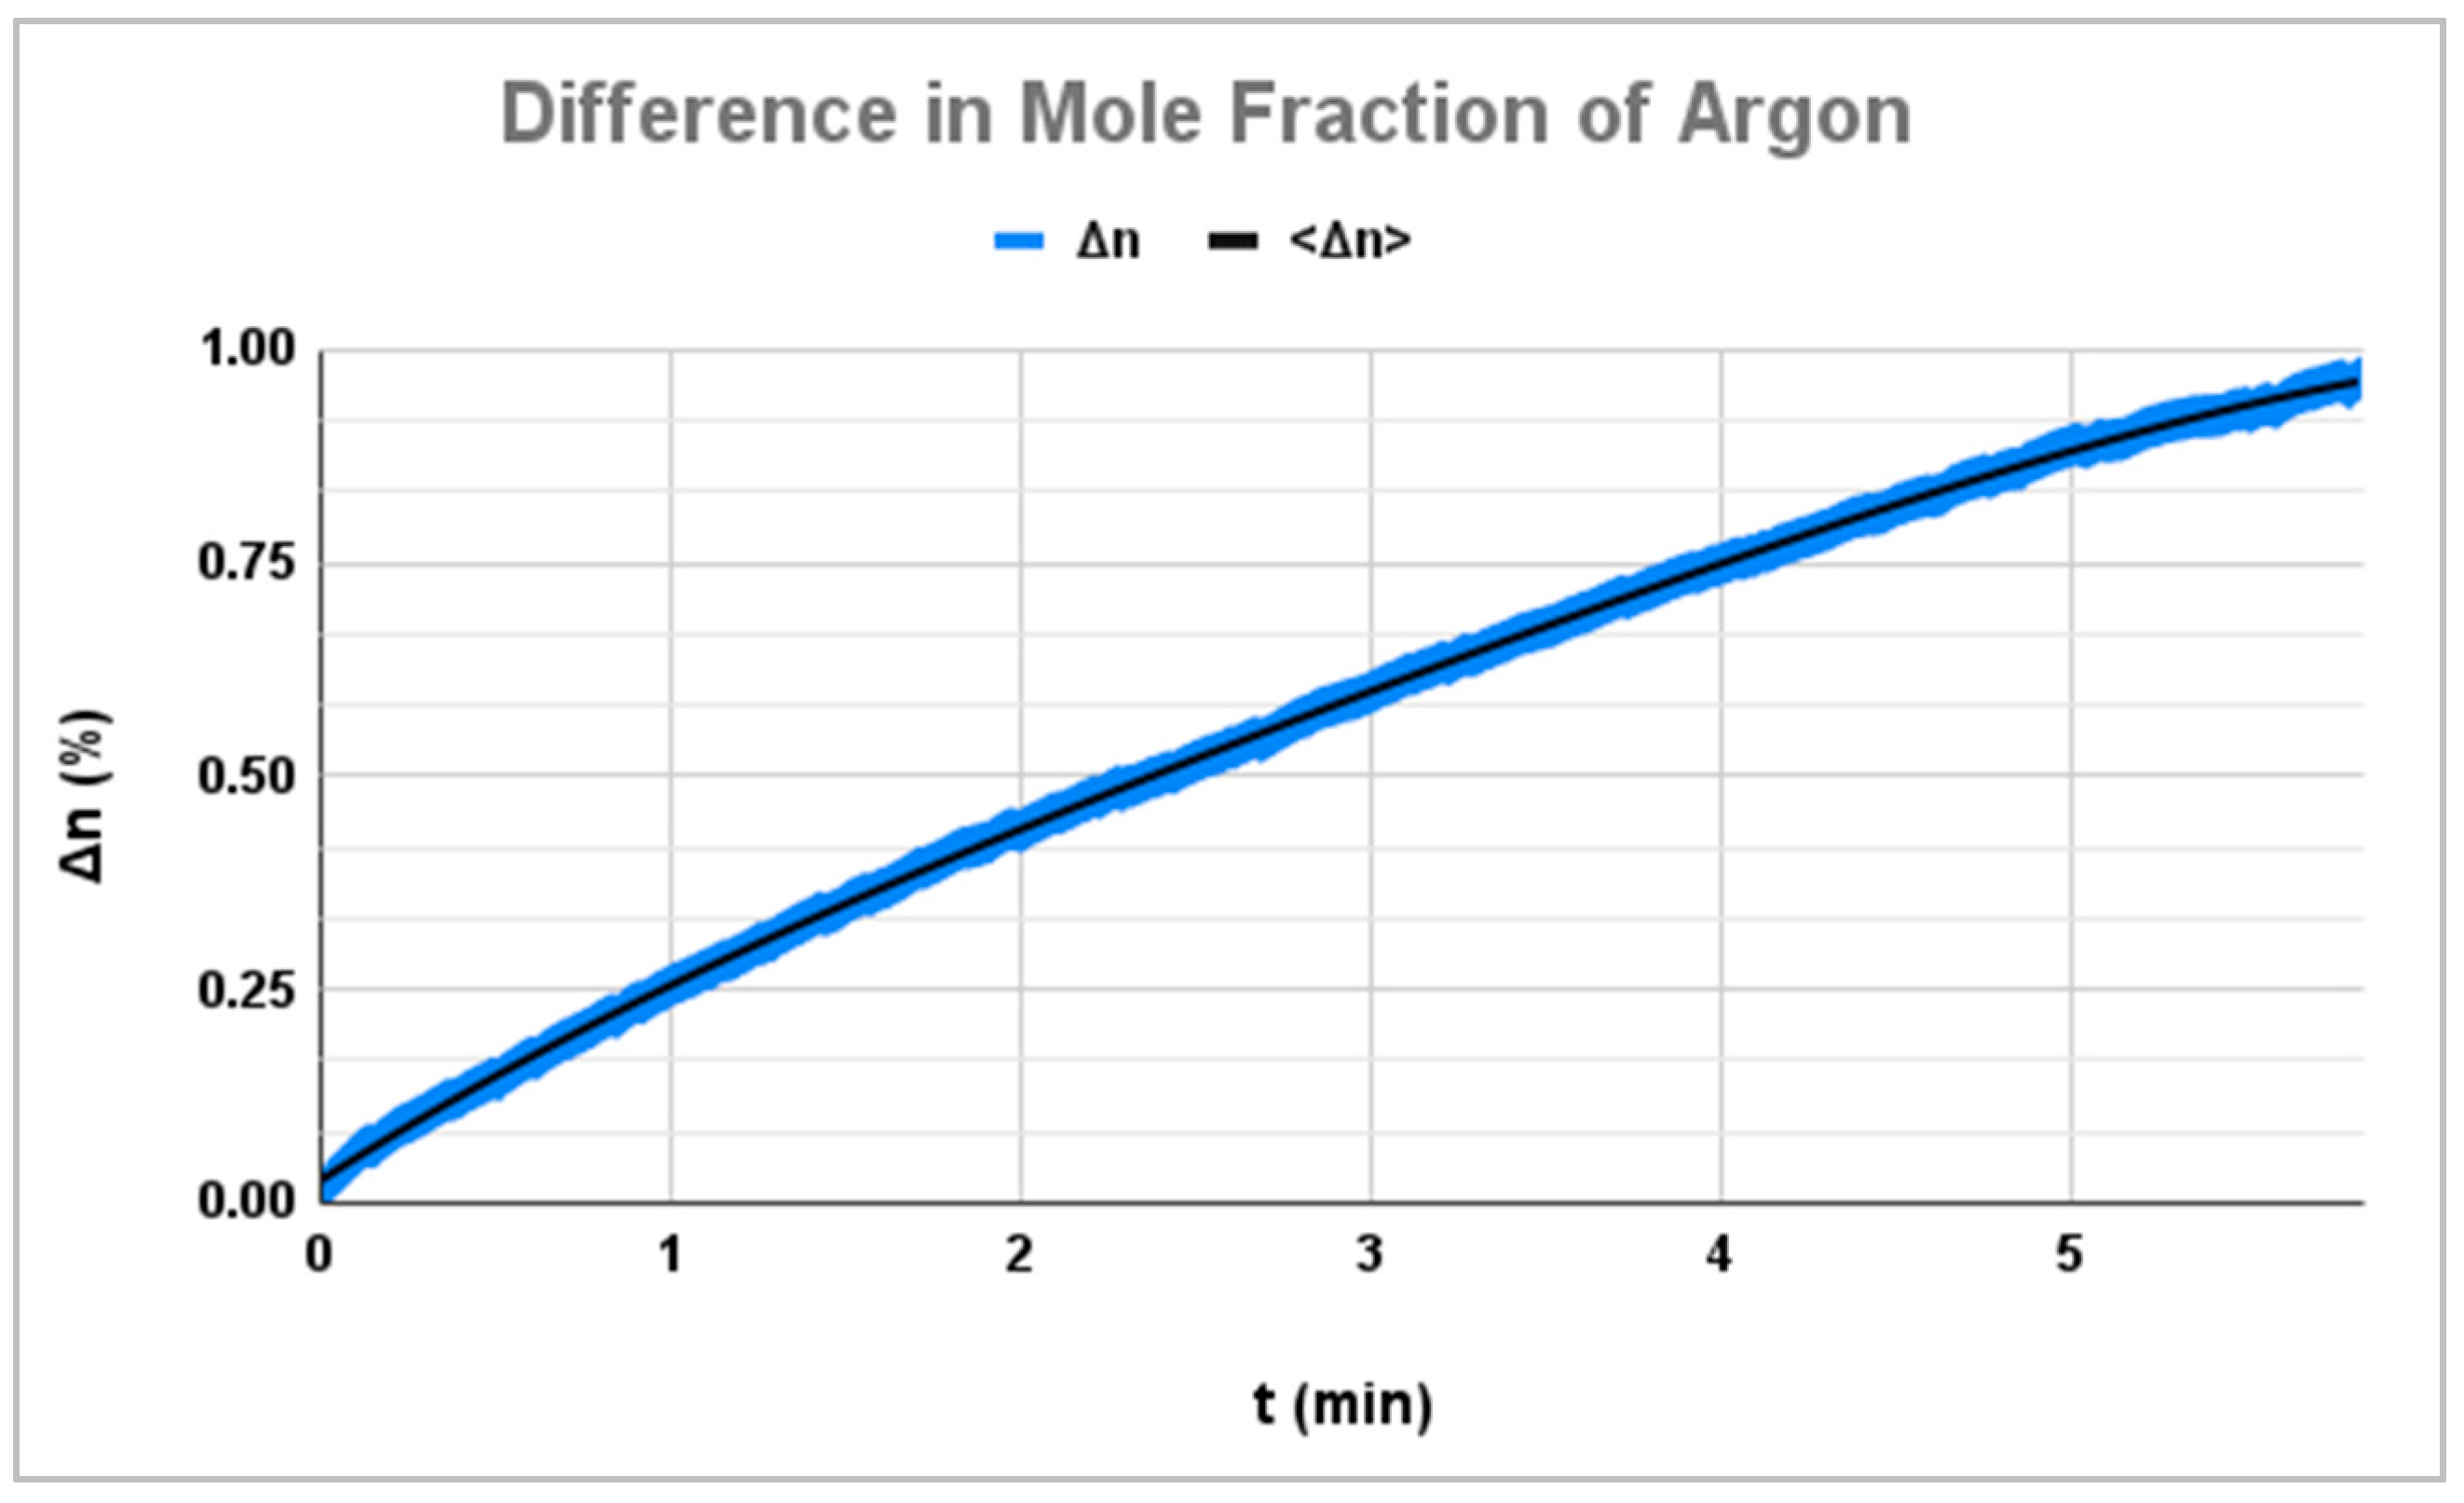
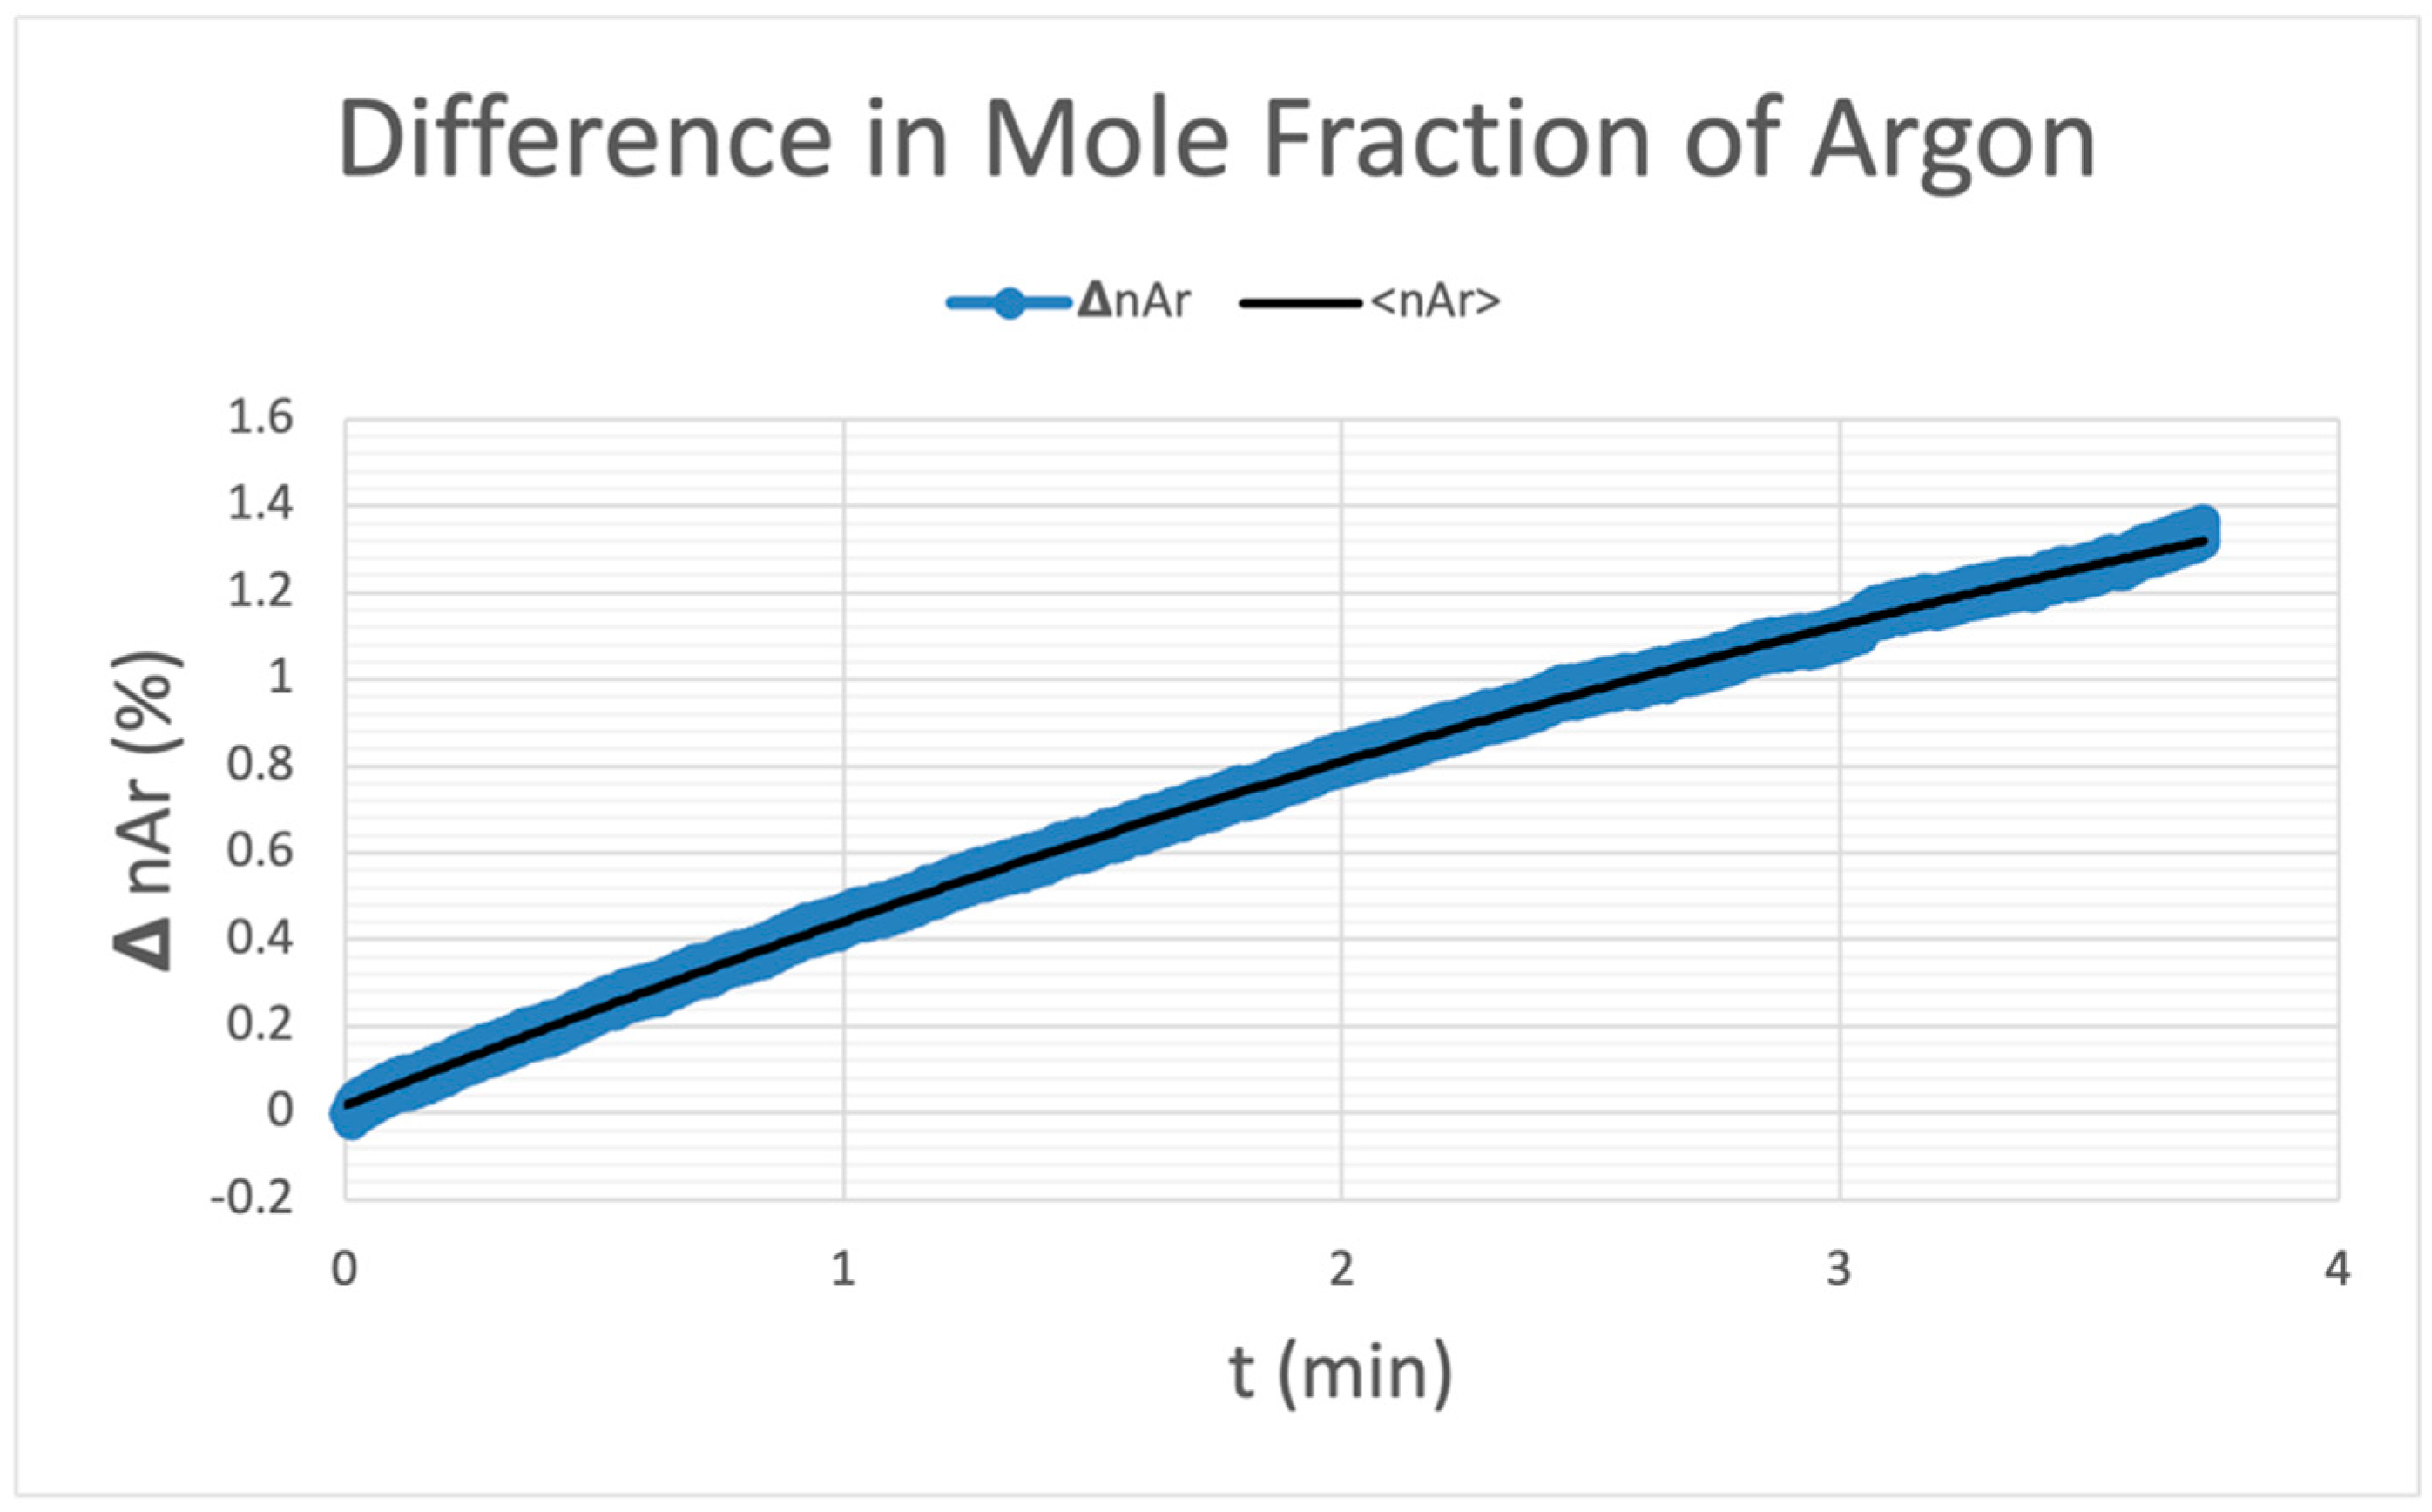
After , the difference in the mole fraction of Argon—the heavy component—reached around 1%, as can be seen from Figure 6, which is identical to the numerical and experimental outcome () found by Swift et al. [20]. Figure 7 is the graph of the results of Swift et al., and the dotted lines in red are sketched to mark the intersection at .
3.2. Results for Separation of 50/50 He–Ar at 80 kPa
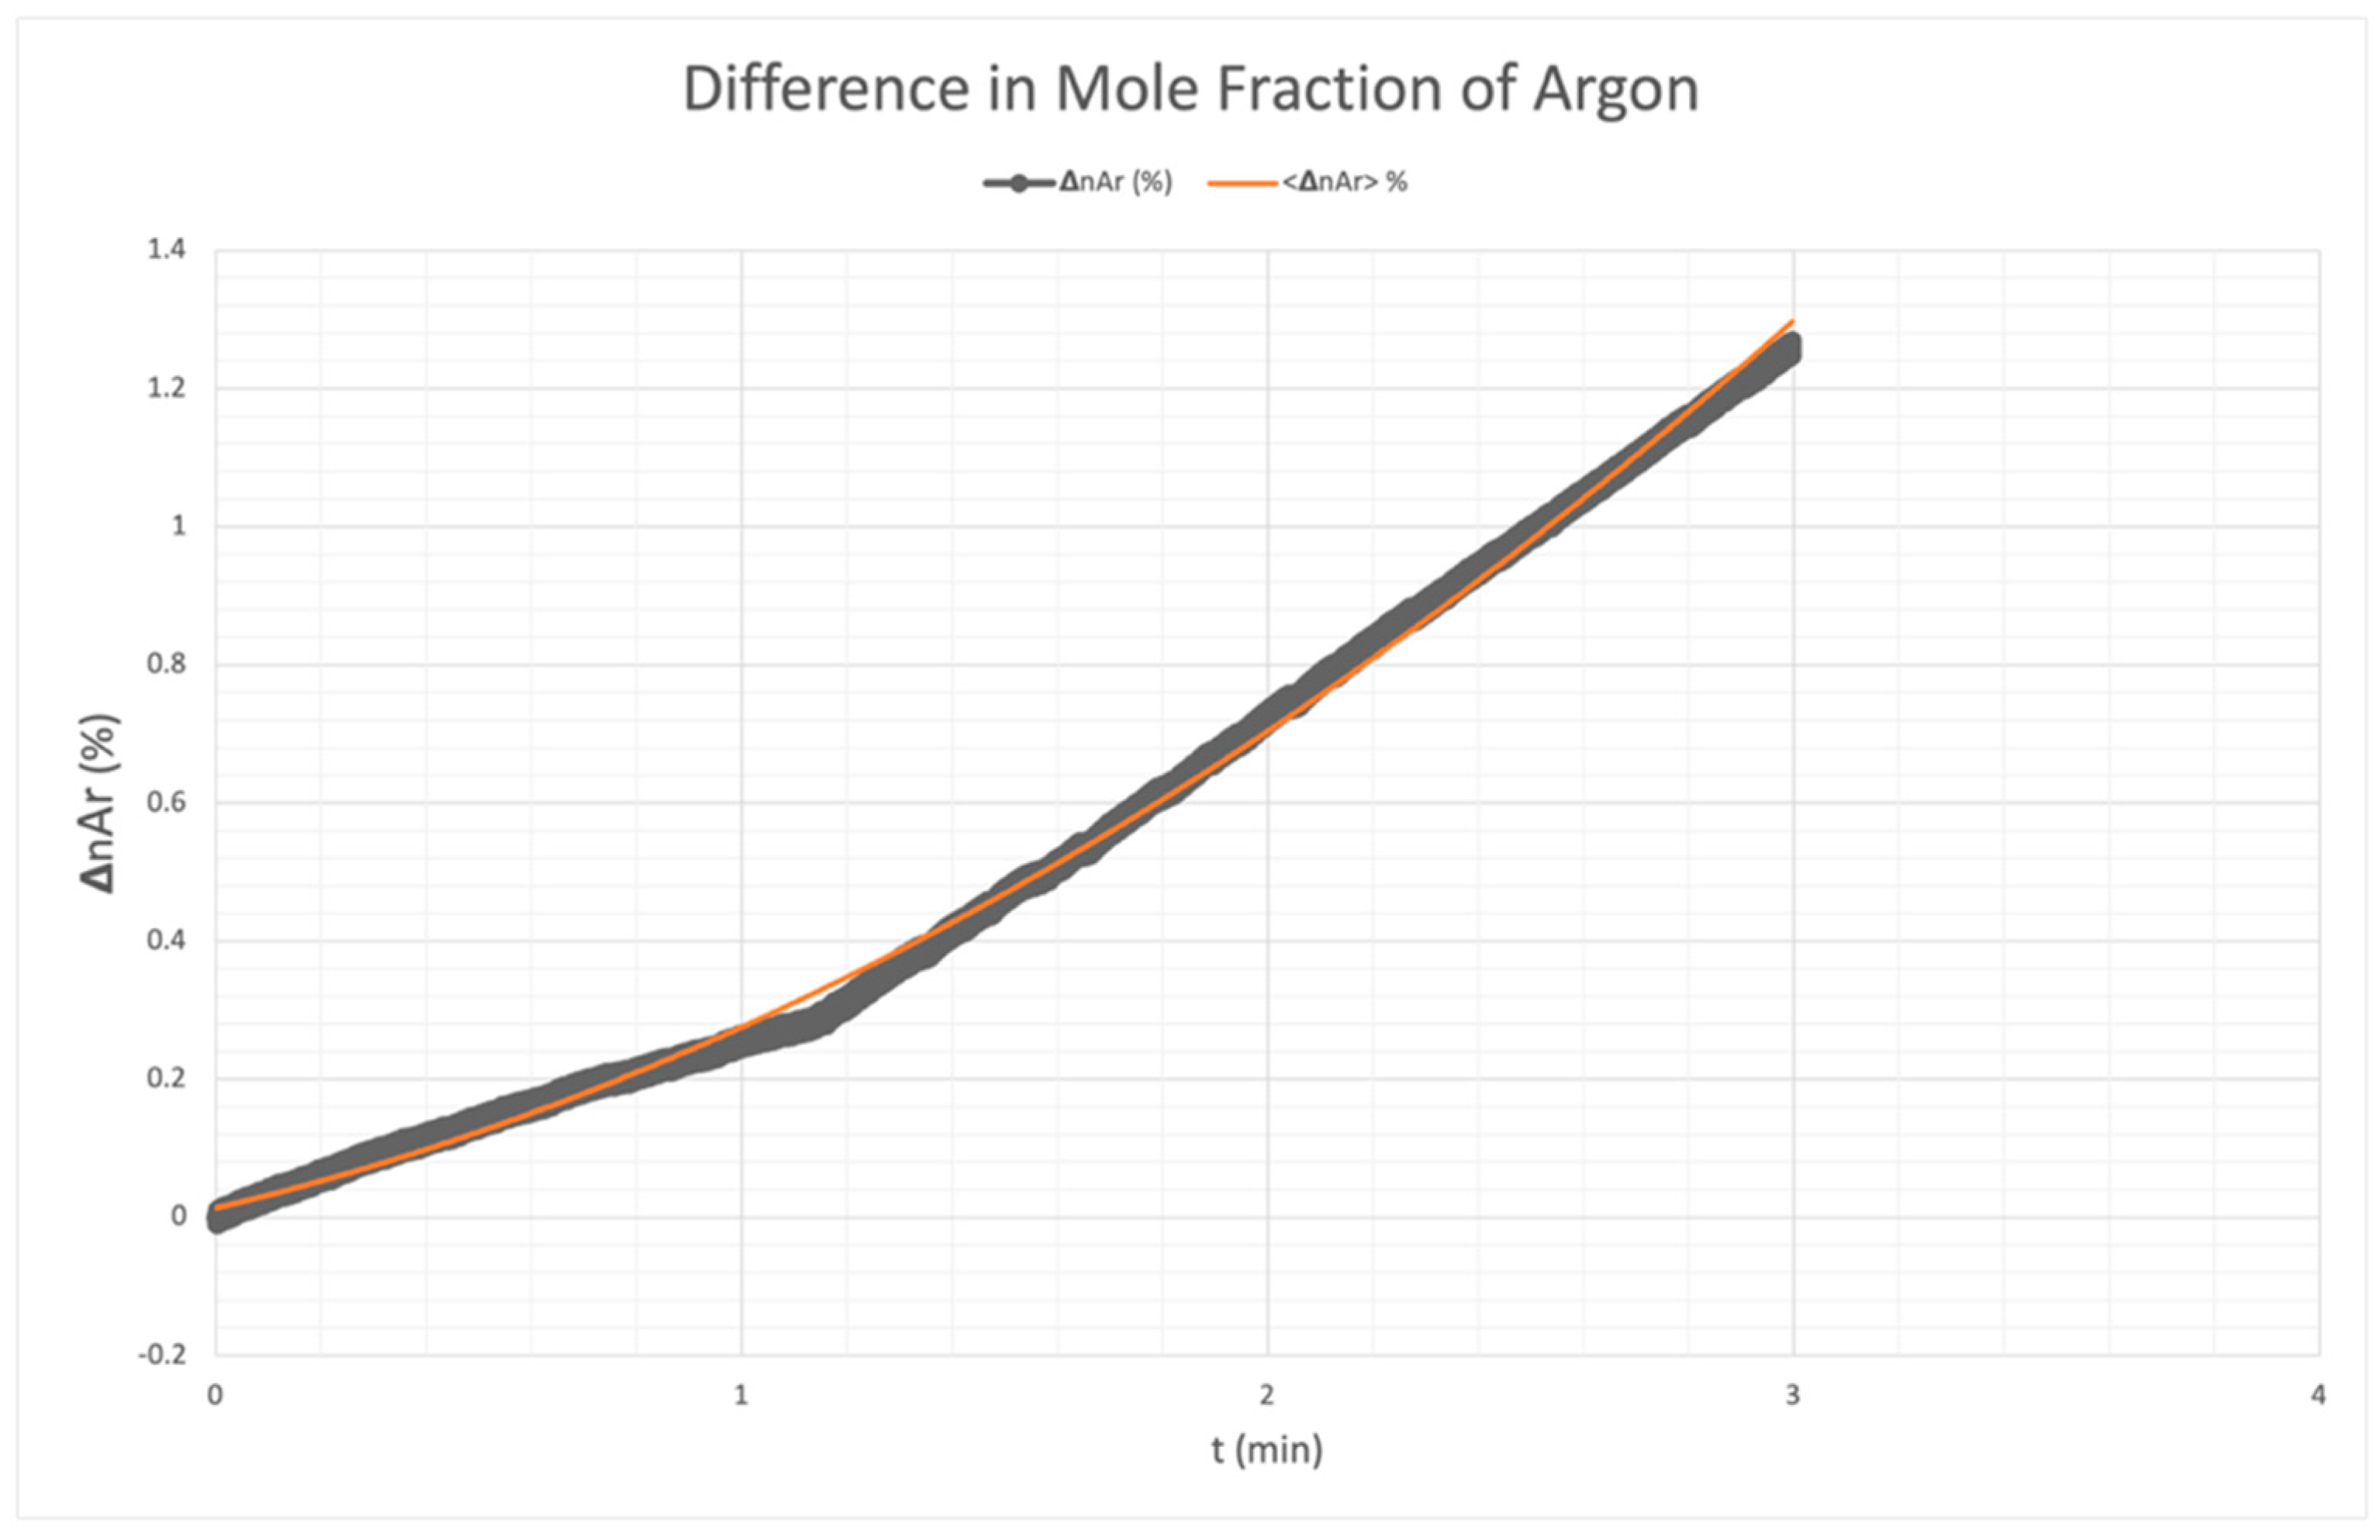
A noticeable improvement in separation results is observed after 3.7 min when the difference in Argon mole fraction between both ends of the separator touches 1.39% as shown in Figure 8.
3.3. Results for Separation of 90/10 He–Ar at 80 kPa
Another run shows the validity of thermoacoustic separation for different mixture compositions. Argon begins accumulating in the first half of the separator at around 1.3 min. Nevertheless, the reason behind the steep rise in the graph shown in Figure 9 after 1 min is due to the reduction in the amplitude of the oscillating pressure from 2000 kPa to 1800 kPa. This applied pressure change helped to optimize the results and achieve a higher percentage of separation.
4. Summary
A tabulated summary of the boundary conditions for the above simulations can be seen in Table 2. In each simulation case, the following parameters are listed: the percentage composition of the He–Ar mixture, mean pressure in kPa, inlet pressure in kPa, outlet mass flow rate set to 0 kg/s, and the wall temperature of the separator fixed at 300 K.
Next, a table to list the results of the three simulations performed is created. Table 3 lists (next to each case) the time at which the simulation ends and the final composition of He and Ar at the first end of the pipe and at the other end . The results are shown as the percentage in the difference of the Argon mole fraction between both ends of the separation pipe and is illustrated by the formula .
5. Conclusions
The simulations and results show that the separation of gas mixtures via thermoacoustic waves is a promising technology. We proved that it is indeed possible to separate gas mixtures with acoustic waves. In Case 1, we validated experimental results from the literature within a duration of nearly 6 min. Nevertheless, given greater computational power, it will be possible to verify the complete experimental run performed by Swift et al., which is up to 3 h. Case 2 showed an enhanced separation process by reducing the mean pressure to 80 kPa and therefore achieving a higher difference in mole fraction of Argon equal to 1.332% within 3.728 min. Case 3 verified the applicability of thermoacoustic gas mixture separation for different compositions of Helium and Argon by introducing the working gas as 90/10 He-Ar. However, little research and experimentation has been carried out in this area. Also, given more computational power, it is possible to study the separation process up to complete saturation to uncover the full potential of this technique and to determine its potential of achieving pure gases or even a mixture composition of specific interest. So far, it is too early to speak about commercializing this separation technique as it becomes difficult to control for separators of extended length. Nonetheless, the separation of gas mixtures via acoustic waves still has the advantage over other industrial methods in terms of serving as a low-cost, energy-efficient, and eco-friendly prototype.
Author Contributions
Conceptualization, A.K.; Methodology, A.K. and P.D.; Formal Analysis, A.K.; Writing—Original Draft Preparation, A.K.; Writing—Review & Editing, T.V.; Supervision, T.V.; Funding Acquisition, P.D. All authors have read and agreed to the published version of the manuscript.
Funding
A.K. gratefully acknowledges the scholarship granted to him by the Ministry of Education, Youth and Sports of the Czech Republic and the Czech government.
Data Availability Statement
The original contributions presented in the study are included in the article, further inquiries can be directed to the corresponding author.
Conflicts of Interest
The authors declare no conflicts of interest.
References
- Tisovský, T.; Vít, T. Design of theoretically optimal cooling device. EPJ Web Conf. 2016, 114, 02124. [Google Scholar] [CrossRef]
- Timmer, M.A.G.; van der Meer, T.H.; de Blok, K. Review on the conversion of thermoacoustic power into electricity. J. Acoust. Soc. Am. 2018, 143, 841–857. [Google Scholar] [CrossRef]
- Chen, Y.; Yu, G.; Chen, Y.; Zhu, S.; Luo, J.; Sun, Y.; Luo, E. Post-positioned gas spring enables ultra-high output power of hybrid thermoacoustic electric generators. Cell Rep. Phys. Sci. 2024, 5, 101835. [Google Scholar] [CrossRef]
- Jin, T.; Yang, R.; Wang, Y.; Feng, Y.; Tang, K. Low temperature difference thermoacoustic prime mover with asymmetric multi-stage loop configuration. Sci. Rep. 2017, 7, 7665. [Google Scholar] [CrossRef]
- Wu, Z.; Chen, Y.; Dai, W.; Luo, E.; Li, D. Investigation on the thermoacoustic conversion characteristic of regenerator. Appl. Energy 2015, 152, 156–161. [Google Scholar] [CrossRef]
- Wu, Z.; Zhang, L.; Dai, W.; Luo, E. Investigation on a 1 kW traveling-wave thermoacoustic electrical generator. Appl. Energy 2014, 124, 140–147. [Google Scholar] [CrossRef]
- Bi, T.; Wu, Z.; Zhang, L.; Yu, G.; Luo, E.; Dai, W. Development of a 5 kW traveling-wave thermoacoustic electric generator. Appl. Energy 2017, 185, 1355–1361. [Google Scholar] [CrossRef]
- Chen, G.; Tang, L.; Mace, B.; Yu, Z. Multi-physics coupling in thermoacoustic devices: A review. Renew. Sustain. Energy Rev. 2021, 146, 111170. [Google Scholar] [CrossRef]
- Geller, D.A.; Spoor, P.S.; Swift, G.W. Separation of Gas Mixtures by Thermoacoustic Waves. Available online: https://www.lanl.gov/org/ddste/aldps/materials-physics-applications/quantum/thermoacoustics/_assets/docs/Rome.pdf (accessed on 2 January 2024).
- Ji, G.; Zhao, M. Membrane Separation Technology in Carbon Capture; IntechOpen: London, UK, 2017. [Google Scholar]
- Hassan, T.N.A.T.; Shariff, A.M.; Pauzi, M.M.M.; Khidzir, M.S.; Surmi, A. Insights on Cryogenic Distillation Technology for Simultaneous CO2 and H2S Removal for Sour Gas Fields. Molecules 2022, 27, 1424. [Google Scholar] [CrossRef] [PubMed]
- Sherman, J.D.; Yon, C.M. Adsorption, gas separation. In Kirk-Othmer Encyclopedia of Chemical Technology; John Wiley & Sons, Inc.: Hoboken, NJ, USA, 2000. [Google Scholar]
- Hanif, M.A.; Nadeem, F.; Tariq, R.; Rashid, U. Chapter 3—Future energy options: An overview. In Renewable and Alternative Energy Resources; Academic Press: Cambridge, MA, USA, 2022; pp. 113–169. [Google Scholar]
- Ke, H.B.; He, Y.L. The mechanisms of thermal diffusion and baro-diffusion effects on thermacoustic mixture separation. Chem. Eng. Sci. 2012, 84, 399–407. [Google Scholar] [CrossRef]
- Spoor, P.; Swift, G. Mode-locking of acoustic resonators and its application to vibration cancellation in acoustic heat engines. J. Acoust. Soc. Am. 1999, 106, 1353–1362. [Google Scholar] [CrossRef]
- 8.13 Kinetic Theory Parameters. Available online: https://www.afs.enea.it/project/neptunius/docs/fluent/html/ug/node327.htm (accessed on 6 January 2024).
- ANSYS. Available online: https://www.afs.enea.it/project/neptunius/docs/fluent/html/th/node60.htm (accessed on 13 January 2024).
- Nichols, N.S.; Prisk, T.R.; Warren, G.; Sokol, P.; Del Maestro, A. Dimensional reduction of helium-4 inside argon-plated MCM-41 nanopores. Phys. Rev. B 2020, 102, 144505. [Google Scholar] [CrossRef]
- Ge, J.; Kjelstrup, S.; Bedeaux, D.; Simon, J.M.; Rousseau, B. Transfer coefficients for evaporation of a system with a Lennard-Jones long-range spline potential. Phys. Rev. E 2007, 75, 061604. [Google Scholar] [CrossRef] [PubMed]
- Spoor, P.S.; Swift, G.W. Thermoacoustic Separation of a He-Ar Mixture. Phys. Rev. Lett. 2000, 85, 1646–1649. [Google Scholar] [CrossRef] [PubMed]
Figure 1.
Thermoacoustic separation mechanism near the wall.

Figure 2.
Dimensions of the thermoacoustic separator.

Figure 3.
Oscillating pressure of the loudspeaker at the inlet (red) and at the outlet (blue).

Figure 4.
Temperature oscillations occurring at the outlet (red) and inlet (blue).

Figure 5.
Fluctuating velocity in red as a result of the pressure oscillations of the loudspeaker, while the straight blue line represents a stationary velocity at the outlet.
Figure 5.
Fluctuating velocity in red as a result of the pressure oscillations of the loudspeaker, while the straight blue line represents a stationary velocity at the outlet.

Figure 6.
Difference in mole fraction between separator ends—Case 1.

Figure 7.
Results from Swift et al. [20]. The red dotted line is added to indicate . The vertical axis represents the difference in mole fractions of Argon. Reproduced with permission from [20], © 2000 The American Physical Society.

Figure 8.
Difference in mole fraction of Argon between the ends of the separator—Case 2.

Figure 9.
Difference in mole fraction of Argon between the ends of the separator—Case 3.


| Gas | ||||
|---|---|---|---|---|
| Argon | 124 | 3.42 | 40 | 3 |
| Helium | 10.9 | 2.64 | 2 | 3 |
Table 2.
Boundary conditions of each performed simulation.
| Case Number | He–Ar % | (kPa) | |||
|---|---|---|---|---|---|
| 1 | 50/50 | 101.325 | 0 | 300 | |
| 2 | 50/50 | 80 | 0 | ||
| 3 | 90/10 | 80 | 0 | ||
Table 3.
Simulation results.
| Case Number | ||||
|---|---|---|---|---|
| 1 | 5.837 | 49.48/50.43 | 50.43/49.48 | 0.955 |
| 2 | 3.728 | 49.41/50.59 | 50.74/49.26 | 1.332 |
| 3 | 2.99 | 89.15/10.85 | 90.41/9.59 | 1.27 |
Disclaimer/Publisher’s Note: The statements, opinions and data contained in all publications are solely those of the individual author(s) and contributor(s) and not of MDPI and/or the editor(s). MDPI and/or the editor(s) disclaim responsibility for any injury to people or property resulting from any ideas, methods, instructions or products referred to in the content. |
© 2024 by the authors. Licensee MDPI, Basel, Switzerland. This article is an open access article distributed under the terms and conditions of the Creative Commons Attribution (CC BY) license (https://creativecommons.org/licenses/by/4.0/).
Share and Cite
MDPI and ACS Style
Kouta, A.; Vít, T.; Dančová, P. Numerical Simulations of Thermoacoustic Binary Gas Mixture Batch Separation. J. Exp. Theor. Anal. 2024, 2, 46-55. https://0-doi-org.brum.beds.ac.uk/10.3390/jeta2020004
AMA Style
Kouta A, Vít T, Dančová P. Numerical Simulations of Thermoacoustic Binary Gas Mixture Batch Separation. Journal of Experimental and Theoretical Analyses. 2024; 2(2):46-55. https://0-doi-org.brum.beds.ac.uk/10.3390/jeta2020004
Chicago/Turabian StyleKouta, Ahmad, Tomáš Vít, and Petra Dančová. 2024. "Numerical Simulations of Thermoacoustic Binary Gas Mixture Batch Separation" Journal of Experimental and Theoretical Analyses 2, no. 2: 46-55. https://0-doi-org.brum.beds.ac.uk/10.3390/jeta2020004