Review

Research Progress in the Application of Google Earth Engine for Grasslands Based on a Bibliometric Analysis

by
Zinhle Mashaba-Munghemezulu
1,*,
Lwandile Nduku
1,2,
Cilence Munghemezulu
1 and
George Johannes Chirima
1,2
1
Geoinformation Science Division, Agricultural Research Council, Natural Resources and Engineering, Pretoria 0001, South Africa
2
Department of Geography, Geoinformatics & Meteorology, University of Pretoria, Pretoria 0028, South Africa
*
Author to whom correspondence should be addressed.
Submission received: 17 March 2024 / Revised: 8 April 2024 / Accepted: 15 April 2024 / Published: 26 April 2024

Abstract

:
Grasslands cover approximately 40% of the Earth’s surface. Thus, they play a pivotal role in supporting biodiversity, ecosystem services, and human livelihoods. These ecosystems provide crucial habitats for specialized plant and animal species, act as carbon sinks to mitigate climate change, and are vital for agriculture and pastoralism. However, grasslands face ongoing threats from certain factors, like land use changes, overgrazing, and climate change. Geospatial technologies have become indispensable to manage and protect these valuable ecosystems. This review focuses on the application of Google Earth Engine (GEE) in grasslands. The study presents a bibliometric analysis of research conducted between 2016–2023. Findings from the analysis reveal a significant growth in the use of GEE and different remote sensing products for grassland studies. Most authors reported grassland degradation in most countries. Additionally, China leads in research contributions, followed by the United States and Brazil. However, the analysis highlights the need for greater involvement from developing countries, particularly in Africa. Furthermore, it highlights the global distribution of research efforts, emphasizes the need for broader international participation.

1. Introduction

Grasslands cover a vast expanse of the Earth’s surface; they play a critical role in supporting biodiversity, ecosystem services, and human livelihoods. These ecosystems provide essential habitats for a wide range of plants, wildlife, and domestic animal species, some of which are highly specialized and have high economic value, such as in eco-tourism [1,2]. Moreover, grasslands serve as carbon sinks, helping to mitigate the impacts of climate change by sequestering carbon dioxide from the atmosphere [3]. They are also important for agriculture and pastoralism, supplying food and livelihoods to millions worldwide [4,5]. Despite their importance, grasslands are under constant threats from various anthropogenic factors, including bush encroachment, land use change, overgrazing, and climate change [6,7]. It is estimated that the global cost of grassland degradation on livestock was USD 6.8 billion between 2001 and 2011 [7]. Yan et al. [8] reported Africa as the leading continent in terms of grassland degradation, while Asia was leading in grassland improvements. Climate change and human activities were identified as the main driving factors in both cases. Understanding the significance and dynamics of grasslands is vital for exploring their sustainable management through geospatial tools and research.
While geospatial technologies have significantly advanced our understanding of grassland ecosystems, it is essential to acknowledge their inherent challenges and limitations during data acquisition and processing. Geospatial analysis relies heavily on data, and access to high-quality, near-real-time data can be a challenge in some regions. Obtaining high-resolution satellite imagery and other geospatial data can be costly and such data may not always be readily available. Additionally, analyzing and storing large geospatial datasets can be computationally intensive and requires substantial infrastructure and expertise. When data from multiple sources (e.g., satellite imagery, field measurements, and climate data) are utilized, they can present challenges due to differences in spatial and temporal resolutions, formats, and coordinate systems [9,10,11]. During data analysis, classification can be more complex due to the variations in the grassland ecosystem. Distinguishing between grassland types and assessing biodiversity from remote sensing data can be challenging, especially with the use of low-resolution satellite data. The exploration of next-generation technologies is necessary to improve grassland research with geospatial data.
Google Earth Engine (GEE) is a cloud-based repository which archives satellite imagery and has tools to handle big data. The platform eases data processing, offering researchers and land managers the ability to monitor grasslands at unprecedented scales and frequencies. It allows for real-time tracking of land cover changes, vegetation dynamics, and even the impacts of climate change and land use practices [12,13]. The platform has the capacity to access and process a wealth of remote sensing data and apply custom algorithms, GEE has enabled the rapid identification of disturbances, such as urban encroachment, agriculture expansion, and wildfire events, which threaten grassland integrity [7,14]. Furthermore, GEE facilitates the quantification of key ecological parameters, such as biomass, carbon sequestration, and habitat fragmentation, providing essential insights for conservation and sustainable land management [15,16].
Remote sensing techniques have been widely used for grassland studies. These techniques are beneficial for deriving biophysical parameters, large area coverage, and assessing long term changes in grasslands [17,18,19,20]. For example, the study by Liu et al. [17] used change detection to find that natural surfaces, such as woodland, grassland, cultivated land, and water, were converted into human settlements and bare land at an annual change rate of 1.53% in Deging County (China). Tarantino et al. [18] used Landsat time series data to study grassland loss evolution in and around protected areas in Murgia Alta. The authors documented that grassland was degrading in non-protected areas. Wang et al. [19] used remote sensing data to study land cover change in China; their results indicated that grasslands had been converted to croplands. Xoxo et al. [20] used remote sensing-based approach to study the grassland biome in South Africa; they highlighted that woody encroachment, and the spread of invasive alien plants are the main drivers for grassland degradation for the period covering 2000–2018.
Literature reviews of the use of remote sensing data for grasslands have been carried out extensively [7,21,22,23,24,25]. However, these studies have not focused on the practical use of the remote sensing data in GEE for grasslands. To this end, the current study uses bibliometrics to provide a comprehensive review on the use of remote sensing data from GEE for grasslands. Bibliometric studies are useful for identifying trends, gaps, and directions of research in this area. The advantage of this technique is that it gives objective results, and this aids in understanding the subject area’s impact and significance in terms of the publications’ evolution [26]. The recent bibliometric review by Pérez-Cutillas et al. [27] focused on the utilization of GEE and its impact on the scientific community. Findings from the study reported that GEE is becoming more widely used for water resource applications in comparison to other research areas, and grasslands were not covered. The review by Velastegui-Montoya et al. [28] indicated an increase in studies using GEE for vegetation. Given the importance of grasslands, this study aims to conduct a bibliometric analysis on the use of GEE for grasslands.

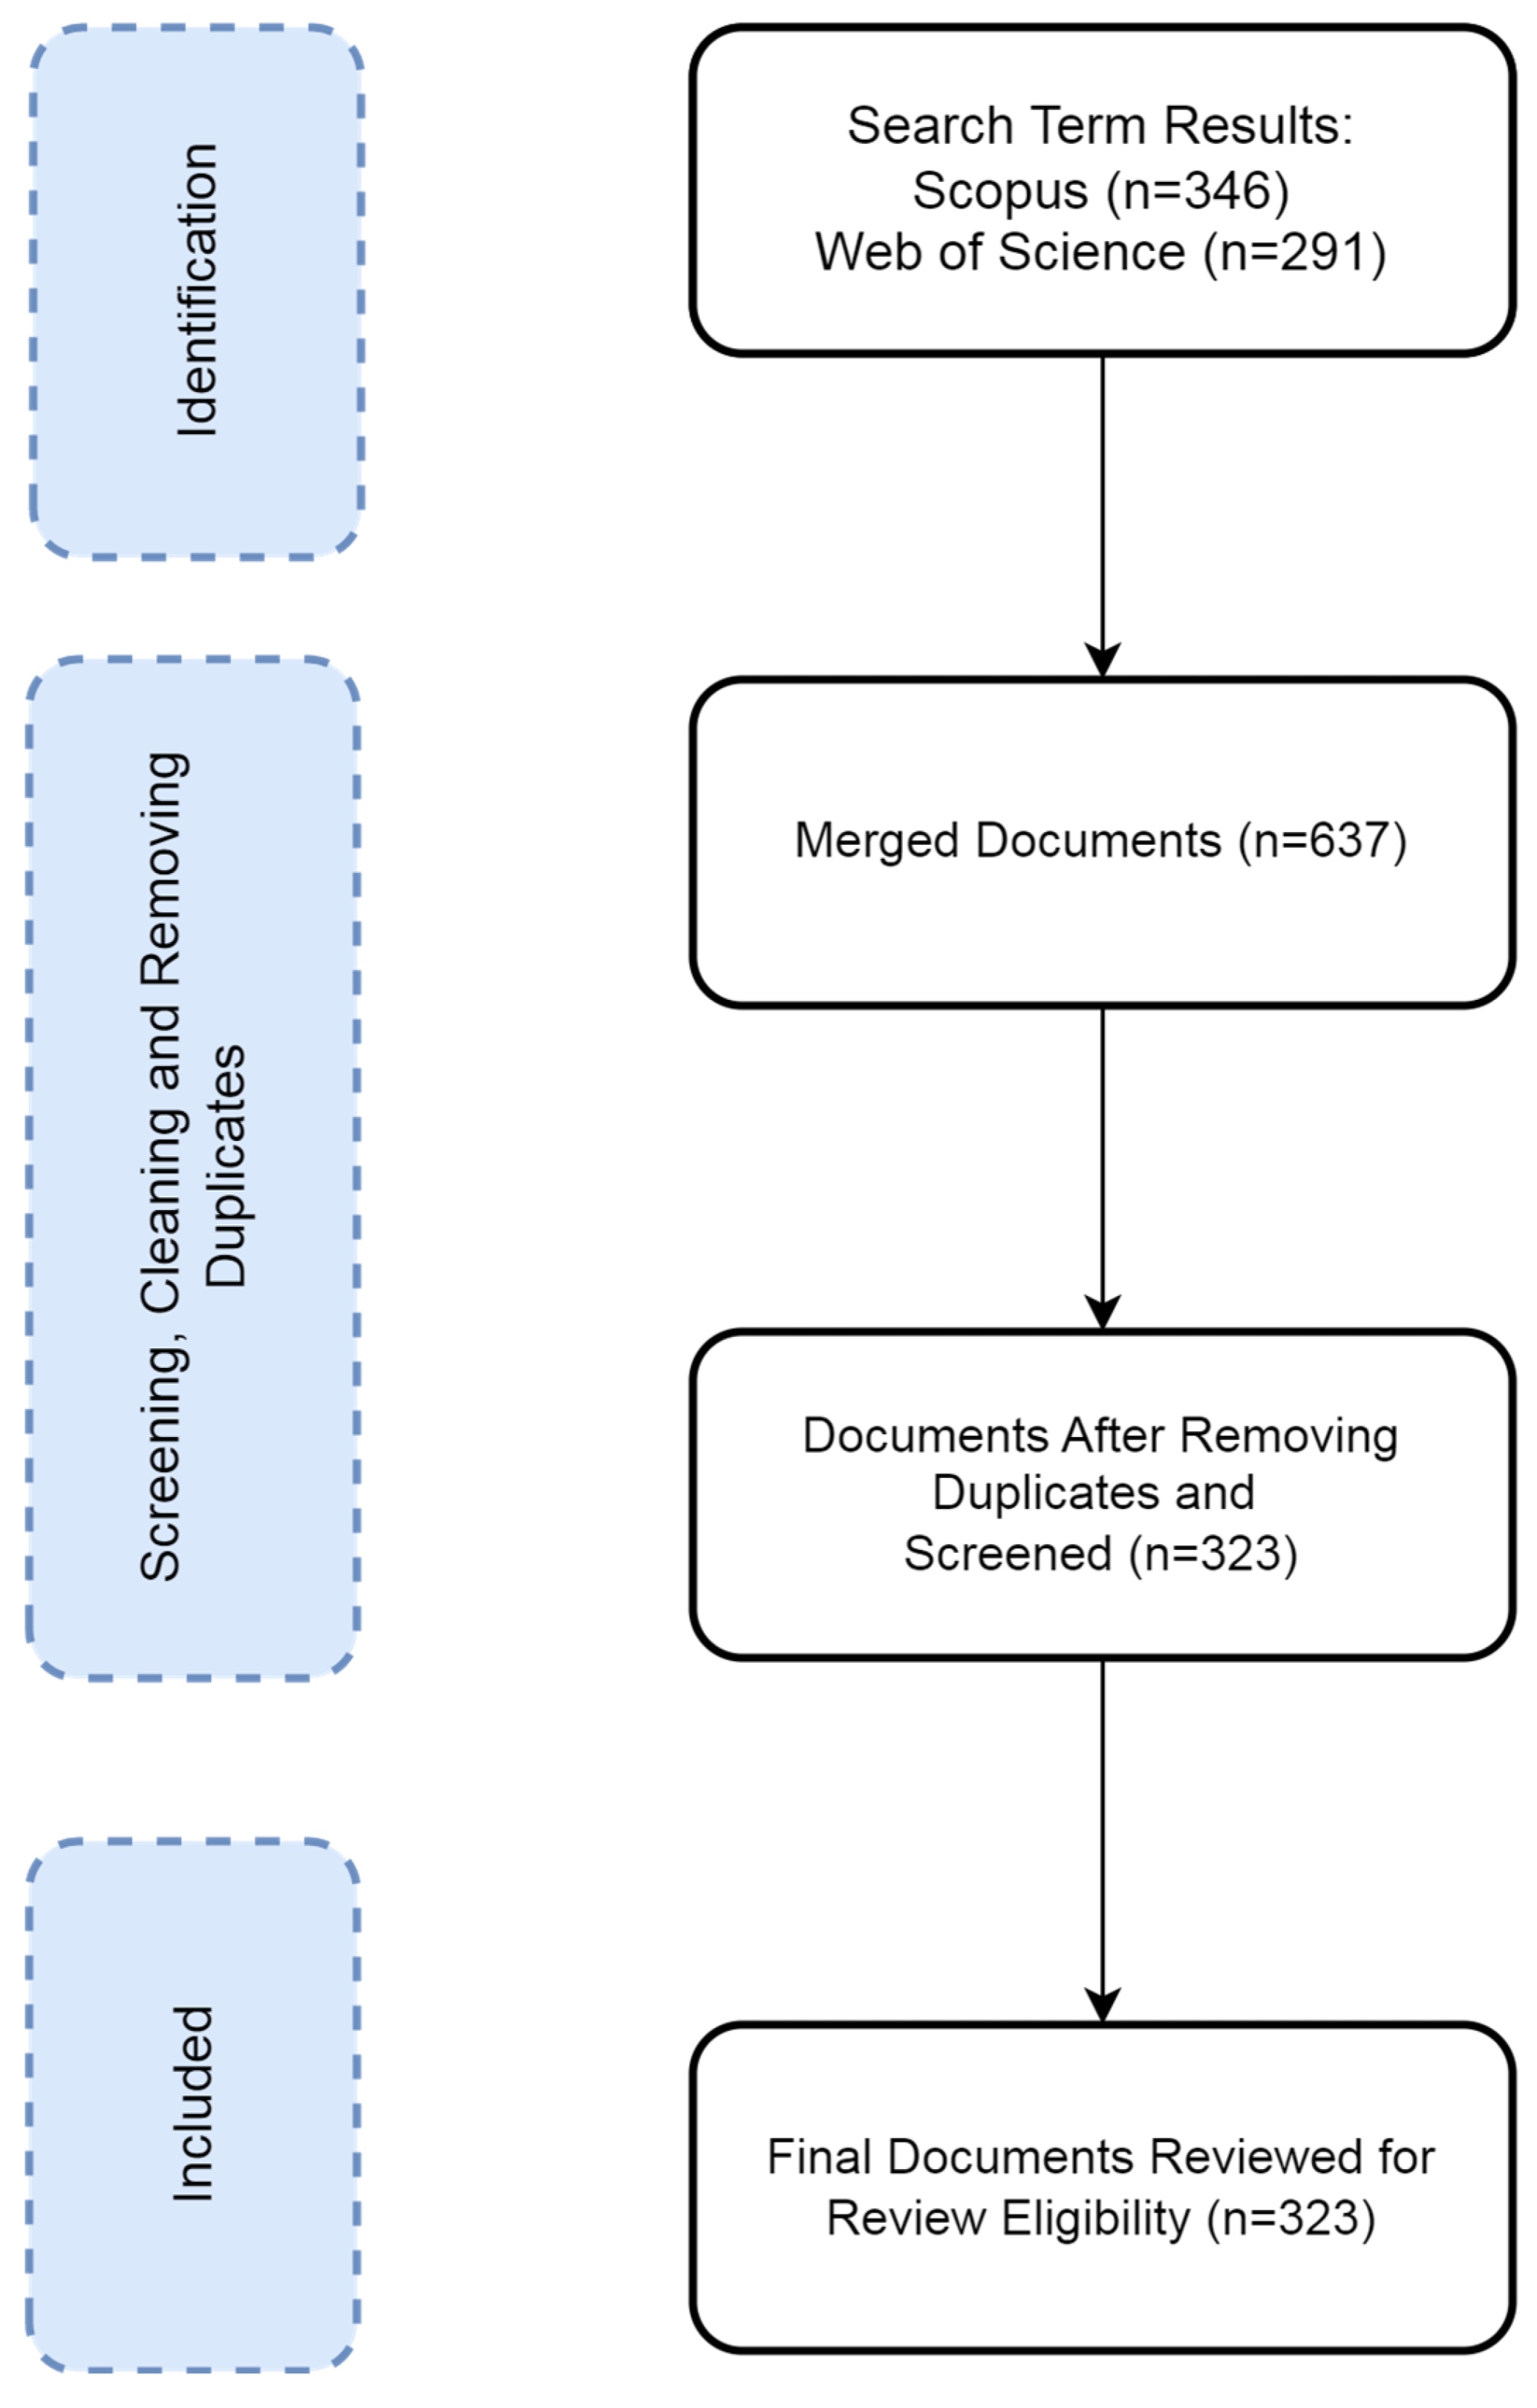
2. Materials and Methods

Electronic databases play a crucial role in providing platforms to carry out systematic reviews of emerging trends, identifying research gaps and challenges. To conduct the bibliometric analysis, the Scopus and Web of Science (WOS) databases were utilized. Table A1 in Appendix A lists search terms that were used to retrieve the documents of grasslands and GEE studies. The search included the article title, abstract, and keywords ranging from 2010 to 2023, because GEE was established in 2010. However, the search yielded publication records between 2016 and 2023. The search was limited to reviewed articles, conference papers, book chapters, and data papers returned in the English language. Documents were processed for data cleaning, and duplicates were removed using R-software (R version 4.1.2), resulting in a total of 323 documents. Furthermore, Zotero was used for screening the final 323 documents. Bibliometric analysis results were carried out using R-Studio (v4.0.4) with interactive biblioshiny to retrieve WOS and Scopus data descriptions, annual scientific production, the most productive countries, a geographical spatial distribution map, journal analysis, and the most globally cited published articles. VOSviewer software (v1.6.16) was used to produce an authors’ keywords’ co-occurrence network analysis [29,30]. Biblioshiny and VOSviewer software products enable loading and exporting information from many sources and the visualization of bibliometric analysis results [31]. The authors’ keywords and co-occurrence network analysis was performed. Figure 1 illustrates the workflow and the process followed.

3. Results

3.1. WOS and Scopus Retrieved Data Description

The WOS and Scopus research results produced 323 documents. The time span ranged from 2016 to 2023. An annual growth rate of 73.59% was observed during this period. Most of the documents retrieved were articles. In total, 1418 authors have participated in the research area. Table 1 lists the summary of the descriptive statistics as derived from WOS and Scopus.

3.2. Annual Scientific Production Trends per Document of Grasslands and GEE Studies

The GEE platform was made available to the scientific community in 2010. The application of GEE for grassland research was first recorded in 2016. The period between 2016 and 2019 is marked by a low frequency of less than 20 published studies based on GEE. Since then, the period of 2020 and 2023 indicates significant progress that has been attained in detecting, mapping, and monitoring grasslands using remotely sensed data. A typical exponential growth rate (73.59%) can be observed with the red dotted line (Figure 2), with a rapid increase starting in 2020. This indicates that most scientists continue to adopt GEE to monitor, map, and model grasslands.

3.3. Geographical Spatial Distribution and Most Globally Cited Scientific Research Contributions per Country

Table 2 lists the top 10 most productive countries, articles, total citations, average article citations, single country publications, and multiple country publications. China has contributed 101 documents, accounting for 31.3%, followed by the USA (United States of America) with 44 documents, accounting for 13.6%, while the lowest contributors are Canada and the UK (United Kingdom) at 1.9%, with just 6 documents each during the analysis period from 2016 to 2023. The top four most cited articles are from China (TC = 3238, AAC = 32.10), USA (TC = 1660, AAC = 37.70), Brazil (TC = 1165, AAC = 36.40), and Italy (TC = 191, AAC = 27.30).
Figure 3 illustrates the spatial distribution of countries that contributed to grasslands and GEE research between 2016 and 2023. Most of the articles were from China (101), followed by the United States (USA) (44), Brazil (32), and South Africa (10). Additionally, other countries, such as Australia (9) India (9), Germany (7), Italy (7), Canada (6), and the United Kingdom (6), had notable contributions. Furthermore, Indonesia (4), Iran (4), Kenya (3), Morroco (3), and New Zealand each contributed a moderate number of articles. Other countries had two publications (Algeria, Argentina, Austria, Botswana, Ethiopia, Finland, Japan, Peru, Portugal, Slovakia, Sweden, Switzerland, Togo, Turkey, and Ukraine) or one publication.

3.4. Journals Analysis

Table 3 lists the top 10 journals on grasslands and GEE for the surveyed period from 2016–2023. The journals are ranked based on the number of articles published during the surveyed period. The top 10 journals have contributed 155 (47.9%) publications. Most authors published in the Remote Sensing journal with 66 (20.4%) articles, followed by Remote Sensing Environment, which has 22 (6.8%) articles and Land which has 16 (4.9%) articles.

3.5. Top Globally Cited Published Documents on Grasslands and GEE Research

Table 4 lists the top 10 globally cited articles on grasslands and GEE application. Souza Jr et al. [32] is one of the top cited articles, and the authors used Landsat-5/7/8 data and a GEE random forest algorithm to generate annual land use and land cover (LULC) information in all Brazilian biomes between 1985 and 2017. They obtained an overall accuracy ranging from 73% to 95%. The 33 years of LULC change data series revealed that Brazil lost 71 Mha of natural vegetation; this was mainly due to cattle ranching and agricultural activities. Alencar et al. [33] used Landsat data to explore the dynamics of the Brazilian Cerrado biome; the classification maps from the study had an average overall accuracy of 71 to 87%. The study also found that native vegetation in the Cerrado biome declined at an average rate of 0.5% per year (748,687 ha yr−1), mostly affecting forests and savannas.
Yang et al. [34] used Landsat and Shuttle Radar Topography Mission (SRTM) datasets in the GEE platform to generate annual land cover at a 30 m spatial resolution. The resulting product achieved a 79.31% classification accuracy. The authors were able to characterize the different land cover changes and found that grasslands had decreased by 3.29%, compared to other regions. The changes were attributed to rapid urbanization during the analysis period from 1990 to 2019. Huang et al. [35] used Landsat-5/7/8 to derive normalized difference vegetation index (NDVI) time series data. The data were used to study the dynamics of vegetation cover in Beijing, where spatial patterns of vegetation loss were mapped with an average overall accuracy of 86.61%. The study also found that 918.36 km2 of land was revegetated to cropland, shrub land, forest, and grassland.
Lui et al. [36] used global land surface satellite products, which included the NDVI, leaf area index (LAI), fraction of absorbed photosynthetically active radiation (FAPAR), evapotranspiration (ET), gross primary production (GPP), broadband emissivity (BBE), white-sky albedo, and the Global Multi-resolution Terrain Elevation Data 2010 to map the global landscape between 1985 and 2015. The derived product had an overall accuracy of 82% and the results indicated that global grassland land cover had decreased at a rate of −136.6 (103 km2/yr). Additionally, the study found that the average human impact level in areas of significant land use change is about 25.49 %. Zurqani et al. [12] utilized Landsat-5/8, the National Land Cover Database (NCLCD), the National Agriculture Imagery Program (NAIP), and digital elevation model (DEM) datasets to perform land use change detection with supervised random forest classification in a savannah environment. In addition, the study found an overall accuracy of 76% to 79%, with major changes attributed to deforestation and reforestation of forest areas during the study period. Jones et al. [37] investigated long term monitoring of rangelands between 1984 and 2017 using a random forest method to predict changes with Landsat 5 TM, 7 ETM+, and 8 OLI data. The annual maps generated were able to guide improvements in rangeland conservation, monitoring, and management.
Liu et al. [38] used a dense time stacking of the multi-temporal Landsat and a random forest algorithm to study LULC in Gannan Prefecture, China, and found that grassland area decreased between 2000 and 2018. However, Liu et al. [39] produced global land cover maps (GCL) using 30 m resolution global land cover (GLC) products within the cloud computing functions of GEE platforms. These generated GCL maps had poor agreement to present grassland, shrub, and tree vegetation classes in transition zones. Yin et al. [40] used Landsat-4/5/7/8 time series data to monitor abandoned croplands with a random forest classifier. The cropland abandonment was accurately classified and separated from other classes with more than 75% overall accuracy.
The studies reveal that through using the GEE platform, researchers were able to map large areas using multi-decade large datasets. Previously, it would have been challenging to carry out such a computation at these large scales. High-performance cloud computing platforms, such as GEE, have supported these types of research. The global scale geospatial analysis platform has greatly improved natural resource monitoring, management, and understanding of Earth’s surface dynamics that impact on a variety of societal issues, such as climate change, food security, ecosystem services, and the Sustainable Development Goals (SDGs) [41].

3.6. Remote Sensing Data from GEE Used in Grassland Research

Most of the publications analyzed used Landsat data (189), followed by Sentinel-2 (71) and MODIS (63) for grassland research in GEE (Figure 4). The other top platforms include climate platforms (e.g., the Climate Hazards Group InfraRed Precipitation with Station Data (CHIRPS) and the Coupled Model Intercomparison Project Phase 5 (CIMP5)) (29), Sentinel-1 (24), the Shuttle Radar Topography Mission (SRTM) (18), and the Advanced Land Observing Satellite (ALOS) (15). Other platforms had a moderate usage, such as the Visible Infrared Radiometer Suite (VIIRS) (7), Light Detection and Ranging (Lidar) (4), the Advanced Spaceborne Thermal Emission and Reflection Radiometer (ASTER) (3), and Planet Scope (3). Both the Project for On-Board Autonomy-Vegetation (PROBA-V) (2) and Advanced Very High-Resolution Radiometer (AVHRR) (1) had the lowest number of publications.

3.7. Application Areas

The commonly used categories for grassland research are summarized in Figure 5. The most dominant application areas are in the land cover/use (149) and agriculture/pasture/rangelands (63) research areas. Both degradation (21) and fires (21) have an equal number of publications. Other application areas, such as biomass (17), ecology (15), wetlands (15), and water (13), had fewer publications. The fewest publications were in forest (7), drought (6), evapotranspiration (6) and soil (3) research areas.

3.8. Authors’ Keywords and Co-Occurrence Network on Grasslands and GEE Research

The authors’ keywords in the top 60 studies were classified into 3 clusters of related focal research themes in different colors as depicted in Figure 6. The authors’ keywords and focal research themes are characterized by nodes. Bigger nodes indicate the frequency of occurrence, and lines between nodes show their relationship strength. As such, keywords, such as Landsat, MODIS, and Sentinel-2, were the predominant remote sensing platforms that helped in the mapping of land use change using Google Earth Engine cloud computing in grasslands. Furthermore, fires, deforestation, land degradation, and climate change keywords are among the driving factors for land cover dynamics in savanna. Other growing focal research themes in keywords include the use of machine learning, the vegetation index, time series analysis, and conservation to improve decision making in environmental protection for biodiversity and ecology.

4. Discussion

The bibliometric analysis presented in this study provides a global overview on the utilization of GEE for monitoring grasslands. Our analysis reveals a growth in the application of GEE for grassland research. The exponential increase in publications since the first recorded use of GEE in 2016 demonstrates its rapid adoption within the scientific community. This trend reflects the platform’s ability to overcome data acquisition and processing challenges, enabling researchers to explore grassland dynamics comprehensively. The surge in research after 2019 highlights the growing recognition of GEE’s potential in grassland applications.
The global distribution of research contributions revealed that China is the leading contributor to grassland and GEE research, with 31.3% of the total publications. This dominance may be attributed to China’s substantial grassland ecosystems and its investments in Earth observation technology. The United States, Brazil, and South Africa also made significant contributions, emphasizing the global relevance of GEE in diverse grassland settings. Notably, the analysis indicates a lack of participation from certain regions, especially in Africa. This gap may result from limited access to infrastructure, including computing resources and advanced Internet of Things resources for processing big data, preventing researchers in these regions from engaging with the GEE platform. This has been observed by Kumar et al. [42] and Vijayakumar et al. [43]. The research further found that GEE continent publications stood at 4% for Oceania, 5% for Africa, 19% for Europe, 25% for America, and 47% for Asia. Addressing this disparity is crucial, as grasslands in developing countries face unique challenges and require effective monitoring and management strategies.
Most articles fall within the thematic scope of the “Remote Sensing” and “Remote Sensing Environment” journals with regards to publishing grassland and GEE research. Similar findings have revealed that Remote Sensing and Remote Sensing of Environment have been leading journals in terms of publication outputs within the Google Earth Engine and remote sensing applications research field [44,45]. Journals, such as “Remote Sensing Environment”, are instrumental in disseminating research findings and facilitating knowledge exchange among scientists and practitioners for grassland research. These journals provide a platform for robust peer-reviewed research, ensuring the credibility of the GEE-based grassland studies. Several studies emerged as influential in the field of grassland and GEE research. For example, the article by Souza Jr et al. [32] stands out as the most cited article. This study demonstrated the power of GEE combined with Landsat data to monitor land cover changes in Brazilian biomes over a 30-year period, emphasizing the platform’s capacity for long-term analyses. Other impactful studies, such as Yang et al. [34] and Huang et al. [35], showcased the ability of GEE to monitor land cover changes in China and vegetation dynamics in Beijing, respectively. These studies highlight GEE’s role in assessing the impacts of urbanization and environmental changes on grasslands. Similarly, research by Liu et al. [36] and Alencar et al. [34] provided valuable insights into land cover changes in the Brazilian savannah, reaffirming GEE’s importance in understanding ecosystem transformations.
The GEE platform with its planetary-scale datasets has allowed researchers from a variety of fields to apply the GEE platform for different applications [42]. Based on our analysis, land cover/use was the most common application. Different authors have indicated increased or decreased rates of different land cover/use types e.g., grasslands, forest, shrubs, and bare soil, by using mainly Landsat datasets for their areas. For example, Feng et al. [46] found that grassland was the dominant land cover type with both progressive and retrogressive interactions with other classes in the Tibetan Plateau. Liu et al. [38] reported in 2020 that grassland area decreased using the analysis period from 2000–2018 in the area of Gannan Prefecture. Souza et al. [32] found that the 33 years of the land cover/use change data series revealed that Brazil lost 71 Mha of natural vegetation, while pasture and agricultural activities increased during this period.
Research on grasslands was the second most dominant research. Parente et al. [47] has shown that pasture area has increased by about 60 Mha over a 33 year period. These changes came at the expense of natural vegetation and forest. Other areas of application include, but are not limited, to fires, ecological biomass, and degradation. All of these were addressed using the GEE platform. Globally, grasslands have been reported to be degrading and in need of restoration to protect the socioeconomic, cultural, and ecological benefits provided by the grasslands [2,48]. The factors affecting grasslands have been attributed to cattle ranching and agriculture activities [32], climate change, overgrazing, and soil erosion [2,49].
Landsat datasets have been widely exploited to understand the long term trends and changes with respect to time compared to other datasets (e.g., Majdaldin et al. [50], Pereira et al. [51]). The legacy data starting from 1970s with Landsat-1 to the more recent Landsat-9 (https://landsat.gsfc.nasa.gov/satellites/timeline/ (accessed on 9 February 2024)) make it possible to study land cover dynamics, including vegetation. The per-pixel analysis approach within the GEE platform allows for time series analysis algorithms to be applied. Sentinel-2 and MODIS data were the second and third most-used data, while climate and Sentinel-1 data had similar numbers of usage. We also noted that most authors fused the different datasets within their analysis. e.g., Wang et al. [52] used S-1, S-2 and Landsat-8 images to estimate the leaf area index and aboveground biomass on grazing pastures and obtained acceptable results. Nasiri et al. [53] used the S-2 and Landsat-8 to map land cover, and Dehghan-Shoar et al. [54] used Landsat-7, Landsat-8, and S2 to monitor grassland nitrogen concentration. Generally, data fusion is considered to increase the accuracy of the estimates. Other datasets, such as Lidar, are not widely available at global scale, except for NASA’s Global Ecosystem Dynamics Investigation (GEDI) mission with a 1 km resolution (https://www.earthdata.nasa.gov/technology/lidar (accessed on 9 February 2024)). As more data become available globally, more researchers will be able to use them for different applications, such as for grassland research.
There are other cloud-based platforms for big Earth Observation data management and analysis. These include the Open Data cube (ODC—https://www.opendatacube.org/ (accessed on 4 April 2024)) [55], Sentinel Hub (SH—https://www.sentinel-hub.com/ (accessed on 4 April 2024)) [56], Open Earth Observation (OpenEO—https://openeo.org/ (accessed on 4 April 2024)) [57], and the System for Earth Observation Data Access, Processing, and Analysis for Land Monitoring (SEPAL—https://sepal.io/ (accessed on 4 April 2024)) [58]. These platforms utilize different programming languages to interact with the data, including Java scripting for GEE. Python and R for SEPAL and OpenEO, and Python for ODC. These platforms were developed to encourage different communities to utilize and adopt geospatial solutions and to promote data democratization. They all offer relatively easy access to geospatial analysis. Different countries, such as Uganda, Equatorial Guinea, and Ethiopia, in Africa, have adopted the SEPAL system to monitor degradation in dry and humid tropical forest [58]. Gomes et al. [59] has comprehensively compared seven big Earth Observation data management and analysis platforms. The authors highlighted the importance of open access systems, such as openEO. However, other systems, such as GEE and SH, were found to be very easy to use in comparison to the other systems, and the researchers concluded that the ODC approach to big Earth observation data management and analysis was more suitable. Kumar et al. [42] have shown that GEE had increased in usage from its inception to the year 2017, with a total of about 300 peer-reviewed papers published in different areas of applications. This number can be expected to have increased between 2018 and 2023.
The use of GEE is an indispensable tool for grassland research. However, the use of GEE has limitations, as outlined in Amani et al. [60]. For example, GEE relies on the availability of remote sensing data, and the data coverage may be limited in certain regions or for specific time periods. The availability and quality of data can impact the effectiveness of analyses. Some datasets in GEE may have a latency, meaning that they are not available in near real-time. This can be a limitation for applications requiring up-to-date information. Effective use of GEE relies on a stable and relatively high-speed Internet connection, which may not be readily available in all regions. Another limitation of the study was the fact that we had a limited scope in terms of research materials from the Scopus and Web of Science databases. The application of GEE worldwide on grasslands has not been well explored, with few studies in Africa, South America, and Asia. The identified research gaps and disparities in regional contributions highlights the need for capacity-building initiatives, particularly in regions with underrepresented grassland ecosystems. Collaboration between countries, institutions, and researchers should aim to bridge these gaps, ensuring a more comprehensive understanding of global grassland dynamics. Future studies can focus on refining and expanding the applications of GEE for grassland monitoring. There is a need for more fine-scale monitoring of grassland dynamics, especially in regions with high spatiotemporal variability. GEE can help bridge this gap by providing frequent, high-resolution satellite imagery. There is a gap in long-term monitoring and analysis of grassland changes over decades, which GEE can cover. Additionally, GEE can assist countries to achieve key targets of biodiversity agendas and support SDGs, specifically SDG 15. Furthermore, based on the findings of this study, future studies can focus on the use of remote sensing data and modeling techniques to estimate carbon stocks, fluxes, and ecosystem service values across different grassland types and management practices. Studies can explore the impacts of climate change on grassland ecosystems and adaptability to environmental pressures. More studies can focus on the use of Sentinel data with the application of machine learning models for grassland extent mapping in GEE, due to its improved spatial resolution in comparison to Landsat, which has a medium resolution.

5. Conclusions

Overall, this bibliometric analysis highlights the growing importance of GEE in advancing our understanding of grassland ecosystems. The study emphasizes the need for continued research and collaboration to address the challenges facing grasslands, such as land degradation, biodiversity loss, and climate change. The increasing adoption of GEE and the wealth of available data hold great promise for improving grassland management practices, promoting sustainable land use, and ensuring food security, particularly in developing countries. This study contributes to the body of knowledge on grassland and GEE research by providing insights into the global trends, key contributors, and research directions. It emphasizes the critical role of GEE in monitoring and managing grasslands, highlighting its potential for addressing pressing environmental and societal issues. As grasslands continue to face threats from various anthropogenic factors, the use of advanced geospatial technologies, like GEE, will be essential in monitoring the grassland ecosystem. This enables researchers, policymakers, and land managers to assess the state of grassland ecosystems, track changes over time, and inform evidence-based decision-making.

Author Contributions

Conceptualization, Z.M.-M., L.N. and C.M. methodology, formal analysis, investigation, data curation, Z.M.-M. and L.N.; writing—original draft preparation, Z.M.-M., L.N., C.M. and G.J.C.; project administration, writing—review and editing, Z.M.-M.; funding acquisition, Z.M.-M., C.M. and G.J.C. All authors have read and agreed to the published version of the manuscript.

Funding

This research was funded by Department of Agriculture, Land Reform and Rural Development (DALRRD), grant number A014 and Agricultural Research Council-Natural Resources and Engineering (ARC-NRE, grant number P07000216), and the National Research Foundation (NRF) Thuthuka project number TTK23030981636.

Data Availability Statement

Data used in this study are available on request.

Acknowledgments

The authors would like to thank the Agricultural Research Council ARC-NRE for creating an enabling environment for research and to the anonymous reviewers for their valuable comments.

Conflicts of Interest

The authors declare no conflicts of interest.

Appendix A

Table A1. Search terms results on the WOS and Scopus databases. * Indicates complete search term.
DescriptionScopusWos
“ Grassland*” AND “Google Earth Engine*”168142
“Prairie*” AND “Google Earth Engine*”99
“Steppe*” AND “Google Earth Engine*”117
“Savanna*” AND “Google Earth Engine*”3833
“Rangeland*” AND “Google Earth Engine*” 2630
“Meadow*” AND “Google Earth Engine*”2520
“Pampas*” AND “Google Earth Engine*”21
“Veld*” AND “Google Earth Engine*”00
“Pasture*” AND “Google Earth Engine*”4438
“Heath*” AND “Google Earth Engine*”10
“Scrubland*” AND “Google Earth Engine*”11
“Tundra*” OR “Arctic grasslands*” AND “Google Earth Engine*”2016
“Fernland*” AND “Google Earth Engine*”00
“Fescue grassland*” AND “Google Earth Engine*”00
“Bromegrass*” AND “Google Earth Engine*”00
“Sward*” AND “Google Earth Engine*”00
“Wild grass*” AND “Google Earth Engine*”00
“Cereal pasture*” AND “Google Earth Engine*”00
“Herbaceous cover*” AND “Google Earth Engine*”00

References

  1. Habel, J.C.; Dengler, J.; Janišová, M.; Török, P.; Wellstein, C.; Wiezik, M. European Grassland Ecosystems: Threatened Hotspots of Biodiversity. Biodivers. Conserv. 2013, 22, 2131–2138. [Google Scholar] [CrossRef]
  2. Bardgett, R.D.; Bullock, J.M.; Lavorel, S.; Manning, P.; Schaffner, U.; Ostle, N.; Chomel, M.; Durigan, G.; Fry, E.L.; Johnson, D.; et al. Combatting Global Grassland Degradation. Nat. Rev. Earth Environ. 2021, 2, 720–735. [Google Scholar] [CrossRef]
  3. Dass, P.; Houlton, B.Z.; Wang, Y.; Warlind, D. Grasslands May Be More Reliable Carbon Sinks than Forests in California. Environ. Res. Lett. 2018, 13, 074027. [Google Scholar] [CrossRef]
  4. Gibon, A. Managing Grassland for Production, the Environment and the Landscape. Challenges at the Farm and the Landscape Level. Livest. Prod. Sci. 2005, 96, 11–31. [Google Scholar] [CrossRef]
  5. O’Mara, F.P. The Role of Grasslands in Food Security and Climate Change. Ann. Bot. 2012, 110, 1263–1270. [Google Scholar] [CrossRef]
  6. Qi, J.; Chen, J.; Wan, S.; Ai, L. Understanding the Coupled Natural and Human Systems in Dryland East Asia. Environ. Res. Lett. 2012, 7, 015202. [Google Scholar] [CrossRef]
  7. Nkonya, E.; Mirzabaev, A.; Von Braun, J. Economics of Land Degradation and Improvement—A Global Assessment for Sustainable Development; Springer Nature: Cham, Switzerland, 2016. [Google Scholar]
  8. Yan, Z.; Gao, Z.; Sun, B.; Ding, X.; Gao, T.; Li, Y. Global degradation trends of grassland and their driving factors since 2000. Int. J. Digit. Earth 2023, 16, 1. [Google Scholar] [CrossRef]
  9. Reinermann, S.; Asam, S.; Kuenzer, C. Remote Sensing of Grassland Production and Management—A Review. Remote Sens. 2020, 12, 1949. [Google Scholar] [CrossRef]
  10. Wang, S.; Jia, L.; Cai, L.; Wang, Y.; Zhan, T.; Huang, A.; Fan, D. Assessment of Grassland Degradation on the Tibetan Plateau Based on Multi-Source Data. Remote Sens. 2022, 14, 6011. [Google Scholar] [CrossRef]
  11. Yuan, Y.; Wen, Q.; Zhao, X.; Liu, S.; Zhu, K.; Hu, B. Identifying Grassland Distribution in a Mountainous Region in Southwest China Using Multi-Source Remote Sensing Images. Remote Sens. 2022, 14, 1472. [Google Scholar] [CrossRef]
  12. Zurqani, H.A.; Post, C.J.; Mikhailova, E.A.; Schlautman, M.A.; Sharp, J.L. Geospatial Analysis of Land Use Change in the Savannah River Basin Using Google Earth Engine. Int. J. Appl. Earth Obs. Geoinf. 2018, 69, 175–185. [Google Scholar] [CrossRef]
  13. Hao, B.; Ma, M.; Li, S.; Li, Q.; Hao, D.; Huang, J.; Ge, Z.; Yang, H.; Han, X. Land Use Change and Climate Variation in the Three Gorges Reservoir Catchment from 2000 to 2015 Based on the Google Earth Engine. Sensors 2019, 19, 2118. [Google Scholar] [CrossRef] [PubMed]
  14. Sulova, A.; Jokar Arsanjani, J. Exploratory Analysis of Driving Force of Wildfires in Australia: An Application of Machine Learning within Google Earth Engine. Remote Sens. 2020, 13, 10. [Google Scholar] [CrossRef]
  15. Ploton, P.; Pélissier, R.; Proisy, C.; Flavenot, T.; Barbier, N.; Rai, S.N.; Couteron, P. Assessing Aboveground Tropical Forest Biomass Using Google Earth Canopy Images. Ecol. Appl. 2012, 22, 993–1003. [Google Scholar] [CrossRef] [PubMed]
  16. Adelisardou, F.; Zhao, W.; Chow, R.; Mederly, P.; Minkina, T.; Schou, J.S. Spatiotemporal Change Detection of Carbon Storage and Sequestration in an Arid Ecosystem by Integrating Google Earth Engine and InVEST (the Jiroft Plain, Iran). Int. J. Environ. Sci. Technol. 2022, 19, 5929–5944. [Google Scholar] [CrossRef]
  17. Liu, S.; Bai, J.; Chen, J. Measuring SDG 15 at the county scale: Localization and practice of SDGs indicators based on geospatial information. ISPRS Int. J. Geo-Inf. 2019, 8, 515. [Google Scholar] [CrossRef]
  18. Tarantino, C.; Aquilino, M.; Labadessa, R.; Adamo, M. Time Series of Land Cover Mappings Can Allow the Evaluation of Grassland Protection Actions Estimated by Sustainable Development Goal 15.1. 2 Indicator: The Case of Murgia Alta Protected Area. Remote Sens. 2023, 15, 505. [Google Scholar] [CrossRef]
  19. Wang, T.; Giuliani, G.; Lehmann, A.; Jiang, Y.; Shao, X.; Li, L.; Zhao, H. Supporting SDG 15, life on land: Identifying the main drivers of land degradation in Honghe Prefecture, China, between 2005 and 2015. ISPRS Int. J. Geo-Inf. 2020, 9, 710. [Google Scholar] [CrossRef]
  20. Xoxo, S.; Mantel, S.; De Vos, A.; Mahlaba, B.; Le Maitre, D.; Tanner, J. Towards SDG 15.3: The biome context as the appropriate degradation monitoring dimension. Environ. Sci. Policy 2022, 136, 400–412. [Google Scholar] [CrossRef]
  21. Ali, I.; Cawkwell, F.; Dwyer, E.; Barrett, B.; Green, S. Satellite Remote Sensing of Grasslands: From Observation to Management. J. Plant Ecol. 2016, 9, 649–671. [Google Scholar] [CrossRef]
  22. Soubry, I.; Doan, T.; Chu, T.; Guo, X. A Systematic Review on the Integration of Remote Sensing and GIS to Forest and Grassland Ecosystem Health Attributes, Indicators, and Measures. Remote Sens. 2021, 13, 3262. [Google Scholar] [CrossRef]
  23. Li, T.; Cui, L.; Xu, Z.; Hu, R.; Joshi, P.K.; Song, X.; Tang, L.; Xia, A.; Wang, Y.; Guo, D.; et al. Quantitative Analysis of the Research Trends and Areas in Grassland Remote Sensing: A Scientometrics Analysis of Web of Science from 1980 to 2020. Remote Sens. 2021, 13, 1279. [Google Scholar] [CrossRef]
  24. Nduku, L.; Kalumba, A.M.; Munghemezulu, C.; Mashaba-Munghemezulu, Z.; Chirima, G.J.; Afuye, G.A.; Busayo, E.T. Earth Observation Systems and Pasture Modeling: A Bibliometric Trend Analysis. ISPRS Int. J. Geo-Inf. 2021, 10, 793. [Google Scholar] [CrossRef]
  25. Wang, Z.; Ma, Y.; Zhang, Y.; Shang, J. Review of Remote Sensing Applications in Grassland Monitoring. Remote Sens. 2022, 14, 2903. [Google Scholar] [CrossRef]
  26. Aria, M.; Cuccurullo, C. Bibliometrix: An R-Tool for Comprehensive Science Mapping Analysis. J. Informetr. 2017, 11, 959–975. [Google Scholar] [CrossRef]
  27. Pérez-Cutillas, P.; Pérez-Navarro, A.; Conesa-García, C.; Zema, D.A.; Amado-Álvarez, J.P. What Is Going on within Google Earth Engine? A Systematic Review and Meta-Analysis. Remote Sens. Appl. Soc. Environ. 2023, 29, 100907. [Google Scholar] [CrossRef]
  28. Velastegui-Montoya, A.; Montalván-Burbano, N.; Carrión-Mero, P.; Rivera-Torres, H.; Sadeck, L.; Adami, M. Google Earth Engine: A Global Analysis and Future Trends. Remote Sens. 2023, 15, 3675. [Google Scholar] [CrossRef]
  29. Van Eck, N.J.; Waltman, L. Software Survey: VOSviewer, a Computer Program for Bibliometric Mapping. Scientometrics 2010, 84, 523–538. [Google Scholar] [CrossRef] [PubMed]
  30. Van Eck, N.J.; Waltman, L. VOSviewer Manual; Leiden Univeristeit: Leiden, The Netherlands, 2019; pp. 1–53. Available online: https://www.vosviewer.com/documentation/Manual_VOSviewer_1.6.10.pdf (accessed on 11 October 2023).
  31. Moral-Muñoz, J.A.; Herrera-Viedma, E.; Santisteban-Espejo, A.; Cobo, M.J. Software Tools for Conducting Bibliometric Analysis in Science: An up-to-Date Review. EPI 2020, 29, e290103. [Google Scholar] [CrossRef]
  32. Souza, C.M.; Shimbo, J.Z.; Rosa, M.R.; Parente, L.L.; A. Alencar, A.; Rudorff, B.F.T.; Hasenack, H.; Matsumoto, M.; G. Ferreira, L.; Souza-Filho, P.W.M.; et al. Reconstructing Three Decades of Land Use and Land Cover Changes in Brazilian Biomes with Landsat Archive and Earth Engine. Remote Sens. 2020, 12, 2735. [Google Scholar] [CrossRef]
  33. Alencar, A.; Shimbo, J.Z.; Lenti, F.; Balzani Marques, C.; Zimbres, B.; Rosa, M.; Arruda, V.; Castro, I.; Fernandes Márcico Ribeiro, J.P.; Varela, V.; et al. Mapping Three Decades of Changes in the Brazilian Savanna Native Vegetation Using Landsat Data Processed in the Google Earth Engine Platform. Remote Sens. 2020, 12, 924. [Google Scholar] [CrossRef]
  34. Yang, J.; Huang, X. The 30 m Annual Land Cover Dataset and Its Dynamics in China from 1990 to 2019. Earth Syst. Sci. Data 2021, 13, 3907–3925. [Google Scholar] [CrossRef]
  35. Huang, H.; Chen, Y.; Clinton, N.; Wang, J.; Wang, X.; Liu, C.; Gong, P.; Yang, J.; Bai, Y.; Zheng, Y.; et al. Mapping Major Land Cover Dynamics in Beijing Using All Landsat Images in Google Earth Engine. Remote Sens. Environ. 2017, 202, 166–176. [Google Scholar] [CrossRef]
  36. Liu, H.; Gong, P.; Wang, J.; Clinton, N.; Bai, Y.; Liang, S. Annual Dynamics of Global Land Cover and Its Long-Term Changes from 1982 to 2015. Earth Syst. Sci. Data 2020, 12, 1217–1243. [Google Scholar] [CrossRef]
  37. Jones, M.O.; Allred, B.W.; Naugle, D.E.; Maestas, J.D.; Donnelly, P.; Metz, L.J.; McIver, J.D. Innovation in Rangeland Monitoring: Annual, 30 m, Plant Functional Type Percent Cover Maps for U.S. Rangelands, 1984–2017. Ecosphere 2018, 9, e02430. [Google Scholar] [CrossRef]
  38. Liu, C.; Li, W.; Zhu, G.; Zhou, H.; Yan, H.; Xue, P. Land Use/Land Cover Changes and Their Driving Factors in the Northeastern Tibetan Plateau Based on Geographical Detectors and Google Earth Engine: A Case Study in Gannan Prefecture. Remote Sens. 2020, 12, 3139. [Google Scholar] [CrossRef]
  39. Liu, L.; Zhang, X.; Gao, Y.; Chen, X.; Shuai, X.; Mi, J. Finer-Resolution Mapping of Global Land Cover: Recent Developments, Consistency Analysis, and Prospects. J. Remote Sens. 2021, 2021, 5289697. [Google Scholar] [CrossRef]
  40. Yin, H.; Brandão, A., Jr.; Buchner, J.; Helmers, D.; Iuliano, B.G.; Kimambo, N.E.; Radeloff, V.C. Monitoring Cropland Abandonment with Landsat Time Series. Remote Sens. Environ. 2020, 246, 111873. [Google Scholar] [CrossRef]
  41. Gorelick, N.; Hancher, M.; Dixon, M.; Ilyushchenko, S.; Thau, D.; Moore, R. Google Earth Engine: Planetary-Scale Geospatial Analysis for Everyone. Remote Sens. Environ. 2017, 202, 18–27. [Google Scholar] [CrossRef]
  42. Kumar, L.; Mutanga, O. Google Earth Engine Applications Since Inception: Usage, Trends, and Potential. Remote Sens. 2018, 10, 1509. [Google Scholar] [CrossRef]
  43. Vijayakumar, S.; Saravanakumar, R.; Arulanandam, M.; Ilakkiya, S. Google Earth Engine: Empowering Developing Countries with Large-Scale Geospatial Data Analysis—A Comprehensive Review. Arab. J. Geosci. 2024, 17, 139. [Google Scholar] [CrossRef]
  44. Zhang, H.; Huang, M.; Qing, X.; Li, G.; Tian, C. Bibliometric Analysis of Global Remote Sensing Research during 2010–2015. ISPRS Int. J. Geo-Inf. 2017, 6, 332. [Google Scholar] [CrossRef]
  45. Zhu, X.; Zheng, J.; An, Y.; Xin, X.; Xu, D.; Yan, R.; Hou, L. Grassland Ecosystem Progress: A Review and Bibliometric Analysis Based on Research Publication over the Last Three Decades. Agronomy 2023, 13, 614. [Google Scholar] [CrossRef]
  46. Feng, S.; Li, W.; Xu, J.; Liang, T.; Ma, X.; Wang, W.; Yu, H. Land Use/Land Cover Mapping Based on GEE for the Monitoring of Changes in Ecosystem Types in the Upper Yellow River Basin over the Tibetan Plateau. Remote Sens. 2022, 14, 5361. [Google Scholar] [CrossRef]
  47. Parente, L.; Mesquita, V.; Miziara, F.; Baumann, L.; Ferreira, L. Assessing the Pasturelands and Livestock Dynamics in Brazil, from 1985 to 2017: A Novel Approach Based on High Spatial Resolution Imagery and Google Earth Engine Cloud Computing. Remote Sens. Environ. 2019, 232, 111301. [Google Scholar] [CrossRef]
  48. Gibbs, H.K.; Salmon, J.M. Mapping the World’s Degraded Lands. Appl. Geogr. 2015, 57, 12–21. [Google Scholar] [CrossRef]
  49. Ren, H.; Zhou, G. Measuring the Impacts of Anthropogenic Activities on Inner Mongolian Temperate Grassland. Land Degrad. Dev. 2018, 29, 2942–2950. [Google Scholar] [CrossRef]
  50. Majdaldin, R.A.; Osunmadewa, B.A.; Csaplovics, E.; Aralova, D. Remote Sensing-Based Vegetation Indices for Monitoring Vegetation Change in the Semi-Arid Region of Sudan; Christopher, M., Neale, U., Maltese, A., Eds.; Proceedings of SPIE—The International Society for Optical Engineering: Edinburgh, UK, 2016. [Google Scholar] [CrossRef]
  51. Pereira, O.J.R.; Ferreira, L.G.; Pinto, F.; Baumgarten, L. Assessing Pasture Degradation in the Brazilian Cerrado Based on the Analysis of MODIS NDVI Time-Series. Remote Sens. 2018, 10, 1761. [Google Scholar] [CrossRef]
  52. Wang, J.; Xiao, X.; Bajgain, R.; Starks, P.; Steiner, J.; Doughty, R.B.; Chang, Q. Estimating Leaf Area Index and Aboveground Biomass of Grazing Pastures Using Sentinel-1, Sentinel-2 and Landsat Images. ISPRS J. Photogramm. Remote Sens. 2019, 154, 189–201. [Google Scholar] [CrossRef]
  53. Nasiri, V.; Deljouei, A.; Moradi, F.; Sadeghi, S.M.M.; Borz, S.A. Land Use and Land Cover Mapping Using Sentinel-2, Landsat-8 Satellite Images, and Google Earth Engine: A Comparison of Two Composition Methods. Remote Sens. 2022, 14, 1977. [Google Scholar] [CrossRef]
  54. Dehghan-Shoar, M.H.; Pullanagari, R.R.; Kereszturi, G.; Orsi, A.A.; Yule, I.J.; Hanly, J. A Unified Physically Based Method for Monitoring Grassland Nitrogen Concentration with Landsat 7, Landsat 8, and Sentinel-2 Satellite Data. Remote Sens. 2023, 15, 2491. [Google Scholar] [CrossRef]
  55. Killough, B. Overview of the Open Data Cube Initiative. In Proceedings of the IGARSS 2018–2018 IEEE International Geoscience and Remote Sensing Symposium, Valencia, Spain, 22–27 July 2018; pp. 8629–8632. [Google Scholar] [CrossRef]
  56. Kadunc, M.; Milcinski, G.; Vrecko, A.; Repse, M.; Kolaric, P.; Yuan, F.; Killough, B. Sentinel Hub—On-Demand ARD Generation. In Proceedings of the IGARSS 2023—2023 IEEE International Geoscience and Remote Sensing Symposium, Pasadena, CA, USA, 16–21 July 2023; pp. 1024–1025. [Google Scholar] [CrossRef]
  57. Di Leo, M.; Minghini, M.; Kona, A.; Spadaro, N.; Kotsev, A.; Dusart, J.; Tzotsos, A. Digital earth observation infrastructures and initiatives: A review framework based on open principles. Int. Arch. Photogramm. Remote Sens. Spat. Inf. Sci. 2023, XLVIII-4/W7-2023, 33–40. [Google Scholar] [CrossRef]
  58. FORIS, Open. SEPAL.System for Earth Observation Data Access, Processing and Analysis for Land Monitoring. Available online: http://www.fao.org/3/CA1085EN/ca1085en.pdf (accessed on 8 March 2024).
  59. Gomes, V.C.; Queiroz, G.R.; Ferreira, K.R. An Overview of Platforms for Big Earth Observation Data Management and Analysis. Remote Sens. 2020, 12, 1253. [Google Scholar] [CrossRef]
  60. Amani, M.; Ghorbanian, A.; Ahmadi, S.A.; Kakooei, M.; Moghimi, A.; Mirmazloumi, S.M.; Brisco, B. Google Earth Engine Cloud Computing Platform for Remote Sensing Big Data Applications: A Comprehensive Review. IEEE J. Sel. Top. Appl. Earth Obs. Remote Sens. 2020, 13, 5326–5350. [Google Scholar] [CrossRef]
Figure 1. Flow diagram method for the publication selection criteria.
Grasses 03 00006 g001
Figure 2. Annual scientific production of grasslands and GEE studies from 2016–2023. The red line depicts the exponential growth in publications.
Grasses 03 00006 g002
Figure 3. Spatial distribution map on grasslands and GEE studies from 2016–2023 (note: grey colored regions have no data captured).
Grasses 03 00006 g003
Figure 4. Satellite data applications within GEE for the surveyed period.
Grasses 03 00006 g004
Figure 5. A broad categorization of the disciplines of applications of GEE for the surveyed period in relation to grasslands.
Grasses 03 00006 g005
Figure 6. Top 60 Authors keywords’ co-occurrence network on grasslands and GEE studies from 2016–2023.
Grasses 03 00006 g006
Table 1. Data description of WOS and Scopus on grasslands and GEE studies.
DescriptionResults
Timespan2016–2023
Documents323
Sources (journals, books, etc.)111
Keywords plus 1937
Author’s keywords 1006
Average citations per document23
Authors1418
Co-authors per document5.75
Annual growth rate (%)73.59
Document type
Articles290
Conference papers20
Review4
Book chapters3
Data paper6
Table 2. Top 10 most productive countries and cited per average article citation on grasslands and GEE studies from 2016–2023.
RankCountryTCP * (%)ArticlesTC *AAC *SCP *MCP *
1China31.3%101323832.10992
2USA13.6%44166037.70440
3Brazil9.9%32116536.40311
4South Africa3.1%1011311.30100
5Australia2.8%917219.1081
6India2.8%9434.8090
7Germany2.2%7263.7070
8Italy2.2%719127.3070
9Canada1.9%611218.7060
10United Kingdom1.9%66410.7060
* Total scientific production (TCP); articles; total Citations (TC); average article citations (AAC); single country publications (SCP); multiple country publications (MCP).
Table 3. Top 10 journals on grasslands and GEE studies from 2016–2023.
RankSourcesArticlesImpact Factor
1Remote Sensing665.0
2Remote Sensing Environment2213.5
3Land163.9
4Ecological Indicators116.9
5Remote Sensing Applications: Society and Environment94.7
6Environmental Monitoring and Assessment73.0
7Geocarto International73.8
8International Journals of Applied Earth Observation and Geoinformation77.5
9Earth System Science Data511.4
10Environmental Research Letters56.7
Table 4. Top 10 globally cited published articles on grasslands and GEE studies from 2016–2023.
RankArticles TitleTCTC per YearData UsedReference
1The 30 m annual land cover dataset and its dynamics in China from 1990 to 2019686171.50Landsat-5/7/8[34]
2Reconstructing three decades of land use and land cover changes in brazilian biomes with landsat archive and earth engine603120.60Landsat-5/7/8, SRTM[32]
3Mapping major land cover dynamics in Beijing using all Landsat images in Google Earth Engine 32440.50Landsat-5/7/8[35]
4Annual dynamics of global land cover and its long-term changes from 1982 to 201518436.40Global Land Surface Satellite Products[36]
5Geospatial analysis of land use change in the Savannah River Basin using Google Earth Engine16323.29Landsat-5/7/8[12]
6Innovation in rangeland monitoring: annual, 30 m, plant functional type percent cover maps for US rangelands14020.00Landsat-5/7/8[37]
7Mapping three decades of changes in the brazilian savanna native vegetation using landsat data processed in the Google Earth Engine platform12324.60Landsat-5/7/8[33]
8Land use/land cover changes and their driving factors in the Northeastern Tibetan Plateau based on Geographical Detectors and Google Earth Engine: A case study in Gannan Prefecture9919.80Landsat TM and OLI[38]
9Finer-resolution mapping of global land cover: Recent developments, consistency analysis, and prospects9824.50Landsat-5/7/8[39]
10Monitoring cropland abandonment with Landsat time series9819.60Landsat-4/5/7/8[40]
Disclaimer/Publisher’s Note: The statements, opinions and data contained in all publications are solely those of the individual author(s) and contributor(s) and not of MDPI and/or the editor(s). MDPI and/or the editor(s) disclaim responsibility for any injury to people or property resulting from any ideas, methods, instructions or products referred to in the content.

