
Yemeni Sidr Honey Inhibits Cell Proliferation and Promotes Apoptosis in Human Cancer and Mouse-Derived Cell Lines

1
Program in Biomolecular Sciences, Laurentian University, Sudbury, ON P3E 2C6, Canada
2
Department of Medical Sciences, Northern Ontario School of Medicine University, Sudbury, ON P3E 2C6, Canada
3
Health Sciences North Research Institute, Sudbury, ON P3E 2H3, Canada
*
Author to whom correspondence should be addressed.
†
Deceased author.
Targets 2024, 2(2), 64-79; https://0-doi-org.brum.beds.ac.uk/10.3390/targets2020004
Submission received: 17 January 2024
/
Revised: 15 April 2024
/
Accepted: 16 April 2024
/
Published: 26 April 2024
Abstract
:Honey has become popular as a potential treatment for several ailments, including cancer. Honeys from different parts of the world have been shown to have different anti-proliferative, immune-modulatory, and anti-inflammatory actions. Yemeni Sidr honey (YSH) is world-renowned for its anti-inflammatory activity and has been suggested to have anti-cancer activity, although empirical evidence is lacking. We tested three YSH samples by HPLC to show they contained similar sugars and an overlapping group of phenolic and flavonoid components, as described previously. YSH’s apoptotic and anti-proliferative activities were measured in in vitro models of cancer growth. The treatment of breast cancer cell lines (MDA-MB-231 and MCF-7), a cervical cancer cell line (HeLa), and mouse melanoma cells (B16-BL6) with 1% (w/v) YSH in media for 48–72 h almost completely inhibited cell proliferation and promoted cell apoptosis. In contrast, a non-malignant HBL-100 cell line was more resistant to treatment with YSH. This suggests that YSH may be a good candidate as an anti-cancer treatment, which requires further study.
1. Introduction
Honey is used as a complementary therapy to treat patients with a wide range of conditions due to its wound-healing, antimicrobial, and anti-inflammatory effects [1]. There are also some pre-clinical data that show that honey or honey products, such as propolis, have an inhibitory effect on cancer cell growth by altering apoptosis, oxidative damage, or anti-inflammatory activity [2,3,4]. Since current treatments for cancer are not always effective and are frequently associated with negative side effects, there has been significant research into discovering new chemotherapy candidates, which include alternate and traditional medicines, such as honey [5,6]. There are a variety of different types of honey that differ in chemical composition based on the species of bees, the geographical location, and the plants used as the pollen source [7,8]. These differences in composition are also associated with differences in their effects on cancer cells [9,10,11].
Yemeni Sidr honey (YSH) is a particular example of a natural product with distinct anti-cancer effects [12,13], and it has similar properties to some other types of honey, including Tualang honey and Manuka honey [14,15,16]. Tualang honey is produced in Southeast Asia by the giant honey bee Apis dorsata from multiple flora, and Manuka honey is a monofloral honey produced by honeybees from the nectar of the Manuka honey bush (Leptospermum scoparium) throughout New Zealand and Australia [5,17]. Both have been shown to have anti-bacterial, anti-inflammatory, and anti-cancer activities. Both are also rich in an overlapping set of phenolic and flavonoid compounds which have been associated with various clinical activities [5]. Several other honeys found around the world, including jejube, jungle honey, chestnut honey, and acacia honey, have also be shown to have a variety of clinically relevant activities as well as a complex set of chemical components [18,19,20,21,22,23]. While these honeys contain some common components, there are frequent differences between the various types of honey that may be relevant to their specific activities.
In Yemen, beekeeping is an ancient profession, dating as far back as the 10th century BCE. Today, the country produces as much as 5600 tons/year of natural honey, with an approximate value of USD 40 million [9]. A significant proportion of Yemeni honey is Sidr honey, produced by bees from the nectar of the Ziziphus spina-christi tree from the remote Dawan and Gerdan areas of Hadramout and Shabwa [9,11]. The result is one of the most prized and expensive monofloral honeys available [12,13]. In other locations, Sidr honey is harvested from bees that derive the nectars of the jujube tree (also known as Christ’s Thorn Jujube) and is utilized for a variety of medicinal purposes [14]. Like several other honey varieties, Yemeni Sidr honey (YSH) has historically occupied an important position in alternative medicine. The product has been hailed as an effective therapy for ailments such as constipation and gastric and duodenal ulcers, as well as for wound healing [15]. Moreover, YSH is used for the maintenance of the optimal function of the nervous and gastrointestinal systems. Its anti-inflammatory and anti-oxidant effects have been deemed beneficial in preventing hepatic injury [12,16]. In addition, it has been used as an anti-microbial agent in traditional medicine practice [13]. YSH is also considered to be useful in resolving insomnia, allergy, arthritis, as well as anemia. Due to the high demand and high value of YSH, it has commonly been adulterated with other types of honey or with other products in order to increase its volume for sellers. Consequently, scientific methods to determine the purity of samples of the product have been described by several studies [7,24]. Acknowledgement of this concern is important not only to ensure the accuracy of investigations using samples of YSH but also for the potential development of therapeutic derivatives from such samples.
Beyond the longstanding rivalry of this variety of honey with other premium types such as the New Zealand’s Manuka honey, the fact that they are monofloral might be beneficial for drug discovery [9]. A well-recognized obstacle in any attempt to explain the anti-cancer mechanisms of various honey varieties has been the presence of a vast number of substances that constitute honey and the possibility that each component has separate activity contributing to the observed effects. As a monofloral moiety, YSH offers more promise in terms of isolating active anti-cancer constituents, a step that is of obvious significance in the ultimate goal of developing a practical chemotherapeutic agent. In the current study, the effects of YSH on cancer cells and the determination of the mechanisms by which YSH inhibits cancer cell growth were investigated.
2. Materials and Methods
2.1. Cell Lines and Tissue Culture
MCF-7 (human breast adenocarcinoma), MDA-MB-231 (human triple-negative breast adenocarcinoma), HeLa (human cervical adenocarcinoma), and B16-BL6 (mouse melanoma) cells were all obtained from the American Type Culture collection, ATCC, Manassas, VA, USA. The HBL-100 (non-malignant breast epithelial cells) were obtained from Dr K.M. Yamada, National Institutes of Health. These cell lines were maintained in Dulbecco’s Modified Essential Medium (DMEM, Hyclone, Logan, UT, USA) supplemented with 10% (v/v) fetal bovine serum (FBS, Hyclone), 100 µg/mL streptomycin, and 100 U/mL penicillin (Invitrogen, Burlington, ON, Canada) at 37 °C in 5% CO2.
2.2. Preparation of Honey Samples
Three YSH samples were used in these experiments. Two of these samples were obtained from commercial markets in the Kingdom of Saudi Arabia, while the third sample was purchased from Lote and Co. (London, UK), which sells characterized and verified products (Table 1). For some experiments, a commercial, polyfloral, “clover” honey was used to determine whether YSH has a distinct profile and thus comprehend the effect. The honey samples were stored in sealed containers at ambient temperature and ranged in age from 1 to 5.5 years. For the experiments, the honey samples were diluted in serum-free culture medium at a stock concentration of 10% (w/v) and dissolved by incubation at 37 °C for 15 min. The stocks were diluted in complete culture media for cell treatments ranging in concentration from 0.1–10% (w/v) as described in the specific experimental procedures.
2.3. Characterization of YSH by HPLC
The relative amount of specific sugars was determined using HPLC and compared to purified standards [25,26,27]. The honey samples were diluted to 5% (w/v), and the purified standards (fructose, glucose, sucrose, maltose, and trehalose [Fisher Scientific, Waltham, MA, USA]) were dissolved in water to 1% (w/v) by incubation at 37 °C and filtered through a 0.22 μm syringe filter. The samples were subjected to HPLC on a Breeze 2 chromatography system (Waters Limited, Mississauga, ON, Canada) [25,27] fitted with an X-Bridge Amide 3.5 μm, 4.6 × 150 mm column and an X-Bridge 3.5 μm, 4.6 × 20 mm guard column (Waters Limited). The samples (5–20 μL) were injected onto the column, and the mobile phase (80% acetonitrile and 20% water) ran at 1 mL/min for 20 min at 60 °C [24]. Peaks were detected at an absorbance of 195 nm [28,29]. Two independent preparations of each solution were analyzed using different amounts of sample. A standard curve of different concentrations of the purified sugar standards was created, and the amount of the corresponding sugar peak in the honey preparation was determined using the area under the peak. The relative amounts of each sugar were determined as a percentage of the total amount of honey analyzed.
The phenolic and flavonoid molecules in the honey samples were characterized following purification from the large amounts of sugar in the samples. For purification, 25 g of each type of honey was dissolved in 250 mL of 1% HCl at 37 °C for 30 min, combined with 35 g of Amberlite-2AD resin (Sigma-Aldrich Canada, Oakville, ON, Canada), mixed by stirring for 30 min, and then collected into a 3 × 20 cm column [30,31]. The honey mixture was passed through the column, and then, the column was washed sequentially with 250 mL of 1% HCl and 250 mL of water. The phenolics on the column were eluted with 250 mL of methanol, and the methanol fraction was concentrated to a volume of 8 mL under reduced pressure, and water was added to give a final concentration of 80% methanol. The purified samples were subjected to HPLC on a Breeze 2 chromatography system fitted with a Sunfire C18 3.5 μm, 4.6 × 100 mm column and a Sunfire C18 3.5 μm, 4.6 × 20 mm guard column (Waters Limited). The samples or standards (2–5 μL) were injected onto the column and the mobile phase applied at 1 mL/min: the mobile phase was composed of a gradient between Buffer A (5% acetic acid in water) and Buffer B (5% acetic acid in acetonitrile) which was set to change from 100% Buffer A to 50% Buffer A: 50% Buffer B after 40 min, to 100% Buffer B from 40 to 50 min, and then to 100% Buffer A from 50 to 60 min) [31,32,33]. The absorbance of the eluent was measured at 280 nm and 320 nm and at 370 nm and 425 nm in two separate runs. Two independent preparations of each phenolic purification were analyzed at least two separate times for each type of honey. A standard curve of different concentrations of gallic acid, chlorogenic acid, caffeic acid, vanillic acid, trans-p-coumaric acid, 4-hydroxy-3-methoxycinnamic acid, transferulic acid, ellagic acid, and quercetin (Fisher Scientific) was created [33]. Individual peaks in the honey chromatographs were identified based on comparison to the retention time of the standard as well as by comparing the change in peak area between chromatographs obtained at different wavelengths. The relative amounts of each component were determined based on the area of the corresponding peaks in the chromatographs obtained at 280 nm.
2.4. Sulphorodhamine B (SRB) Assay
SRB assays were performed to determine the relative cell number [34]. For each experiment, 100 µL/well of MCF-7, HBL-100 cells at 4000 cells/mL, HeLa, or MDA-MB-231 cells at 3000 cells/mL was plated onto replicate 96-well plates and incubated overnight at 37 °C. The growth medium was replaced with media containing 0.1–10% YSH, 0.1–10% glucose, or 10 µM of camptothecin, as indicated, and incubated for an additional 48–72 h. The cells were fixed by incubation with 50% ice-cold tricholoracetic acid (TCA) for 1 h, washed with water, and then air dried. The fixed cells were then stained by incubation in a 0.1% (w/v) SRB solution for 30 min at room temperature, washed, and then re-suspended in 200 μL of 10 mM Tris buffer, pH 10.5. The absorbance of each well was recorded at a wavelength of 530 nm and the IC50 values for YSH were calculated using a sigmoidal dose–response curve using Graph Pad Prism V 4.02 software (Graph Pad Software, Inc., San Diego, CA, USA).
2.5. MTT Assay (Methyl Tetrazolium Blue)
The methyl thiazol tetrazolium (MTT) assay was performed to measure the enzyme activity of viable cells, and the result of this assay was a mixture of cell viability and cell proliferation. Cell viability was determined in cells treated with 0.1–10% YSH, 0.1–10% glucose, or 10 µM of camptothecin. Cells, at 2000 cells/well, were plated onto replicate 96-well plates with one plate/day of experiment [35] and incubated overnight at 5% CO2 and 37 °C. Each column of the 96-well plate (n = 8) was treated with the same condition and incubated in the continued presence of the YSH over the course of 4–5 days without a media change. On each day of the experiment, one of the replica plates was treated with 0.25 µg/mL MTT for 4 h, the media were removed, and 100 μL/well of dimethyl sulfoxide (DMSO) added to solubilize the converted formazan crystals. The absorbance of each well was read at 540 nm and the relative cell viability was determined as the average of each treatment minus the culture medium background relative to untreated cells. Statistical analysis was performed using an ANOVA using Graph Pad Prism Software.
2.6. Cell Proliferation Using Incucyte® Proliferation Assays for Live-Cell Analysis
Cell proliferation was performed using an IncuCyte® Proliferation Assay for Live-Cell Analysis (Essen BioScience, Ann Arbor, MI, USA) on the IncuCyteS3 cell analysis module, which allows cell proliferation to be quantified by counting the number of phase objects over time. For the experiments, the cells were plated onto a 96-well plate and incubated at 37 °C for 24 h in the Incucyte module. The cells were treated with 0.32–5% (w/v) YSH. The Incucyte module was set to photograph and count the cells from 8 different areas for each sample well, each day for 7 days, and the change in cell number was calculated and plotted for each condition.
2.7. Wound-Healing Assay
MDA-MB-231, MCF-7, and B16-BL6 cells were grown to form confluent monolayers on 6-well plates, and a “wound” was created by scratching with a sterile 500 μL pipette tip [36]. The media were removed and replaced with media containing 1% YSH or suspending media, and the plates were incubated at 37 °C and 5% CO2. Scratch closure was monitored and imaged over 6–24 h using the IncucyteS3 Live imaging protocol at 4× magnification (Essen BioScience). The recovery of the scratched area was calculated using commercially available Image J 1.8.0 (https://imagej.net/ij/) image analysis software [37] and presented as the percentage of wound closure.
2.8. Detection of Apoptosis by Acridine Orange/Ethidium Bromide
To examine changes in cellular morphology for MDA-MB-231 and MCF-7 cells treated with YSH, the cells were stained with acridine orange and ethidium bromide and visualized on a fluorescence microscope [38]. The cells were adhered to 6-well plates overnight at 37 °C and then treated with different concentrations of YSH in culture media for 24 and 48 h. Cells were treated with 6 μM of camptothecin for 24–48 h as a positive control for apoptosis. Following treatment, each sample was stained with 100 μg/mL acridine orange (Sigma-Aldrich) and 100 μg/mL of ethidium bromide (Sigma-Aldrich) in culture media for 5 min. Finally, the cells were washed with PBS, pH 7.4, and then, each live-stained monolayer was visualized using an OLYMPYS (Tokyo, Japan) fluorescence microscope.
2.9. Analysis of Cell Cycle Distribution
The cells were stained with propidium iodide and analyzed using flow cytometry to measure apoptotic cells with fractional (sub-G1) DNA content as well as cell cycle profiles [39]. MCF-7, MDA-MB-231, HeLa, B16-BL6, and HBL-100 cells were exposed to 0.5–2.5% YSH, glucose, or 6 µM of camptothecin for 24 h to 72 h and then harvested using trypsin. The collected cells were washed twice in PBS, pH 7.4, and fixed by incubation in 75% ice-cold ethanol and stored at −20 °C. For analysis, the cells were washed twice with PBS, pH 7.4, and suspended in 0.5 mL of PBS, pH 7.4, and 0.5 mL of propidium iodide (PI) staining solution (PBS, pH 7.4, 0.3% Nonidet P-40, 100 μg/mL RNase A, and 100 μg/mL propidium iodide) was added and incubated for 1 h. The re-suspended samples were then analyzed by flow cytometry using an FC600 Flow Cytometer (Beckman Coulter, Brea, CA, USA) to detect the relative PI staining and the proportion of cells in the sub-G1, Go/G1, S, and G2/M phases determined.
2.10. Immunoblot Analysis
Immunoblot analysis was used to detect various apoptosis-related proteins in YSH-treated cells. Proteins were extracted and quantified from cells cultured on 10 cm plates and cells treated with 1% YSH, glucose, or control media for 0, 24, 48, and 72 h. Whole-cell extracts were collected in RIPA buffer (PBS, pH 7.4, 1% Nonidet P-40, 0.5% sodium deoxycholate, 0.1% SDS) supplemented with a protease cocktail tablet (Roche Diagnostics, Indianapolis, IN, USA) and sheared by passage through a 20 Ga needle. Protein levels were quantified using a BCA Assay kit (Pierce Chemical, Fisher), and 25 µg or 50 µg of cellular lysate protein was subjected to electrophoresis on polyacrylamide gels containing sodium dodecylsulfate (SDS-PAGE). The proteins in the gel were then transferred onto a PVDF membrane (GE Health Care, Chicago, IL, USA) stained with 0.1% Ponceau S in 1% acetic acid and “blocked” by incubation in 5% Carnation non-fat skim milk in TBST (50 mM Tris-HCl, pH 7.4, 150 M NaCl, 0.1% [v/v] Tween 20) for 1 h [40]. The membrane was incubated with primary antibodies against Bcl-2, Bax, Caspase 9, and PARP-1 and GAPDH and β-tublin (loading controls) (Santa Cruz Biotech., Santa Cruz, CA, USA) (in 5% Carnation non-fat skim milk, in TBST) overnight at 4 °C. The blots were washed and then incubated with a secondary antibody—horseradish peroxidase conjugate (Santa Cruz Biotech) (titer 1:10,000 diluted in 5% non-fat skim milk in TBST) for 1 h at room temperature and visualized using an ECL kit (Enhanced Chemiluminescence, GE Health care) and exposed to X-ray film.
3. Results
3.1. Characterization of Honey Sugars
The HPLC analysis of the four different samples of honey and the fructose, glucose, sucrose, maltose, and trehalose sugar standards (Figure 1) showed the three monofloral Sidr honeys were similar to each other but different from the polyfloral clover honey. The determination of the relative amounts of each identified sugar in the honey samples showed that the clover honey (honey 1) contained 37.5% fructose, which was higher than the three YSH samples, which contained 28–30.7% fructose (Table 2). Clover honey contained much lower proportions of glucose, sucrose, and maltose compared to the three YSH samples, which contained similar levels of these sugars. Honey 2 contained a much higher concentration of trehalose than the other honeys.
3.2. Characterization of Honey Phenolics
The HPLC analysis of the phenolic and flavonoid components in the four different samples of honey showed the presence of several different peaks which absorbed at the four different tested wavelengths (Figure 2). Multiple phenolic or flavonoid compounds have been previously identified in YSH and other honeys, and so, a group of 10 compounds including gallic acid, chlorogenic acid, caffeic acid, vanillic acid, trans-p-coumaric acid, 4-hydroxy-3-methoxy-cinnamic acid, transferulic acid, ellagic acid, and quercetin was used as standards. The retention time for each standard was identified, and the relative absorption at each wavelength was determined. The chromatographs of the honey samples looked different: all of the samples contained multiple peaks which showed characteristic differences depending on the absorbance wavelength. For example, all four samples of honey showed a major peak at 280 nm, with a retention time of 2.4 min, which was much lower in intensity at 320 nm, corresponding to ellagic acid. Honey 1, the commercial clover honey, was the only sample that did not show significant peaks at 8.4 min and 24.7 min at both 280 nm and 320 nm, corresponding to chlorogenic acid and quercetin, respectively. All four honeys contained peaks that corresponded to gallic acid, caffeic acid, vanillic acid, trans-p-coumaric acid, 4-hydroxy-3-methoxycinnamic acid, transferulic acid, ellagic acid, and quercetin standards (Table 3). However, all of the honey samples also contained several peaks that have not been identified.

Table 3.
The weight percent for specific components in samples of honey.
| Honey 1 | Honey 2 | Honey 3 | Honey 4 | |
|---|---|---|---|---|
| gallic acid | 14.8 | 18.24 | 34.65 | 42.4 |
| chlorogenic acid | Nd | 3.84 | 1.35 | 1.6 |
| caffeic and vanillic acid | 3.6 | 17.6 | 9 | 8 |
| trans-p-coumaric acid | 2.8 | 3.84 | 5.85 | 4.8 |
| 4-hydroxy-3-methoxycinnamic acid | 40 | 38.4 | 9.9 | 7.2 |
| transferulic acid | 9.6 | 16 | 22.25 | 17.6 |
| ellagic acid | 3 | 4.16 | 5.85 | |
| quercetin | 1.2 | 7.68 | 10.8 | 3.2 |
3.3. YSH Preferentially Inhibits the Proliferation of Malignant Cell Lines
The anti-proliferative effects of YSH on malignant and non-malignant cell lines were determined using the SRB, MTT, and IncucytS3 Live-Cell proliferation assays. Each assay revealed that YSH significantly inhibited the proliferation and viability of malignant cells to a greater extent than the non-malignant cell line. The MTT assay (Figure 3) showed a significant decrease in the viability of the MCF-7, MDA-MB-231, HeLa, and B16-BL6 malignant cell lines in a time- and dose-dependent manner. MCF-7 cells treated with 1% YSH for 5 days inhibited viability by 20%, while treatment with 2% YSH inhibited viability by 80% and treatment with 1% glucose had no significant effect on viability. MDA-MB-231 and HeLa cells treated with 1% YSH for 5 days inhibited viability by 50–60%, while treatment with 2% YSH inhibited viability by 85%. Treatment with 2% YSH for 5 days inhibited the viability of B16-BL6 cells to below the original number of cells plated for the experiment.
The SRB assay also showed a dose-dependent decrease in cell staining in response to YSH treatment. The IC50 concentrations calculated from the SRB assays showed that the IC50 for MCF-7 cells was 0.99% YSH, 2.1% YSH for MDA-MB-231 cells, and 1.95% YSH for the HeLa cell line (Figure 4 and Table 4). Interestingly, the IC50 for the non-malignant HBL-100 cells was approximately 10% YSH.
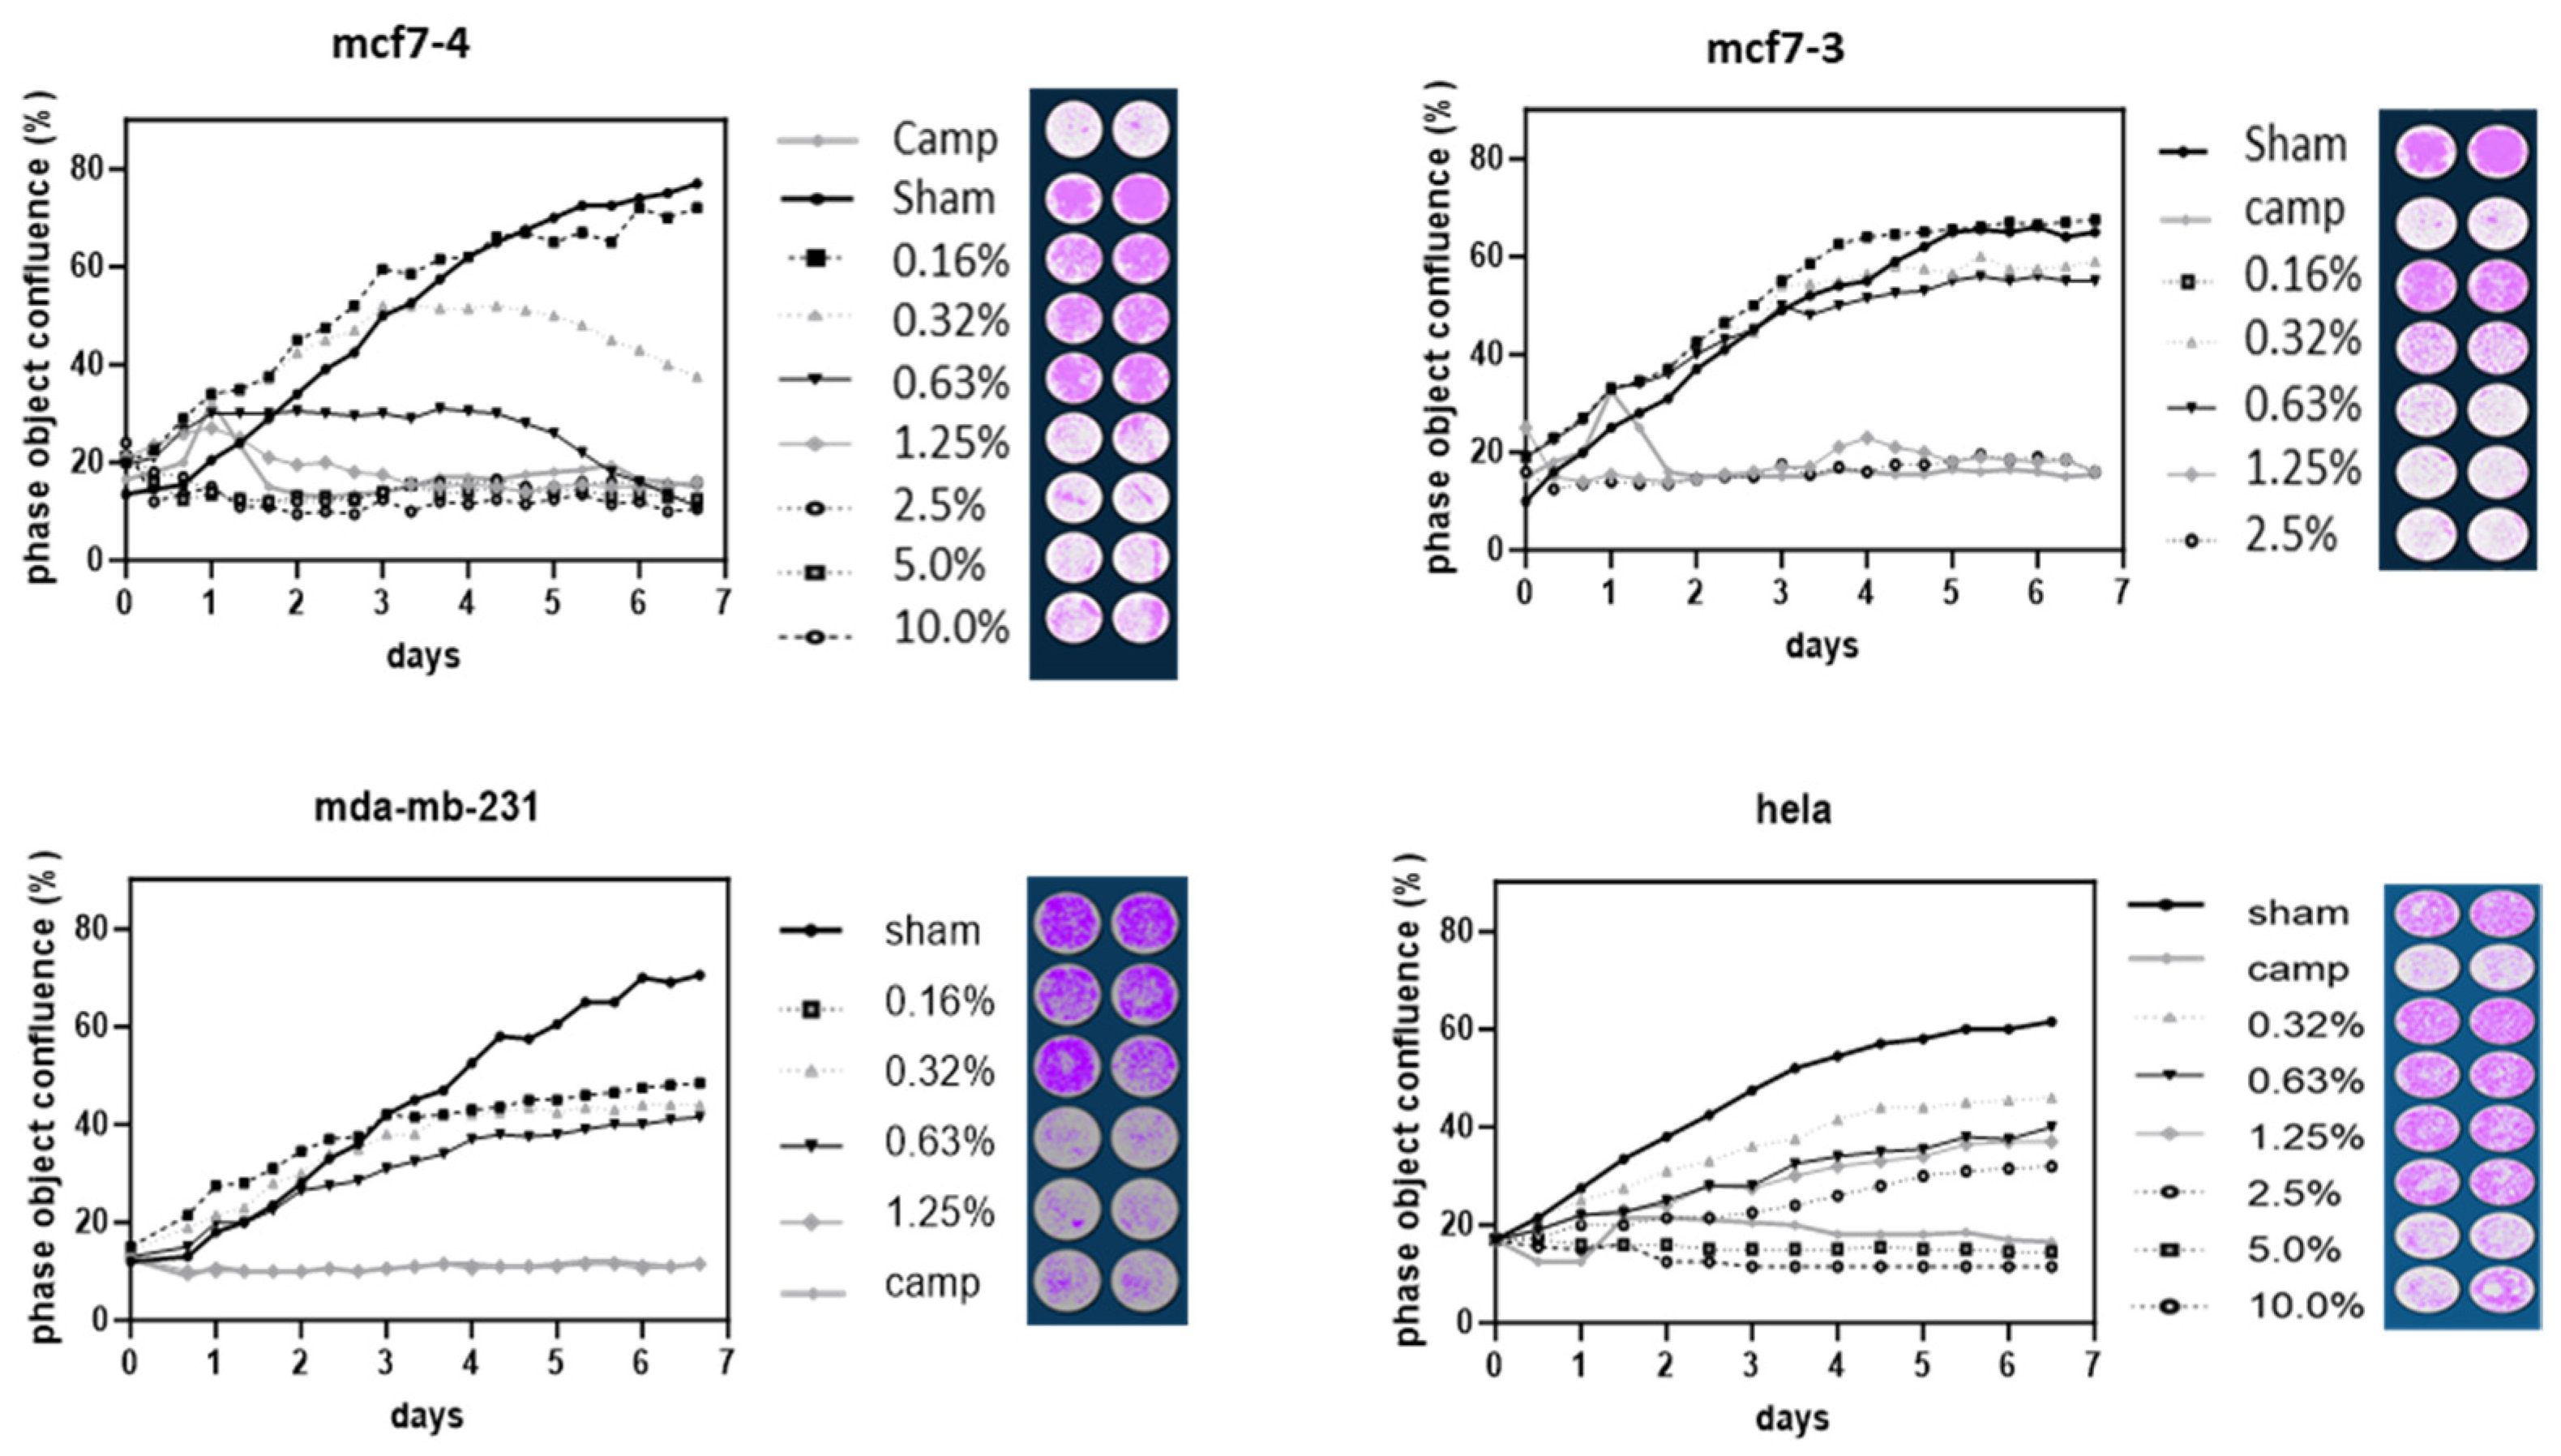
The number of cells as determined by live cell analysis was decreased by treatment with YSH in a time- and dose-dependent manner (Figure 5). All of the malignant cell lines tested showed a significant decrease in cell numbers on each day in response to YSH treatment compared to untreated (or glucose-treated) controls. In separate experiments, MCF-7 cells were treated with two different YSH samples and showed similar decreases in cell proliferation of 30% at 1.25% YSH over 4 days. MDA-MB-231 and HeLa cells treated with 1.25% YSH showed decreases in cell proliferation of 50% over 4 days, consistent with the resistance to YSH shown by the SRB assay.
3.4. YSH Impairs Cancer Cell Migration In Vitro
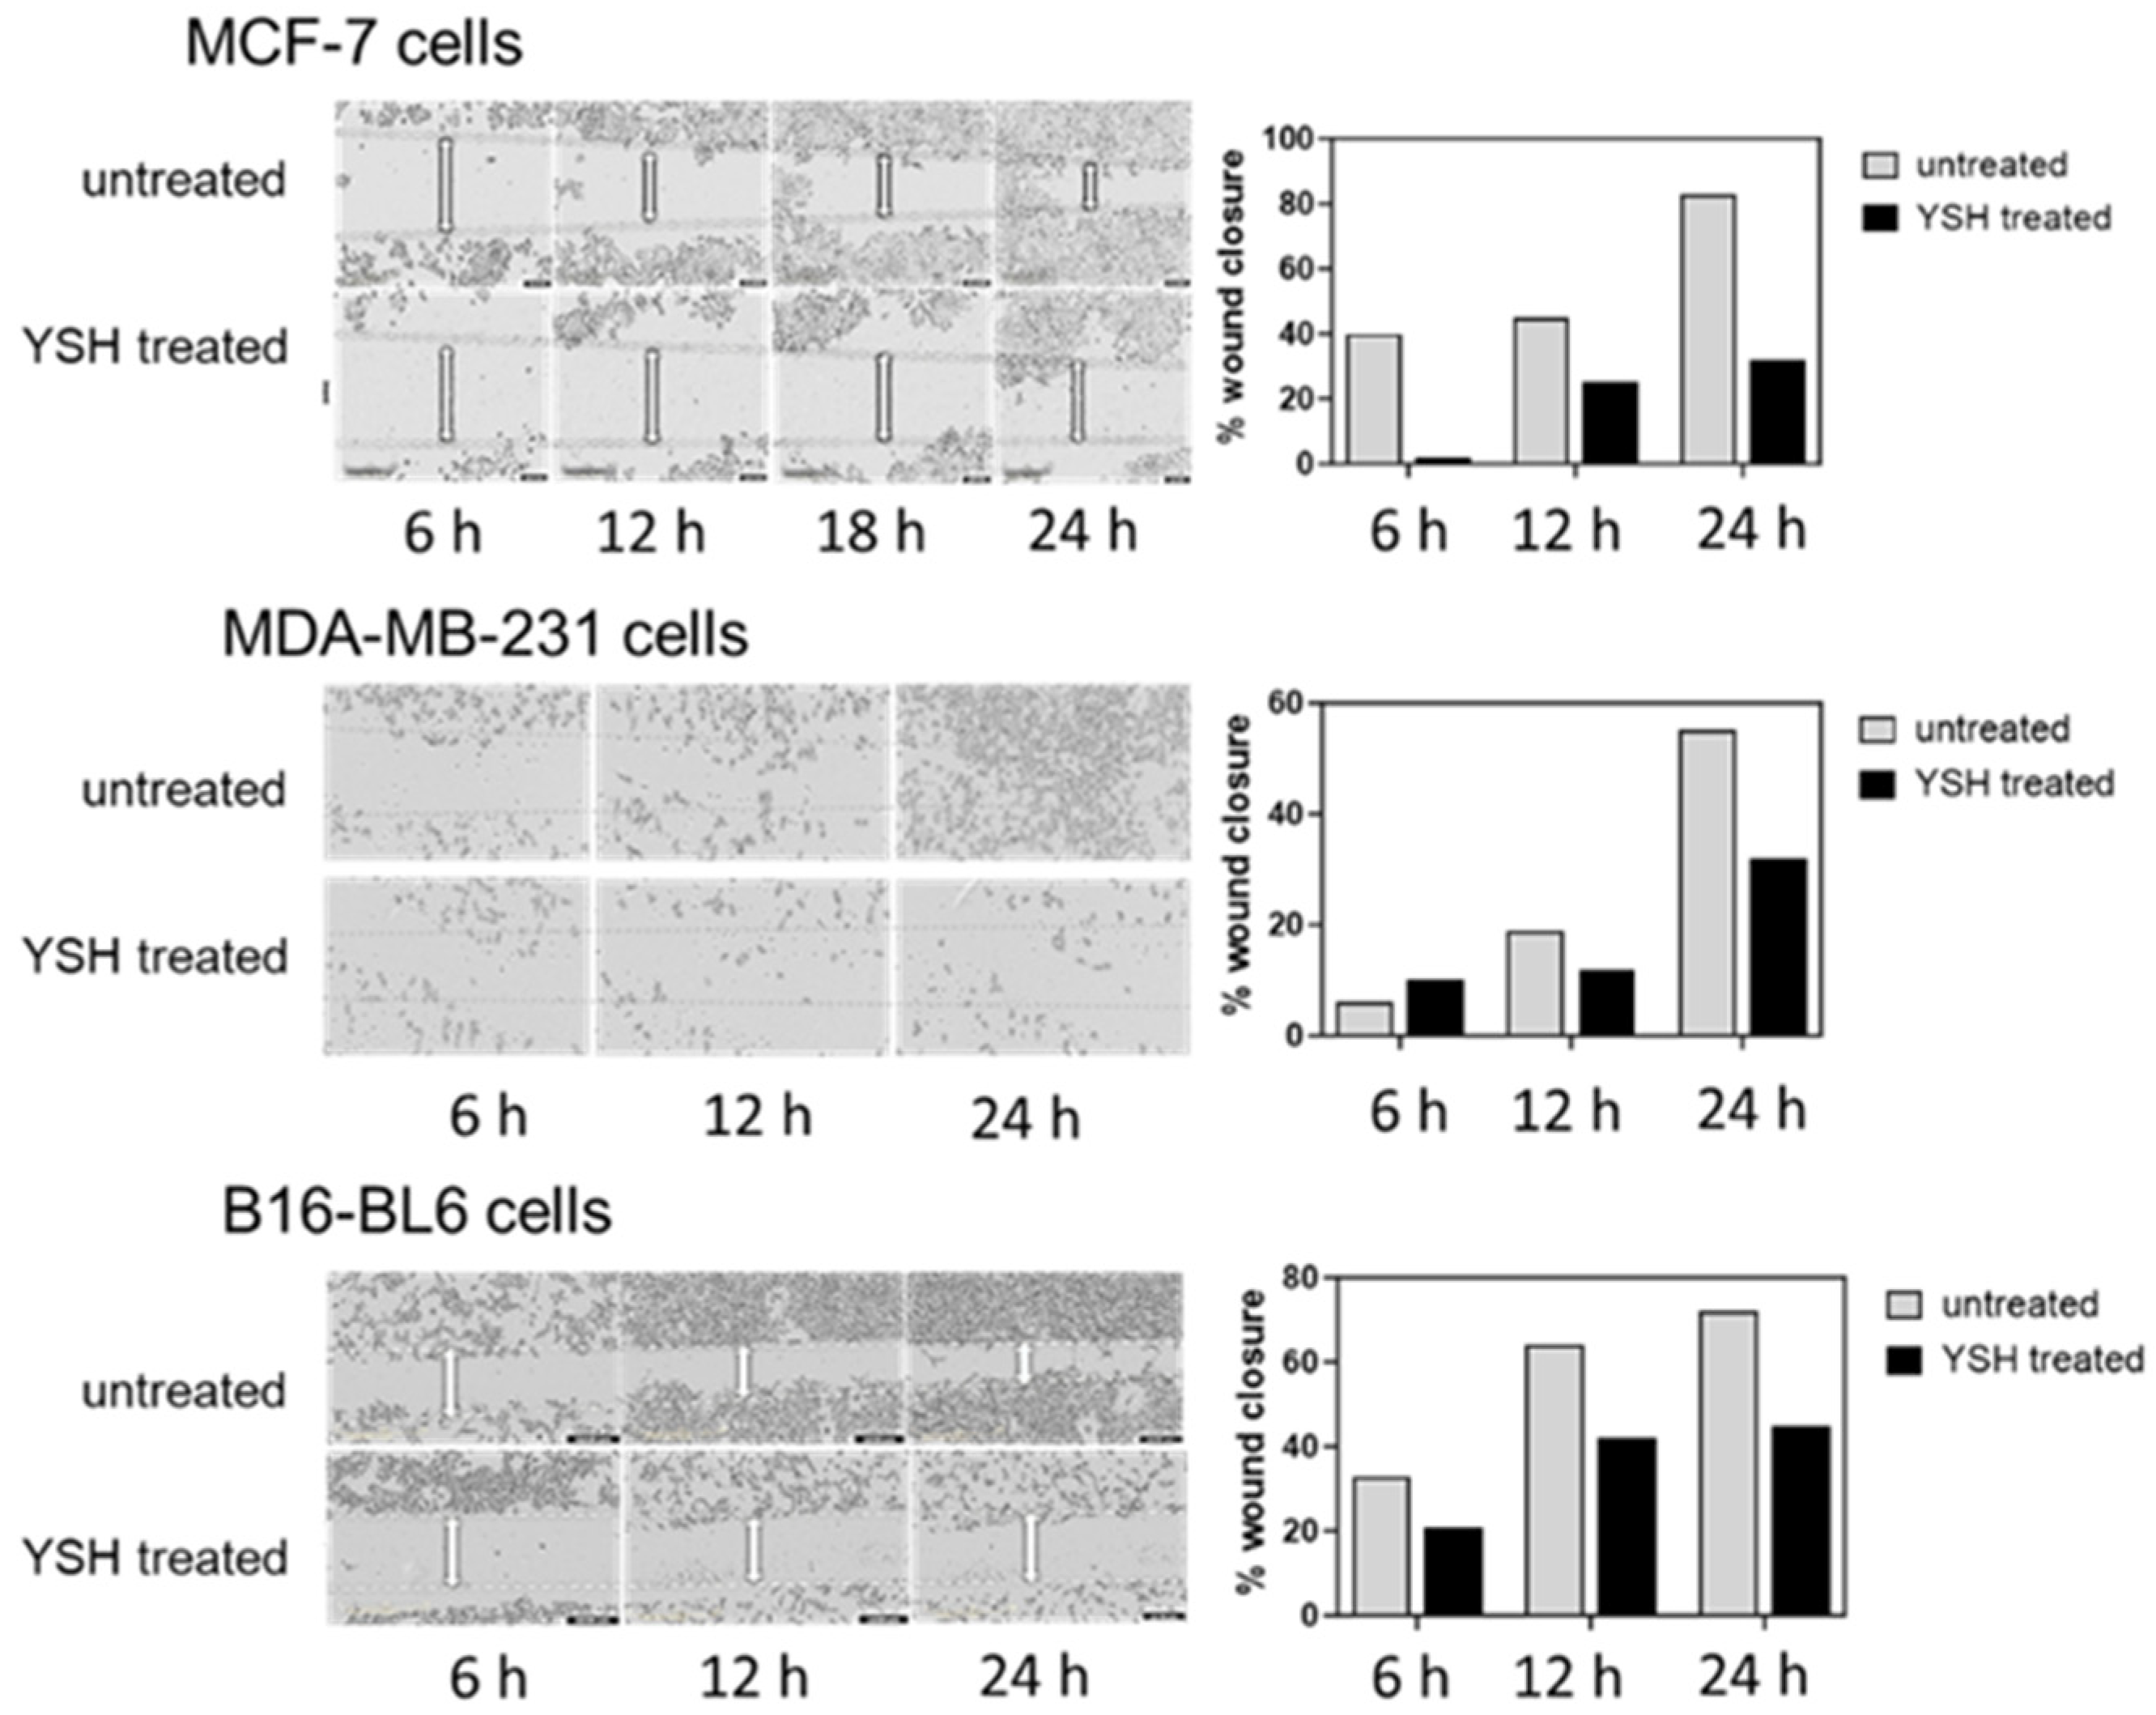
The effect of treatment with YSH on cancer cell migration was examined using a wound-healing assay. MDA-MB-231, MCF-7, and B16-BL6 cells were incubated for 1 day in the presence or absence of 1% YSH (approximately the IC50), and percentage of wound closure was measured over time (Figure 6). Treatment with 1% YSH led to significant inhibition in cell migration for all of the cell lines. Cell migration after 24 h for MCF-7 cells treated with YSH decreased by 65% compared to untreated cells. For both MDA-MB-231 and B16-BL6 cells, YSH decreased cell migration by 45%.
3.5. Induction of Apoptosis by YSH
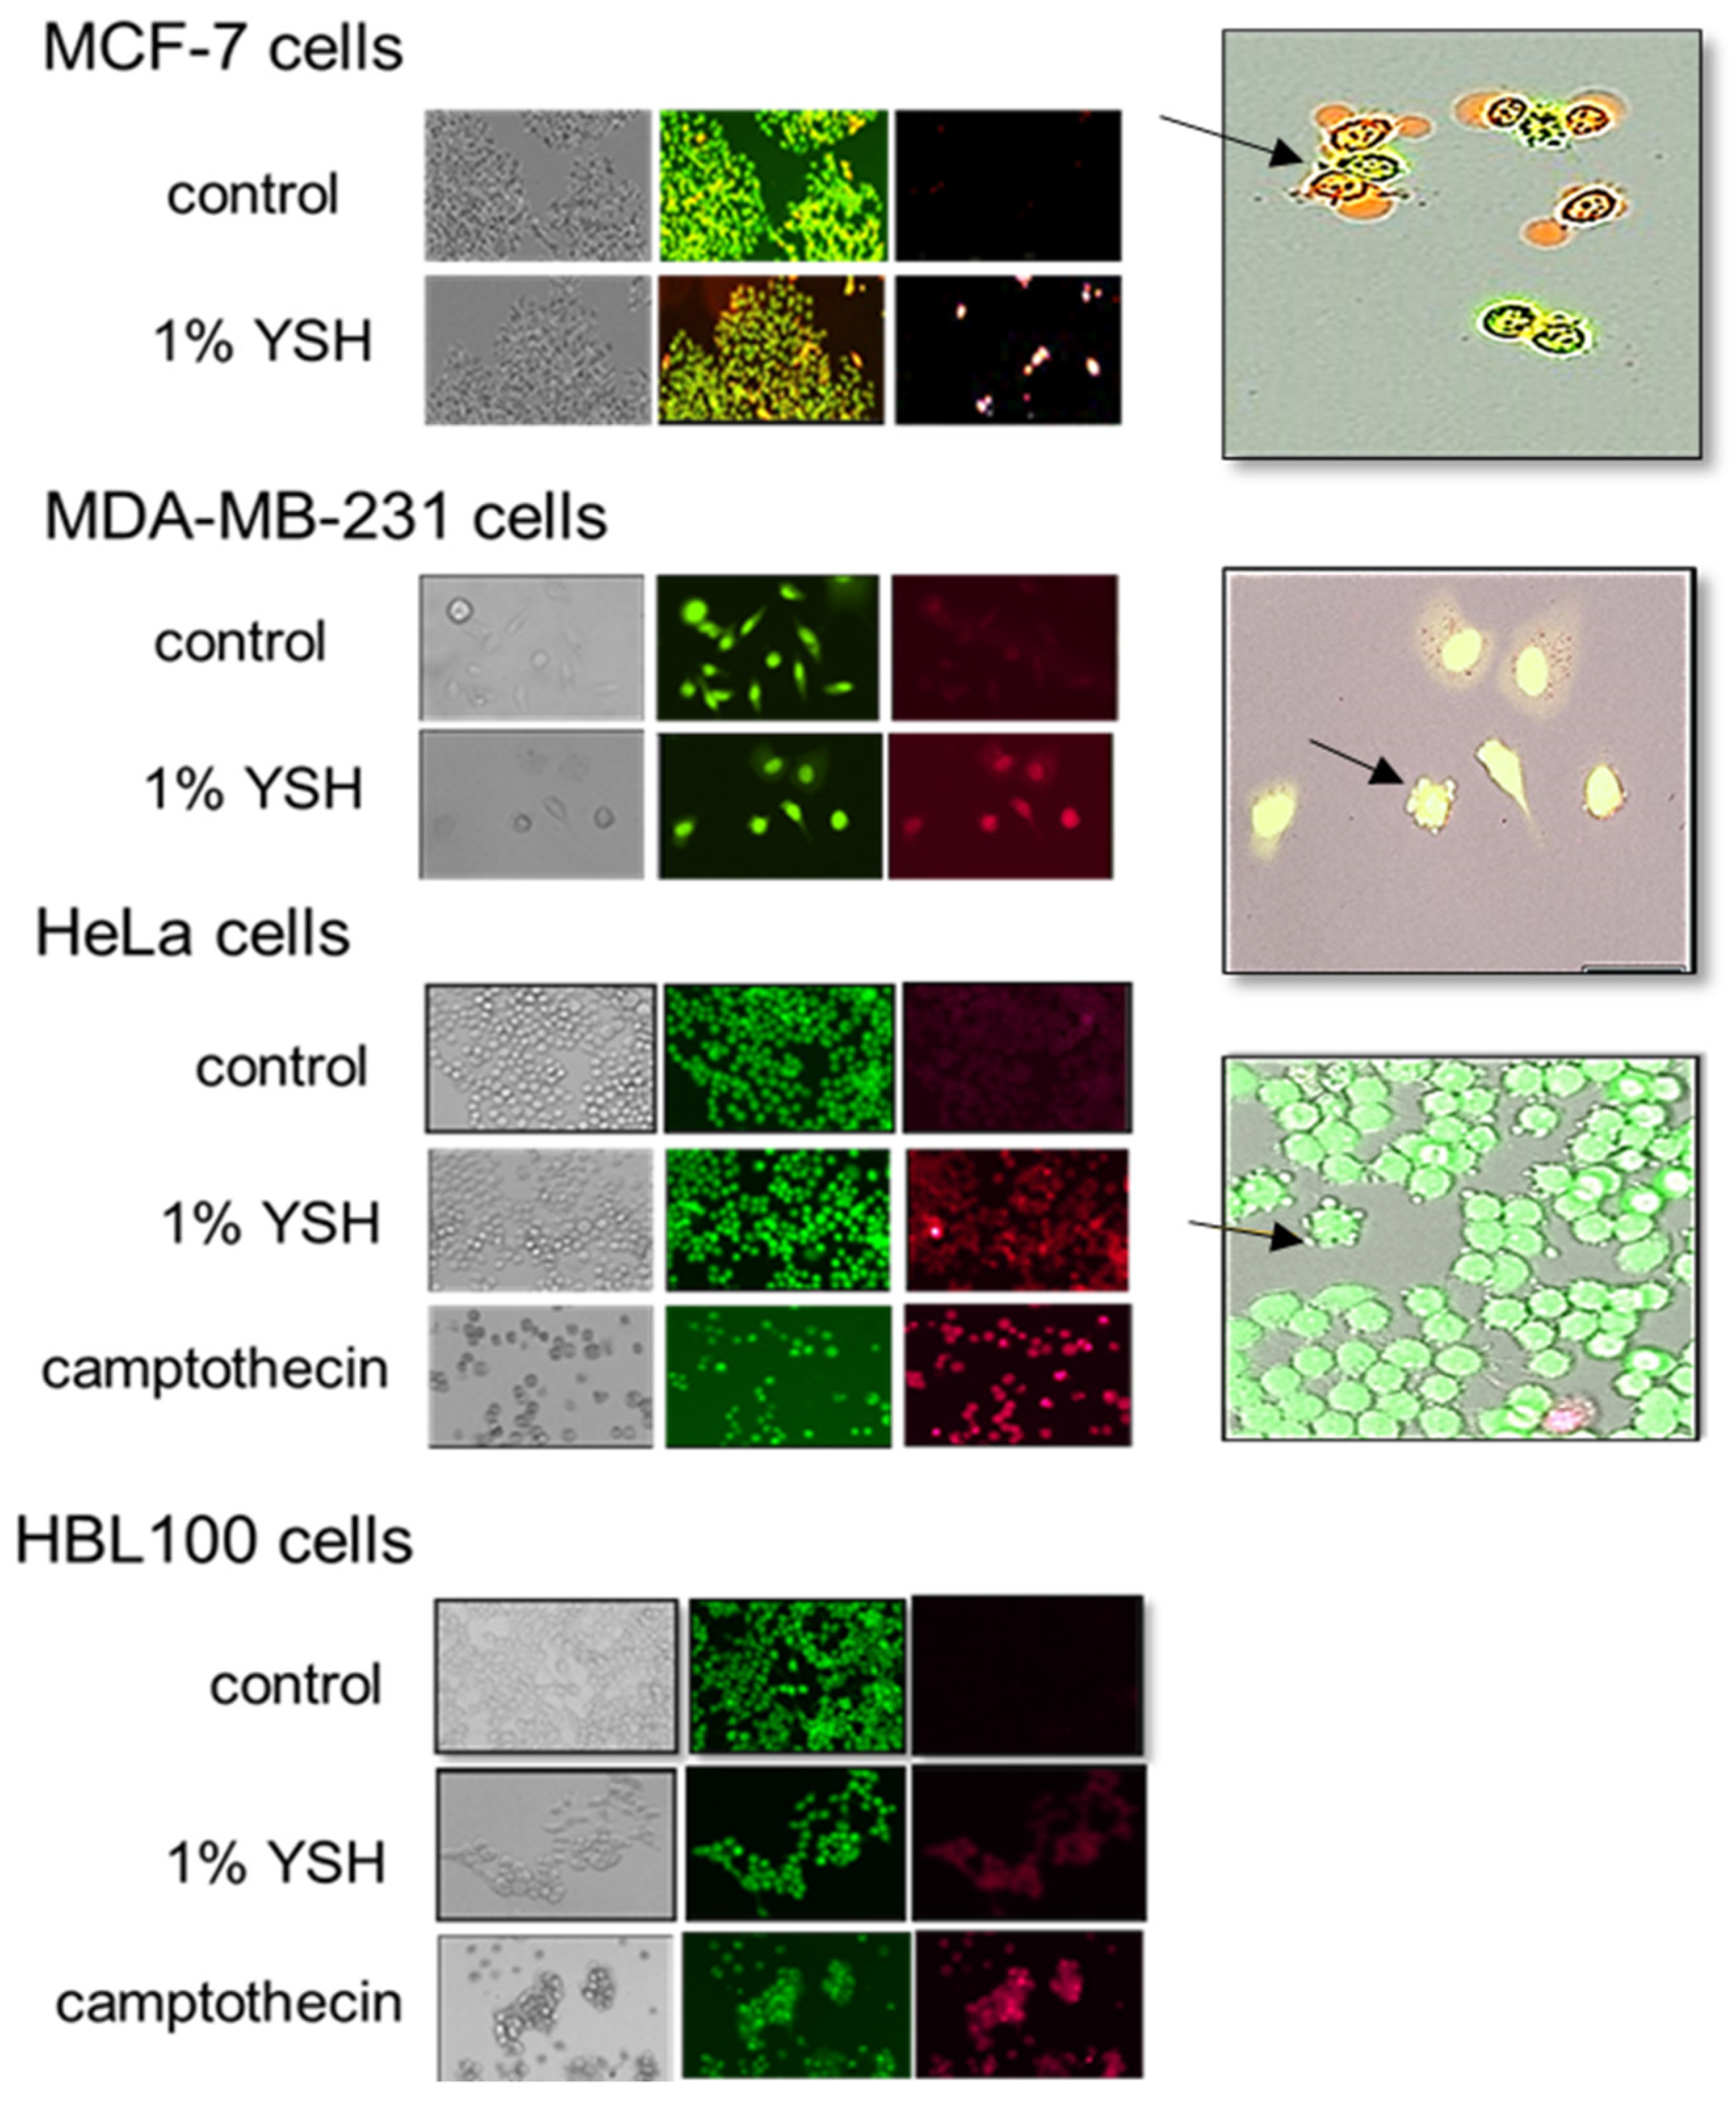
To show that YSH induces apoptosis in MDA-MB-231, MCF-7, and HeLa cells and in the non-malignant HBL-100 cells, we used the morphological evaluation of cells following acridine orange/ethidium bromide staining, the flow cytometry of propidium iodide-stained cells, and immunoblot analysis for apoptosis-related proteins. Acridine orange and ethidium bromide staining showed apoptotic morphology after being treated with YSH. Acridine orange is membrane permeant and stains the nucleic acids of all cells green, while ethidium bromide only stains those cells with compromised membranes red [38]. Malignant cancer cells treated with 1% YSH for 48 h underwent chromatin condensation and extensive membrane blebbing, which are hallmarks of apoptosis, while untreated controls did not demonstrate any visible changes in morphology. The data in Figure 7 show that MDA-MB-231, MCF-7, and HeLa cells treated with 1% YSH cells for 48 h showed both acridine orange and ethidium bromide staining (red patches within 10–60% of the cells), consistent with cells in the later stages of apoptosis. In contrast, HBL-100 cells treated with 1% YSH for 48 h did not show significant changes in morphology or cellular staining, suggesting that this is not sufficient to induce apoptosis in non-malignant cells.
The flow cytometry of propidium iodide-stained cells was determined to measure DNA fragmentation as the proportion of cells containing sub-G1 phase DNA content [39]. Treatment with 1–2.5% YSH for 24 h induced apoptosis in MDA-MB-231 and MCF-7 cells, as shown by an increase in the proportion of cells with sub-G1 DNA content to 25–30% (Figure 8). HBL-100 cells treated with different concentrations of YSH for 24 h showed there was no significant induction of cell cycle arrest or apoptosis in response to treatment with 1% YSH at the 24 h time point (Figure 8), supporting the idea that YSH is less effective at inducing apoptosis in non-malignant cells.
3.6. YSH Induces Apoptosis through Alteration in Molecular Pathways
To confirm that YSH induces apoptosis in MCF-7 and MDA-MB-231 cells, immunoblot analysis for molecular markers of apoptosis was performed. The PARP-1 blot shows that YSH-treated cells showed a decrease in the levels of full-length PARP (116 kDa) and the larger fragment (85 kDa), consistent with the loss of apoptotic cleaved products. Treating cells with YSH also showed an increase in the amount of the caspase 9 cleavage product, which is also consistent with the induction of apoptosis. The analysis of protein levels in cells undergoing apoptosis revealed that the Bax/Bcl-2 ratio plays a major role in apoptosis [41,42]. Findings revealed that the expression levels of the anti-apoptotic protein Bcl-2 were significantly decreased. However, the Bax pro-apoptotic protein increased in a time-dependent manner (Figure 9). These results are consistent with the idea that treatment with YSH induces apoptosis through the mitochondria-dependent signaling pathway.
4. Discussion
YSH inhibited the proliferation, viability, and migration capacity of MCF-7, MDA-MB-231, HeLa, and B16-BL6 cancer cells but had a much weaker effect on the HBL-100 non-malignant cell line. These changes are the result of a variety of mechanisms, the most significant of which is the induction of apoptosis due to a combination of cell cycle arrest, nuclear condensation, fragmentation, the down-regulation of anti-apoptotic molecules such as Bcl-2 and uncleaved PARP, the up-regulation of promoters of cell death such as the Bax class of proteins, and the up-regulation of cleaved caspase 9 [42,43].
YSH contains sugar and phenolic components consistent with the composition of many other types of honey, as reported in the literature [12,18,32,33]. We analyzed four separate honey samples: one sample of a commercial clover polyfloral honey and three samples of YSH obtained from different commercial suppliers. In general, the polyfloral honey sample was somewhat different from the YSH samples. Further, in spite of some similarities, there were also some differences among the three different YSH samples. Interestingly, all of these YSH samples have been shown to have similar anti-proliferative effects on cancer cells. The YSH samples all had similar sugar concentration profiles, consistent with previous reports [9,12,24]. The most abundant of the sugar components was fructose; however, the polyfloral honey contained a higher level of fructose (37.5%) compared to the YSH samples, which contained 28 and 30.7% fructose. The polyfloral honey was shown to contain lower levels of glucose, sucrose, and maltose compared to the YSH samples, which all contained similar levels of the sugars. The phenolic acid and flavonoid profiles in the purified honey samples contained at least 10–20 major peaks and multiple minor peaks. While several of the peaks were shared among all four honey samples, there were several which appeared to be differentially expressed. Ten different standard components, known to be present in previously studied honey samples, were used to identify peaks in the samples which were present at different levels [32]. The polyfloral honey was distinct from the three YSH samples. For example, the levels of chlorogenic acid, caffeic and vanillic acid, trans-p-coumaric acid, and transferulic acid were lower in the polyfloral honey compared to the YSH samples, which had similar levels. The levels of ellagic acid and quercetin were also higher in the YSH samples, although these levels were variable between the YSH samples. Interestingly, the polyfloral honey showed similar levels of gallic acid and 4-hydroxy-3-methoxycinnamic acid to one of the monofloral YSH samples, but these were different from the levels in the other two YSHs. It is known that the levels of different components in a particular type of honey can vary significantly depending on the time of year the nectar was collected and the collection and processing techniques used to produce the final product [44]. In spite of the variation between YSH samples, they were generally similar to the levels of these standards published in other studies of YSH [7,24,45]. Further, the compositions of the honey were directly correlated to the cytotoxic activity on cancer cells. Some reports have shown that gallic acid, quercetin, and ellagic acid are able to inhibit cancer cell proliferation at levels similar to what is present in YSH [4,12.18,46]. Other studies have also identified YSH components such as carvacol, thymol, catechin, and some sulfatide compounds as being active in killing cancer cells [46,47,48]. A more comprehensive study of a larger number of different honey samples with a wider range of identified standards would be useful for verifying that YSH samples have a more unique pattern of chemical composition which can be used to distinguish them from other types of honey and which could be used to identify likely anti-cancer components.
YSH was found to reduce the proliferation and viability of malignant cells. This was confirmed through performing SRB and MTT assays. The two tests collectively showed that treatment with YSH had a unique dose-dependent impact on the cell growth of cancer cells by significantly decreasing cell staining. In addition, cell counting using the Incucyte imaging analysis showed that the treatment of the malignant cell lines with YSH caused a reduction in cell number in a time- and dose-dependent manner compared to glucose or non-treated controls samples. This is consistent with the results of studies on YSH and other types of honey and suggests that honey might be a good candidate as an anti-cancer therapeutic agent. In addition, the treatment of malignant cells with YSH was able to inhibit cell migration, suggesting that YSH might also be a good candidate to inhibit cancer invasion and metastasis.
The treatment of malignant cells with YSH was shown to increase DNA fragmentation in the flow cytometry of propidium iodide-stained cells. The treatment of malignant MDA-MB-231, MCF-7, and HeLa cells with 1% YSH was shown to induce apoptosis, as measured by the increase in the sub-G1 fraction of the cells, in a dose-dependent manner, showing that the non-malignant cell type included was more resistant to YSH. However, future studies would be beneficial to test the effect of YSH on non-malignant cells. This result shows that YSH can induce apoptosis in a cancer-cell-specific manner. The other question which was addressed by these experiments is whether YSH causes apoptosis through the alteration of molecular pathways. This was achieved through the analysis of key molecular markers of apoptosis, including the up-regulation of Bax and the down-regulation of Bcl-2, which supports the idea that apoptosis depends on the mitochondrial intrinsic pathway. The treatment of MDA-MB-231 and MCF-7 cells with 1% YSH also resulted in an increase in cleaved caspase 9 and a decrease in uncleaved PARP, supporting the conclusion that YSH caused the apoptosis of cancer cells.
Similar findings have been obtained by other researchers using comparable in vitro studies with different types of honey. For instance, a 2013 study documented the morphologic features of breast cancer cell lines after 24 h of exposure to honey from Indian stingless bees [49] and determined that there was cell cycle arrest based on p53 activation. This arrest was the underlying mechanism of the ability of Brazilian honey extracts to induce apoptosis in cancerous cell lines. Similarly, the reduced expression of Bcl-2, the activation of caspase 3, and Bax up-regulation accounted for the anti-proliferative influence of honey extracts on leukemic cell lines [50,51].
Another important finding in the current study is that the anti-proliferative effect of YSH is more potent against the malignant cells tested compared to the non-malignant cells, a realization that boosts optimism with regard to its potential as a chemotherapeutic agent. While studies examining the specificity of honey products towards cancer cells are scarce in the literature, Umthong et al. [52], in their investigation of the anti-proliferative activity of honey extracts in Thailand, found that the effect was only observed in neoplastic and not normal cells. Calhelha et al. [2], in a similar in vitro study, concluded that Portuguese honey extracts did not exhibit a significant preference for cancerous cells in their ability to inhibit cell proliferation. On the other hand, experiments conducted by Almeer et al. [17] showed a similar result when Sidr honey from Saudi Arabia was tested on the MDA-MB-231 cell line, as the MTT assay after 48 h showed a reduction in cell viability of 48%. However, Ghramh et al. [45] found a conflicting result with our finding, as in their studies, Sidr honey-coated nanoparticles had anti-cancer activity against HepG2 but not HeLa cells. These differences could arise from one or more of several variables, including the cell lines used, the type of honey, geographical locations, or even variations in the experimental methodologies.
Author Contributions
Conceptualization, D.A. and R.M.L.; methodology, D.A. and R.M.L.; software, D.A.; validation, D.A. and R.M.L. formal analysis, D.A. and R.M.L.; resources, R.M.L.; data curation, D.A.; writing—original draft preparation, D.A. and R.M.L.; writing—review and editing, D.A. and R.M.L.; visualization, D.A.; supervision, R.M.L.; project administration, R.M.L.; funding acquisition, D.A. and R.M.L. All authors have read and agreed to the published version of the manuscript.
Funding
This research was funded by core funding from the Northern Cancer Research Foundation, Sudbury, Ontario and by a studentship to D.A. from the Government of Saudi Arabia Bureau of Education.
Institutional Review Board Statement
Not applicable.
Informed Consent Statement
Not applicable.
Data Availability Statement
Data are available by request from the authors.
Conflicts of Interest
The authors declare no conflicts of interest. The funders had no role in the design of the study; in the collection, analyses, or interpretation of data; in the writing of the manuscript; or in the decision to publish the results.
References
- Eteraf-Oskouei, T.; Najafi, M. Traditional and modern uses of natural honey in human diseases: A review. Iran. J. Basic. Med. Sci. 2013, 16, 731–742. [Google Scholar] [PubMed]
- Calhelha, R.C.; Falcão, S.; Queiroz, M.J.R.; Vilas-Boas, M.; Ferreira, I.C. Cytotoxicity of Portuguese propolis: The proximities of the in vitro doses for tumor and normal cell lines. BioMed Res. Int. 2014, 2014, 897361. [Google Scholar] [CrossRef] [PubMed]
- Waheed, M.; Hussain, M.B.; Javed, A.; Mushtaq, Z.; Hassan, S.; Shariati, M.A.; Khan, M.U.; Majeed, M.; Nigam, M.; Mishra, A.P.; et al. Honey and cancer: A mechanistic review. Clin. Nutr. 2019, 38, 2499–2503. [Google Scholar] [CrossRef] [PubMed]
- Afrin, S.; Haneefa, S.M.; Fernandez-Cabezudo, M.J.; Giampieri, F.; Al-Ramadi, B.K.; Battino, M. Therapeutic and preventive properties of honey and its bioactive compounds in cancer: An evidence-based review. Nutr. Res. Rev. 2020, 33, 50–76. [Google Scholar] [CrossRef] [PubMed]
- Ahmed, S.; Othman, N.H. Review of the medicinal effects of Tualang honey and a comparison with Manuka honey. Malays. J. Med. Sci. 2013, 20, 6–13. [Google Scholar]
- Greenwell, M.; Rahman, P.K.S. Medicinal plants: Their use in anticancer treatment. Int. J. Pharm. Sci. Res. 2015, 6, 4103–4112. [Google Scholar] [CrossRef] [PubMed]
- Roshan, A.R.A.; Gad, H.A.; El-Ahmady, S.H.; Khanbash, M.S.; Abou-Shoer, M.I.; Al-Azizi, M.M. Authentication of monofloral Yemeni Sidr honey using ultraviolet spectroscopy and chemometric analysis. J. Agric. Food Chem. 2013, 61, 7722–7729. [Google Scholar] [CrossRef] [PubMed]
- Sergiel, I.; Pohl, P.; Biesaga, M. Characterisation of honeys according to their content of phenolic compounds using high performance liquid chromatography/tandem mass spectrometry. Food Chem. 2014, 145, 404–408. [Google Scholar] [CrossRef] [PubMed]
- Cotte, J.F.; Casabianca, H.; Chardon, S.; Lheritier, J.; Grenier-Loustalot, M.F. Chromatographic analysis of sugars applied to the characterisation of monofloral honey. Anal. Bioanal. Chem. 2004, 380, 698–705. [Google Scholar] [CrossRef]
- da Silva, P.M.; Gauche, C.; Gonzaga, L.V.; Costa, A.C.; Fett, R. Honey: Chemical composition, stability and authenticity. Food Chem. 2016, 196, 309–323. [Google Scholar] [CrossRef]
- Gorjanović, S.Ž.; Alvarez-Suarez, J.M.; Novaković, M.M.; Pastor, F.T.; Pezo, L.; Battino, M.; Sužnjević, D.Ž. Comparative analysis of antioxidant activity of honey of different floral sources using recently developed polarographic and various spectrophotometric assays. J. Food Comp. Anal. 2013, 30, 13–18. [Google Scholar] [CrossRef]
- Bouli, N.; Hamadou, W.S.; Badraoui, R.; Lajimi, R.H.; Hamdi, A.; Alreshidi, M.; Adnan, M.; Soua, Z.; Siddiqui, A.J.; Noumi, E.; et al. Phytochemical composition, antioxidant, and anticancer activities of Sidr honey: In vitro and in silico computational investigation. Life 2023, 13, 35. [Google Scholar] [CrossRef]
- Qanash, H.; Bazaid, A.S.; Binsaleh, N.K.; Patel, M.; Althomali, O.W.; Sheeha, B.B. In vitro antiproliferative apoptosis induction and cell cycle arrest potential of Saudi Sidr honey against colorectal cancer. Nutrients 2023, 15, 3448. [Google Scholar] [CrossRef]
- Al Refaey, H.R.; Newairy, S.A.; Wahby, M.M.; Albanese, C.; Elkewedi, M.; Choudhry, M.U.; Sultan, A.S. Manuka honey enhanced sensitivity of HepG2 hepatocellular carcinoma cells, for doxorubicin and induced apoptosis through inhibition of Wnt/b-catenin and ERK1/2. Biol. Res. 2021, 54, 16. [Google Scholar] [CrossRef]
- Ahmed, S.; Othman, N.H. The anti-cancer effects of Tualang honey in modulating breast carcinogenesis: An experimental animal study. BMC Comp. Alt. Med. 2017, 17, 208. [Google Scholar] [CrossRef]
- Ahmed, S.; Sulaiman, S.A.; Othman, N.H. Oral administration of Tualang and Manuka honeys modulates breast cancer progression in Sprague-Dawley rats model. Evid. Based Comp. Alt. Med. 2017, 2017, 5904361. [Google Scholar] [CrossRef]
- Almeer, R.; Alqarni, A.; Alqattan, S.; Abdi, S.; Alarifi, S.; Hassan, Z.; Semlali, A. Effect of Honey in Improving Breast Cancer Treatment and Gene Expression Modulation of MMPs and TIMPs in Triple-Negative Breast Cancer Cells. Pak. J. Zool. 2018, 50, 1999–2007. [Google Scholar] [CrossRef]
- Margaoan, R.; Topal, E.; Balkanska, R.; Yucel, B.; Oravecz, T.; Cornea-Cipcigan, M.; Vodnar, D.C. Monofloral honeys as a potential source of natural antioxidants, minerals and medicine. Antioxidants 2021, 10, 1023. [Google Scholar] [CrossRef]
- Fukuda, M.; Kobayashi, K.; Hirono, Y.; Miyagawa, M.; Ishida, T.; Ejiogu, E.C.; Sawai, M.; Pinkerton, K.E.; Takeuchi, M. Jungle honey enhances immune function and antitumor activity. Evid. Based Complement. Altern. Med. 2010, 2011, 908743. [Google Scholar] [CrossRef]
- Cheng, N.; Du, B.; Wong, Y.; Gao, H.; Cao, W.; Zheng, J.; Feng, F. Antioxidant properties of Jubube honey and its protective effects against chronic alcohol-induced liver damage in mice. Food Func. 2014, 5, 900–908. [Google Scholar] [CrossRef]
- Aliyu, M.; Odunola, O.A.; Farooq, A.D.; Mesaik, A.M.; Choudhary, M.I.; Fatima, B.; Quereshi, T.A.; Erukainure, O.L. Acacia honey modulates cell cycle progression, pro-inflammatory cytokines and calcium ions secretion in PC-3 cell line. J. Cancer Sci. Ther. 2012, 4, 401–407. [Google Scholar] [CrossRef]
- Beretta, G.; Moretti, R.M.; Nasti, R.; Cincinelli, R.; Dallavalle, S.; Marelli, M.M. Apoptosis-mediated anticancer activity in prostate cancer cells of a chestnut honey (Castanea sativa L.) quinoline-pyrrolidine gamma-lactam alkaloid. Amino Acids 2021, 53, 869–880. [Google Scholar] [CrossRef]
- Yee, N.; Kim, H.; Kim, E.; Cha, U.J.; Ma, L.; Cho, N.E.; Kim, D.; Kim, C.Y.; Kim, S.H.; Ryoo, Z.; et al. Effects of Sangju honey on oral squamous carcinoma cells. J. Cancer Prev. 2022, 27, 239–346. [Google Scholar] [CrossRef]
- Aljohar, H.I.; Maher, H.M.; Albaqami, J.; Al-Mehaizie, M.; Orfali, R.; Orfali, R.; Alrubia, S. Physical and chemical screening of honey samples available on the Saudi market: An important aspect in the authentication process and quality assessment. Saudi Pharm. J. 2018, 26, 932–942. [Google Scholar] [CrossRef]
- Nayik, G.A.; Dar, B.N.; Nanda, V. Physico-chemical, rheological and sugar profile of different monofloral honeys from Kashmir valley of India. Arab. J. Chem. 2019, 12, 3151–3162. [Google Scholar] [CrossRef]
- Simon, A.; Traynor, K.; Santos, K.; Blaser, G.; Bode, U.; Molan, P. Medical honey for wound care—Still the latest resort? Evid. Based Complement. Alt. Med. 2009, 6, 149–158. [Google Scholar] [CrossRef]
- Sajwani, A.M.; Eltayeb, E.A.; Farook, S.A.; Patzelt, A. Sugar and protein profiles of Omani honey from Muscat and Batinah regions of Oman. Int. J. Food Prop. 2007, 10, 675–690. [Google Scholar] [CrossRef]
- Kamal, M.A.; Klein, P. Determination of sugars in honey by liquid chromatography. Saudi J. Biol. Sci. 2011, 18, 17–21. [Google Scholar] [CrossRef]
- Kaijanen, L.; Paakkunainen, M.; Pietarinen, S.; Jernstrom, E.; Reinikainen, S.P. Ultraviolet detection of monosaccharides: Multiple wavelength strategy to evaluate results after capillary zone electrophoresis. Int. J. Electrochem. Sci. 2015, 10, 2950–2961. [Google Scholar] [CrossRef]
- Ferreres, F.; Tomas-Barberan, F.A.; Soler, C.; Garcia-Viguera, C.; Ortiz, A.; Tomas-Lorente, F. A simple extractive technique for honey flavonoid HPLC analysis. Apidologie 1994, 25, 21–30. [Google Scholar] [CrossRef]
- Ferreres, F.; Tomas-Barberan, F.A.; Gil, M.I.; Tomas Lorente, F. An HPLC technique for flavonoid analysis in honey. J. Sci. Food Agric. 1991, 56, 49–56. [Google Scholar] [CrossRef]
- Pyrzynska, K.; Biesaga, M. Analysis of phenolic acids and flavonoids in honey. Trends Anal. Chem. 2009, 28, 893–902. [Google Scholar] [CrossRef]
- Andrade, P.; Ferreres, F.; Amaral, M.T. Analysis of honey phenolic acids by HPLC, its application to honey botanical characterization. J. Liq. Chromatogr. Relat. Technol. 1997, 20, 2282–2288. [Google Scholar] [CrossRef]
- Vichai, V.; Kirtikara, K. Sulforhodamine B colorimetric assay for cytotoxicity screening. Nat. Protoc. 2006, 1, 1112–1116. [Google Scholar] [CrossRef]
- Ahmadian, S.; Barar, J.; Saei, A.A.; Fakhree, M.A.A.; Omidi, Y. Cellular toxicity of nanogenomedicine in MCF-7 cell line: MTT assay. J. Vis. Exp. 2009, 26, e1191. [Google Scholar]
- Liang, C.; Park, A.; Guan, J. In vitro scratch assay: A convenient and inexpensive method for analysis of cell migration in vitro. Nat. Protoc. 2007, 2, 329–333. [Google Scholar] [CrossRef]
- Grada, A.; Otero-Vinas, M.; Prieto-Castrillo, F.; Obagi, Z.; Falanga, V. Research techniques made simple: Analysis of collective cell migration using the wound healing assay. J. Investig. Dermatol. 2017, 137, e11–e16. [Google Scholar] [CrossRef]
- Ribble, D.; Goldstein, N.B.; Norris, D.A.; Shellman, Y.G. A simple technique for quantifying apoptosis in 96-well plates. BMC Biotechnol. 2005, 5, 12. [Google Scholar] [CrossRef]
- Pearce, A.G.; Segura, T.M.; Rintala, A.C.; Rintala-Maki, N.D.; Lee, H. The generation and characterization of a radiation-resistant model system to study radioresistance in human breast cancer cells. Rad. Res. 2001, 156, 739–750. [Google Scholar] [CrossRef]
- Zari, A.; Alfarteesh, H.; Buckner, C.A.; Lafrenie, R.M. Treatment with Uncaria tomentosa Promotes Apoptosis in B16-BL6 Mouse Melanoma Cells and Inhibits the Growth of B16-BL6 Tumours. Molecules 2021, 26, 1066. [Google Scholar] [CrossRef]
- Samarghandian, S.; Azimi Nezhad, M.; Mohammadi, G. Role of caspases, Bax and Bcl-2 in chrysin-induced apoptosis in the A549 human lung adenocarcinoma epithelial cells. Anti-Cancer Agents Med. Chem. 2014, 14, 901–909. [Google Scholar] [CrossRef]
- Fauzi, A.N.; Norazmi, M.N.; Yaacob, N.S. Tualang honey induces apoptosis and disrupts the mitochondrial membrane potential of human breast and cervical cancer cell lines. Food Chem. Toxicol. 2011, 49, 871–878. [Google Scholar] [CrossRef] [PubMed]
- Pietenpol, J.A.; Stewart, Z.A. Cell cycle checkpoint signaling: Cell cycle arrest versus apoptosis. Toxicology 2002, 181–182, 475–481. [Google Scholar] [CrossRef]
- Gomez-Barez, K.A.; Garcia Vilanova RKElvira-Garcia, S.; Rivas-Pala, T.; Gonzalez-Paramas, A.M.; Sanchez-Sanchez, J. Geographical discrimination of honeys through the employment of sugar patterns and common chemical quality parameters. Eur. Food Res. Technol. 2000, 210, 437–444. [Google Scholar]
- Ghramh, H.A.; Ibrahim, E.H.; Kilany, M. Study of anticancer, antimicrobial, immunomodulatory, and silver nanoparticles production by Sidr honey from three different sources. Food Sci. Nutr. 2019, 8, 445–455. [Google Scholar] [CrossRef] [PubMed]
- Kassim, M.; Achoui, M.; Mustafa, M.R.; Mohd, M.A.; Yusoff, K.M. Ellagic acid, phenolic acids and flavonoids in Malaysian honey extracts demonstrate in vitro anti-inflammatory activity. Nutr. Res. 2010, 30, 650–659. [Google Scholar] [CrossRef] [PubMed]
- Cianciosa, D.; Forbes-Hernanadez, T.Y.; Adrin, S.; Gasparrini, M.; Reboredo-Rodriguez, P.; Manna, P.P.; Zhang, J.; Lamas, L.B.; Florez, S.M.; Toyos, P.A.; et al. Phenolic compounds in honey and their associated health benefits: A review. Molecules 2018, 23, 2322. [Google Scholar] [CrossRef] [PubMed]
- Snchez-Martin, V.; Morales, P.; Iriondo-DeHond, A.; Hospital, X.F.; Fernandez, M.; Hierro, E.; Haza, A.I. Differential apoptotic effects of bee product mixtures on normal and cancer hepatic cells. Antioxidants 2023, 12, 615. [Google Scholar] [CrossRef] [PubMed]
- Choudhari, M.K.; Haghniaz, R.; Rajwade, J.M.; Paknikar, K.M. Anticancer activity of Indian stingless bee propolis: An in vitro study. Evid. Based Complement. Altern. Med. 2013, 2013, 928820. [Google Scholar] [CrossRef]
- Nik Man, N.M.K.; Hassan, R.; Ang, C.Y.; Abdullah, A.D.; Mohd Radzi, M.A.R.; Sulaiman, S.A. Antileukemic effect of Tualang honey on acute and chronic leukemia cell lines. BioMed Res. Int. 2015, 2015, 307094. [Google Scholar] [CrossRef]
- Chen, Y.J.; Shiao, M.S.; Hsu, M.L.; Tsai, T.H.; Wang, S.Y. Effect of caffeic acid phenethyl ester, an antioxidant from propolis, on inducing apoptosis in human leukemic HL-60 cells. J. Agric. Food Chem. 2001, 49, 5615–5619. [Google Scholar] [CrossRef] [PubMed]
- Umthong, S.; Phuwapraisirisan, P.; Puthong, S.; Chanchao, C. In vitro antiproliferative activity of partially purified Trigona laeviceps propolis from Thailand on human cancer cell lines. BMC Comp. Alt. Med. 2011, 11, 37. [Google Scholar] [CrossRef] [PubMed]
Figure 1.
HPLC analysis of sugars in honey samples. (A) Samples of honey and diluted samples prior to analysis show differences in the color. (B) Samples of honey were analyzed by HPLC on an X-Bridge amide column at an absorbance of 195 nm. Honey 1 corresponds to a sample of a polyfloral clover honey, while Honey 2–4 correspond to different samples of YSH obtained from different suppliers. The inset indicates an enlargement of the chromatograph to emphasize smaller peaks. The numbers indicate the position of the peak corresponding to the indicated sugar.

Figure 2.
HPLC analysis of phenolic and flavonoid compounds in samples of honey. Purified samples of honey were analyzed by HPLC on an Sunfire C18 column at absorbances of 280, 320, 370, and 425 nm. Honey 1 corresponds to a sample of a polyfloral clover honey, while Honey 2–4 correspond to different samples of YSH obtained from different suppliers. The numbers indicate the position of the peaks corresponding to the indicated standard component. 1. Gallic acid (2.4 min); 2. chlorogenic acid (8.4 min); 3. caffeic acid and vanillic acid (10.4 and 10.2 min); 4. trans-p-coumaric acid (13.6 min); 5. 4-hydroxy-3-methoxy-cinnamic acid (15.3 min); 6. transferulic acid (15.8 min); 7. ellagic acid (20.6 min); and 8. quercetin (24.7 min).

Figure 3.
Inhibition of cancer cell proliferation following treatment with YSH. (A) Breast cancer cells. (B) Cervical cancer HeLa cells and B16-B16 melanoma cell line. The treated cells were compared to controls (untreated cells suspended in media) and cells treated with sugar suspended in DMEM culture media. A relative cell number was determined for replica plates using the MTT assay, and absorbance was determined every day at 540 nm. Representative graphs show the mean of triplicate wells using Graph Pad. There were no discernable differences between the two independent experiments.

Figure 4.
The effects of YSH on MDA-MB-231, MCF-7, HeLa, and HBL-100 cells as determined by the SRB assay. MDA-MB-231, MCF-7, HeLa, and HBL-100 cells were seeded onto 96-well cell culture plates and treated with seven different concentrations of YSH for 48–72 h. The relative number of cells, determined using the SRB assay, was plotted against the concentration of YSH using a GraphPad Prism sigmoidal dose–response curve. Representative graphs show the mean and 95% confidence intervals of three independent experiments.

Figure 5.
Anti-proliferative activity of YSH on different cell lines. Cells on 96-well plates were grown in media containing different concentrations of YSH. Cell proliferation was monitored in real time using the Cell Analysis Software module. Cells were masked and counted for cell number (as measured by % cell confluence). Mcf-7 1 and mcf-7 2 showed two differently sourced YSHs tested on MCF-7 cells with similar results. Treatment with YSH decreased cell numbers in Mda-mb-231 breast cancer and HeLa cells in a dose- and time-dependent manner. The data show a representative plot of replicated wells with associated photographs of the cell monolayer at 4 days.

Figure 6.
YSH inhibits cancer cell migration in wound-healing assay. Wounds were introduced in MDA-MB-231, MCF-7, and B16-BL6 cell confluent monolayers cultured in the absence (control) or presence of 1% YSH. The distance that the MCF-7 cells traveled from the edge of the scraped area over a period of 6–24 h at 37 °C was measured using ImageJ software to determine the percentage of wound healing and is shown in the graphs.

Figure 7.
YSH-induced apoptotic cell death was observed by acridine orange/ethidium bromide staining. Cells were treated with 1% YSH for 48 h and then stained with acridine orange (green)/ethidium bromide (red). Live stained cells were analyzed within 15 min of staining using a fluorescence microscope. MCF-7 and MDA-MB-231 breast cancer, HeLa, and HBL-100 cells were examined for morphologic changes such as nuclear condensation and membrane blebbing. There were no significant differences between two independent experiments.

Figure 8.
Cell cycle analysis of MDA-MB-231, MCF-7, HeLa, B16-BL6, and HBL-100 cells treated with YSH. Flow cytometry profiles of MDA-MB-231, MCF-7, HeLa, and HBL-100 cells treated with 0.6, 1.0, and 2.5% YSH for 24 h. Treated cells were compared to negative control cells and the 1% sugar control. The percentage of cells in the sub-G1 cell population (apoptotic) and each phase of the cell cycle was estimated by gating for the fluorescent intensity corresponding to the amount of DNA in each event with respect to non-treated cells. The graphs show the percentage of cells in each phase based on three independent experiments.

Figure 9.
YSH down-regulates anti-apoptotic proteins and up-regulates pro-apoptotic proteins in MDA-MB-231 and MCF-7. Whole-cell lysates were prepared after treating MDA-MB-231 or MCF-7 cells with 1% YSH for 24, 48, and 72 h. Proteins levels and cleavage statuses were analyzed by Western blot analysis using antibodies against Bcl-2, Bax, Caspase 9, and PARP-1. GAPDH and β-tubulin were used as loading controls.

Table 1.
Sidr honey samples collected from different regions.
| Honey Type | Botanical Original | Honey Code | Honey Source |
|---|---|---|---|
| Clover honey | 1 | Commercial (Canada) | |
| 2 | Saudi Arabia (Mountain Sidr) | ||
| Sidr honey | Ziziphus spina-christi L | 3 | Lote Co., UK market (Yemen) |
| 4 | Saudi Arabia market (Yemen) |
Table 2.
The weight percent for specific sugar components in samples of honey.
| Honey 1 | Honey 2 | Honey 3 | Honey 4 | |
|---|---|---|---|---|
| fructose | 37.5 | 30.0 | 28.0 | 30.7 |
| glucose | 7.7 | 19.1 | 16.8 | 21.3 |
| sucrose | 1.6 | 3.8 | 3.6 | 3.9 |
| maltose | 0.1 | 4.5 | 4.8 | 5.7 |
| trehalose | 0.3 | 3.2 | 0.7 | 0.4 |
Table 4.
The IC50 of YSH on cancer cells as obtained using the SRB assay.
| Compound | MCF7 | MDA-MB231 | HeLa | HBL-100 |
|---|---|---|---|---|
| IC50 (%) | 0.99 ± 1.4 | 2.3 ± 1.2 | 1.95 ± 0.78 | ~10 |
Disclaimer/Publisher’s Note: The statements, opinions and data contained in all publications are solely those of the individual author(s) and contributor(s) and not of MDPI and/or the editor(s). MDPI and/or the editor(s) disclaim responsibility for any injury to people or property resulting from any ideas, methods, instructions or products referred to in the content. |
© 2024 by the authors. Licensee MDPI, Basel, Switzerland. This article is an open access article distributed under the terms and conditions of the Creative Commons Attribution (CC BY) license (https://creativecommons.org/licenses/by/4.0/).
Share and Cite
MDPI and ACS Style
Almnayan, D.; Lafrenie, R.M. Yemeni Sidr Honey Inhibits Cell Proliferation and Promotes Apoptosis in Human Cancer and Mouse-Derived Cell Lines. Targets 2024, 2, 64-79. https://0-doi-org.brum.beds.ac.uk/10.3390/targets2020004
AMA Style
Almnayan D, Lafrenie RM. Yemeni Sidr Honey Inhibits Cell Proliferation and Promotes Apoptosis in Human Cancer and Mouse-Derived Cell Lines. Targets. 2024; 2(2):64-79. https://0-doi-org.brum.beds.ac.uk/10.3390/targets2020004
Chicago/Turabian StyleAlmnayan, Danah, and Robert M. Lafrenie. 2024. "Yemeni Sidr Honey Inhibits Cell Proliferation and Promotes Apoptosis in Human Cancer and Mouse-Derived Cell Lines" Targets 2, no. 2: 64-79. https://0-doi-org.brum.beds.ac.uk/10.3390/targets2020004