
Water Diffusion in Additively Manufactured Polymers: Analysis of the Capillary Effect

Wolfson School of Mechanical, Electrical and Manufacturing Engineering, Loughborough University, Loughborough LE11 3TU, UK
*
Author to whom correspondence should be addressed.
Micro 2024, 4(2), 281-294; https://0-doi-org.brum.beds.ac.uk/10.3390/micro4020017
Submission received: 26 February 2024
/
Revised: 8 April 2024
/
Accepted: 23 April 2024
/
Published: 25 April 2024
(This article belongs to the Special Issue Functional Micro Structures and Textures: Manufacturing and Applications)
Abstract
:Additive manufacturing (AM) is an advanced manufacturing method that produces objects by sequential layering. Material extrusion AM (MEAM) with continuous-fibre reinforcement is becoming more widely used in naval structures, which are exposed to the marine environment. However, the water diffusion process and the effect of water ageing on the mechanical performance of AM materials are not yet well understood because of their complex internal structure, caused by defects generated during manufacturing. Current research on diffusion is mostly based on experimental methods for conventionally manufactured materials without considering AM-induced defects. The objective of this study is to explore how the defects inherent to MEAM affect water diffusion in a composite material by the capillary effect. Results from a numerical study of capillary flow in MEAM polymer are applied as a boundary condition in the subsequent finite-element analysis. The study illustrates that flow in the capillary reaches the steady state quicker compared to the saturation time in the matrix, predicted by Fick’s diffusion equation. It is demonstrated that the capillary effect can significantly affect the water diffusion in MEAM parts and reduce the saturation time to one-third compared to the case without accounting for this effect.
1. Introduction
Additive manufacturing (AM) is a widely used method with potential applications in the shipbuilding and biomedical industries [1,2,3,4]. Polyethylene terephthalate glycol (PETG) is one of the mainstream materials in 3D printing as it demonstrates excellent mechanical properties and chemical resistance. Thanks to these properties, it has significant potential in naval structures and for use in the marine environment [5]. However, the degradation of 3D-printed PETG is one of the major challenges to address during the design and manufacturing of components used in the maritime sector.
Li et al. [6] explored the hygrothermal degradation of traditional carbon-fibre (CF) woven/PETG sheet laminated composite (produced by hot-press moulding) at 20 °C, 45 °C and 60 °C for 90 days. For PETG specimens reinforced with CF woven fabric, the specimens absorbed less water than pure PETG samples at all test temperatures. The flexural strength of the PETG specimen exhibited a decrease ranging from 28.6% to 32.2% across a temperature range of 25 °C to 60 °C. PETG specimens produced with material extrusion AM (MEAM) after immersion in salt water at 30 °C for 21 days demonstrated a reduction in tensile strength of 6.36% as observed in [7]. Compared to polylactic acid (PLA) and polycarbonate (PC), PETG specimens showed a better resistance to water ageing. Obviously, the extent of the reduction in mechanical performance after water ageing is one of the critical factors for many naval applications.
The microstructural analysis of a specimen that failed in a three-point bending test with scanning electron microscopy (SEM) showed that the absorbed water mainly influenced the interface area, leading to debonding between the matrix and fibres. For MEAM composite materials, the gaps between layers, voids and other defects generated during manufacturing led to higher levels of water diffusivity and the absorption rate as well as a larger surface area for water permeation [8]. Also, surface roughness affects diffusivity by varying the surface area and is related to layer thickness, printing speed, nozzle temperature and other manufacturing factors [9].
Current research on water diffusion in composite materials focuses on Fick’s or Langmuir’s diffusion in the matrix by considering it as a homogeneous material [10]. However, various researchers indicate that the random voids in MEAM structures are unavoidable, significantly increasing the volume fraction of porosity in the printed samples [11,12]. The size of the void is related to the insertion of the reinforcement material [13], the gap between the contour layer and the infill zone due to the printing line width [14], the infill pattern, etc. The research of Goh et al. [15] showed that in MEAM carbon- or glass-fibre-reinforced nylon, there were voids with a size of more than 16.4 µm in the matrix. Voids due to the imperfect bonding between the fibre and the matrix were also observed [16].
Compared to conventional manufacturing, the material extruded from the nozzle cools down quickly at room temperature. Seppala et al. [17] explored the temperature of printed ABS filaments after extrusion for different nozzle temperatures and printing speed settings; all printed materials were cooled down to below their glass transition temperature in 1–3 s after extrusion. Hence, the printed beads did not bond to the composite below and connect to them perfectly due to a short welding time. The gaps generated between beads during 3D printing were found with a diameter of less than 30 or more than 100 μm [18]. The size of voids with triangular cross-sections between beads could be reduced by increasing the volume fraction of fibres or reducing the layer thickness. Such voids are canals or capillaries that accelerate the water diffusion process in the MEAM composite material.
Apart from the gaps between beads, there are also capillaries in the matrix due to manufacturing defects. Research by Sommacal et al. [19] demonstrated with micro-CT scanning that the layers close to the building plate had fewer voids in the matrix compared to the upper layers. Moreover, the cracks and delamination during the manufacturing of composite materials can also have similar effects as voids [20].
MEAM composites have more voids in the matrix compared to composites produced with conventional manufacturing methods. Thus, the capillary effect on the water diffusion process in such composites cannot be ignored. Thomason [21] indicated that voids in the matrix are one of the major factors affecting water diffusion in glass-fibre-reinforced composites. The amount of absorbed water doubled when the void volume in the matrix increased by 1% of the composite volume. By combining a foaming agent and resin, Ayanoglu et al. [22] demonstrated that voids in the matrix significantly reduced the strength of the material but also increased water absorption. The presence of air in voids hindered the water penetration; so, the calculated saturated water content was higher than the actual level. Moreover, the decrease in strength after water uptake is more significant than that for samples without voids.
Fichera and Carlson [16] explored the water diffusion in vinyl ester resin reinforced with carbon fibres. Three different sizes of square composite panels were immersed in seawater for 60 days and compared with pure-matrix specimens. The former absorbed more water than the pure-matrix specimens due to higher void content. The acquired data were fitted into a Fickian diffusion model to investigate the influence of the capillary effect. For smaller panels, the spread of water-uptake levels in different specimens indicated the randomness in the distribution of voids. However, simulations with a capillary model resulted in a shorter time to reach the saturation state than that measured in experiments. This might be due to the capillaries being assumed to penetrate the whole panel, having the same diameter along their length and being evenly distributed. In reality, capillaries may be interrupted by fine bonding between fibres and a matrix in composites.
Further, Caggiano et al. [23] simulated the capillary-related water absorption in cementitious materials at the mesoscale by assuming the evenly distributed porosity, which formed the capillaries in cement, penetrating the whole specimen. After measuring the average porosity in cement, the diffusion rate due to the capillary effect in a unit volume can be applied to a simulation of the water diffusion process. A 40 × 40 × 160 mm3 prismatic specimen was submerged in a container with a water level of 7.5 mm to validate the capillary model. The mesoscale approach matched well with the experimental result, demonstrating that the microscale approach could be scaled up to the macro level if the simulation parameters were sufficiently representative.
Still, there is a considerable lack of research into water diffusion in MEAM composites, with their inherent porosity. So, in this study, an advanced numerical simulation of the effect of a capillary in a part of the MEAM composite surrounding it is performed by considering both Fick’s diffusion in the matrix and the flow in the canal. The capillary is assumed to have a constant radius and penetrate the entire composite domain to emulate the canals between the 3D-printed filaments as shown in Figure 1. The moisture flow is driven by the capillary force and water pressure while it is resisted by the pressure caused by the residual air in the canal, the flow dynamic pressure and the viscous drag. The capillary model is based on the force equilibrium in a capillary flow, solved with the finite difference method. The result of this model is applied as a dynamic boundary condition (BC) in the finite-element model of a conventional Fick’s diffusion of water in ABAQUS software. The FEM results are compared with a matrix model without capillaries to explore the capillary effect on water diffusion in MEAM composite materials as opposed to conventionally manufactured composite materials.
2. Capillary Effect
2.1. Fick’s Diffusion and Capillary Effect
Fick’s law is a fundamental rule used in the analysis of moisture diffusion; it states that the diffusion flux at a certain point is proportional to the diffusivity and the local concentration gradient as in the following formula [10]:
where J is the diffusion flux, D is the diffusivity, φ is the concentration, and x is the position.
The flow in the capillary follows Jurin’s law, with the capillary force proportional to the surface tension and the cosine of the contact angle of fluid in the capillary [24]:
where r is the radius of the capillary, σ is the surface tension of the fluid and θ is the contact angle of the capillary wall’s material. The constitutive model of the flow in the capillary is described next. For a capillary with a length of and a radius of r, when the water flows at a distance of x, the free-body diagram of the forces in the capillary flow is shown in Figure 2. The capillary flow is driven by the capillary flow and water pressure . The pressure of the air bubble trapped in the capillary , the dynamic pressure of flow in the capillary and the viscosity force between the flow and the capillary wall retards the flow. The respective constitutive relationship then has the following form:
where water with the mass flows at the distance x in the capillary with the radius of .
A further detailed equation from [24] describes the dynamic equilibrium state of water in the capillary, introducing explicit relations for the acting forces into Equation (3):
where the specimen is placed in water with a depth , is the water density, is the gravitational acceleration and is the pressure of air that remains in the capillary, which varies during the flow of water in the capillary and follows the ideal gas law.
The relationship between the air pressure and the water flow distance in the capillary with the length L is given by the following expression from [24]:
By applying a finite-difference approach to Equation (4), the differential equation is converted to a quadratic equation:
Various researchers indicated that in MEAM PETG, the contact angle in the longitudinal and transverse directions is different [25,26]. As the capillary is parallel to the printing direction, the water contact angle in the longitudinal direction is used in this study. Moreover, the printing speed, acceleration and flow rate have a significant effect on the contact angle of printed specimens. The microscopic analysis also demonstrated that samples with higher surface quality had better hydrophobic performance. A solution for the water flow process in the capillary with a length of 0.1 m based on Equation (4) was performed in MATLAB.
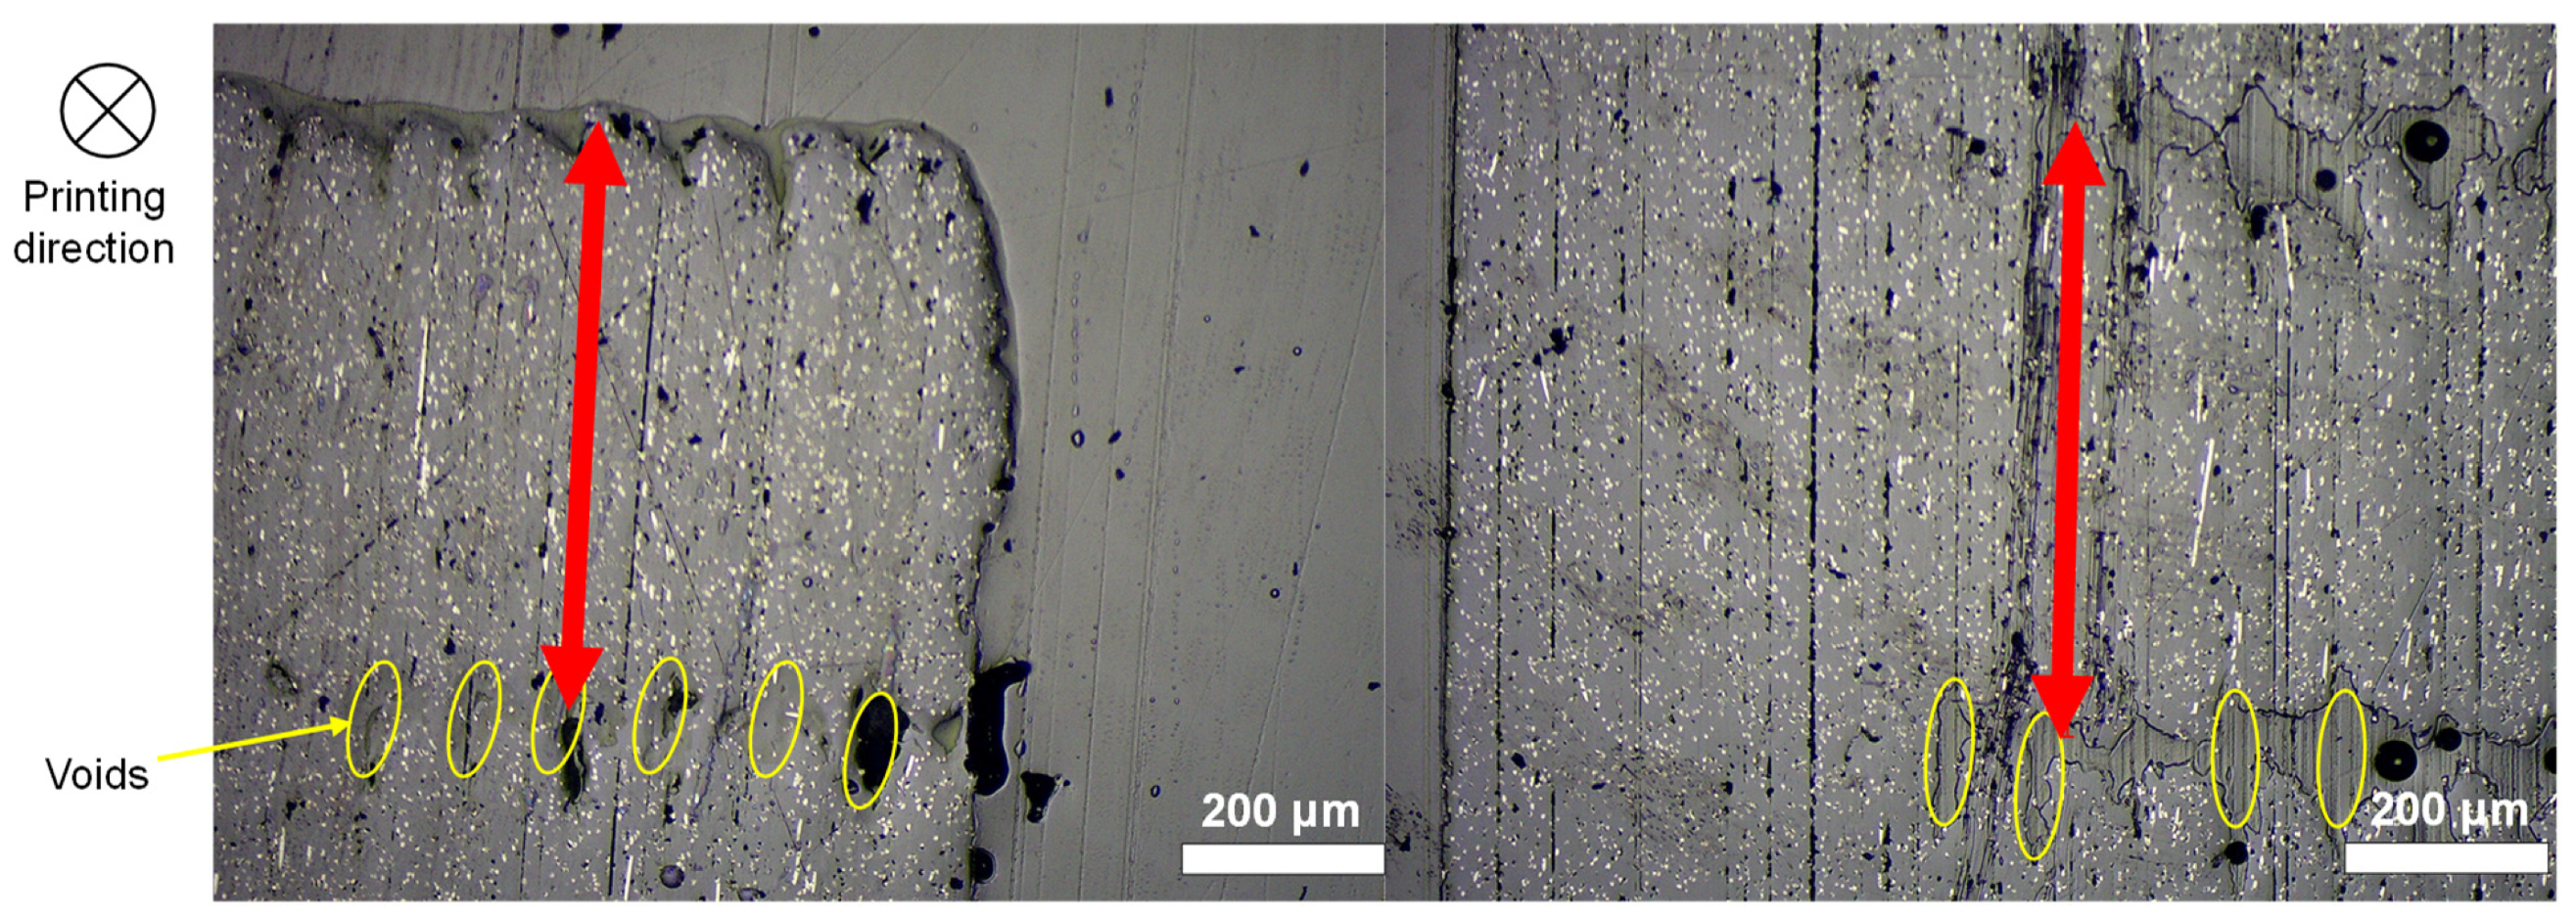
Specimens of PETG reinforced with carbon fibres were 3D-printed [27], ground and then observed with optical microscopy. An example of a transversal cross-section of the specimen is shown in Figure 3. The 3D-printed PETG reinforced with short carbon fibres was polished before observations with an optical microscope. As obvious from Figure 1 and Figure 3, the voids between printing beads can be readily observed, with their size varying from 30 µm to 100 µm due to different printing parameters, illustrating the radius range for capillaries in the study.
The numerical simulation was implemented under the following assumptions:
- The capillary is a perfectly round tube that penetrates the whole specimen.
- Some part of the air in the capillary escapes immediately when the specimen is placed in the water tank.
- The residual air and water in the capillary remain at room temperature.
- The air that remains in the capillary is dry.
Parameters used in the numerical simulations are given in Table 1.
2.2. Results and Discussion
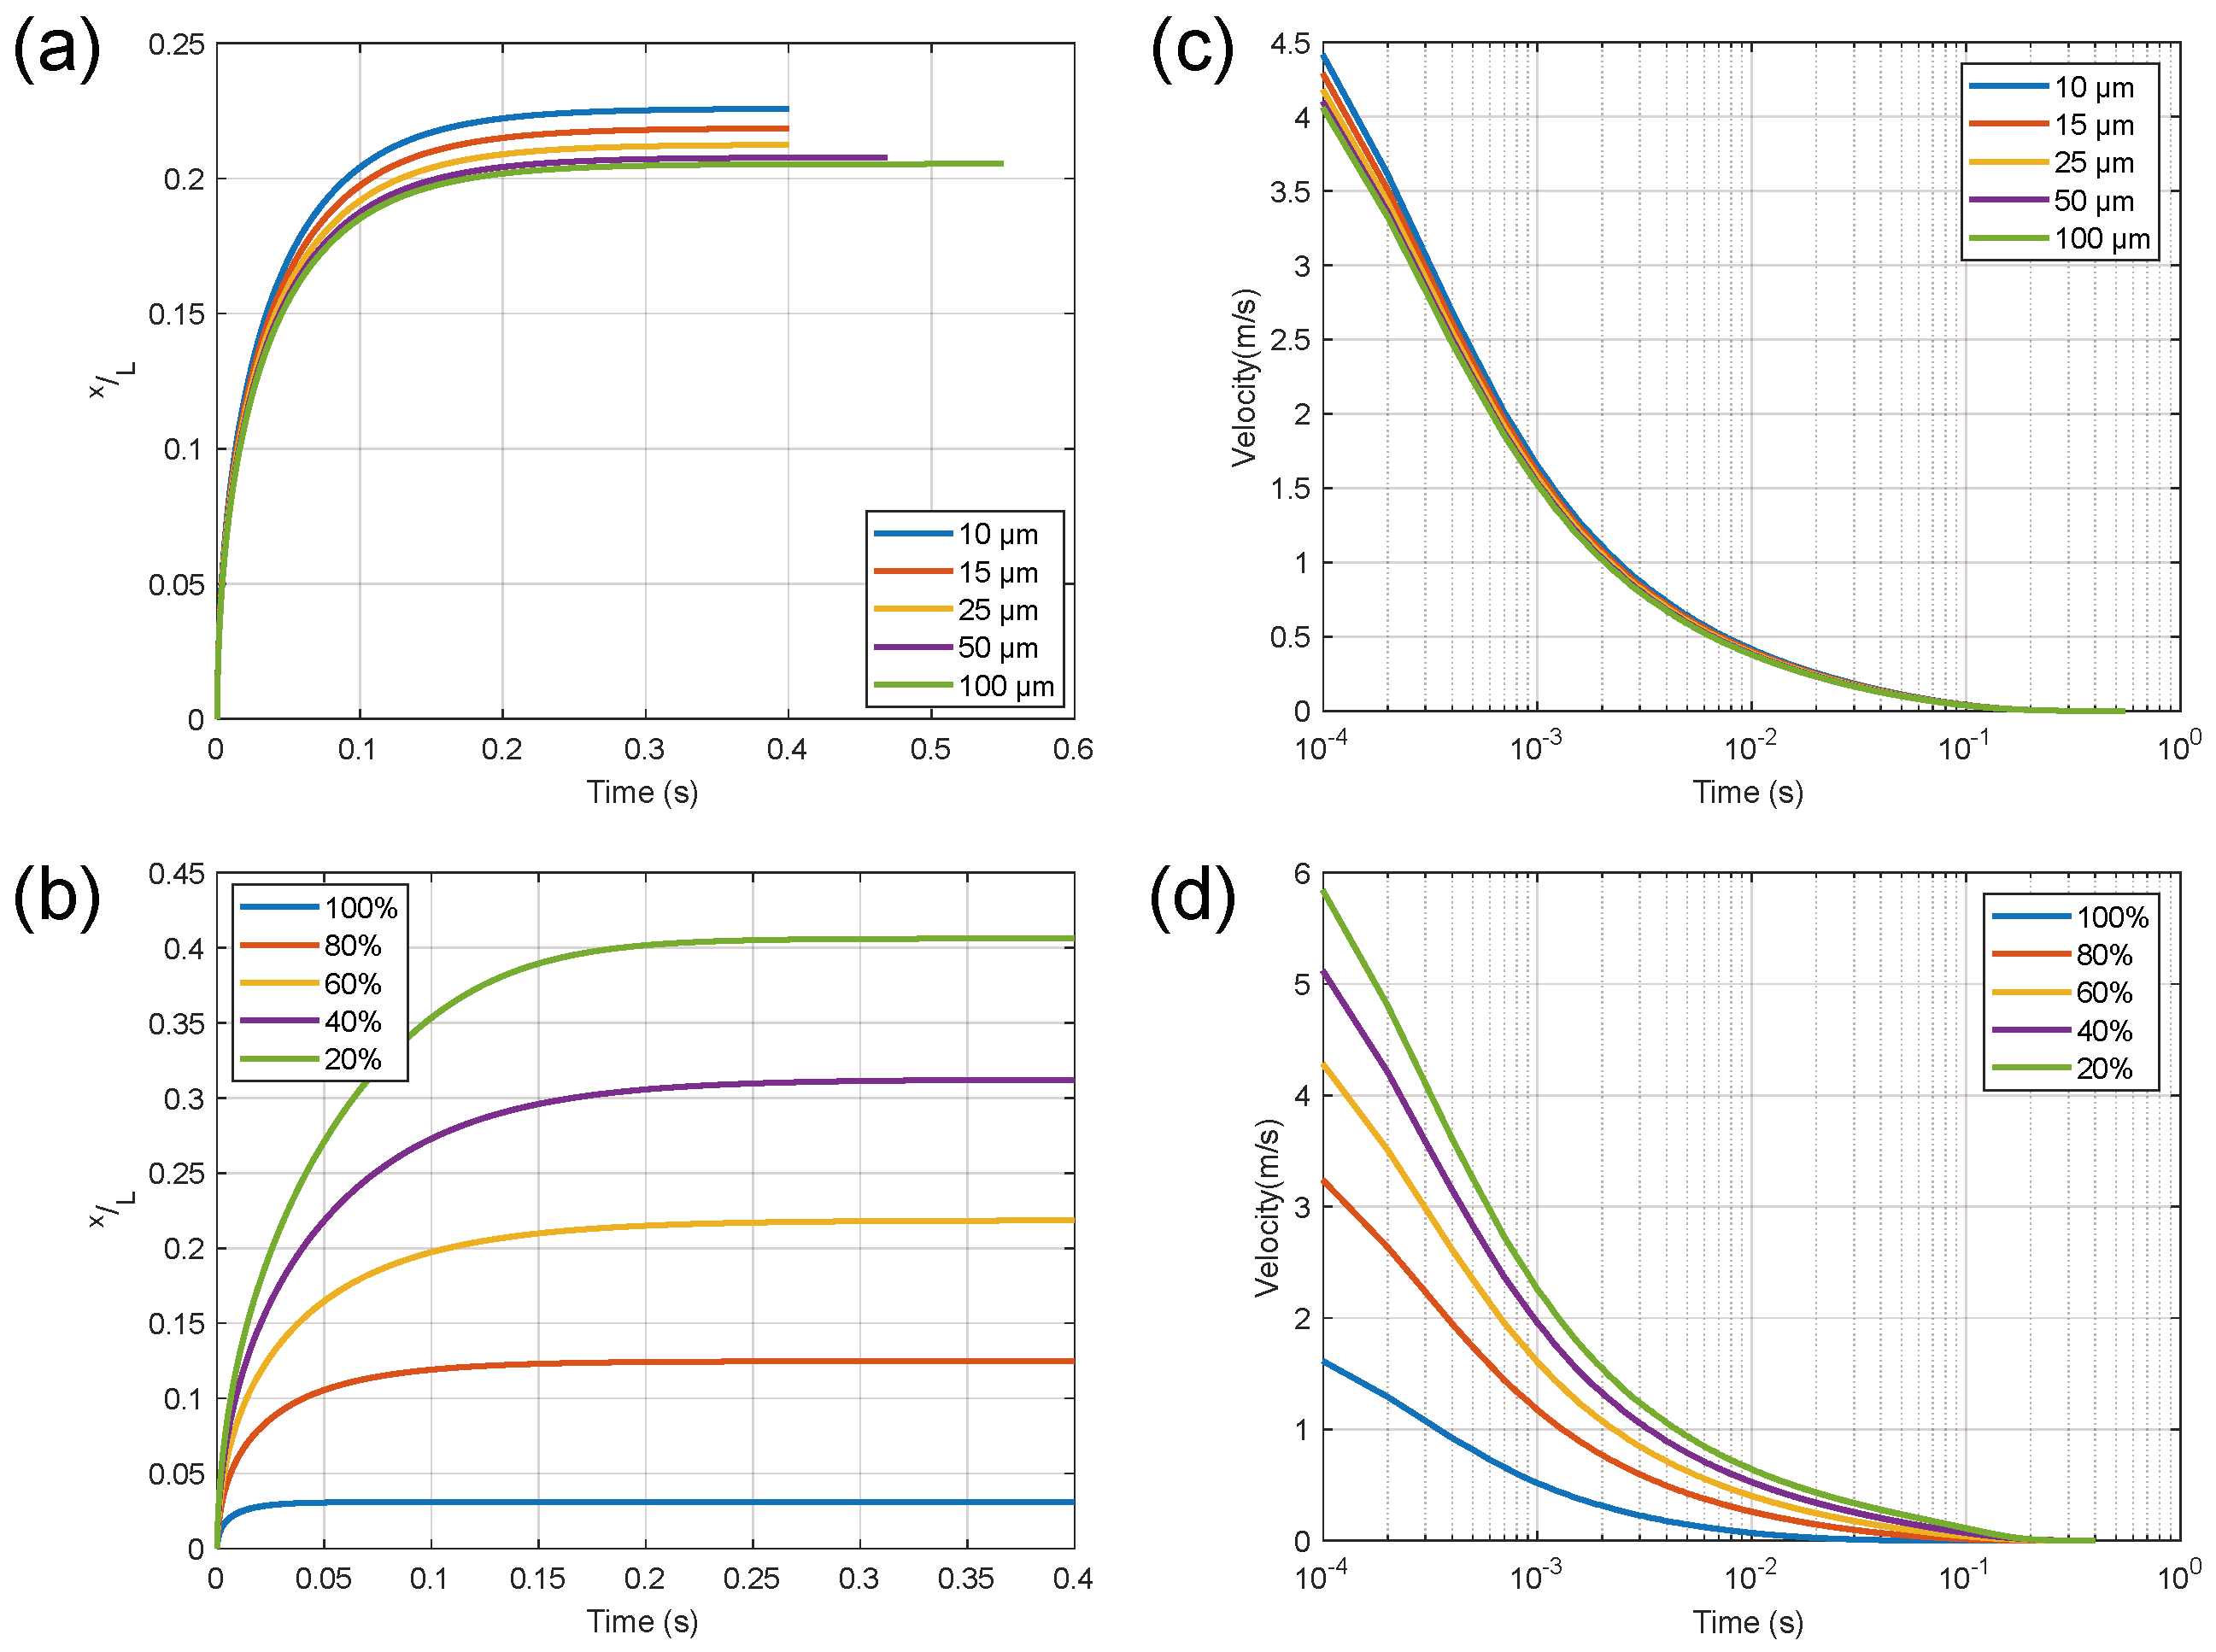
Following [17], a range of capillary radii from 10 µm to 100 µm were selected to investigate the effect of the radius on the capillary effect. As shown in Equation (4), the capillary force is proportional to the capillary radius. Meanwhile, the dynamic pressure of the flow and the pressure from the trapped air , which delay the capillary flow, are proportional to the square of the capillary radius. Therefore, as the radius of the capillary decreases, the length of the capillary flow increases. As shown in Figure 4a,c, the effect of the capillary radius converges after it reaches a threshold of 50 µm. It is worth noting that the convergence level for Equation (7) was 10−9 for the radius change from 50 µm and 100 µm, and it takes a few more iterations to converge.
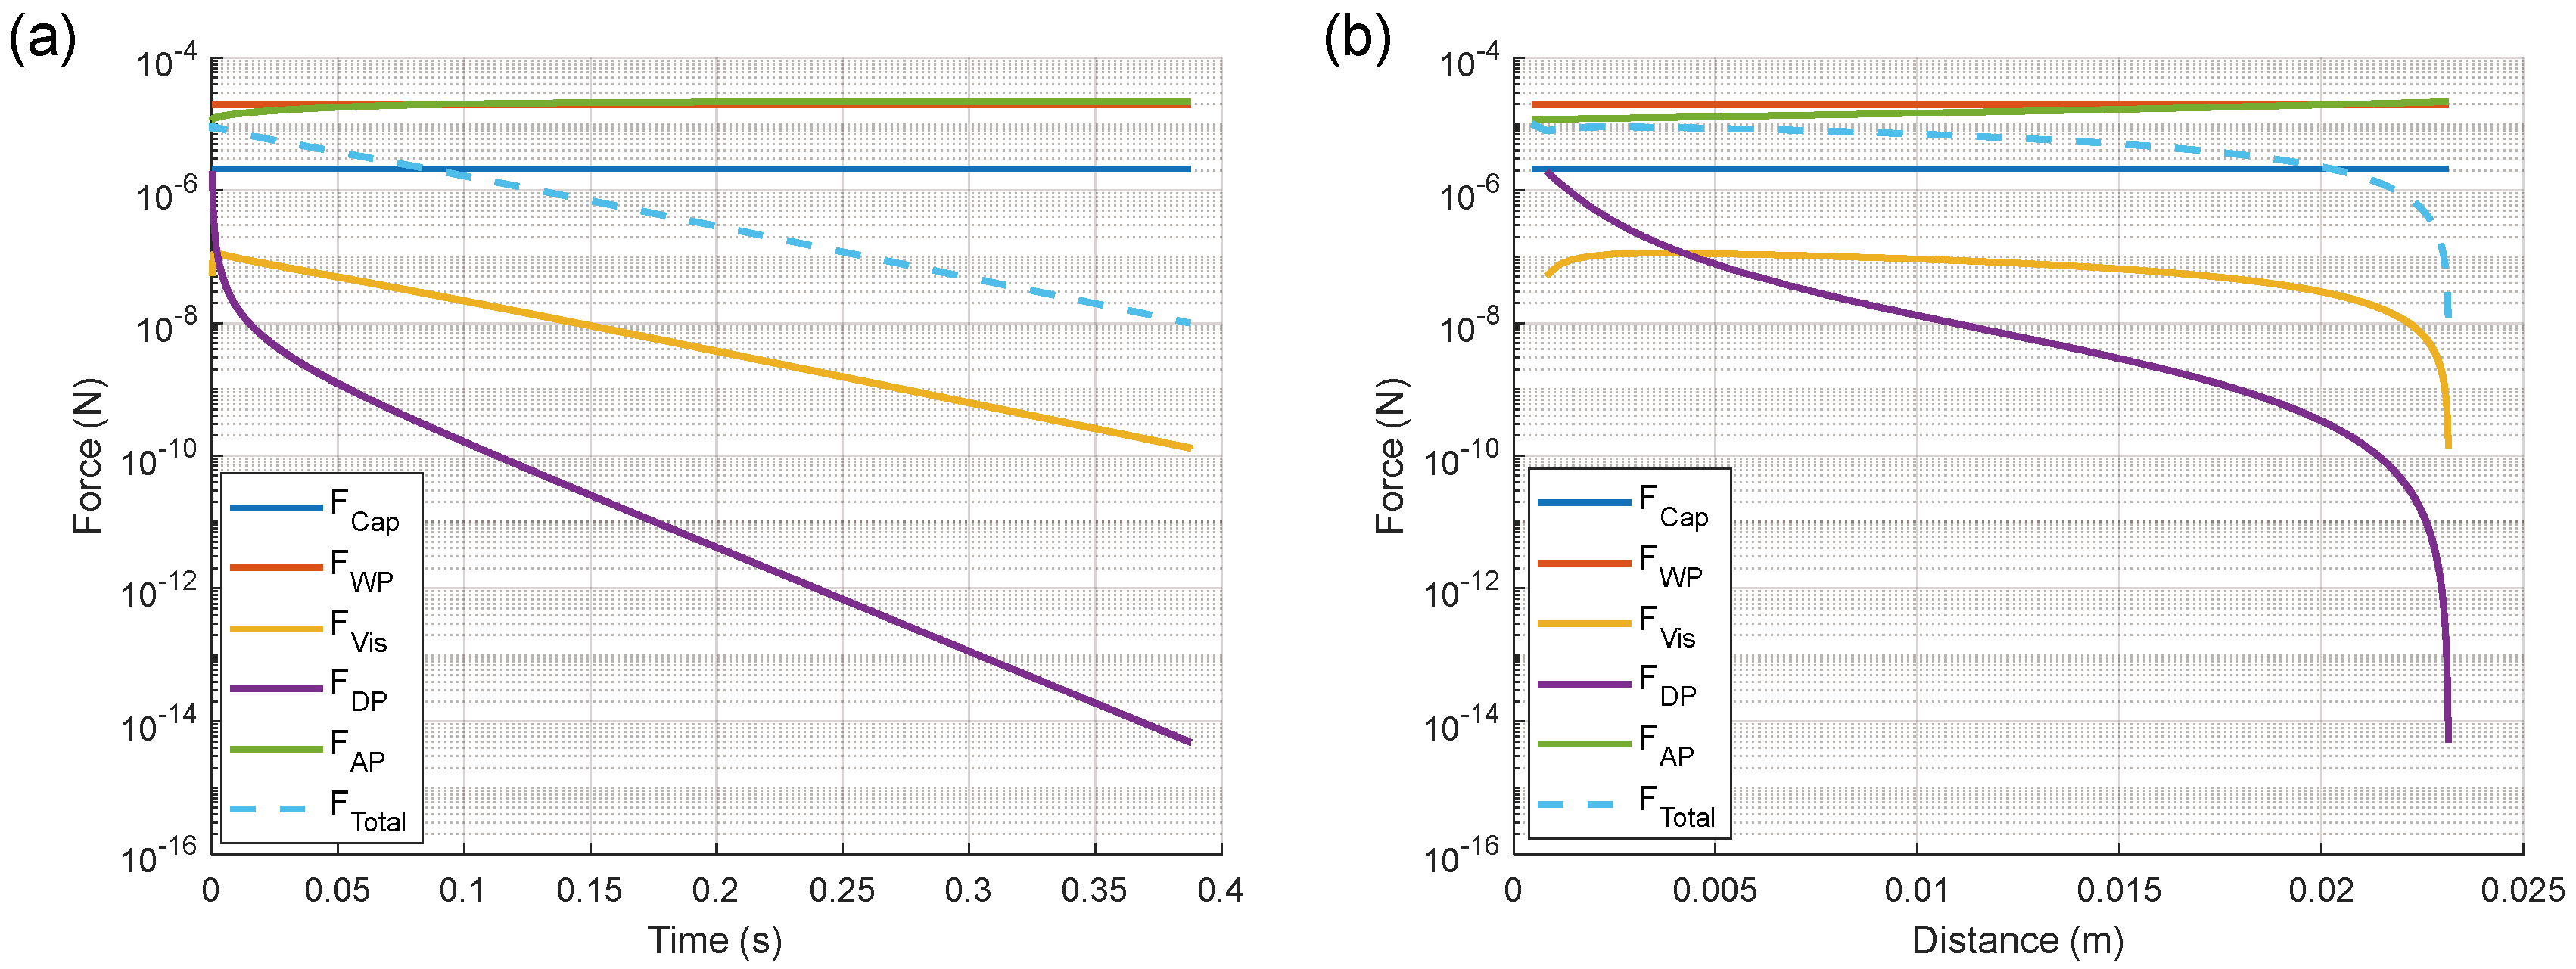
In previous studies, the air was assumed to be fully trapped in the capillary, which differs from real-world scenarios. However, the amount of residual air in the capillary has a considerable influence on the length of water flow in the capillary. As shown in Figure 4b, the amount of residual air has a significant contribution to the length of the capillary flow. The capillary flow occupied the space of the escaped air and extended even further under the influence of the capillary force and water pressure. Moreover, when there was less residual air in the capillary, the influence of the capillary force and water pressure was reduced due to the larger pressure rise when the capillary flow advanced the same distance but with less residual air in the canal. This scenario was also reflected in the evolution of flow speed in the capillary for different air residuals in the canal as shown in Figure 4d. Consequently, in the subsequent investigation, the working assumption was that 40% of the air promptly evacuated the capillary upon immersion of the specimen into the water reservoir. According to Figure 1 from [18], a capillary radius of 15 µm was chosen to simulate the scenario of a specimen printed with high quality. Therefore, a radius of 15 µm and 60% residual air in the capillary were selected in the subsequent FEA simulations. The results of this study are shown in Figure 5, presenting the evolution of various forces acting in the system (see Equations (3) and (4)).
The viscosity friction and dynamic pressure , which are related to the flow speed (yellow and purple lines in Figure 5, respectively) had a minor influence on the capillary flow since they had significantly lower magnitudes. The capillary flow and water pressure (blue and red lines, respectively) were constant along the entire capillary according to Equation (4). The air pressure (green line) increased as air in the bubble became compressed when the flow advanced; it played the dominant role in retarding the capillary flow.
3. Finite-Element Simulations
3.1. FEA Implementation
One part of a 3D-printed specimen surrounding a capillary penetrating the whole specimen was simulated with the finite-element analysis (FEA). The dimensions of the model are shown in Figure 6. In a printed part of 100 mm in length, the rectangular transversal cross-section was 1 mm by 0.1 mm. A capillary with a diameter of 0.03 mm was placed in the centre of the cross-section. The properties of the matrix material are given in Table 2.
As the capillary flow process is almost instant compared with the global water diffusion in the specimen, the magnitude of the time increment should be small enough to adequately resolve its evolution. To reduce the computational cost, the ABAQUS FEA simulation was partitioned into three phases with different time increments (Table 3) to adequately assess the capillary effect on diffusion. In the first stage, the water flows into the capillary until saturation. In order to simulate the influence of the capillary, the flow from the capillary model was applied as a discrete boundary condition for diffusion at different time steps, as shown in Table 4 and Figure 7, applied from the beginning of the simulation. In Phase 1, the capillary flow boundary condition was applied to simulate the water diffusion when the capillary flow is advancing in the tunnel. Therefore, a fine time increment was considered due to the high capillary flow speed. In Phase 2, after the flow was fully expanded in the canal, the water diffusion direction was both longitudinal, from the specimen end, and radial within the capillary. Hence, the size of the increment was slightly increased. In Phase 3, the elements along the capillary in the longitudinal direction were almost saturated and the diffusion evolved in the lateral direction. Consequently, the size of the time increment was increased. In addition, the specimen absorbed water in the longitudinal direction from the edge of the specimen, which was at the same boundary condition (in terms of water concentration) as control Case III in Table 3 without the capillary inside the simulated domain. As a result, the matrix near the capillary reached a saturation state of the diffusion process. The water diffusion in the model was pure Fick’s diffusion in the longitudinal direction in the last step.
However, in the initial phase of the water diffusion, the part of the capillary freed by the evacuated air was filled with water almost instantaneously on a global time scale of Fick’s diffusion. In Phase 1, the time increments were small and segmented into different steps to have precise discrete boundary conditions, which otherwise would require a high computational power. To further reduce this computational cost of simulations, the boundary conditions were simplified as a single boundary condition, underpinned by a conducted sensitivity study, as shown in Cases I and II in Table 3. The comparison of the approaches of Cases I (single BC) and II (multiple BCs) is shown in Figure 8. In the second case, the size of the time increment in Phase 1 was significantly reduced. Although there was a significant lag between the modelled cases in the initial phase, their results converged after 10 s. Considering the duration of the entire process of water diffusion, the difference was minor and could be ignored.
3.2. Results and Discussion
In the case with the capillary (Case IV, orange line), the global water concentration reached half of the saturation level at the very beginning of the simulation (Figure 9), corresponding to the result of the FEA simulation where half of the specimen was saturated while the rest of the specimen that was not affected by the capillary flow was still almost dry during Phases 1 and 2. After Phase 2, the water diffusion speed significantly reduced as the contact surface with water was only along the longitudinal direction, whereas the elements adjacent to the canal were not affected by the flow. As a result, when the capillary flow effect was considered, the water concentration in the specimen reached a saturation state after 2 × 10⁴ s, significantly earlier than in the control case without a capillary (Case III). This, the capillary in the specimen significantly accelerated the diffusion of water, reducing the water saturation time by a factor of 3 compared to the fully solid model.
Further, the evolution of water concentration in different zones along the component’s length was evaluated. As shown in Figure 10, the concentration in the initial parts of the capillary with equal to 0.1 L, 0.25 L and 0.4 L (L is the total length of the model) almost converged and reached a saturation state much earlier than the rest of the model. The elements adjacent to the capillary flow reached saturation almost instantaneously. This result indicates that the water diffusing from the edge of the specimen had a minor influence compared to the radial water diffusion from the capillary flow in Phases 1 and 2. Meanwhile, the average water concentration with L rose slowly after Phase 2 due to Fick’s diffusion applied in the matrix where the capillary flow cannot reach.
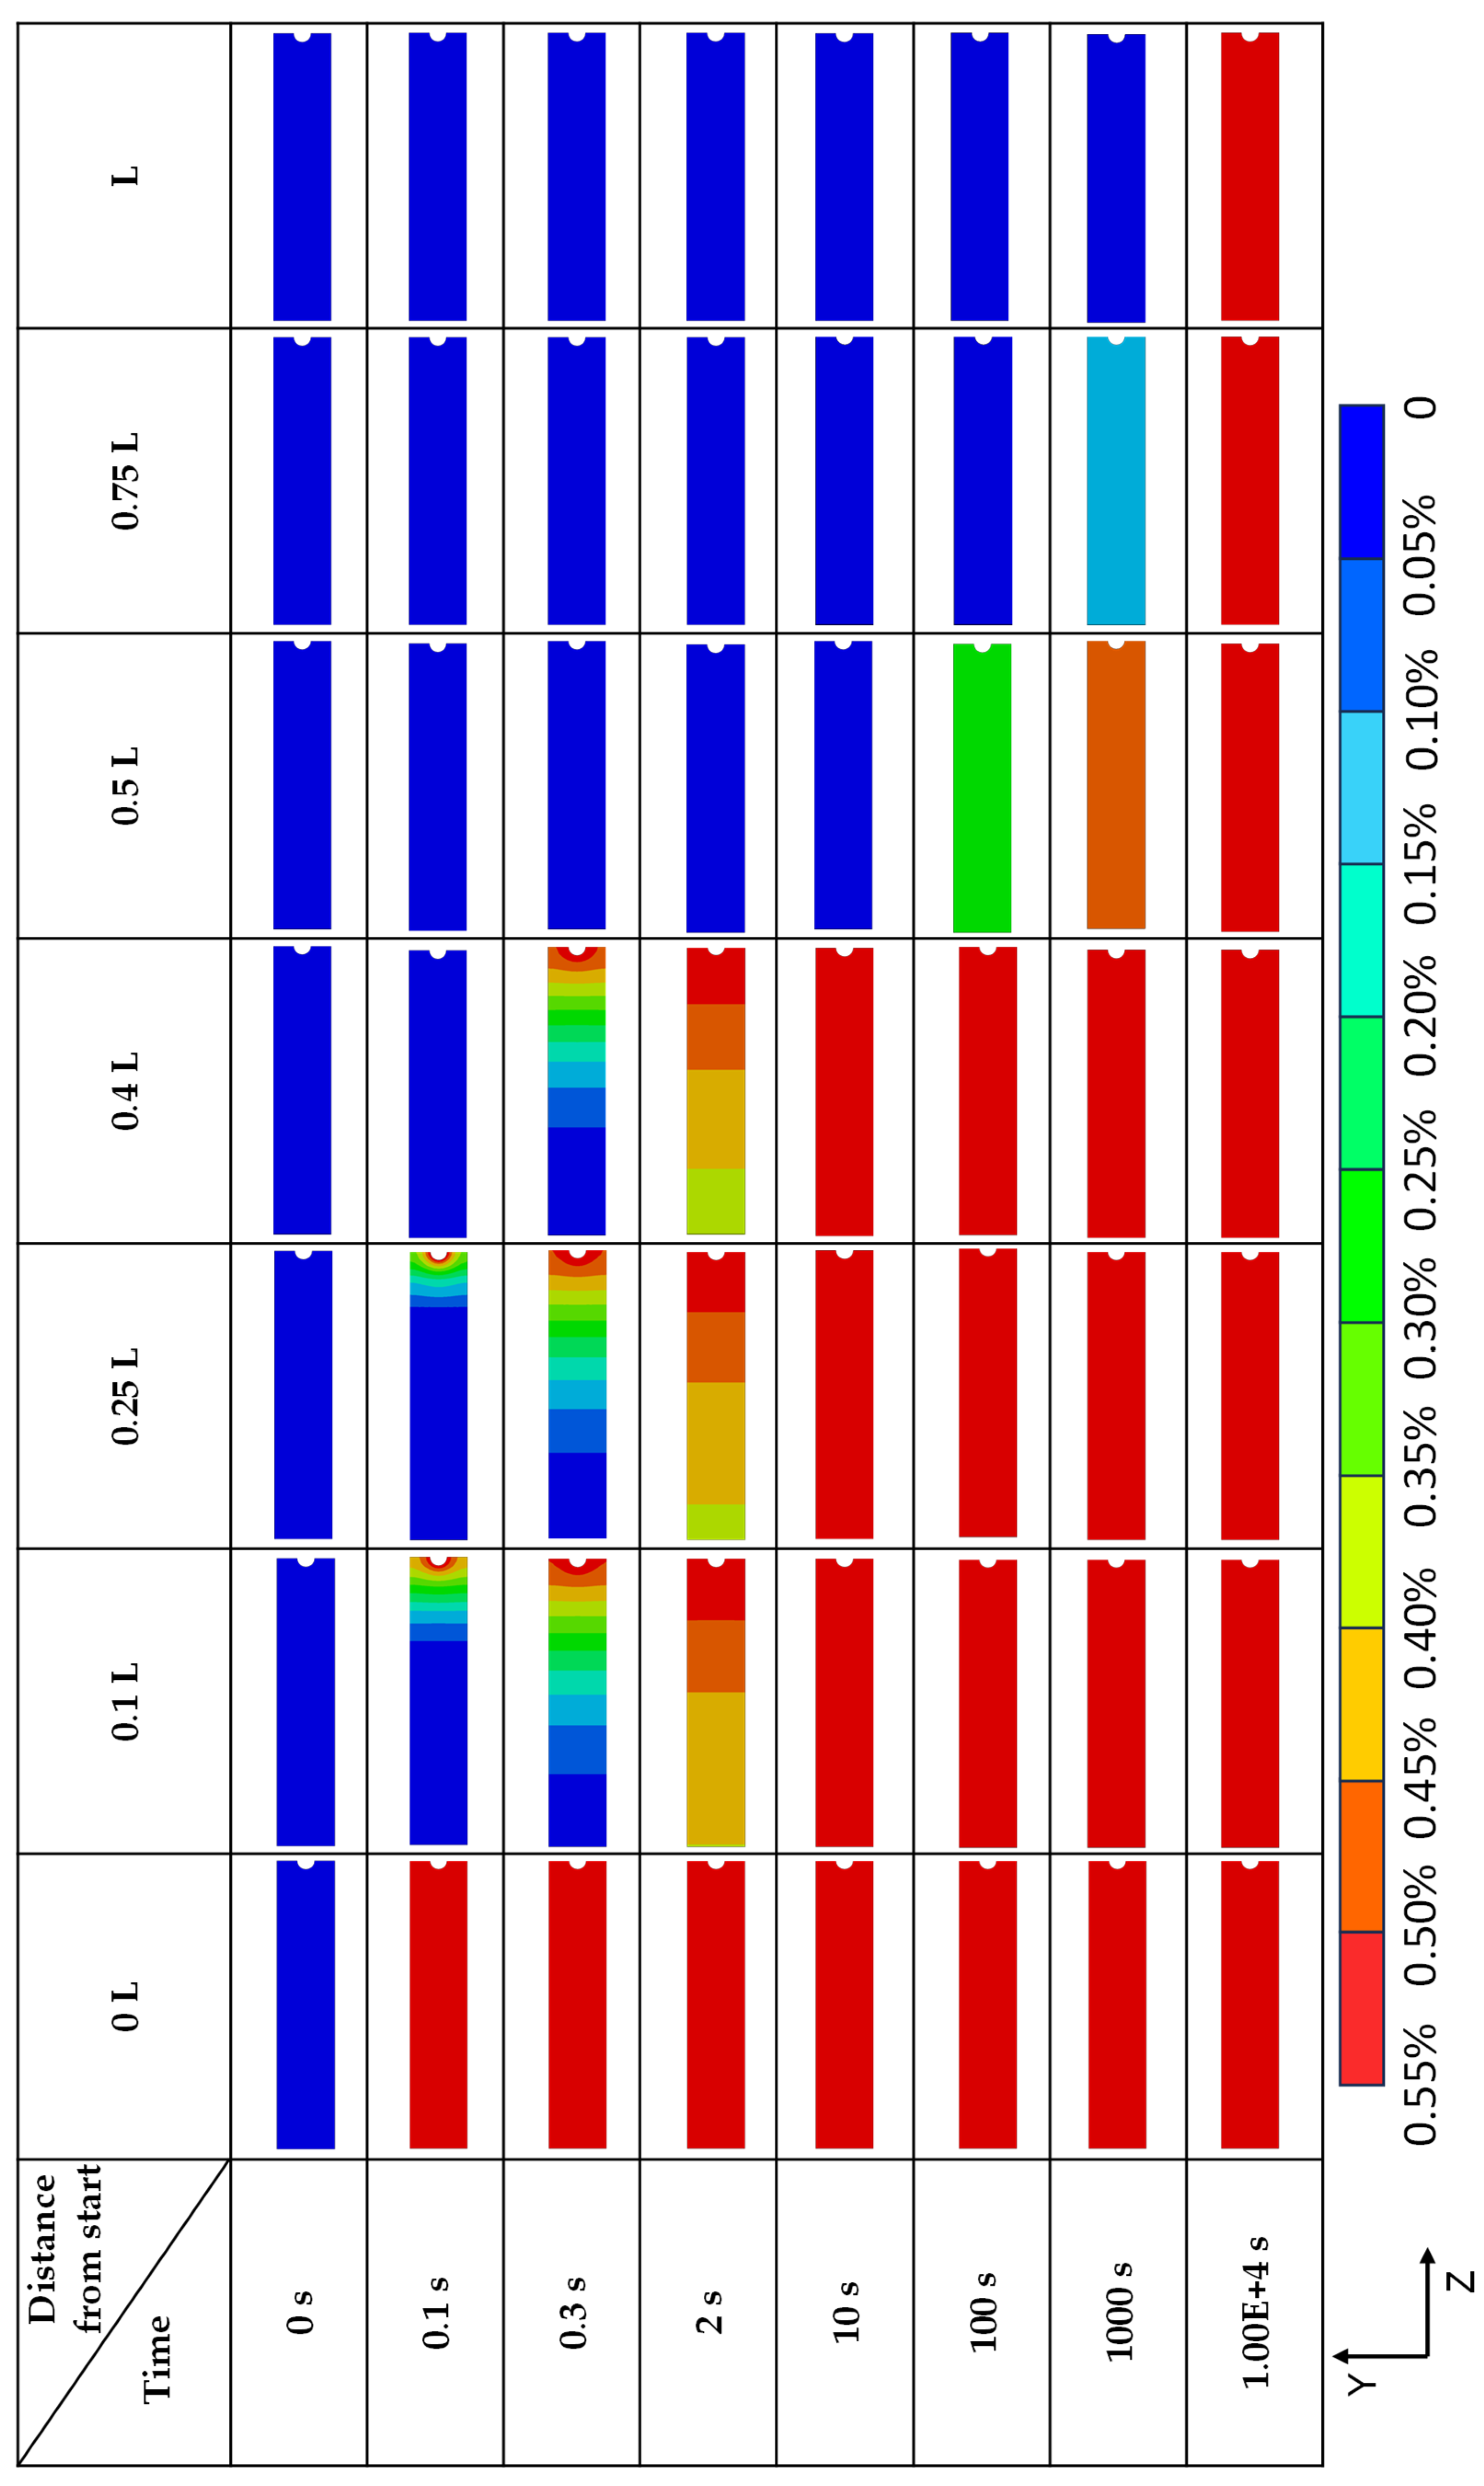
Figure 11 illustrates the evolution of water uptake in a multi-step model (Case iv). At 0.1 s, radial diffusion in the matrix due to the capillary flow in the tunnel was observed at the position below 0.4 L from the edge of the specimen. Different concentration distributions are due to boundary conditions representing the capillary flow’s development. At 0.3 s, the advance of the capillary flow was delayed by the resistance of the air trapped in the middle part of the capillary, while the moisture from the specimen’s edge to the position at 0.4 L continued to penetrate the specimen by radial diffusion. At 2 s, there was a significant difference in water concentration between the front 40% of the specimen’s length and the parts located farther away. At 10 s, the initial 40% of the specimen reached a saturation state while the rest of the specimen was still almost dry. After 100 s, the specimen at the 0.5 L position began the water uptake, and the diffusion was only in the longitudinal direction. At 10,000 s, the entire specimen was close to the saturation state. Concentration distributions from the FEA simulation demonstrate that the capillary flow increased the contact area between water and the matrix material, significantly accelerating the water diffusion in the MEAM polymer.
At the half-length of the model (in the x direction), where the water flow cannot reach the capillary wall because of the trapped air, there is also diffusion flux in the direction along the canal from the elements adjacent to the capillary flow (Figure 12). However, because of the effects of the low concentration and the minor contact surface area, the character of concentration distribution in the longitudinal (i.e., x) direction was not presented in Figure 11.
Based on these observations, the flow in the capillary reached a saturation state rapidly. After that, the matrix neighbouring the canal absorbed the moisture from the capillary flow in a short time due to its large contact area with the canal. The diffusion flux was in the radial direction in this phase. The elements that the capillary flow could not reach did not experience significant quickening of the diffusion process. The existence of a capillary notably accelerated the diffusion process in the outer layer of the composite specimen and, therefore, reduced the time to reach the saturation state in the entire specimen. As a consequence, the water ageing of MEAM printed composite material with porosity higher than that of the conventionally manufactured material is a key factor when operating in marine environments.
4. Conclusions
In this study, a capillary model was employed together with a developed finite-element model to investigate the capillary effect in long thin voids, inherent in MEAM products in the diffusion process of PETG. The results of the simulations indicate that the capillaries created during the manufacturing of 3D-printed composites significantly accelerate the water diffusion process in the matrix. This also explains why the introduction of wall layers in a printed pattern could delay the water diffusion in additively manufactured composites [28]: The capillaries caused by defects in the printing direction are shielded by such wall layers. Hence, adding a wall layer could significantly delay the water diffusion process in the internal areas of the specimen and prevent the escape of trapped air inside the capillary, considerably delaying the flow in a capillary. The developed simulation strategy can be useful for the design and optimization of MEAM components and structures for service in marine applications.
Author Contributions
Conceptualization, B.L., K.P.B. and V.V.S.; methodology, B.L., K.P.B. and V.V.S.; software, B.L.; formal analysis, B.L.; writing—original draft preparation, B.L.; writing—review and editing, K.P.B. and V.V.S.; visualization, B.L.; supervision, K.P.B. and V.V.S. All authors have read and agreed to the published version of the manuscript.
Funding
This research received no external funding.
Data Availability Statement
The data supporting the conclusions of this article will be made available by the authors on request.
Conflicts of Interest
The authors declare no conflicts of interest.
References
- Ziółkowski, M.; Dyl, T. Possible applications of additive manufacturing technologies in shipbuilding: A review. Machines 2020, 8, 84. [Google Scholar] [CrossRef]
- Rawal, S.; Brantley, J.; Karabudak, N. Additive manufacturing of Ti-6Al-4V alloy components for spacecraft applications. In Proceedings of the RAST 2013—6th International Conference on Recent Advances in Space Technologies, Istanbul, Turkey, 12–14 June 2013; pp. 5–11. [Google Scholar] [CrossRef]
- Zhang, K.; Shi, D.; Wang, W.; Wang, Q. Mechanical characterization of hybrid lattice-to-steel joint with pyramidal CFRP truss for marine application. Compos. Struct. 2017, 160, 1198–1204. [Google Scholar] [CrossRef]
- Shuai, C.; Yang, W.; Feng, P.; Peng, S.; Pan, H. Accelerated degradation of HAP/PLLA bone scaffold by PGA blending facilitates bioactivity and osteoconductivity. Bioact. Mater. 2021, 6, 490–502. [Google Scholar] [CrossRef] [PubMed]
- Latko-Durałek, P.; Dydek, K.; Boczkowska, A. Thermal, rheological and mechanical properties of PETG/RPETG blends. J. Polym. Environ. 2019, 27, 2600–2606. [Google Scholar] [CrossRef]
- Li, W.; Zhao, X.; Liu, Y.; Ouyang, Y.; Li, W.; Chen, D.; Ye, D. Hygrothermal aging behavior and flexural property of carbon fiber-reinforced polyethylene terephthalate glycol composites. Text. Res. J. 2023, 93, 1005–1018. [Google Scholar] [CrossRef]
- Ramírez-Revilla, S.; Camacho-Valencia, D.; Gonzales-Condori, E.G.; Márquez, G. Evaluation and comparison of the degradability and compressive and tensile properties of 3D printing polymeric materials: PLA, PETG, PC, and ASA. MRS Commun. 2023, 13, 55–62. [Google Scholar] [CrossRef]
- Dhakal, H.; Zhang, Z.; Guthrie, R.; MacMullen, J.; Bennett, N. Development of flax/carbon fibre hybrid composites for enhanced properties. Carbohydr. Polym. 2013, 96, 1–8. [Google Scholar] [CrossRef] [PubMed]
- Pérez, M.; Medina-Sánchez, G.; García-Collado, A.; Gupta, M.; Carou, D. Surface quality enhancement of fused deposition modeling (FDM) printed samples based on the selection of critical printing parameters. Materials 2018, 11, 1382. [Google Scholar] [CrossRef] [PubMed]
- Hussnain, S.; Shah, S.; Megat-Yusoff, P.; Hussain, M. Degradation and mechanical performance of fibre-reinforced polymer composites under marine environments: A review of recent advancements. Polym. Degrad. Stab. 2023, 215, 110452. [Google Scholar] [CrossRef]
- Bellini, A.; Güçeri, S. Mechanical characterization of parts fabricated using fused deposition modeling. Rapid Prototyp. J. 2003, 9, 252–264. [Google Scholar] [CrossRef]
- Tao, Y.; Kong, F.; Li, Z.; Zhang, J.; Zhao, X.; Yin, Q.; Xing, D.; Li, P. A review on voids of 3D printed parts by fused filament fabrication. J. Mater. Res. Technol. 2021, 15, 4860–4879. [Google Scholar] [CrossRef]
- Kumar, M.; Ramakrishnan, R.; Omarbekova, A. 3D printed polycarbonate reinforced acrylonitrile–butadiene–styrene composites: Composition effects on mechanical properties, micro-structure and void formation study. J. Mech. Sci. Technol. 2019, 33, 5219–5226. [Google Scholar] [CrossRef]
- Tao, Y.; Pan, L.; Liu, D.; Li, P. A case study: Mechanical modeling optimization of cellular structure fabricated using wood flour-filled polylactic acid composites with fused deposition modeling. Compos. Struct. 2019, 216, 360–365. [Google Scholar] [CrossRef]
- Goh, G.D.; Dikshit, V.; Nagalingam, A.P.; Goh, G.L.; Agarwala, S.; Sing, S.L.; Wei, J.; Yeong, W.Y. Characterization of mechanical properties and fracture mode of additively manufactured carbon fiber and glass fiber reinforced thermoplastics. Mater. Des. 2018, 137, 79–89. [Google Scholar] [CrossRef]
- Fichera, M.; Carlsson, L.A. Moisture transport in unidirectional carbon/vinylester panels with imperfect fiber/matrix interface. J. Compos. Mater. 2016, 50, 751–760. [Google Scholar] [CrossRef]
- Seppala, J.E.; Han, S.H.; Hillgartner, K.E.; Davis, C.S.; Migler, K.B. Weld formation during material extrusion additive manufacturing. Soft Matter 2017, 13, 6761–6769. [Google Scholar] [CrossRef] [PubMed]
- Tekinalp, H.L.; Kunc, V.; Velez-Garcia, G.M.; Duty, C.E.; Love, L.J.; Naskar, A.K.; Blue, C.A.; Ozcan, S. Highly oriented carbon fiber–polymer composites via additive manufacturing. Compos. Sci. Technol. 2014, 105, 144–150. [Google Scholar] [CrossRef]
- Sommacal, S.; Matschinski, A.; Drechsler, K.; Compston, P. Characterisation of void and fiber distribution in 3D printed carbon-fiber/PEEK using X-ray computed tomography. Compos. Part A Appl. Sci. Manuf. 2021, 149, 106487. [Google Scholar] [CrossRef]
- Thomason, J.; Xypolias, G. Hydrothermal Ageing of Glass Fibre Reinforced Vinyl Ester Composites: A Review. Polymers 2023, 15, 835. [Google Scholar] [CrossRef]
- Thomason, J.L. The interface region in glass fibre-reinforced epoxy resin composites: 2. Water absorption, voids and the interface. Composites 1995, 26, 477–485. [Google Scholar] [CrossRef]
- Ayanoglu, M.O.; Carlsson, L.A.; Du, E. Effects of void content on the moisture uptake and mechanical strength of a glass/epoxy composite. J. Compos. Mater. 2023, 57, 325–336. [Google Scholar] [CrossRef]
- Caggiano, A.; Schicchi, D.S.; Mankel, C.; Ukrainczyk, N.; Koenders, E.A. A mesoscale approach for modeling capillary water absorption and transport phenomena in cementitious materials. Comput. Struct. 2018, 200, 1–10. [Google Scholar] [CrossRef]
- Galpayage Dona, K.N.U.; Du, E.; Carlsson, L.A.; Fletcher, D.M.; Boardman, R.P. Modeling of water wicking along fiber/matrix interface voids in unidirectional carbon/vinyl ester composites. Microfluid. Nanofluid. 2020, 24, 31. [Google Scholar] [CrossRef]
- Romero, P.E.; Barrios, J.M.; Molero, E.; Bustillo, A. Tuning 3D-printing parameters to produce vertical ultra-hydrophobic PETG parts with low ice adhesion: A food industry case study. Proc. Inst. Mech. Eng. Part B J. Eng. Manuf. 2023, 238, 750–758. [Google Scholar] [CrossRef]
- Barrios, J.M.; Romero, P.E. Improvement of Surface Roughness and Hydrophobicity in PETG Parts Manufactured via Fused Deposition Modeling (FDM): An Application in 3D Printed Self–Cleaning Parts. Materials 2019, 12, 2499. [Google Scholar] [CrossRef]
- RS PRO 2.85 mm Black CARBON-P 3D Printer Filament, 500g|RS. Available online: https://uk.rs-online.com/web/p/3d-printing-materials/9107043/ (accessed on 10 February 2023).
- Kim, D.-H.; Seo, H.-S. Role of the Wall Layer in 3D-Printed Composites under the Salt Spray Condition. J. Mar. Sci. Eng. 2023, 11, 1416. [Google Scholar] [CrossRef]
Figure 1.
Schematic of MEAM fibre-reinforced composite [17].
Figure 1.
Schematic of MEAM fibre-reinforced composite [17].

Figure 2.
Schematic of capillary of radius r with forces acting on it.

Figure 3.
Transversal cross-section of printed specimen.

Figure 4.
Sensitivity study for capillary radius and residual air: (a) flow in capillary for various radii and 60% of air left; (b) flow in capillary of 15 μm diameter with different air residuals; (c) flow velocity for various radii and 60% of air left; (d) flow velocity in capillary of 15 μm diameter for different air residuals.

Figure 5.
Evolution of forces in capillary flow with time (a) and distance along capillary from specimen edge (b).
Figure 5.
Evolution of forces in capillary flow with time (a) and distance along capillary from specimen edge (b).

Figure 6.
Schematic of FEA model: specimen of 1 mm × 0.1 mm × 100 mm with capillary of radius 0.03 mm penetrating entire model.
Figure 6.
Schematic of FEA model: specimen of 1 mm × 0.1 mm × 100 mm with capillary of radius 0.03 mm penetrating entire model.

Figure 7.
Boundary conditions of FEA simulations acquired from capillary model used in Case II, Phase 1 (the blue bars present the length of the capillary flow (in mm), with the respective letter at the bottom denoting the step in Table 4).
Figure 7.
Boundary conditions of FEA simulations acquired from capillary model used in Case II, Phase 1 (the blue bars present the length of the capillary flow (in mm), with the respective letter at the bottom denoting the step in Table 4).

Figure 8.
Sensitivity study of capillary boundary conditions.

Figure 9.
Water-uptake evolution in models with and without capillary.

Figure 10.
Average water concentration in elements between specimen edge and specific distance along capillary length L.
Figure 10.
Average water concentration in elements between specimen edge and specific distance along capillary length L.

Figure 11.
Spatial evolution of water-uptake process.

Figure 12.
Water concentration distribution at 0.5 L from edge after 0.3 s.


Table 1.
Parameters of numerical simulation.
| Property | Value |
|---|---|
| Surface tension of still water | 0.07275 N/m |
| Contact angle of PETG | 54° * |
| Density of still water | 1000 kg/m3 |
| Gravitational acceleration | 9.81 m/s2 |
| Initial pressure in the capillary | 1.013 × 10⁵ Pa |
| Viscosity of water | 1.0016 × 10⁻⁶ Pa⋅s |
* From [25].
Table 2.
Water diffusion coefficient of PETG matrix.
| Ageing Temperature (°C) | Diffusivity (μm2/ms) | Maximum Water Uptake (%) |
|---|---|---|
| 25 | 0.55 |
Table 3.
Size and number of time increments in each phase.
| Case | Phase 1 | Phase 2 | Phase 3 | Total Time/ms | |||
|---|---|---|---|---|---|---|---|
| Size/ ms | Number | Size/ ms | Number | Size/ ms | Number | ||
| I | 10 | 25 | 50 | 195 | 104 | ||
| II | 1 | 250 | 50 | 195 | 104 | ||
| III | 105 | 600 | 6 × 10⁷ | ||||
| IV | 10 | 25 | 50 | 195 | 105 | 600 | 6.001 × 10⁷ |
Table 4.
Discrete boundary and step condition in capillary in Case II, Phase 1.
| Step Number | Capillary Flow Length/mm | Step Time/ms |
|---|---|---|
| A | 0–5 | 3.1 |
| B | 5–10 | 12.5 |
| C | 10–15 | 32.5 |
| D | 15–17.4 | 50 |
| E | 17.4–20 | 80.6 |
| F | 20–20.9 | 100 |
| G | 20.9–22.3 | 150 |
| H | 22.3–23.0 | 250 |
Disclaimer/Publisher’s Note: The statements, opinions and data contained in all publications are solely those of the individual author(s) and contributor(s) and not of MDPI and/or the editor(s). MDPI and/or the editor(s) disclaim responsibility for any injury to people or property resulting from any ideas, methods, instructions or products referred to in the content. |
© 2024 by the authors. Licensee MDPI, Basel, Switzerland. This article is an open access article distributed under the terms and conditions of the Creative Commons Attribution (CC BY) license (https://creativecommons.org/licenses/by/4.0/).
Share and Cite
MDPI and ACS Style
Li, B.; Baxevanakis, K.P.; Silberschmidt, V.V. Water Diffusion in Additively Manufactured Polymers: Analysis of the Capillary Effect. Micro 2024, 4, 281-294. https://0-doi-org.brum.beds.ac.uk/10.3390/micro4020017
AMA Style
Li B, Baxevanakis KP, Silberschmidt VV. Water Diffusion in Additively Manufactured Polymers: Analysis of the Capillary Effect. Micro. 2024; 4(2):281-294. https://0-doi-org.brum.beds.ac.uk/10.3390/micro4020017
Chicago/Turabian StyleLi, Boyu, Konstantinos P. Baxevanakis, and Vadim V. Silberschmidt. 2024. "Water Diffusion in Additively Manufactured Polymers: Analysis of the Capillary Effect" Micro 4, no. 2: 281-294. https://0-doi-org.brum.beds.ac.uk/10.3390/micro4020017