

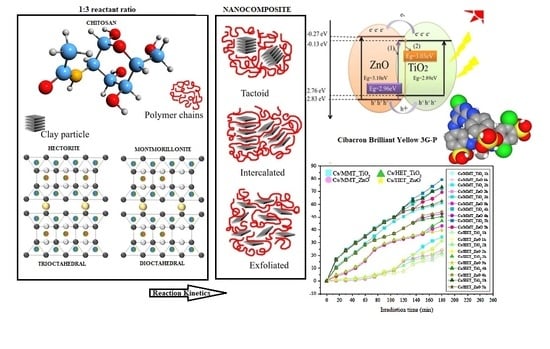
Establishing the Link across the Synthesis Reaction Kinetics, Structural Changes, and Photocatalytic Efficiency of an Enhanced Chitosan–Clay (1:3) Nanocomposite

Abstract
:
1. Introduction
2. Materials and Methods
2.1. Starting Reagents: Formula and Composition
2.1.1. Nanofillers
2.1.2. Chitosan (Cs)

2.2. Experimental Synthesis Process
2.3. Controlling Reaction Kinetics for Enhanced Nanocomposite Synthesis
2.4. Characterization Techniques
2.4.1. X-ray Diffraction Analysis (XRD)
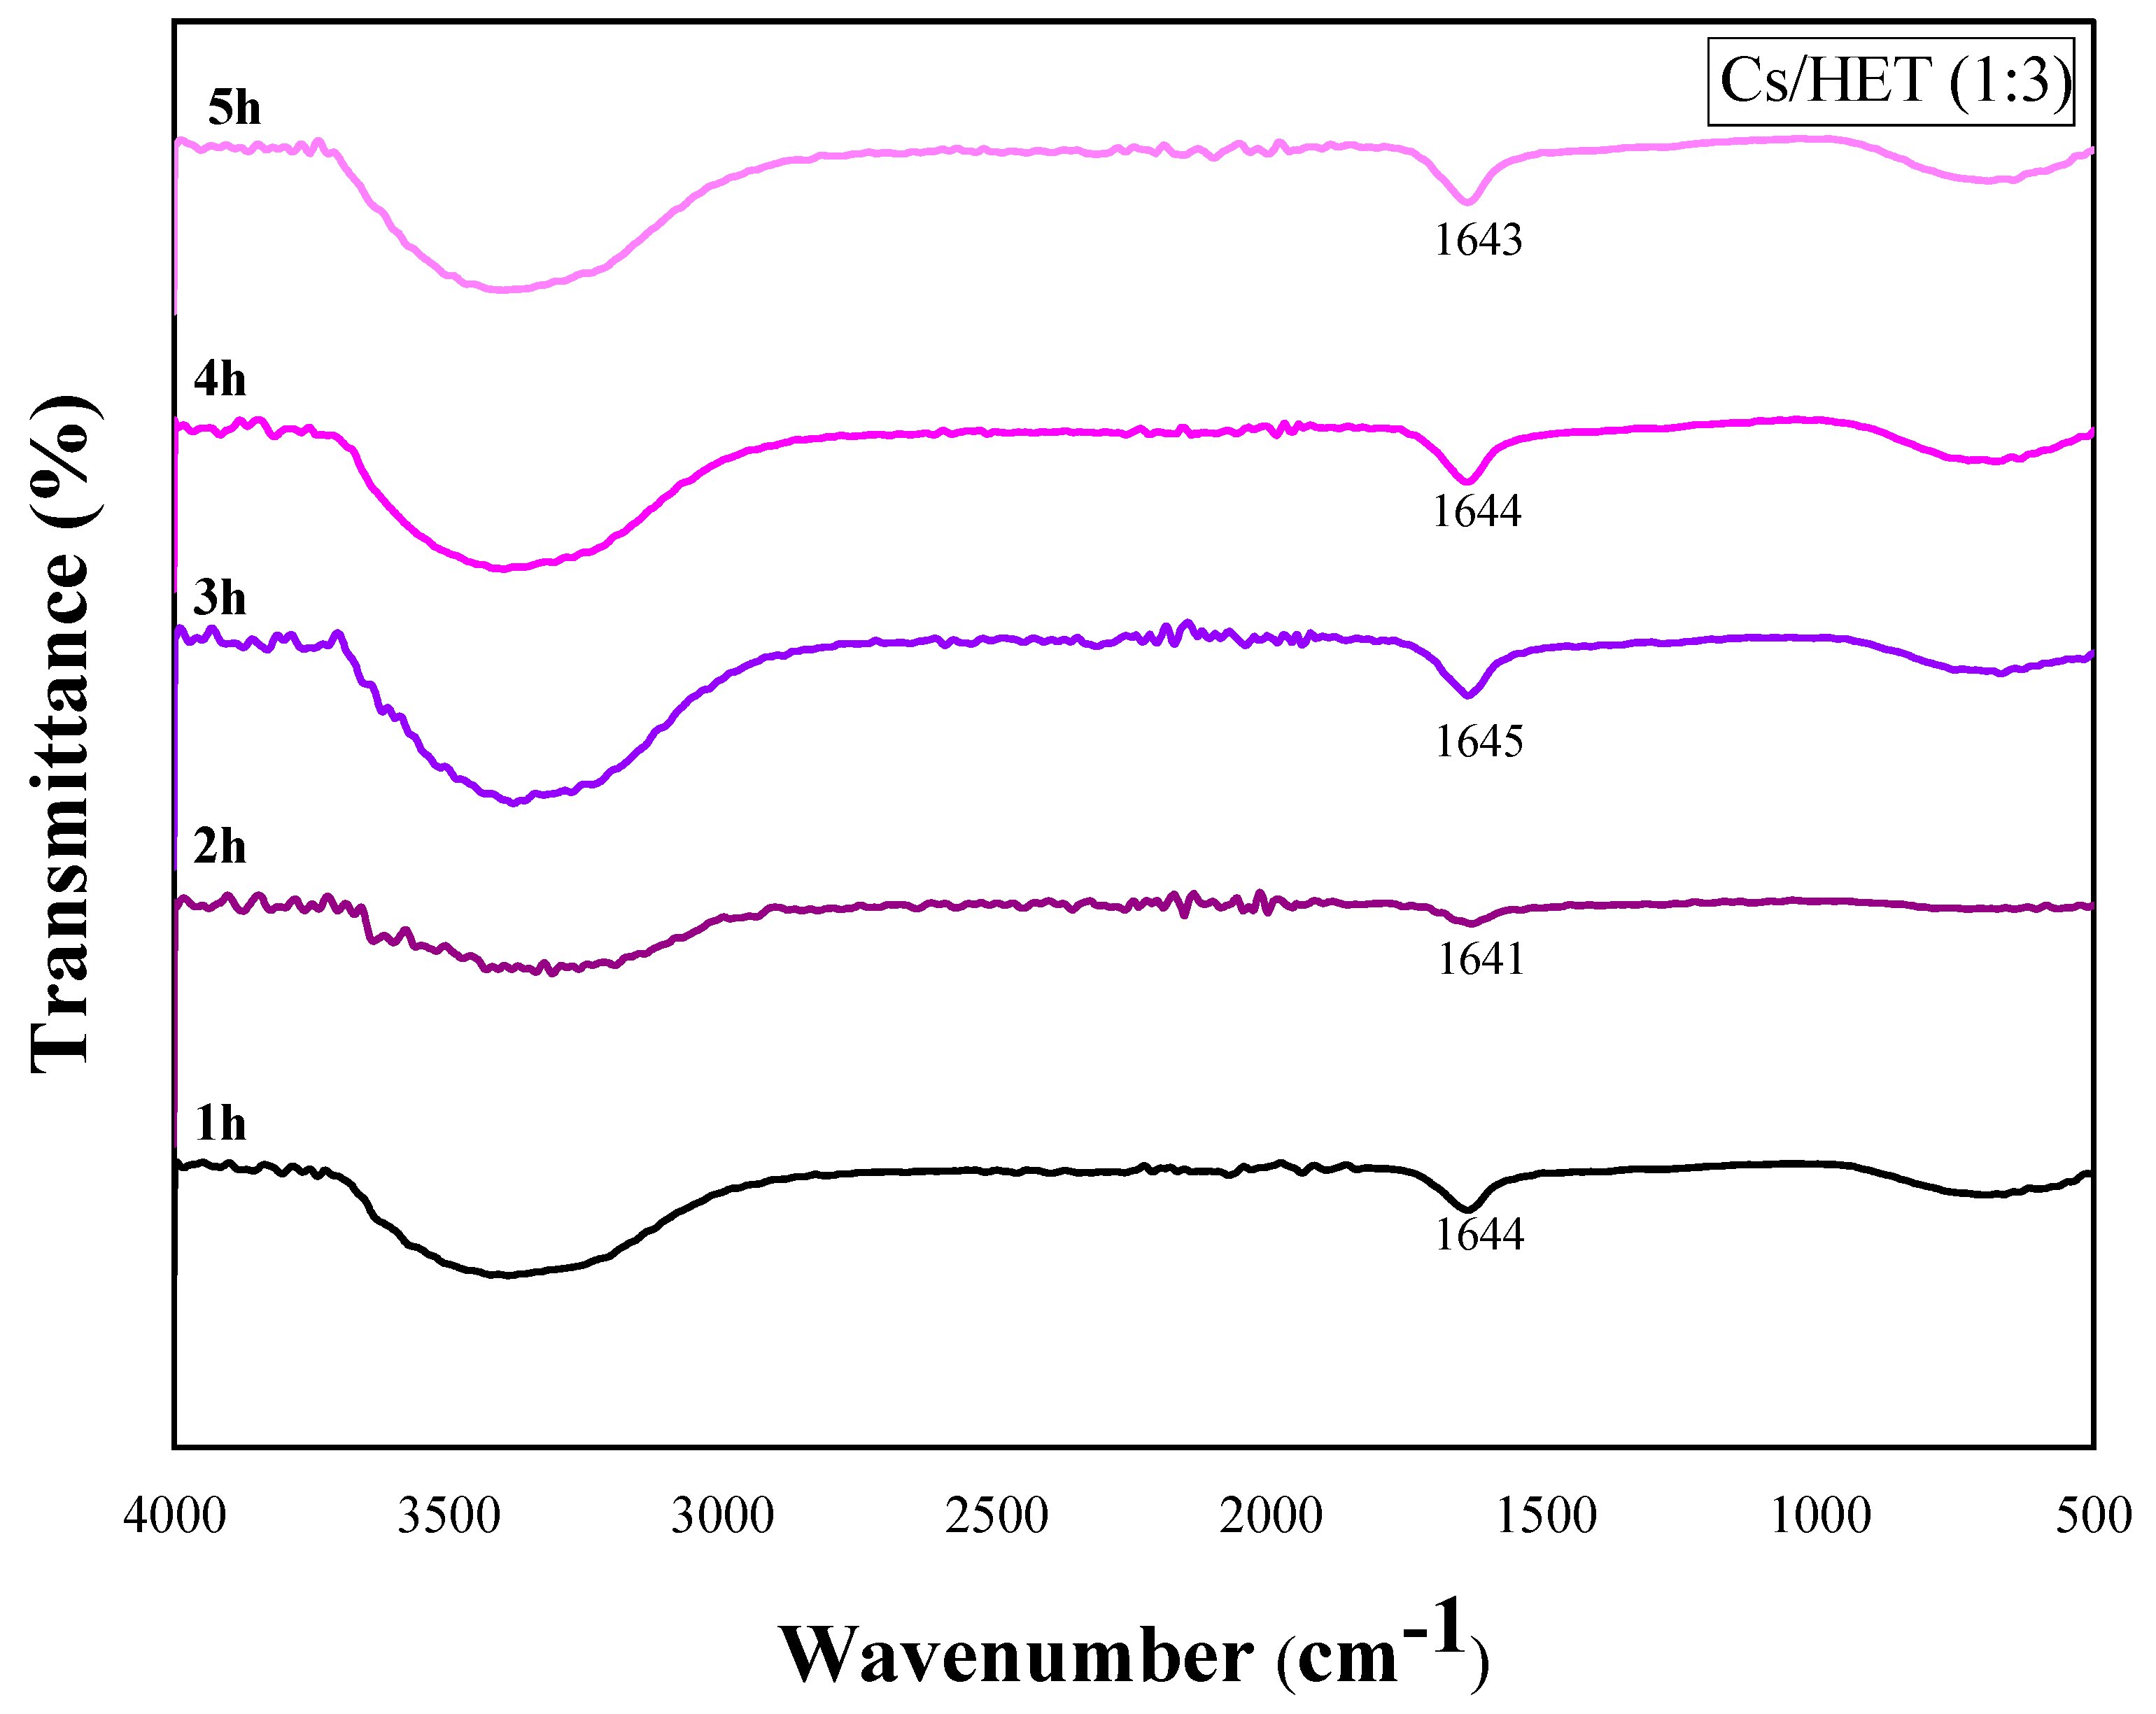
2.4.2. Fourier Transform Infrared Spectroscopy (FTIR)
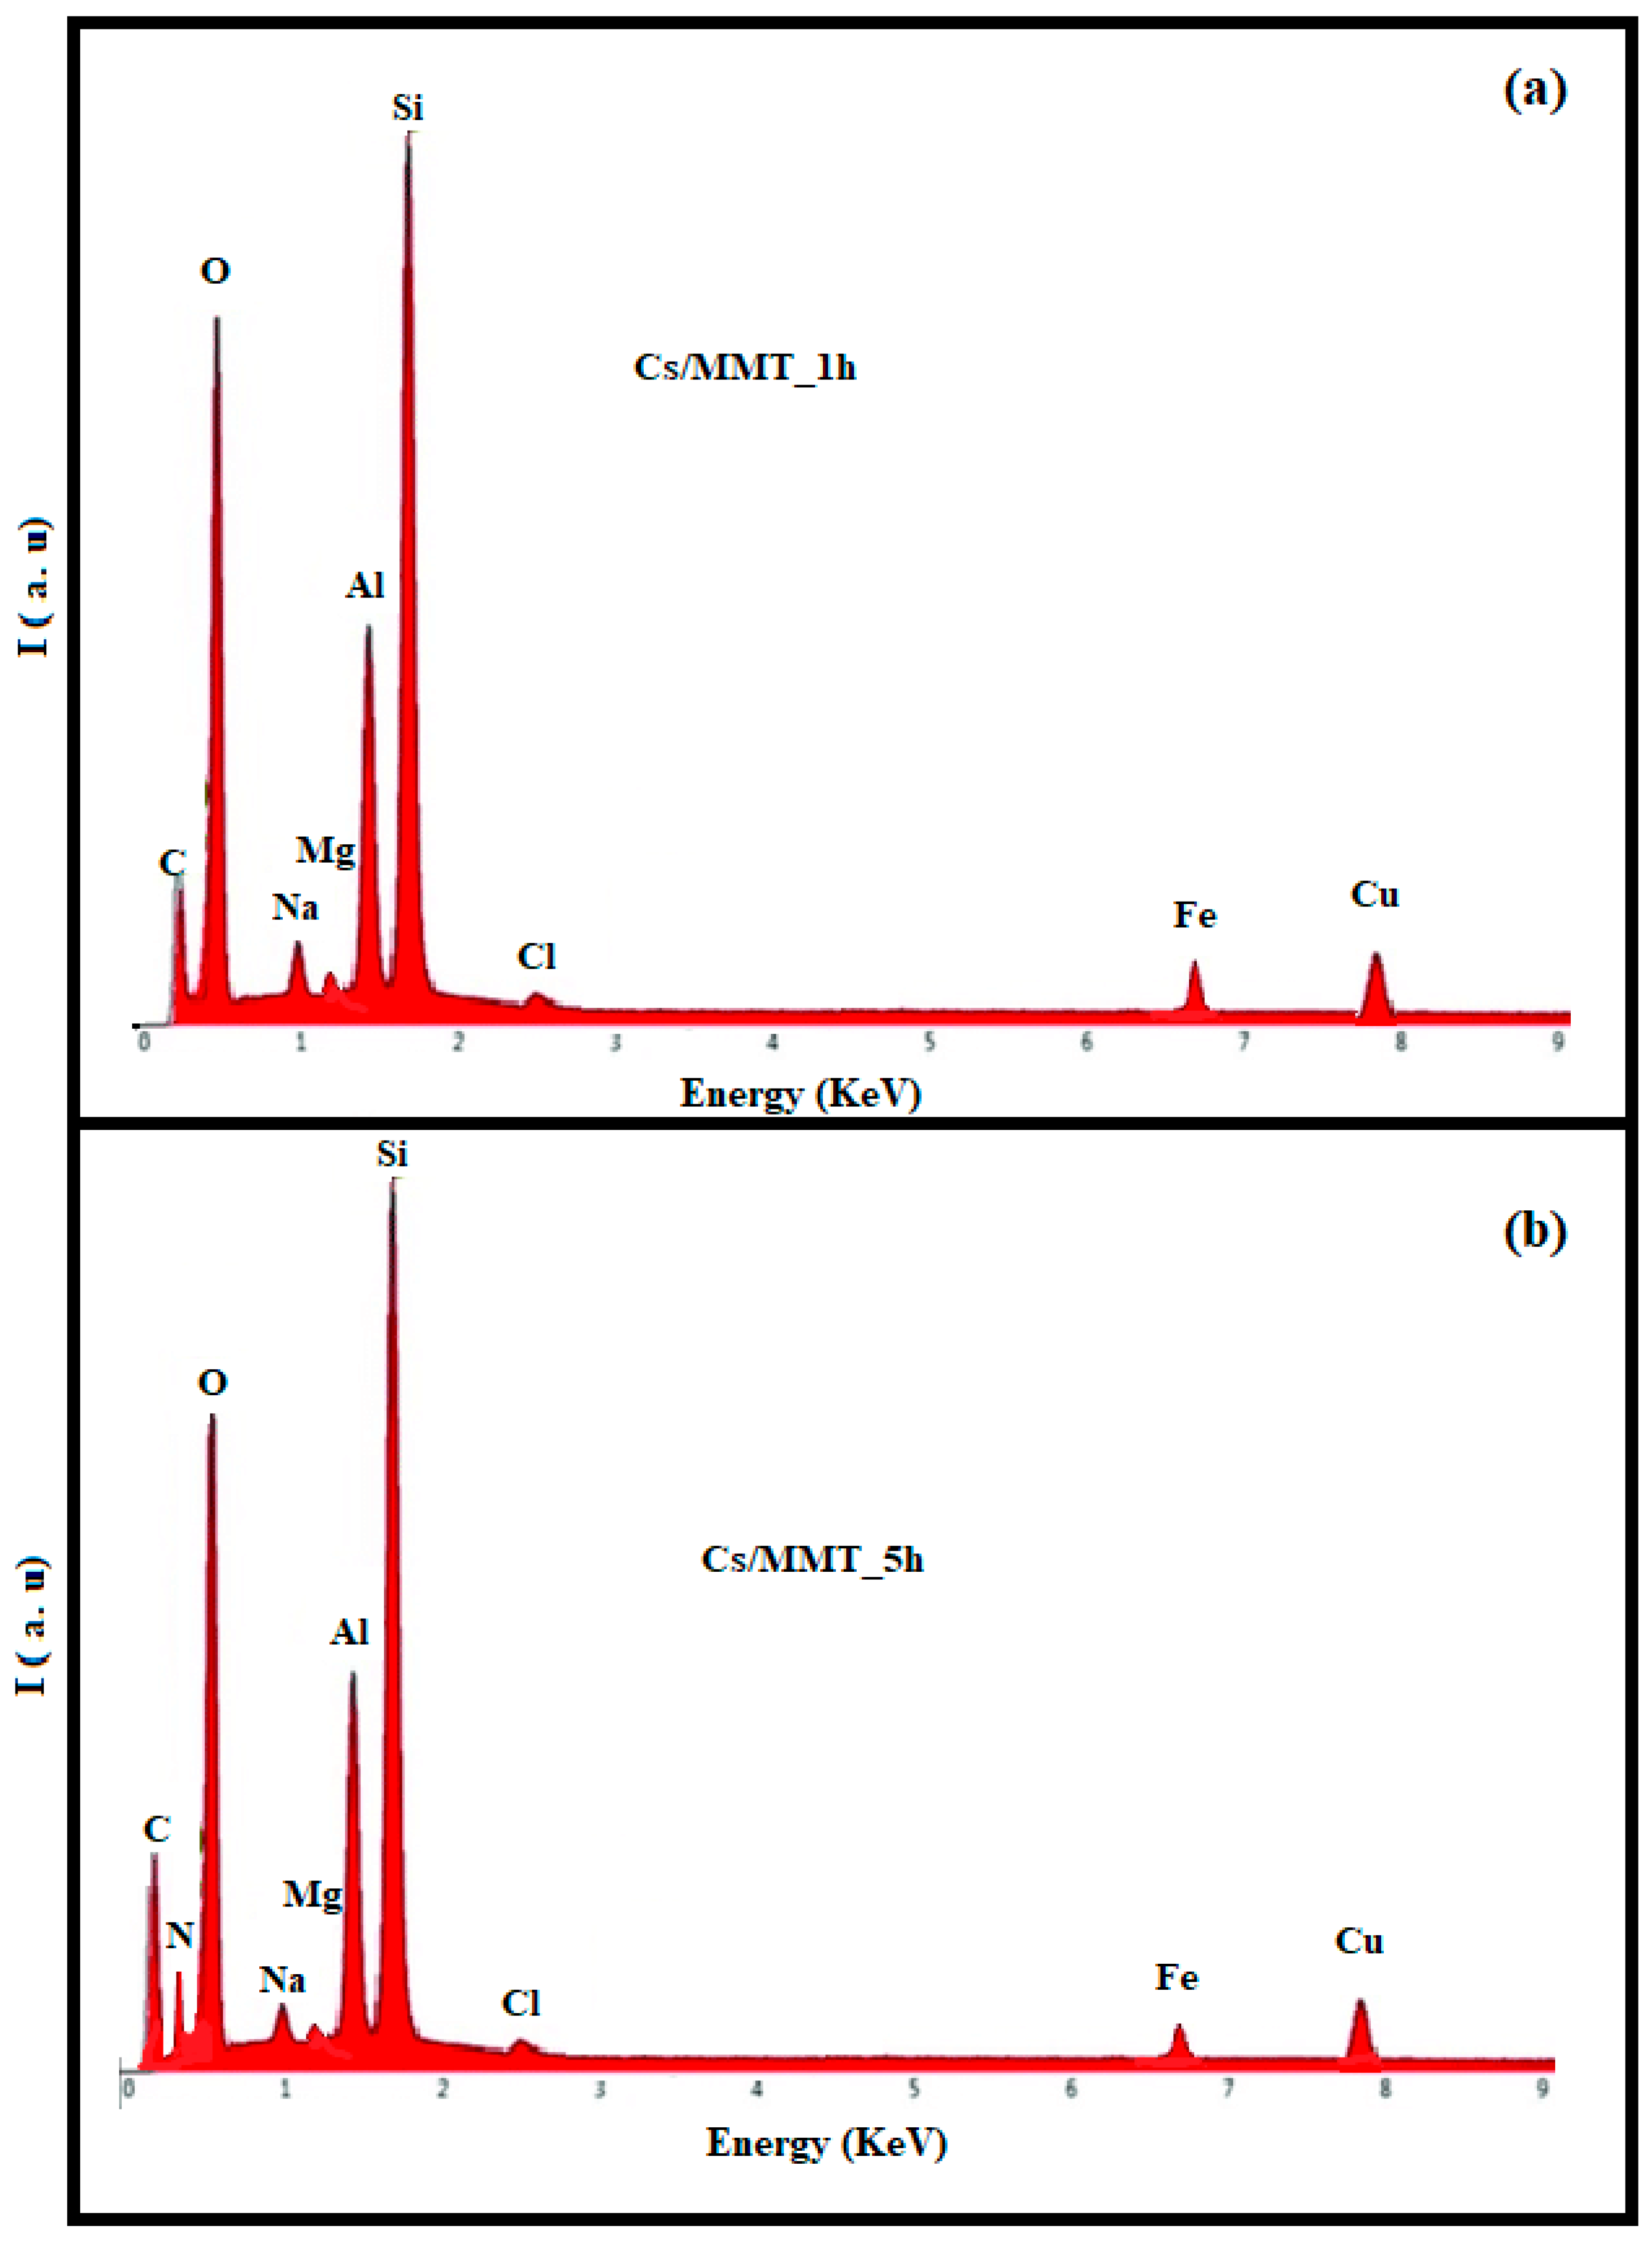
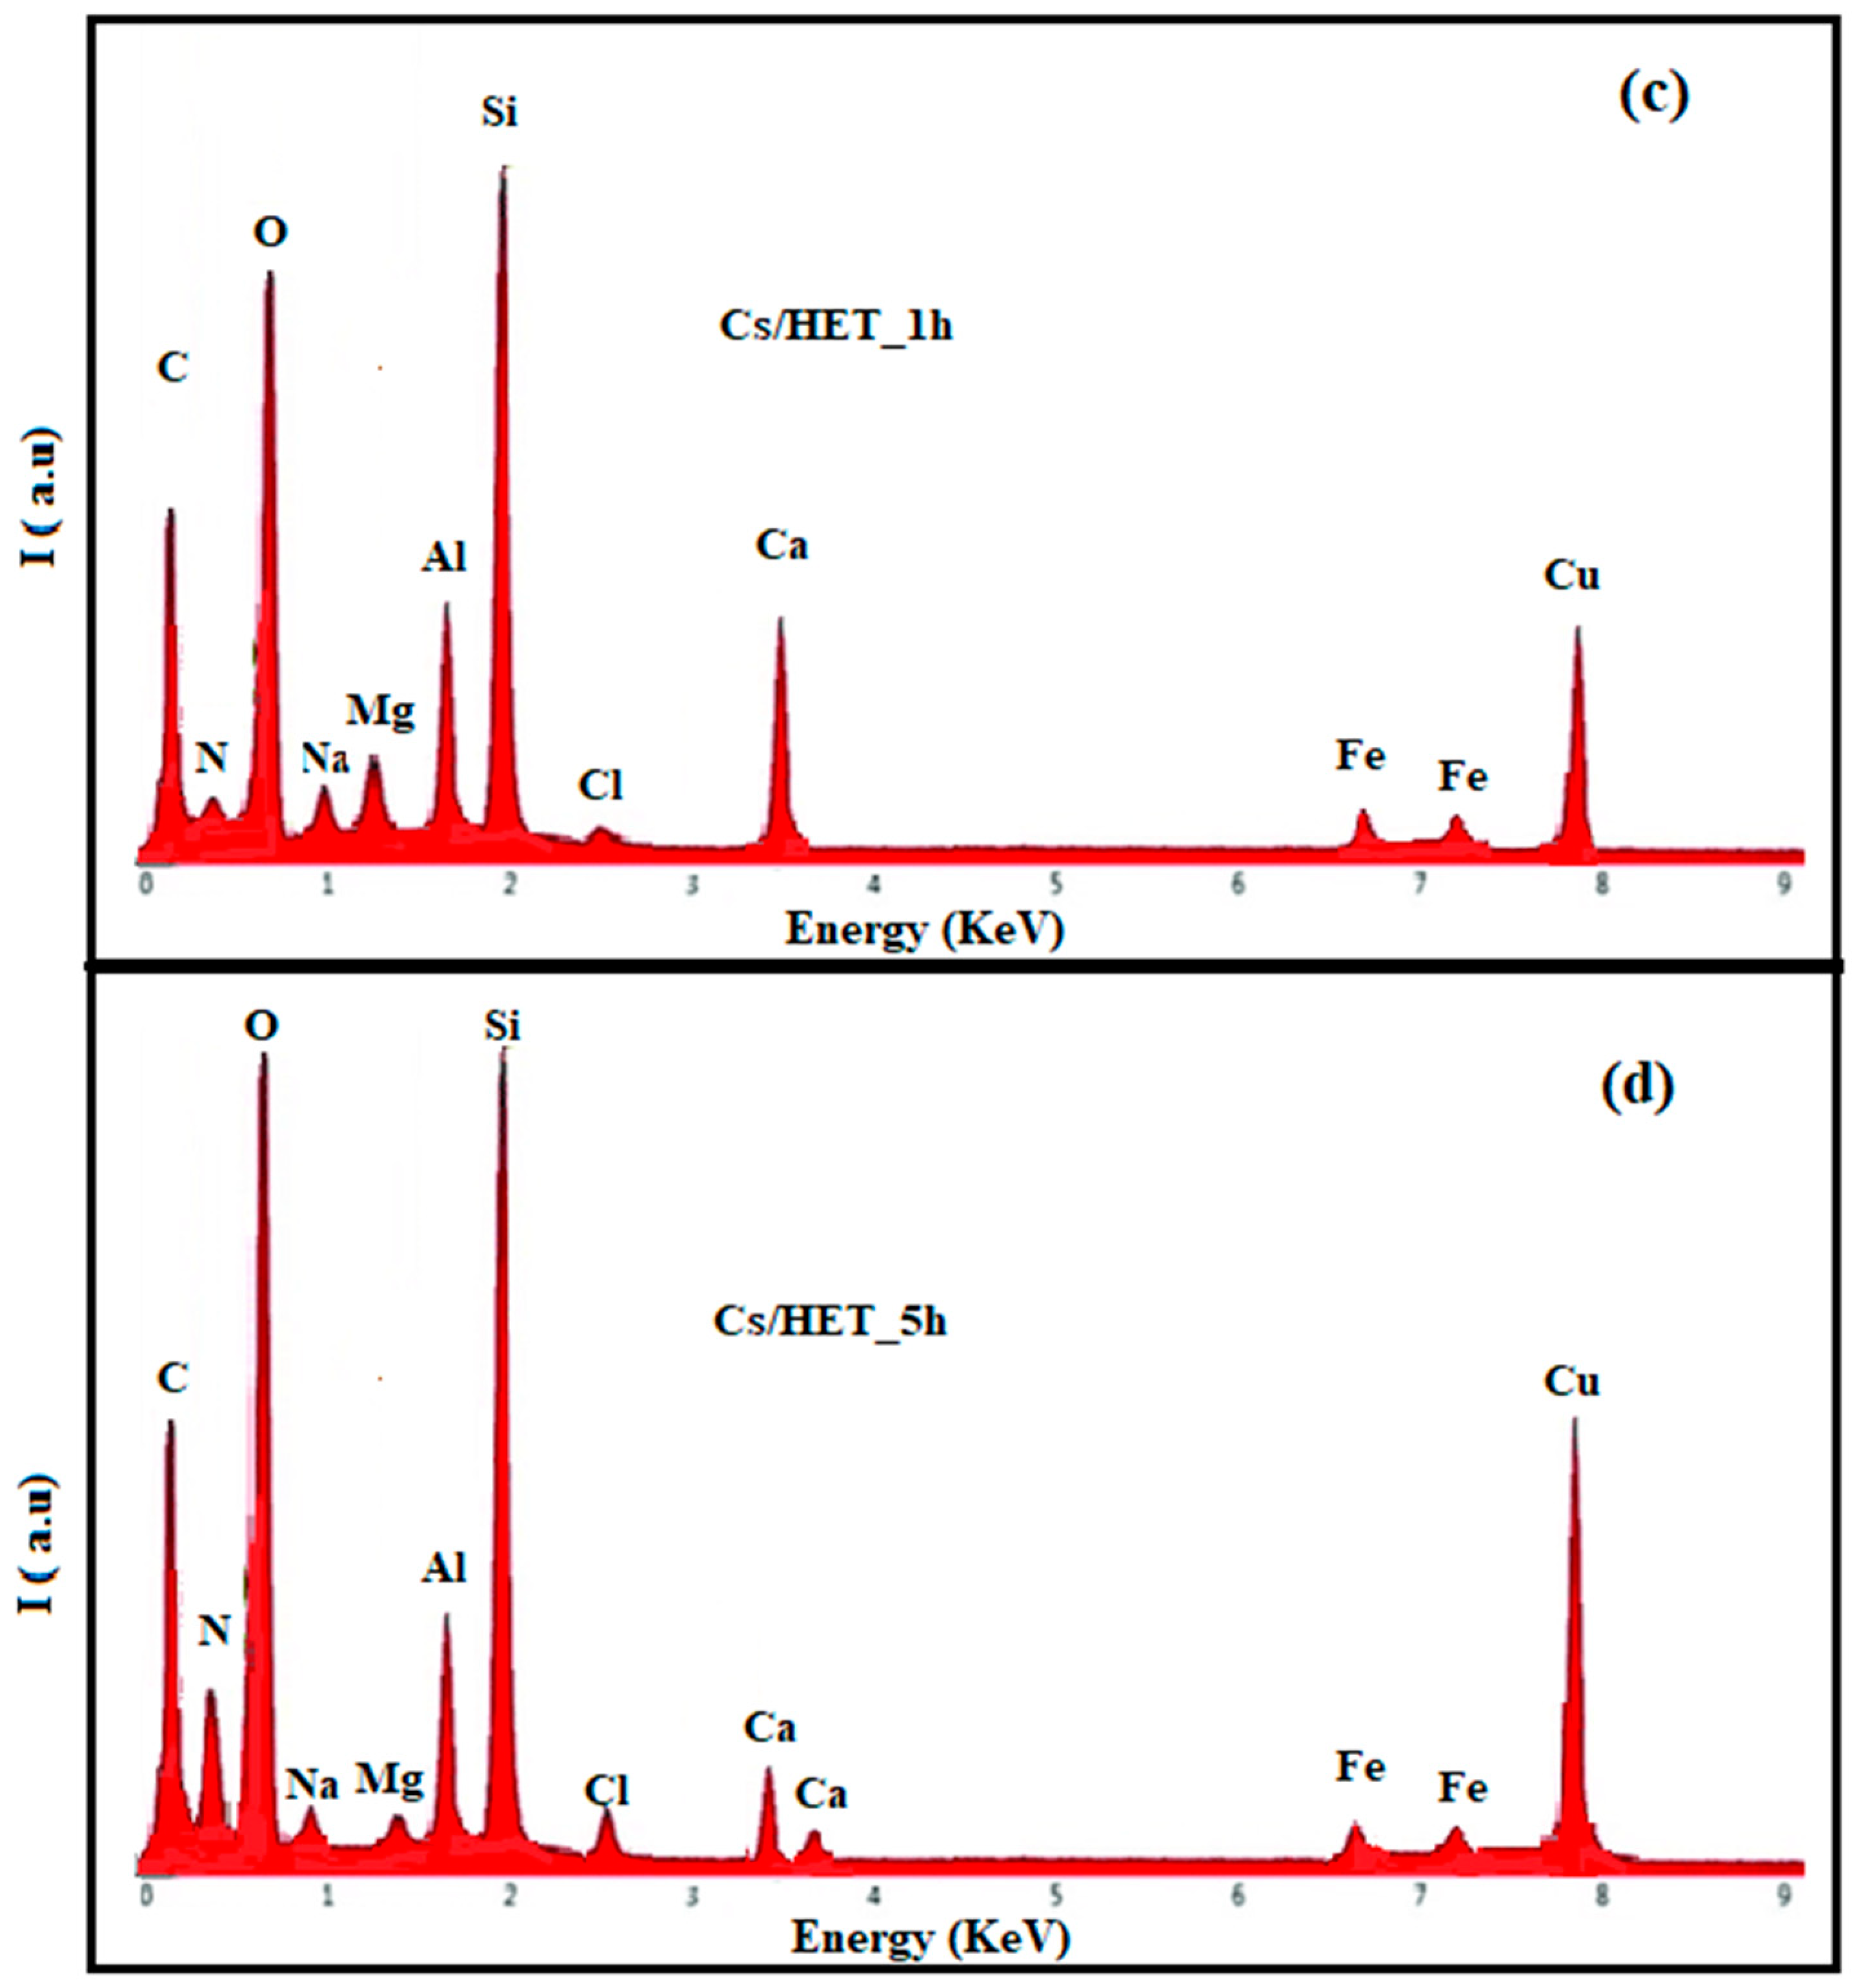
2.4.3. TEM Scanning and Energy-Dispersive X-ray Spectroscopy (EDX)
2.4.4. UV-Visible Spectroscopy
2.4.5. Photocatalytic Application
3. Results
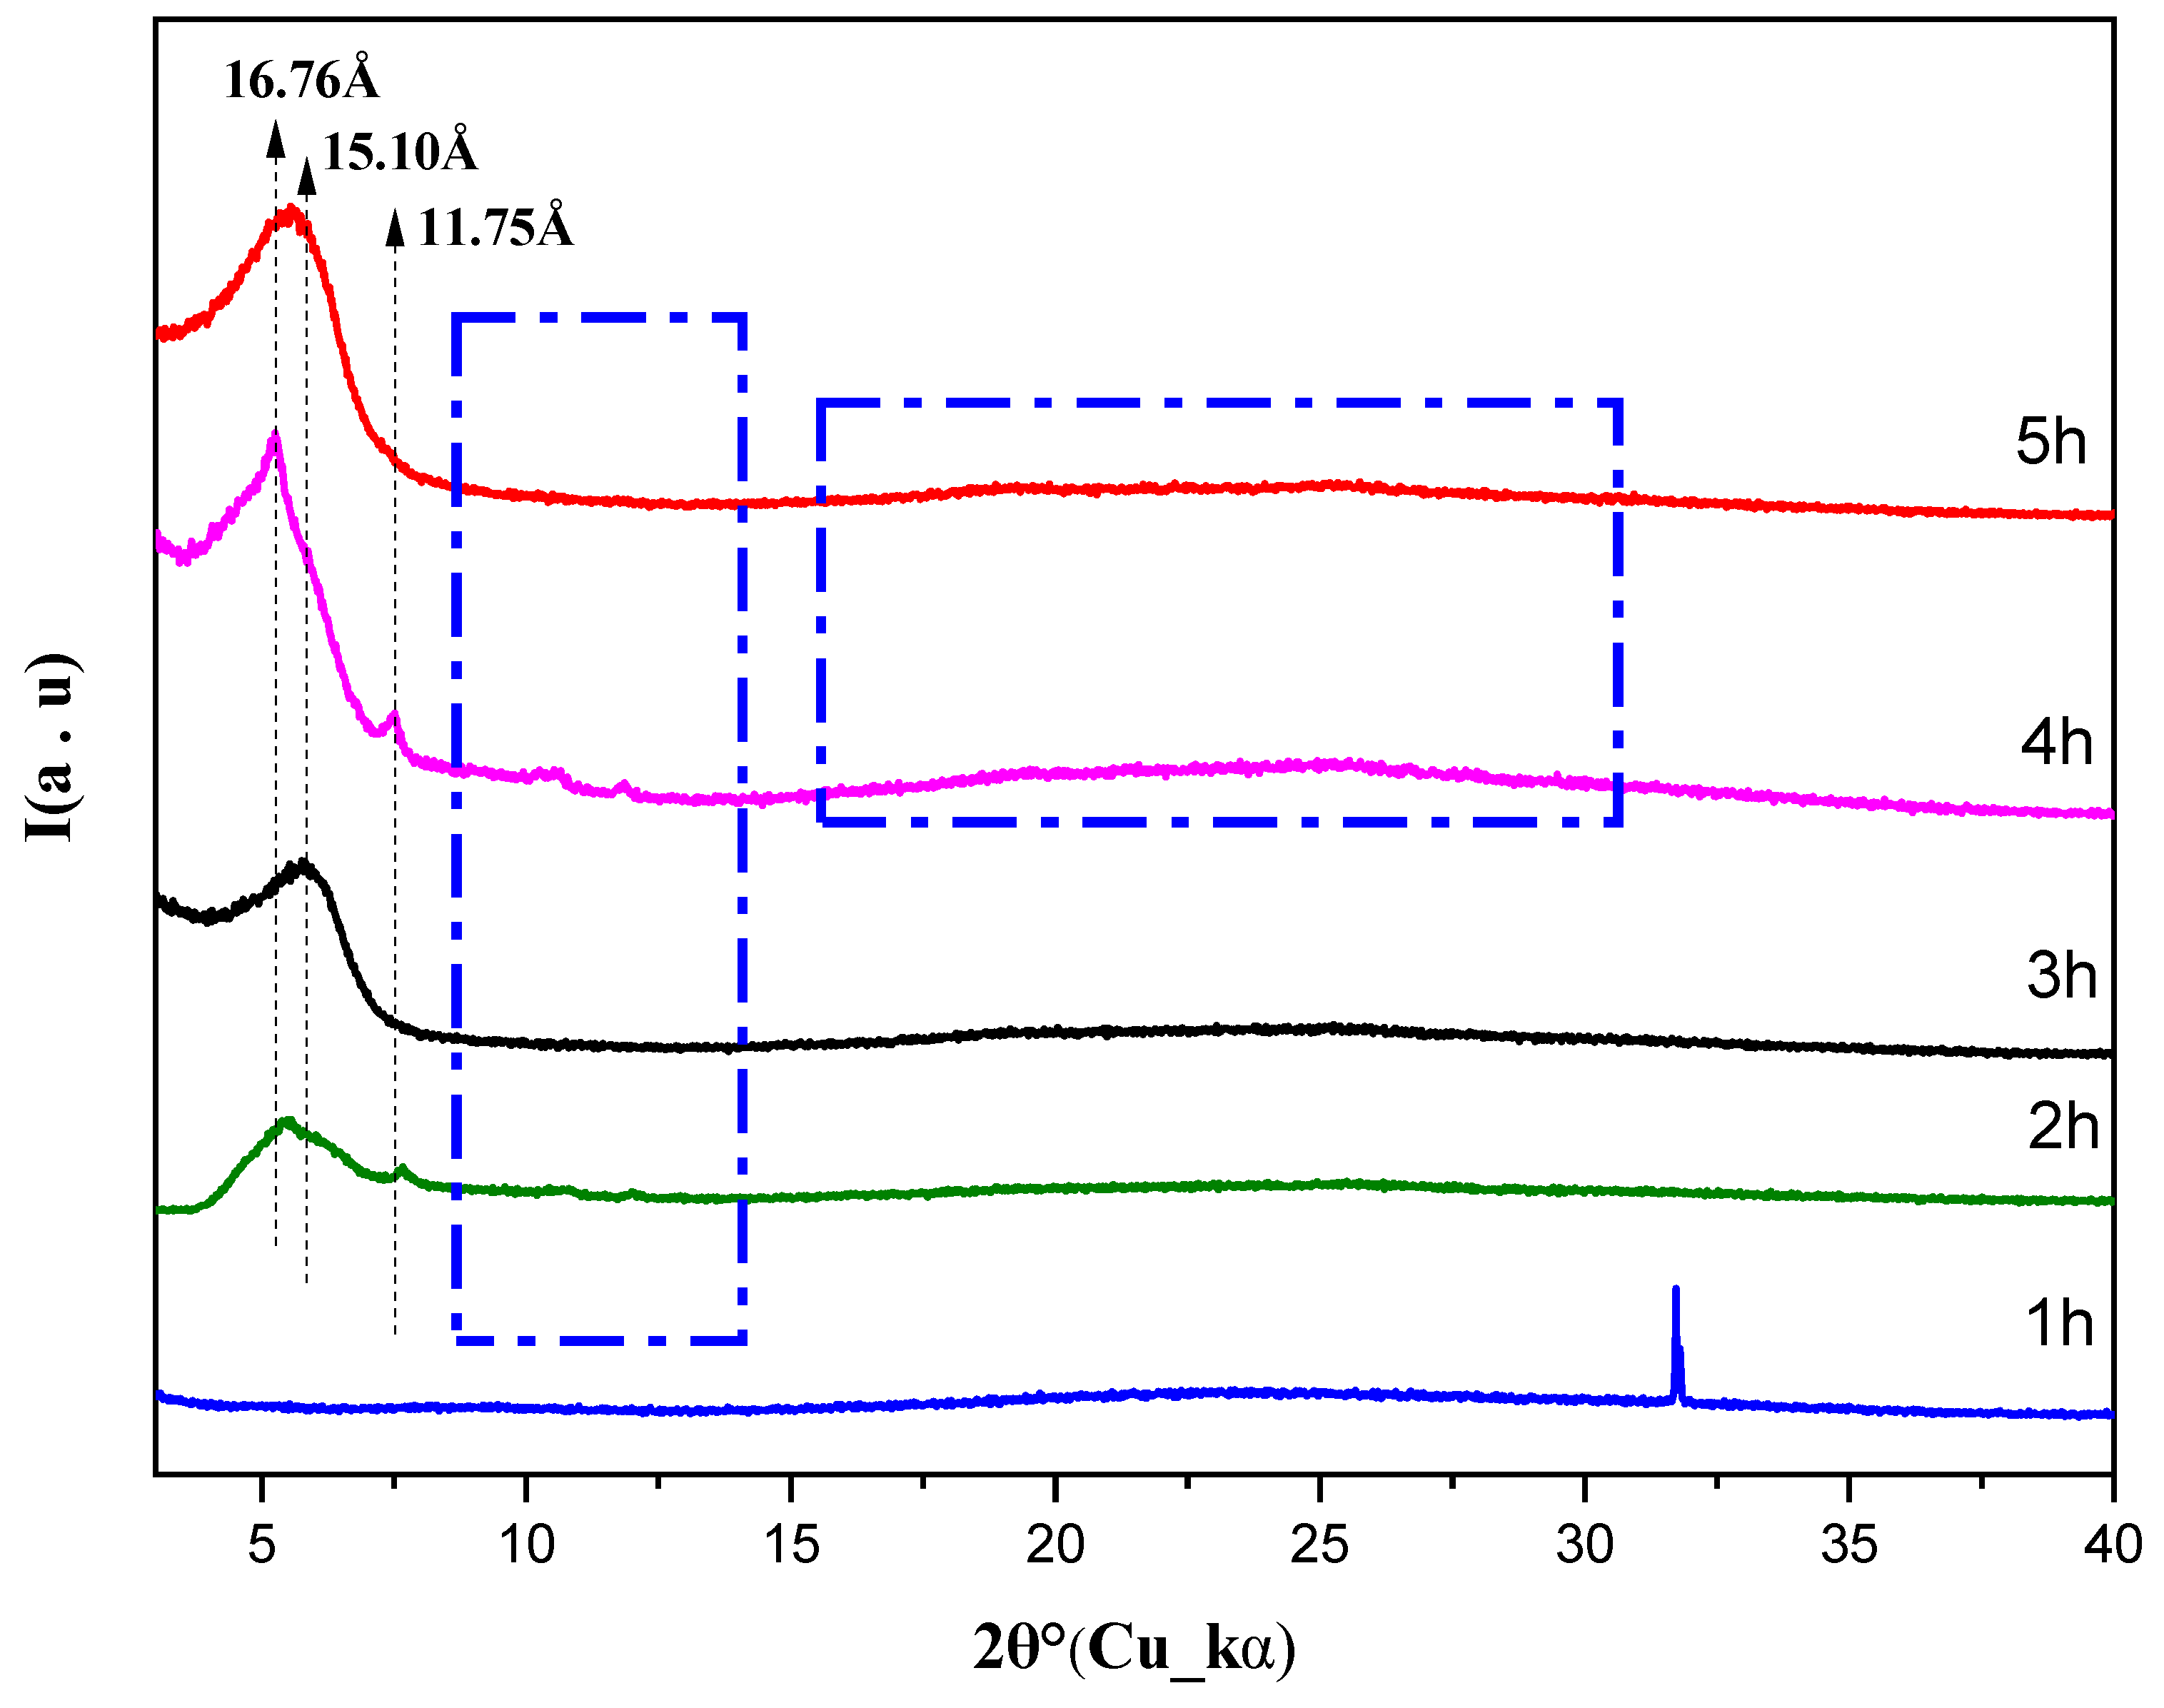
3.1. XRD Analysis
XRD Study of the Structural Evolution of the Cs/MMT and Cs/HET Samples (1:3)
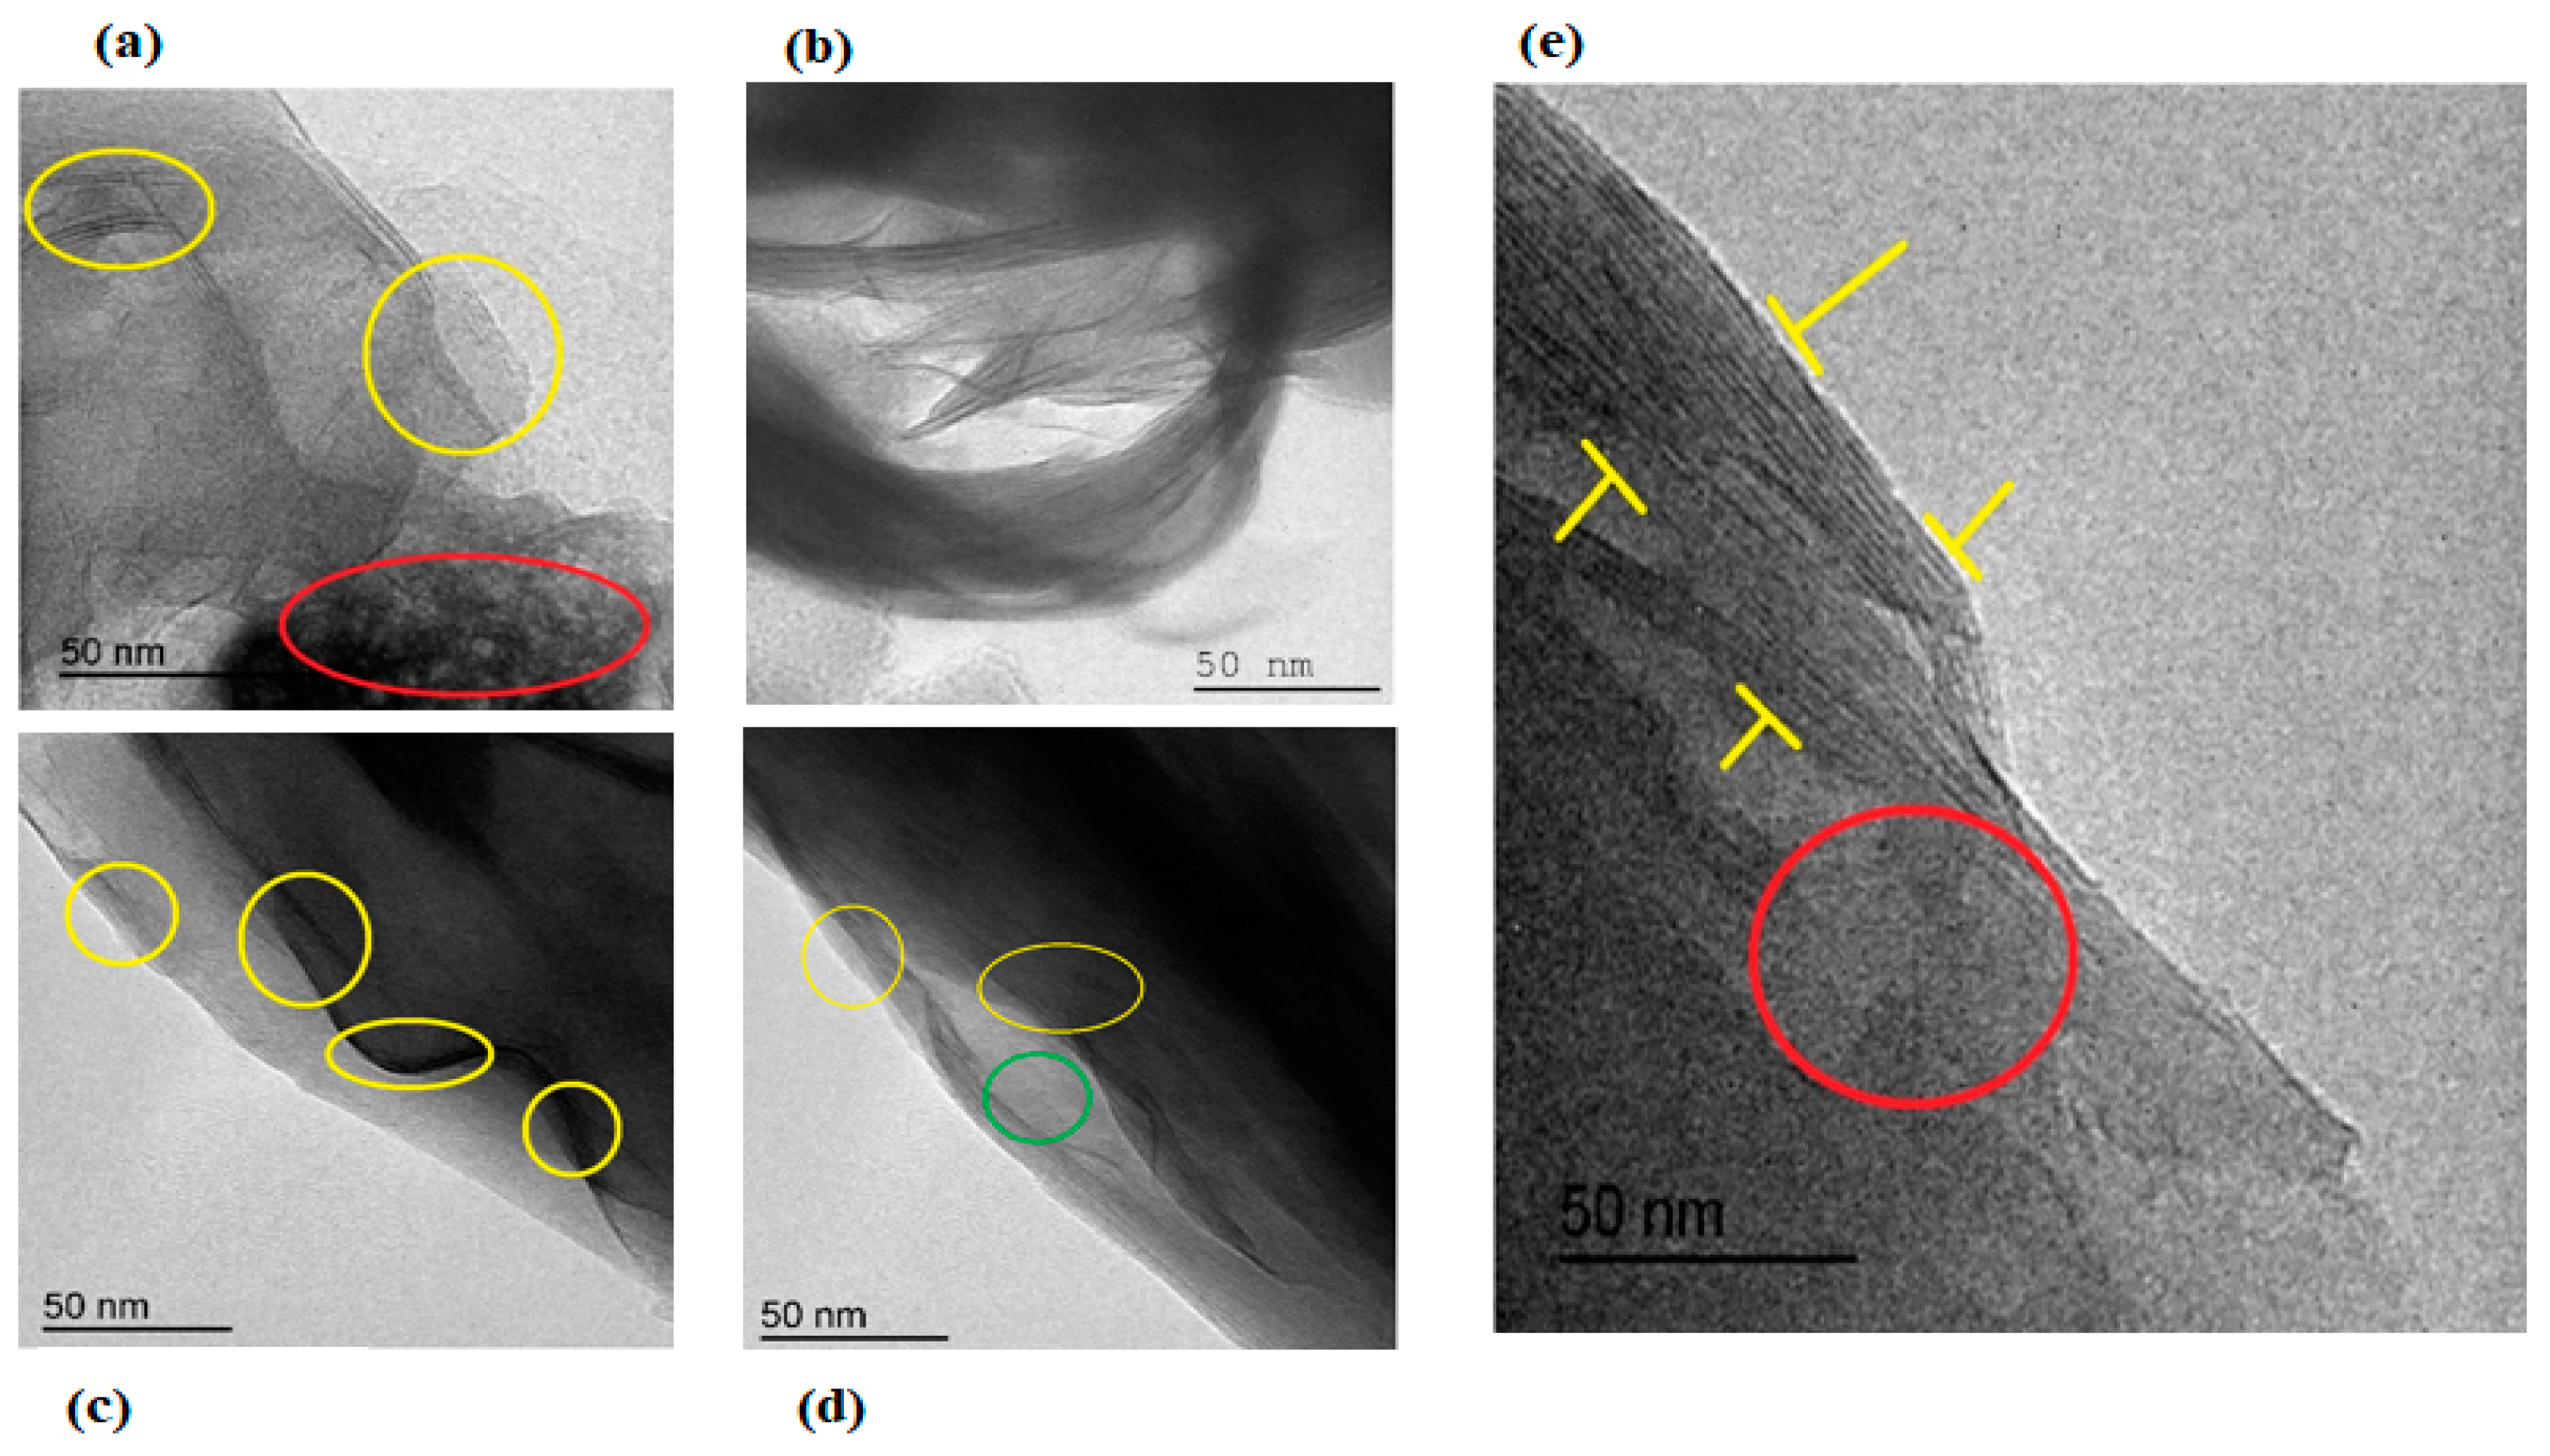
3.2. Microstructural Study Using TEM and FTIR
3.2.1. TEM Study of the Cs/MMT (1:3) and Cs/HET (1:3) Samples
3.2.2. Characterization through FTIR of the Effect of Kinetics Reaction
Case of the Cs/MMT (1:3) and Cs/HET (1:3) Sample
3.3. Photocatalytic Activity
3.3.1. Effect of Reaction Kinetics on Dye Degradation
Cs/MMT Sample
Cs/HET Sample
3.3.2. Photocatalytic Efficiency and Catalyst Type
3.3.3. Relationship between Photocatalytic Performance and Octahedral Cavity Occupation of the Starting Clay Fraction
4. Discussion
4.1. Utilizing Reaction Kinetics Assessment Tools to Optimize Nanocomposite Efficiency
4.2. Synchronized Influence of Clay Nature, Octahedral Cavity Occupancy, Initial Stoichiometry, Metal Oxide Type, and Polymer Concentration on Photocatalytic Efficiency in Nanocomposites
5. Conclusions
Supplementary Materials
Author Contributions
Funding
Data Availability Statement
Acknowledgments
Conflicts of Interest
References
- Fatimah, I.; Wang, S.; Wulandari, D. ZnO/montmorillonite for photocatalytic and photochemical degradation of methylene blue. Appl. Clay Sci. 2011, 53, 553–560. [Google Scholar] [CrossRef]
- Bahnemann, D. Photocatalytic water treatment: Solar energy applications. Sol. Energy 2004, 77, 445–459. [Google Scholar] [CrossRef]
- Comninellis, C.; Kapalka, A.; Malato, S.; Parsons, S.A.; Poulios, I.; Mantzavinos, D. Advanced oxidation processes for water treatment: Advances and trends for R&D. J. Chem. Technol. Biotechnol. 2008, 83, 769–776. [Google Scholar] [CrossRef]
- Goswami, D.; Vijayaraghavan, S.; Lu, S.; Tamm, G. New and emerging developments in solar energy. Sol. Energy 2004, 76, 33–43. [Google Scholar] [CrossRef]
- Das, N.C.; Rahman, M.M.; Kabir, S.F. Preparation of novel clay/chitosan/ZnO bio-composite as an efficient adsorbent for tannery wastewater treatment. Int. J. Biol. Macromol. 2023, 249, 126136. [Google Scholar] [CrossRef]
- Gupta, V.K.; Saravanan, R.; Agarwal, S.; Gracia, F.; Khan, M.M.; Qin, J.; Mangalaraja, R.V. Degradation of azo dyes under different wavelengths of UV light with chitosan-SnO2 nanocomposites. J. Mol. Liquids 2017, 232, 423–430. [Google Scholar] [CrossRef]
- Pomogailo, A.D.; Kestelman, V.N. Chemical methods of metal-polymer nanocomposite production. In Metallopolymer Nanocomposites; Springer: Berlin, Heidelberg, 2005; pp. 135–236. [Google Scholar] [CrossRef]
- Aadnan, I.; Zegaoui, O.; Daou, I.; da Silva, J.C.E. Synthesis and physicochemical characterization of a ZnO-Chitosan hybrid-biocomposite used as an environmentally friendly photocatalyst under UV-A and visible light irradiations. J. Environ. Chem. Eng. 2020, 8, 104260. [Google Scholar] [CrossRef]
- Ibhadon, A.O.; Fitzpatrick, P. Heterogeneous Photocatalysis: Recent Advances and Applications. Catalysts 2013, 3, 189–218. [Google Scholar] [CrossRef]
- Li, H.; Wang, X.; Li, X.; Zhao, C.; Song, X.; Zhang, P.; Huo, P. A review on heterogeneous photocatalysis for environmental remediation: From semiconductors to modification strategies. Chin. J. Catal. 2022, 43, 178–214. [Google Scholar]
- Wang, H.; Wan, Y.; Li, B.; Ye, J.; Gan, J.; Liu, J.; Huo, P. Rational design of Ce-doped CdS/N-rGO photocatalyst enhanced interfacial charges transfer for high effective degradation of tetracycline. J. Mater. Sci. Technol. 2024, 173, 137–148. [Google Scholar] [CrossRef]
- Wang, B.; Zhang, R.; Li, Z.; Shi, C.; Liu, E.; Zheng, Z.; Zhou, B.; Ji, M.; Chen, H. Enhancing photocatalytic degradation efficiency via the construction of organic/inorganic S-scheme supramolecular hybrid heterostructures. Appl. Surf. Sci. 2023, 641, 158481. [Google Scholar] [CrossRef]
- Aal, A.A.; Mahmoud, S.A.; Aboul-Gheit, A.K. Sol–Gel and Thermally Evaporated Nanostructured Thin ZnO Films for Photocatalytic Degradation of Trichlorophenol. Nanoscale Res. Lett. 2009, 4, 627–634. [Google Scholar] [CrossRef]
- Schubnell, M.; Kamber, I.; Beaud, P. Photochemistry at high temperatures—Potential of ZnO as a high temperature photocatalyst. Appl. Phys. A 1997, 64, 109–113. [Google Scholar] [CrossRef]
- Lahbib, M.; Meftah, M.; Mejri, C.; Oueslati, W.; Amara, A.B.H. The starting stoichiometry, keys parameter to enhance the intrinsic microstructural and functional properties of synthesized hybrid nanocomposites chitosan/Na-montmorillonite/ZnO nanoparticlest type. Appl. Surf. Sci. Adv. 2023, 13, 100369. [Google Scholar] [CrossRef]
- Kango, S.; Kalia, S.; Celli, A.; Njuguna, J.; Habibi, Y.; Kumar, R. Surface modification of inorganic nanoparticles for development of organic–inorganic nanocomposites—A review. Prog. Polym. Sci. 2013, 38, 1232–1261. [Google Scholar] [CrossRef]
- Wu, L.; Liao, L.; Lv, G. Influence of interlayer cations on organic intercalation of montmorillonite. J. Colloid Interface Sci. 2015, 454, 1–7. [Google Scholar] [CrossRef]
- Hochella, M.F., Jr.; Mogk, D.W.; Ranville, J.; Allen, I.C.; Luther, G.W.; Marr, L.C.; McGrail, B.P.; Murayama, M.; Qafoku, N.P.; Rosso, K.M.; et al. Natural, incidental, and engineered nanomaterials and their impacts on the Earth system. Science 2019, 363, eaau8299. [Google Scholar] [CrossRef]
- Putri, G.E.; Rilda, Y.; Syukri, S.; Labanni, A.; Arief, S. Enhancing morphological and optical properties of montmorillonite/chitosan-modified cerium oxide nanoparticles for antimicrobial applications. Surf. Interfaces 2022, 32, 102166. [Google Scholar] [CrossRef]
- Giannakas, A.E.; Salmas, C.E.; Moschovas, D.; Baikousi, M.; Kollia, E.; Tsigkou, V.; Karakassides, A.; Leontiou, A.; Kehayias, G.; Avgeropoulos, A.; et al. Nanocomposite film development based on chitosan/polyvinyl alcohol using ZnO@ montmorillonite and ZnO@ halloysite hybrid nanostructures for active food packaging applications. Nanomaterials 2022, 12, 1843. [Google Scholar] [CrossRef]
- Li, D.; Huang, X.; Hao, F.; Lv, Y.; Chen, H.; Wu, S.; Xiong, W.; Liu, P.; Luo, H. Preparation of organic-inorganic composites with high antibacterial activity based on sepiolite, chitosan and zinc: The study of the active antibacterial sites of chitosan-zinc oxide structure. Appl. Clay Sci. 2022, 216, 106325. [Google Scholar] [CrossRef]
- Lee, D.-E.; Kim, M.-K.; Danish, M.; Jo, W.-K. State-of-the-art review on photocatalysis for efficient wastewater treatment: Attractive approach in photocatalyst design and parameters affecting the photocatalytic degradation. Catal. Commun. 2023, 183, 106764. [Google Scholar] [CrossRef]
- Bagade, A.V.; Pund, S.N.; Nagwade, P.A.; Kumar, B.; Deshmukh, S.U.; Kanagare, A.B. Ni-doped Mg-Zn nano-ferrites: Fabrication, characterization, and visible-light-driven photocatalytic degradation of model textile dyes. Catal. Commun. 2023, 181, 106719. [Google Scholar] [CrossRef]
- Ramirez, L.A.; Dennehy, M.; Alvarez, M. Metal oxide-biochar supported recyclable catalysts: A feasible solution for the reduction of 4-nitrophenol in water. Catal. Commun. 2023, 181, 106723. [Google Scholar] [CrossRef]
- Bian, X.; Li, F.; Zhang, J.; Zhong, M.; Yang, Y.; Khan, S. Photocatalytic degradation of tetracycline antibiotics in swine wastewater using Fe3+-loaded NaBiO3 coupled with sodium persulfate. Catal. Commun. 2023, 174, 106579. [Google Scholar] [CrossRef]
- Zehra, A.; Wani, S.M.; Bhat, T.A.; Jan, N.; Hussain, S.Z.; Naik, H.R. Preparation of a biodegradable chitosan packaging film based on zinc oxide, calcium chloride, nano clay and poly ethylene glycol incorporated with thyme oil for shelf-life prolongation of sweet cherry. Int. J. Biol. Macromol. 2022, 217, 572–582. [Google Scholar] [CrossRef]
- Brahmi, M.; Essifi, K.; Bakirhan, N.K.; El Bachiri, A.; Ouldriane, S.D.; Tahani, A. New insights into physicochemical aspects involved in the formation of chitosan@ alginate biobased polyelectrolyte complexes on natural montmorillonite clay surface. J. Mol. Liq. 2023, 387, 122. [Google Scholar] [CrossRef]
- Yahya, R.; Elshaarawy, R.F. Highly sulfonated chitosan-polyethersulfone mixed matrix membrane as an effective catalytic reactor for esterification of acetic acid. Catal. Commun. 2023, 173, 106557. [Google Scholar] [CrossRef]
- Dutta, S.; Kumar, P.; Yadav, S.; Sharma, R.D.; Shivaprasad, P.; Vimaleswaran, K.S.; Srivastava, A.; Sharma, R.K. Accelerating innovations in CH activation/functionalization through intricately designed magnetic nanomaterials: From genesis to applicability in liquid/regio/photo catalysis. Catal. Commun. 2023, 175, 106615. [Google Scholar] [CrossRef]
- Altıntıg, E.; Ates, A.; Angın, D.; Topal, Z.; Aydemir, Z. Kinetic, equilibrium, adsorption mechanisms of RBBR and MG dyes on chitosan-coated montmorillonite with an ecofriendly approach. Chem. Eng. Res. Des. 2022, 188, 287–300. [Google Scholar] [CrossRef]
- Eltabey, R.M.; Abdelwahed, F.T.; Eldefrawy, M.M.; Elnagar, M.M. Fabrication of poly(maleic acid)-grafted cross-linked chitosan/montmorillonite nanospheres for ultra-high adsorption of anionic acid yellow-17 and cationic brilliant green dyes in single and binary systems. J. Hazard. Mater. 2022, 439, 129589. [Google Scholar] [CrossRef] [PubMed]
- Tahari, N.; de Hoyos-Martinez, P.L.; Izaguirre, N.; Houwaida, N.; Abderrabba, M.; Ayadi, S.; Labidi, J. Preparation of chitosan/tannin and montmorillonite films as adsorbents for Methyl Orange dye removal. Int. J. Biol. Macromol. 2022, 210, 94–106. [Google Scholar] [CrossRef] [PubMed]
- Wang, B.; Luo, C.-Y.; Zhu, P.; Liu, Y.; Xu, Y.-J. Facile construction of H3PO3-modified chitosan/montmorillonite coatings for highly efficient flame retardation of polyester–cotton fabrics. Prog. Org. Coat. 2023, 184, 107864. [Google Scholar] [CrossRef]
- Albouchi, W.; Meftah, M.; Amara, A.B.H.; Oueslati, W. Effect of reactant ratio and nanofillers type on the microstructural properties, porosity fluctuations and heavy metal removal ability of chitosan-clay hybrid materials. Appl. Surf. Sci. Adv. 2023, 13, 100387. [Google Scholar] [CrossRef]
- Franco, F.; Pozo, M.; Cecilia, J.A.; Benítez-Guerrero, M.; Lorente, M. Effectiveness of microwave assisted acid treatment on dioctahedral and trioctahedral smectites. The influence of octahedral composition. Appl. Clay Sci. 2016, 120, 70–80. [Google Scholar] [CrossRef]
- Pálková, H.; Barlog, M.; Madejová, J.; Hronský, V.; Petra, L.; Šimon, E.; Billik, P.; Zimowska, M. Structural changes in smectites subjected to mechanochemical activation: The effect of the occupancy of the octahedral sites. Appl. Clay Sci. 2021, 213, 106214. [Google Scholar] [CrossRef]
- Douillard, J.; Lantenois, S.; Prelot, B.; Zajac, J.; Henry, M. Study of the influence of location of substitutions on the surface energy of dioctahedral smectites. J. Colloid Interface Sci. 2008, 325, 275–281. [Google Scholar] [CrossRef] [PubMed]
- Available online: https://www.clays.org/sourceclays_data/ (accessed on 29 March 2024).
- Cheira, M.F.; Kouraim, M.N.; Zidan, I.H.; Mohamed, W.S.; Hassanein, T.F. Adsorption of U(VI) from sulfate solution using montmorillonite/polyamide and nano-titanium oxide/polyamide nanocomposites. J. Environ. Chem. Eng. 2020, 8, 104427. [Google Scholar] [CrossRef]
- Mejri, C.; Oueslati, W.; Amara, A.B.H. Structure and reactivity assessment of dioctahedral montmorillonite during provoked variable sequential cation exchange process via XRD modelling approach. Appl. Surf. Sci. Adv. 2023, 15, 100403. [Google Scholar] [CrossRef]
- Jiang, A.; Patel, R.; Padhan, B.; Palimkar, S.; Galgali, P.; Adhikari, A.; Varga, I.; Patel, M. Chitosan Based Biodegradable Composite for Antibacterial Food Packaging Application. Polymers 2023, 15, 2235. [Google Scholar] [CrossRef]
- Biswal, A.; Sethy, P.K.; Swain, S.K. Change in orientation of polyacrylic acid and chitosan networks by imprintment of gold nanoparticles. Polym. Technol. Mater. 2020, 60, 182–194. [Google Scholar] [CrossRef]
- Moll, W.F. Baseline studies of the clay minerals society source clays: Geological origin. Clays Clay Miner. 2001, 49, 374–380. [Google Scholar] [CrossRef]
- Mermut, A.R.; Lagaly, G. Baseline studies of the clay minerals society source clays: Layer-charge determination and characteristics of those minerals containing 2:1 layers. Clays Clay Miner. 2001, 49, 393–397. [Google Scholar] [CrossRef]
- Oueslati, W.; Meftah, M. Discretization of the water uptake process of Na-montmorillonite undergoing atmospheric stress: XRD modeling approach. Adv. Mater. Sci. Eng. 2018, 2018, 1–17. [Google Scholar] [CrossRef]
- Ammar, M.; Oueslati, W.; Ben Rhaiem, H.; Amara, A.B.H. Effect of the hydration sequence orientation on the structural properties of Hg exchanged montmorillonite: Quantitative XRD analysis. J. Environ. Chem. Eng. 2014, 2, 1604–1611. [Google Scholar] [CrossRef]
- Vinci, D.; Dazas, B.; Ferrage, E.; Lanson, M.; Magnin, V.; Findling, N.; Lanson, B. Influence of layer charge on hydration properties of synthetic octahedrally-charged Na-saturated trioctahedral swelling phyllosilicates. Appl. Clay Sci. 2019, 184, 105404. [Google Scholar] [CrossRef]
- Fu, J.; Yang, F.; Guo, Z. The chitosan hydrogels: From structure to function. New J. Chem. 2018, 42, 17162–17180. [Google Scholar] [CrossRef]
- Chipera, S.J.; Bish, D.L. Baseline studies of the clay minerals society source clays: Powder X-ray diffraction analyses. Clays Clay Miner. 2001, 49, 398–409. [Google Scholar] [CrossRef]
- Borden, D.; Giese, R.F. Baseline studies of the clay minerals society source clays: Cation exchange capacity measurements by the ammonia-electrode method. Clays Clay Miner. 2001, 49, 444–445. [Google Scholar] [CrossRef]
- Oueslati, W.; Ben Rhaiem, H.; Amara, A.B.H. Effect of relative humidity constraint on the metal exchanged montmorillonite performance: An XRD profile modeling approach. Appl. Surf. Sci. 2012, 261, 396–404. [Google Scholar] [CrossRef]
- Oueslati, W.; Mejri, C.; Amara, A.B.H. Impact of uniaxial mechanical perturbation on structural properties and smectite porosity features: Ion exchanger efficiency and adsorption performance fate. Adv. Civ. Eng. 2022, 2022, 1–16. [Google Scholar] [CrossRef]
- Jebali, S.; Meftah, M.; Mejri, C.; Ben Haj Amara, A.; Oueslati, W. Enhancement of Photocatalytic Activity and Microstructural Growth of Cobalt-Substituted Ba1−xCoxTiO3 {x = 0,…, 1} Heterostructure. ChemEngineering 2023, 7, 43. [Google Scholar] [CrossRef]
- Mejri, C.; Oueslati, W.; Amara, A.B.H. Structural alteration, hydration stability, heavy metal removal efficiency, and montmorillonite porosity fate by coupling the soil solution ph and a thermal gradient. Adsorpt. Sci. Technol. 2022, 2022, 1–28. [Google Scholar] [CrossRef]
- Hussain, M.; Ceccarelli, R.; Marchisio, D.; Fino, D.; Russo, N.; Geobaldo, F. Synthesis, characterization, and photocatalytic application of novel TiO2 nanoparticles. Chem. Eng. J. 2010, 157, 45–51. [Google Scholar] [CrossRef]
- Shume, W.M.; Murthy, H.C.A.; Zereffa, E.A. A review on synthesis and characterization of Ag2O nanoparticles for photocatalytic applications. J. Chem. 2020, 2020, 1–15. [Google Scholar] [CrossRef]
- Kefeni, K.K.; Mamba, B.B. Photocatalytic application of spinel ferrite nanoparticles and nanocomposites in wastewater treatment: Review. Sustain. Mater. Technol. 2020, 23, e00140. [Google Scholar] [CrossRef]
- Bhattacharjee, M.; Goswami, S.; Pramanik, N.B.; Barman, J.; Saikia, M.; Hulle, N.R.S.; Haloi, D.J. Chitosan/Clay biocomposite films with enhanced physico-chemical, mechanical and antimicrobial properties. Anal. Chem. Lett. 2023, 13, 609–625. [Google Scholar] [CrossRef]
- Vijayalekshmi, V. UV-Visible, mechanical and anti-microbial studies of chitosan-montmorillonite clay/TiO2 nanocomposites. Res. J. Recent Sci. 2015, 4, 131–135. [Google Scholar]
- Bahrudin, N.N.; Nawi, M.A.; Zainal, Z. Insight into the synergistic photocatalytic-adsorptive removal of methyl orange dye using TiO2/chitosan based photocatalyst. Int. J. Biol. Macromol. 2020, 165, 2462–2474. [Google Scholar] [CrossRef]
- Gao, X.; Yin, H.; Li, M.; Xin, L.; Zhang, H.; Long, H. Photocatalytic degradation of methyl orange by a diethylenetriamine modified chitosan/bentonite composite. React. Chem. Eng. 2023, 8, 2505–2521. [Google Scholar] [CrossRef]
- Bahrudin, N.N.; Nawi, M.A.; Sabar, S. Immobilized chitosan-montmorillonite composite adsorbent and its photocatalytic regeneration for the removal of methyl orange. React. Kinet. Catal. Lett. 2019, 126, 1135–1153. [Google Scholar] [CrossRef]
- Aadnan, I.; Zegaoui, O.; El Mragui, A.; Esteves da Silva, J.C.G. Physicochemical and photocatalytic properties under visible light of ZnO-Bentonite/Chitosan hybrid-biocompositefor water remediation. Nanomaterials 2021, 12, 102. [Google Scholar] [CrossRef]
- Bai, Q.; Yangchao, L. A review on the preparation and characterization of chitosan-clay nanocomposite films and coatings for food packaging applications. Carbohydr. Polym. Technol. Appl. 2021, 2, 100102. [Google Scholar]
- Butman, M.F.; Ovchinnikov, N.L.; Karasev, N.S.; Kochkina, N.E.; Agafonov, A.V.; Vinogradov, A.V. Photocatalytic and adsorption properties of TiO2-pillared montmorillonite obtained by hydrothermally activated intercalation of titanium polyhydroxo complexes. Beilstein J. Nanotechnol. 2018, 9, 364–378. [Google Scholar] [CrossRef]
- Huo, M.; Guo, H.; Jiang, Y.; Ju, H.; Xue, B.; Li, F. A facile method of preparing sandwich layered TiO2 in between montmorillonite sheets and its enhanced UV-light photocatalytic activity. J. Photochem. Photobiol. A Chem. 2018, 358, 121–129. [Google Scholar] [CrossRef]
- Amir, M.N.I.; Julkapli, N.M.; Hamid, S.B.A. Incorporation of chitosan and glass substrate for improvement in adsorption, separation, and stability of TiO2 photodegradation. Int. J. Environ. Sci. Technol. 2016, 13, 865–874. [Google Scholar] [CrossRef]
- Saravanan, R.; Aviles, J.; Gracia, F.; Mosquera, E.; Gupta, V.K. Crystallinity and lowering band gap induced visible light photocatalytic activity of TiO2/CS (Chitosan) nanocomposites. Int. J. Biol. Macromol. 2018, 109, 1239–1245. [Google Scholar] [CrossRef]
- Cesur, S.; Köroğlu, C.; Yalçın, H.T. Antimicrobial and biodegradable food packaging applications of polycaprolactone/organo nanoclay/chitosan polymeric composite films. J. Vinyl Addit. Technol. 2018, 24, 376–387. [Google Scholar] [CrossRef]
- Mohammadzadeh-Vazifeh, M.; Hosseini, S.M.; Mohammadi, A.; Jahanfar, M.; Maleki, H. Investigation of the antimicrobial properties of nanoclay and chitosan based nanocomposite on the microbial characteristics of Gouda cheese. Iran. J. Microbiol. 2020, 12, 121–126. [Google Scholar] [CrossRef]
- Kusmono; Abdurrahim, I. Water sorption, antimicrobial activity, and thermal and mechanical properties of chitosan/clay/glycerol nanocomposite films. Heliyon 2019, 5, e02342. [Google Scholar] [CrossRef]
- Khubiev, O.M.; Egorov, A.R.; Kirichuk, A.A.; Khrustalev, V.N.; Tskhovrebov, A.G.; Kritchenkov, A.S. Chitosan-Based Antibacterial Films for Biomedical and Food Applications. Int. J. Mol. Sci. 2023, 24, 10738. [Google Scholar] [CrossRef]
- Priyadarshi, R.; Rhim, J.-W. Chitosan-based biodegradable functional films for food packaging applications. Innov. Food Sci. Emerg. Technol. 2020, 62, 102346. [Google Scholar] [CrossRef]
- Ben Dhieb, F.; Dil, E.J.; Tabatabaei, S.H.; Mighri, F.; Ajji, A. Effect of nanoclay orientation on oxygen barrier properties of LbL nanocomposite coated films. RSC Adv. 2019, 9, 1632–1641. [Google Scholar] [CrossRef]
- Kumar, S.; Mukherjee, A.; Dutta, J. Chitosan based nanocomposite films and coatings: Emerging antimicrobial food packaging alternatives. Trends Food Sci. Technol. 2020, 97, 196–209. [Google Scholar] [CrossRef]
- Cankaya, N.; Sahin, R. Chitosan/clay bionanocomposites: Structural, antibacterial, thermal and swelling properties. Cellul. Chem. Technol. 2019, 53, 537–549. [Google Scholar] [CrossRef]
- Bandyopadhyay, J.; Ray, S.S. Are nanoclay-containing polymer composites safe for food packaging applications?—An overview. J. Appl. Polym. Sci. 2019, 136, 47214. [Google Scholar] [CrossRef]
- Rodrigues, C.; de Mello, J.M.M.; Dalcanton, F.; Macuvele, D.L.P.; Padoin, N.; Fiori, M.A.; Soares, C.; Riella, H.G. Mechanical, thermal and antimicrobial properties of chitosan-based-nanocomposite with potential applications for food packaging. J. Polym. Environ. 2020, 28, 1216–1236. [Google Scholar] [CrossRef]
- El-Naggar, E.; Wassel, M.A.; Shoueir, R.K. Visible-light driven photocatalytic effectiveness for solid-state synthesis of ZnO/natural clay/TiO2 nanoarchitectures towards complete decolorization of methylene blue from aqueous solution. Environ. Nanotechnol. Monit. Manag. 2021, 15, 100425. [Google Scholar] [CrossRef]
- Mustapha, S.; Ndamitso, M.M.; Abdulkareem, A.S.; Tijani, J.O.; Shuaib, D.T.; Ajala, A.O.; Mohammed, A.K. Application of TiO2 and ZnO nanoparticles immobilized on clay in wastewater treatment: A review. Appl. Water Sci. 2020, 10, 49. [Google Scholar] [CrossRef]
- Jida, S.M.; Zerefa, E.A. Preparation and photocatalysis of ZnO/bentonite based on adsorption and photocatalytic activity. Mater. Res. Express 2023, 10, 035502. [Google Scholar] [CrossRef]
- Morlando, A.; Sencadas, V.; Cardillo, D.; Konstantinov, K. Suppression of the photocatalytic activity of TiO2 nanoparticles encapsulated by chitosan through a spray-drying method with potential for use in sunblocking applications. Powder Technol. 2018, 329, 252–259. [Google Scholar] [CrossRef]
- Castillo, P.C.H.-D.; Castro-Velázquez, V.; Rodríguez-González, V. Adsorption and photocatalytic-conjugated activity of a chitosan-functionalized titanate coating for the removal of the drug clonazepam from drinking water. Environ. Sci. Pollut. Res. 2023, 1–16. [Google Scholar] [CrossRef]
- Maruthupandy, M.; Muneeswaran, T.; Chackaravarthi, G.; Vennila, T.; Anand, M.; Cho, W.-S.; Quero, F. Synthesis of chitosan/SnO2 nanocomposites by chemical precipitation for enhanced visible light photocatalytic degradation efficiency of congo red and rhodamine-B dye molecules. J. Photochem. Photobiol. A Chem. 2022, 430, 113972. [Google Scholar] [CrossRef]


| Samples | Time (h) | X-ray Wavelength λ (Å) | Diffraction Angle θ (°) | FWHM (rad) | Crystallite Size D (nm) |
|---|---|---|---|---|---|
| Cs/MMT | 1 | 1.5406 Å | 2.015 | 0.133 | 3.830 |
| 2 | 2.045 | 0.116 | 2.129 | ||
| 3 | 2.150 | 0.375 | 1.948 | ||
| 4 | 2.112 | 0.373 | 1.698 | ||
| 5 | 2.112 | 0.374 | 1.696 | ||
| Cs/HET | 1 | * | * | ** | |
| 2 | 2.789 | 0.127 | 4.140 | ||
| 3 | 2.634 | 0.593 | 3.847 | ||
| 4 | 2.949 | 0.592 | 3.824 | ||
| 5 | 2.789 | 0.591 | 3.559 |
| Element Sample | C | N | O | Na | Mg | Al | Si | Cl | Ca | Fe | Total (wt%) |
|---|---|---|---|---|---|---|---|---|---|---|---|
| CS/MMT_1h | 5.87 | 0.10 | 36.13 | 5.75 | 2.43 | 12.24 | 31.52 | 2.74 | n.d | 3.22 | 100 |
| CS/MMT_5h | 7.12 | 1.27 | 36.38 | 4.89 | 2.08 | 11.92 | 31.04 | 2.43 | n.d | 2.87 | 100 |
| CS/HET_1h | 3.81 | 0.88 | 41.02 | 3.61 | 3.11 | 10.71 | 28.49 | 1.58 | 3.18 | 3.61 | 100 |
| CS/HET_5h | 3.92 | 2.57 | 39.46 | 4.36 | 1.78 | 11.02 | 27.01 | 1.92 | 4.14 | 3.82 | 100 |
| Samples | Experimental Conditions | Decolorization (%) | Refs. |
|---|---|---|---|
| TiO2/MMT | Light = 250 W mercury lamp; MMT = 40 mg L−1; V = 0.5 L; t = 135 min | 100.00 | [65] |
| TiO2/MMT | Light = 30 W mercury lamp; MMT = 20 mg L−1; V = 0.01 L; t = 50 min | 100.00 | [66] |
| TiO2/Cs | Light = 6 W mercury lamp; MMT = 10 mg L−1; V = 0.15 L; t = 75 min | 70.00 | [67] |
| TiO2/Cs | Light = solar simulator; MMT = 16.4 mg L−1; V = 1 L; t = 120 min | 063.60 | [68] |
| Cs/MMT (1:3)_1h | Light = 230 W mercury lamp; MMT = 75 mg L−1; V = 0.05 L; t = 180 min | 024.12 | Our work |
| Cs/MMT (1:3)_5h | Light = 230 W mercury lamp; MMT = 75 mg L−1; V = 0.05 L; t = 180 min | 069.27 | |
| Cs/HET (1:3)_1h | Light = 230 W mercury lamp; MMT = 75 mg L−1; V = 0.05 L; t = 180 min | 024.16 | |
| Cs/HET (1:3)_5h | Light = 230 W mercury lamp; MMT = 75 mg L−1; V = 0.05 L; t = 180 min | 062.51 |
Disclaimer/Publisher’s Note: The statements, opinions and data contained in all publications are solely those of the individual author(s) and contributor(s) and not of MDPI and/or the editor(s). MDPI and/or the editor(s) disclaim responsibility for any injury to people or property resulting from any ideas, methods, instructions or products referred to in the content. |
© 2024 by the authors. Licensee MDPI, Basel, Switzerland. This article is an open access article distributed under the terms and conditions of the Creative Commons Attribution (CC BY) license (https://creativecommons.org/licenses/by/4.0/).
Share and Cite
Albouchi, W.; Lahbib, M.; Mejri, C.; Jebali, S.; Meftah, M.; Oueslati, W. Establishing the Link across the Synthesis Reaction Kinetics, Structural Changes, and Photocatalytic Efficiency of an Enhanced Chitosan–Clay (1:3) Nanocomposite. Solids 2024, 5, 227-255. https://0-doi-org.brum.beds.ac.uk/10.3390/solids5020015
Albouchi W, Lahbib M, Mejri C, Jebali S, Meftah M, Oueslati W. Establishing the Link across the Synthesis Reaction Kinetics, Structural Changes, and Photocatalytic Efficiency of an Enhanced Chitosan–Clay (1:3) Nanocomposite. Solids. 2024; 5(2):227-255. https://0-doi-org.brum.beds.ac.uk/10.3390/solids5020015
Chicago/Turabian StyleAlbouchi, Wael, Malek Lahbib, Chadha Mejri, Sana Jebali, Mahdi Meftah, and Walid Oueslati. 2024. "Establishing the Link across the Synthesis Reaction Kinetics, Structural Changes, and Photocatalytic Efficiency of an Enhanced Chitosan–Clay (1:3) Nanocomposite" Solids 5, no. 2: 227-255. https://0-doi-org.brum.beds.ac.uk/10.3390/solids5020015