Article

Integrated Remote Sensing for Geological and Mineralogical Mapping of Pb-Zn Deposits: A Case Study of Jbel Bou Dahar Region Using Multi-Sensor Imagery

1
DLGR Laboratory, URAC 43, Faculty of Sciences Semlalia, Cadi Ayyad University, Marrakech 40000, Morocco
2
OCP Group, Bd Moulay Youssef, Youssoufia 46300, Morocco
3
Institute of Environmental Geology and Geoengineering, National Research Council of Italy (CNR IGAG), Research Area of Rome 1, 00010 Rome, Italy
*
Author to whom correspondence should be addressed.
Submission received: 15 March 2024 / Revised: 18 April 2024 / Accepted: 24 April 2024 / Published: 27 April 2024

Abstract

:
This research applies remote sensing methodologies for the first time to comprehensively explore the geological and mineralogical characteristics of the Jbel Bou Dahar region. An integrated approach with multi-sensor satellite images, including ASTER, Landsat-8, and Sentinel-2 was applied with the aim to discriminate the different lithological units in the study area. We implemented a suite of well-established image processing techniques, including Band Ratios, Principal Component Analysis, and Spectral Angle Mapper, to successfully identify, classify, and map the spatial distribution of carbonate minerals, OH-bearing minerals, and iron oxide minerals. Due to its high spectral resolution in the short-wave infrared region (SWIR), the ASTER sensor provided the most accurate results for mapping carbonate and OH-bearing minerals compared to the Sentinel-2 and Landsat-8 sensors. Conversely, Sentinel-2 offers high spectral and spatial resolution in visible and near-infrared (VNIR) corresponding to the regions where iron oxide minerals exhibit their characteristic absorption peaks. The results confirm the advantages of remote sensing technologies in the geological and mineralogical exploration of the study area and the importance of selecting the appropriate sensors for specific mapping objectives.

1. Introduction

In recent years, remote sensing techniques have demonstrated significant efficacy in the field of geological mapping, as well as in the evaluation and identification of mineral deposits. This has enabled the development of numerous advanced image-processing methods. These techniques have allowed for the assessment of vast geological areas for mineral potential without the necessity for time-consuming and costly on-the-ground fieldwork.
The use of remote sensing data has significantly benefited mineral exploration and geological mapping, proving highly effective not only in arid and semi-arid regions but also in areas characterized by abundant vegetation cover [1,2,3,4]. Furthermore, given the growing demand for resources, it has also been used to optimize the management of mining waste [5], to recover the secondary raw materials by the phytoextraction process [6] and to valorize the residues rich in exploitable raw materials [7].
In the field of remote sensing techniques, researchers have extensively employed spectral signatures within the Visible and Near-Infrared (VNIR), Short-wave Infrared (SWIR), and thermal infrared (TIR) domains. Minerals like iron oxides, carbonates, hydroxyl, hydroxide, and silicate minerals exhibit unique spectral characteristics, detectable in the VNIR range (from 0.380 to 0.780 μm), the SWIR range (from 0.9 to 2.5 μm) [8], and the TIR range (from 8.12 TO 11.65 μm) [3]. These distinctive features arise from the overtones and combinations of the fundamental vibrations [8]. The analysis of these spectral signatures enables the effective identification and differentiation of various minerals.
This study utilizes a variety of freely available, advanced satellite sensors for comprehensive analysis. Key sensors, including the Advanced Space-borne Thermal Emission and Reflection Radiometer (ASTER) on the Terra platform, Landsat-8 from NASA, and Sentinel-2 within the Copernicus Program play an important role in capturing essential data for precise analysis and interpretation within the scope of this research. ASTER, launched in December 1999, provides valuable data with eight-bit precision across 14 bands, covering the visible, near-infrared, short-wave infrared, and thermal infrared ranges [8,9]. Landsat-8, launched in February 2013, carries the Operational Land Imager (OLI) and Thermal Infrared Sensor (TIRS), both recording data with 12-bit precision in the VNIR, SWIR, and TIR ranges [8,10]. Sentinel-2, launched in June 2015, is equipped with the Multi-Spectral Instrument (MSI), capturing data with 12-bit precision in 13 spectral bands, including the VNIR and SWIR regions [10,11].
Numerous studies have showcased the effectiveness of employing band ratio analysis (BR), Principal Component Analysis (PCA) processing, and techniques such as false-color composite imagery (FCC), as well as the Spectral Angle Mapper (SAM) classification algorithm, on ASTER, Landsat-8, and Sentinel-2 data for differentiating rock units and accurately identifying minerals. These methods have been used in different geological contexts, and consistently yielded significant results, providing valuable insights into the geological characteristics of the studied areas [1,8,10,12,13,14,15].
The deposits at the Jbel Bou Dahar (JBD) study area have been classified as Mississippi Valley-type Pb-Zn deposits, hosted by Jurassic carbonate rocks along the periphery of Jbel Bou Dahar in the eastern High Atlas [16,17]. The main aims of this research are to identify Pb-Zn mineralization zones and to map different lithological units by remote sensing technologies not yet used in the JBD study area. To achieve these goals, an integrated approach including FCC, PCA, BR, and SAM techniques will be used, and the results will be validated and compared with previous geological studies and ground truth data.

2. Materials and Methods

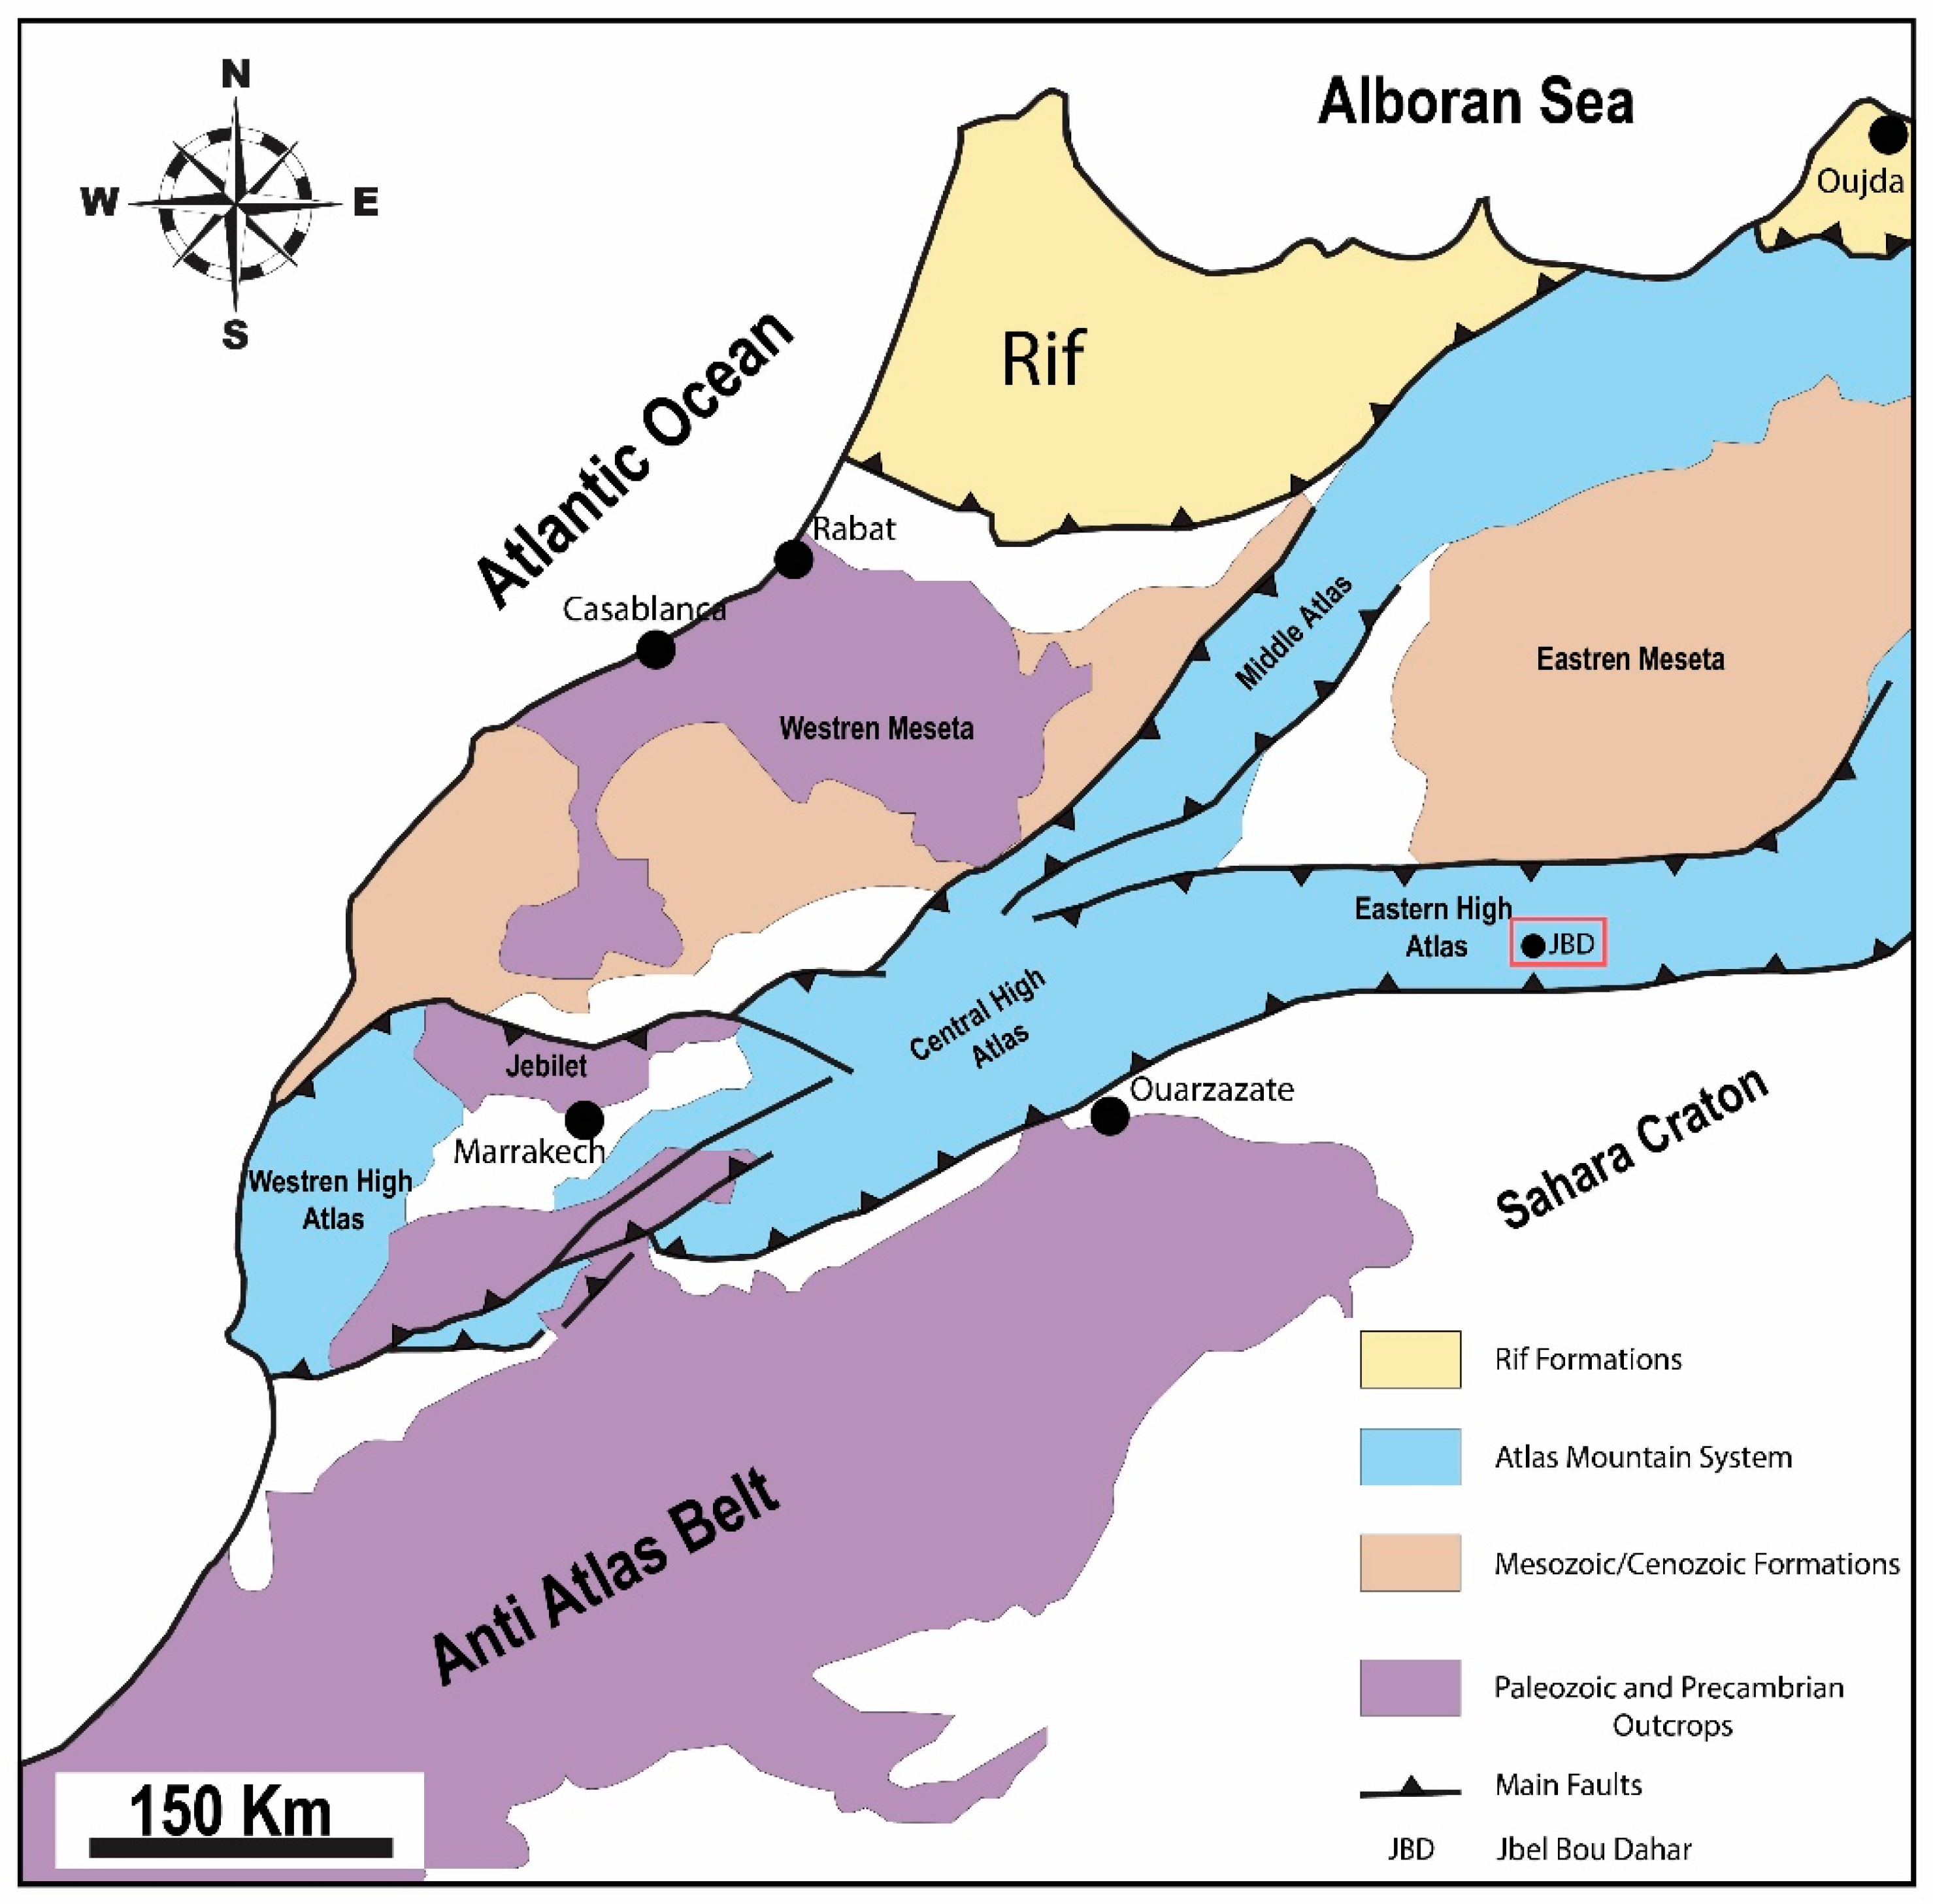
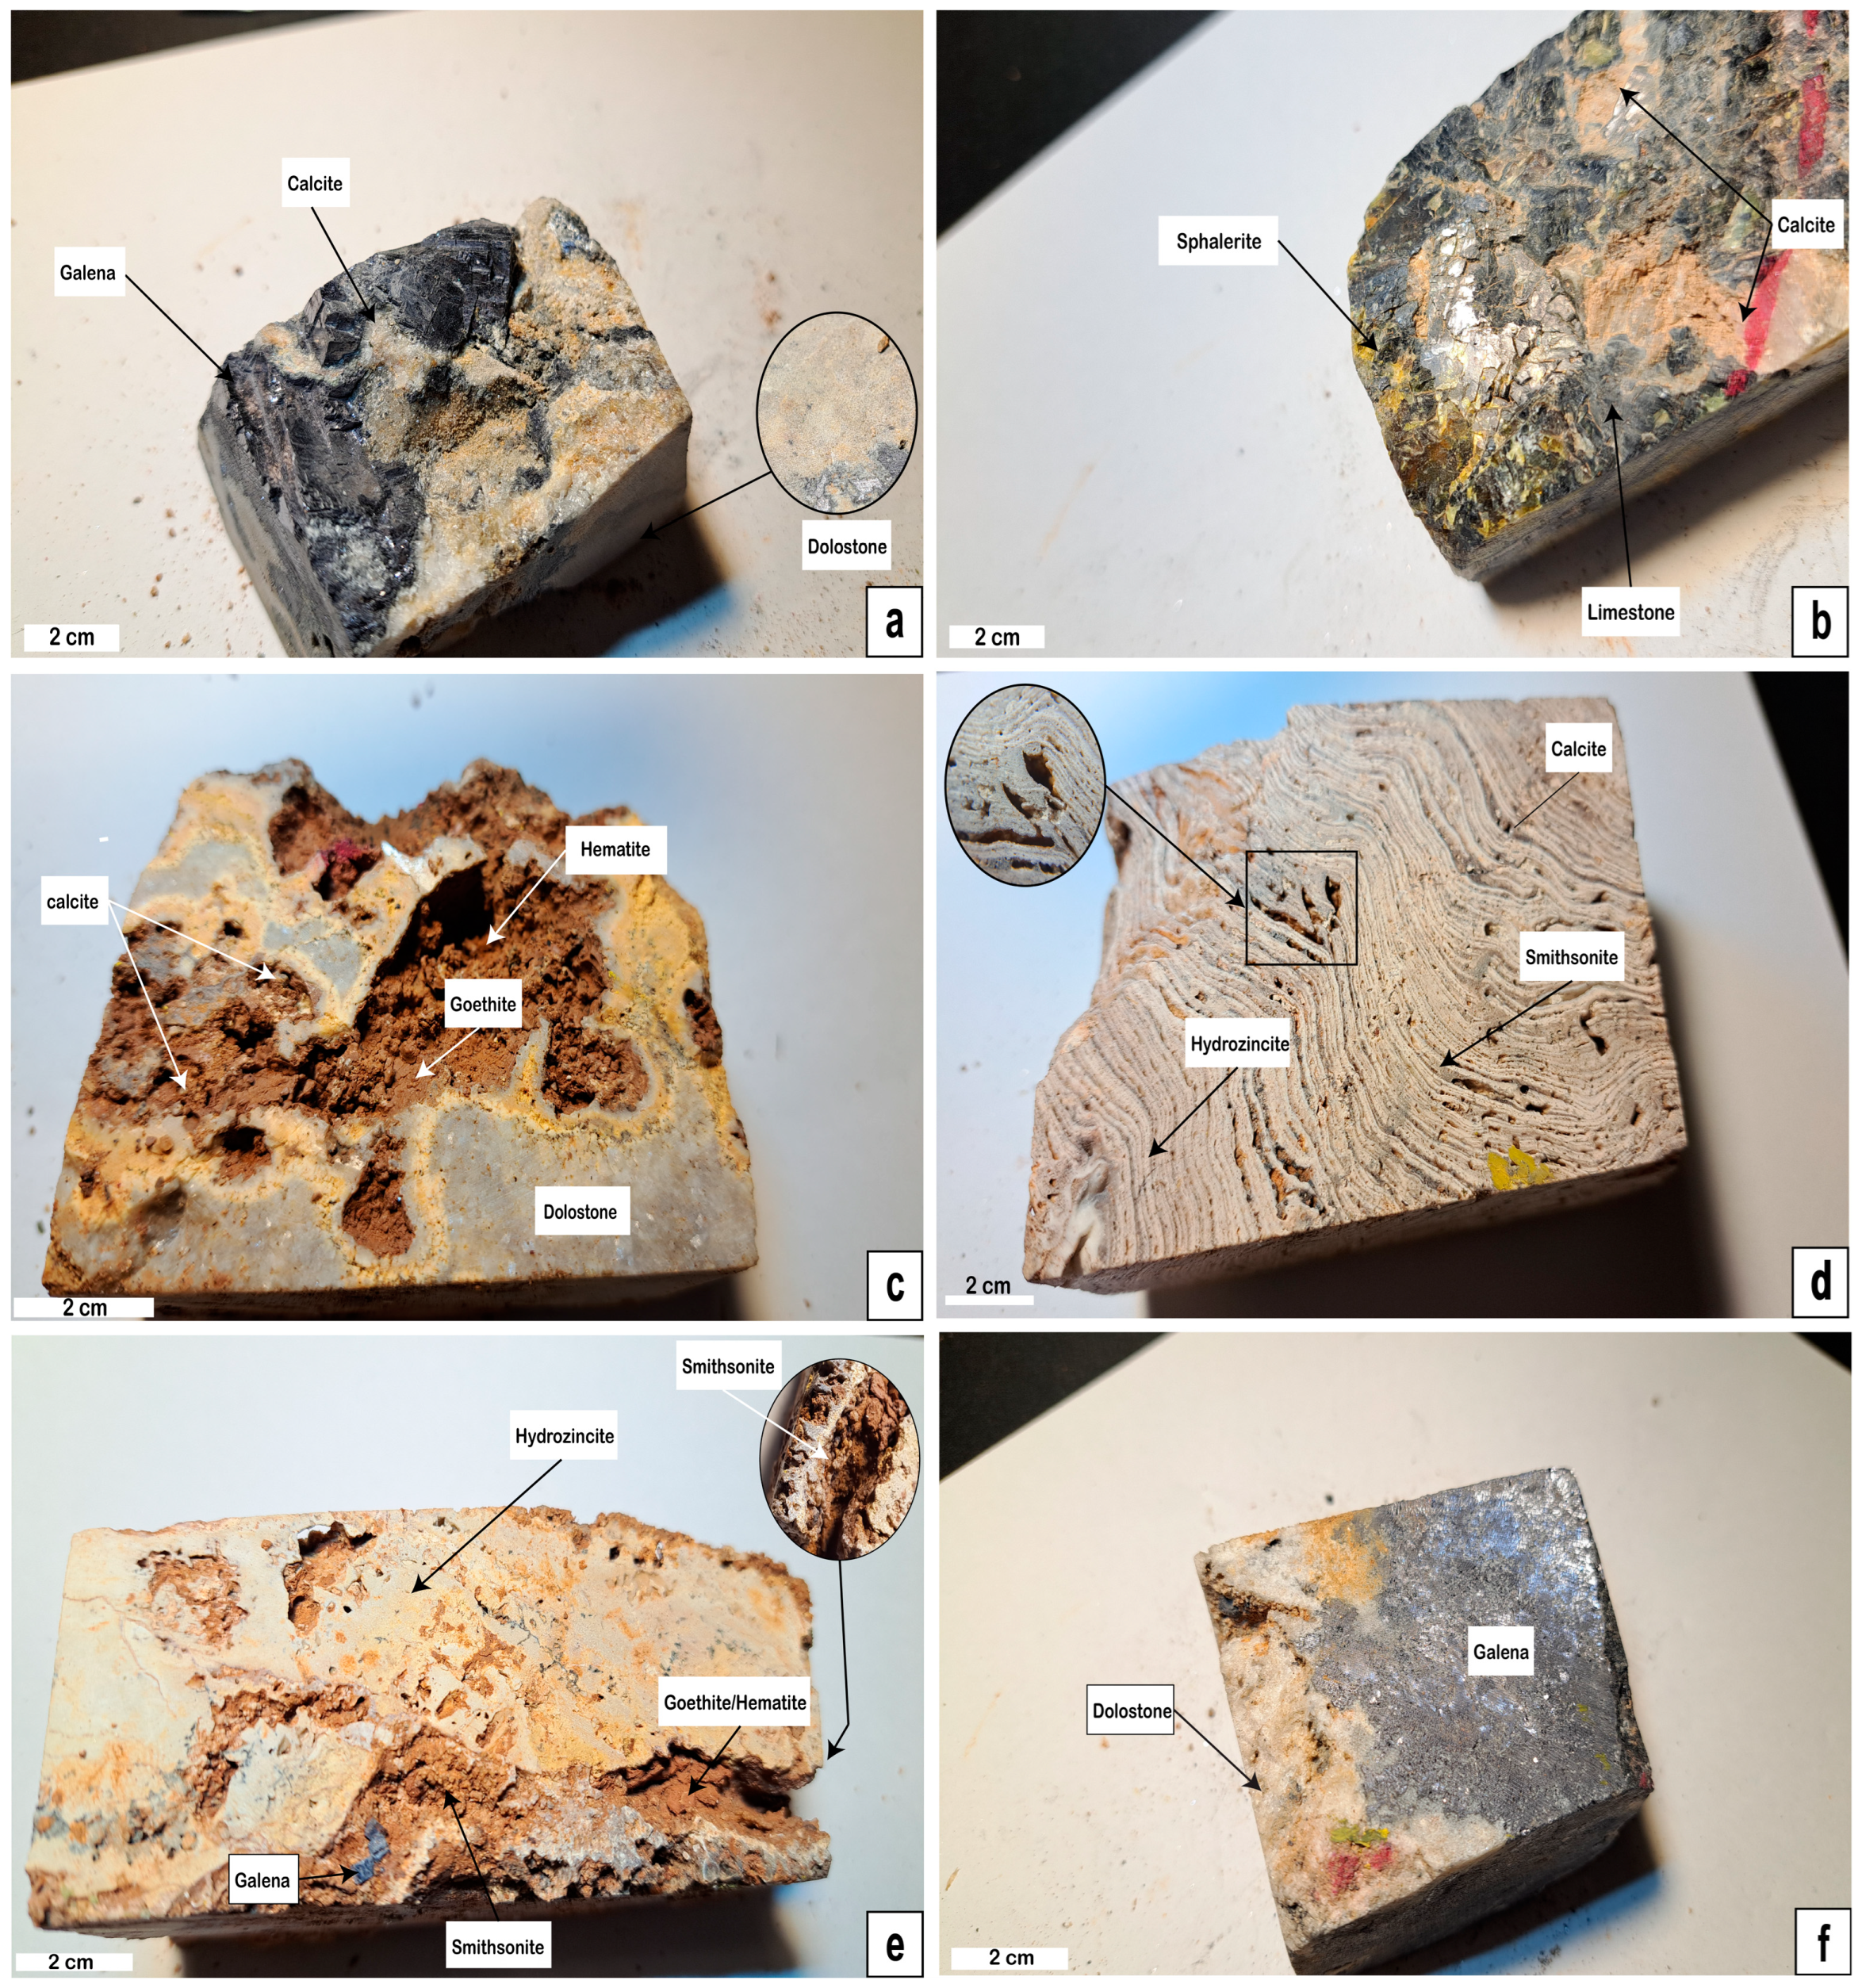
2.1. Geological and Mineralogical Settings

The JBD study area is situated within the eastern part of the High Atlas Mountains, renowned for its diverse geological record (Figure 1).
Sedimentary deposits in this region span a vast temporal range, extending from the pre-Triassic to the Jurassic period (Figure 2).
The region encompasses sedimentary rocks deposited during the Mesozoic and Cenozoic eras, concealing an ancient Paleozoic basement comprising Precambrian to Paleozoic rocks. Notable formations include schists and quartzite dating back to the Cambrian to Silurian age [17] (Figure 3).
In the central part of the Bou Dahar fold, Paleozoic facies are prominently exposed, influenced by E–W and NE–SW trending faults, with local microgabbro dike intrusions likely of Triassic origin [17]. The Atlas system formation is attributed to an early Triassic rift, driven by Pangea fragmentation, resulting in a marginal sea formation [20]. Triassic sediments consist of red bed siltstone, evaporites, and tholeiitic basalts from the Central Atlantic Magmatic Province (CAMP) [16]. A westward Tethys transgression during the early Sinemurian to early Hettangian resulted in extensive carbonate deposits, notably the laminated stromatolitic dolomite [17,20,21]. Fault-block tectonics and uplift generated a horst and graben pattern, forming shallow marine carbonate platforms [20]. The subsequent Carixian age witnessed marlstone deposition [17], followed by the Domerian–Toarcian transition, leading to fault reactivation and platform fragmentation [16,17,20]. The Bajocian period saw sedimentary layer deposition composed of alternating marl and argillaceous limestone beds, indicating prevailing deep marine conditions [16,17]. The uplift and fault inversion are attributed to the Alpine orogeny [16,17].
The deposits at the JBD study area have been classified as Mississippi Valley-type Pb-Zn deposits, hosted by Jurassic carbonate rocks [16,17]. The ore bodies come in various shapes and sizes, ranging from centimeter- to kilometer-scale veins and veinlets to larger structures. Notably, exploited structures can reach over 1 km in length, up to 4 m wide, and extend vertically for more than 150 m [16]. The notable alteration feature observed in the JBD is silicification, limited dolomitization, and intense veining with sparry calcite adjacent to the Pb-Zn orebodies. This calcite occurs as pre-, syn-, and post-mineralization, and is found in veins, karst cavities, and tension gashes [16]. The mineralogical investigation conducted in the Bou Dahar region has shown the existence of two primary ore types. Strata-bound ores, mainly situated within the Sinemurian-hosted carbonate formations (Figure 3), appeared as sporadic lens-shaped bodies, aligning along ENE–SSW trends coinciding with regional fault lines. Conversely, vein-type ores, predominantly located in the Pliensbachian bioclastic and reef limestone (Figure 3), are located within fault zones spanning E–W to ENE–WSW orientations. This mineralization exhibited characteristics indicative of an epigenetic origin. These ores highlighted a diverse array of minerals, including sulfides like galena (PbS) and sphalerite (ZnS), accompanied by subordinate pyrite (FeS2) and chalcopyrite (CuFeS2), alongside non-sulfide minerals such as smithsonite (ZnCO3), hydrozincite (Zn5(CO3)2(OH)6), hemimorphite (Zn4Si2O7(OH)2.H2O), cerussite (PbCO3), and iron oxides (goethite (FeO(OH)) and hematite (Fe2O3)) (Figure 4). Moreover, minerals like barite (BaSO4), calcite (CaCO3), and quartz (SiO2), serving as essential gangue minerals, contributed to the varied mineralogical composition observed in the region’s ores. Galena is identified in massive forms (Figure 4f) as well as euhedral crystals (Figure 4e), ranging from fine to coarse grains, occurring as patches (Figure 4a) and disseminated. Similarly, sphalerite is observed as massive patches (Figure 4b) and open-space fillings within the limestone host rock. In the JBD deposits, hydrozincite is prevalent and often found alongside smithsonite (Figure 4d,e). It is present as alternating layers, ranging from millimeters to centimeters in thickness, creating a stromatolitic-like texture (Figure 4d) commonly referred to as white calamine. Smithsonite, often linked with iron oxides and referred to as red calamine, appears as botryoidal aggregates of brownish to red-colored crystals (Figure 4e) or as fine crystals filling the micro-veins and micro-fractures within the host rock.

2.2. Satellite Data Preprocessing

The ASTER level 1B data were acquired on 13 June 2006 from the United States Geological Survey (USGS). The image was pre-georeferenced to the UTM zone 30 North projection, aligned with the WGS-84 datum. The VNIR and SWIR bands were subjected to radiometric calibration, followed by a process of layer-stacking and resampling, resulting in a spatial resolution of 15 m. To further refine the data, the VNIR and SWIR bands were subjected to atmospheric correction by the Fast Line of Sight Atmospheric Analysis of Spectral Hypercube (FLAASH) algorithm using ENVI 5.6 software. FLAASH is a widely used tool that corrects for the effects of atmospheric scattering and absorption, improving the accuracy of surface reflectance data retrieved from satellite imagery [22]. A two-step correction process was applied to the TIR band, beginning with radiometric correction and followed by Thermal Atmospheric Correction, performed at a spatial resolution of 90 m. A cloud-free level 1T Landsat-8 was downloaded from the Geological Survey Earth Resources Observation and Science Center (EROS) and acquired on 6 July 2020. The FLAASH algorithm was applied to the multi-spectral bands (1 to 7 bands) of Landsat-8 with a spatial resolution of 30 m. A Sentinel-2A (level 1C, cloud-free) image was downloaded from the European Space Agency Copernicus Open Access Hub and acquired in the JBD study area on 2 October 2023. The Sentinel-2A image was already radiometrically and geometrically corrected (UTM projection with WGS84 datum). The VNIR and SWIR bands were layer-stacked onto bands 2, 3, 4, 8, 11, and 12 with a spatial resolution of 10 m. Then the dataset obtained was subjected to the Quick Atmospheric Correction (QUAC). This comprehensive preprocessing methodology ensured the quality and accuracy of the data utilized for subsequent analytical procedures. Details of the spatial and spectral resolutions of the ASTER, Landsat-8, and Sentinel-2 data are provided in Table 1.

2.3. False-Color Composite (FCC)

False-color composite (FCC) was used to enhance features of the objects in the images. In this research, the combination of SWIR, Red, and Blue bands was chosen to highlight the different lithological units and mineralogical zones by assigning specific colors to each one.

2.4. Band Ratio

Band ratio is a robust technique that divides the digital number value of one spectral band by another, to enhance the presence of specific material barely distinguishable in the original band [8]. This approach plays a critical role for the enhancement of spectral features, mineral targeting, and lithological mapping. To effectively showcase targeted minerals, the Relative Absorption Band Depth (RDB) presented a pertinent three-point ratio formulation for displaying targeted minerals [26]. For each absorption, the numerator consisted of the sum of bands that represented the shoulders of the absorption feature, while the denominator corresponded to the band close to the minimum of the absorption feature [27]. The selection of band ratios was carried out in the distinct reflection and absorption characteristics exhibited by the main minerals within the study area and compared to the spectral signatures from the USGS library resampled according to the ASTER, Landsat-8, and Sentinel-2 spectral band ranges (Figure 5).
In particular, the electronic transitions of Fe3+/Fe2+ primarily occur from the 0.45 μm to 1.2 μm spectral range [10,28]. To detect iron oxide minerals in the JBD study area, the band ratio utilized the absorptions in the VNIR region. OH-bearing minerals and carbonate minerals (such as muscovite, kaolinite, gypsum, calcite, and dolomites) showed distinctive spectral absorption features in the 2.1 to 2.5 µm region due to overtones and combinations of fundamental vibrations. Conversely, their spectral reflectance commonly occurred in the 1.55 to 1.75 µm range [29]. To differentiate carbonate and OH-bearing minerals, the band ratio was based on the distinct reflectance properties exhibited within the SWIR regions (Figure 5).

2.5. Principal Components Analysis (PCA)

Principal Components Analysis (PCA) is a valuable linear transformation technique aimed at condensing image data and minimizing redundant values. This process involves the multiplication of original data values by statistical coefficients, known as Principal Components (PCs), which are derived from the variance/covariance matrix of the initial data [30,31]. These components are then sequenced in a descending manner based on their variance. The foremost principal component PC1 contains the highest level of information due to its greater variance, while the successive PCs progressively reduce the amount of information [30,31].

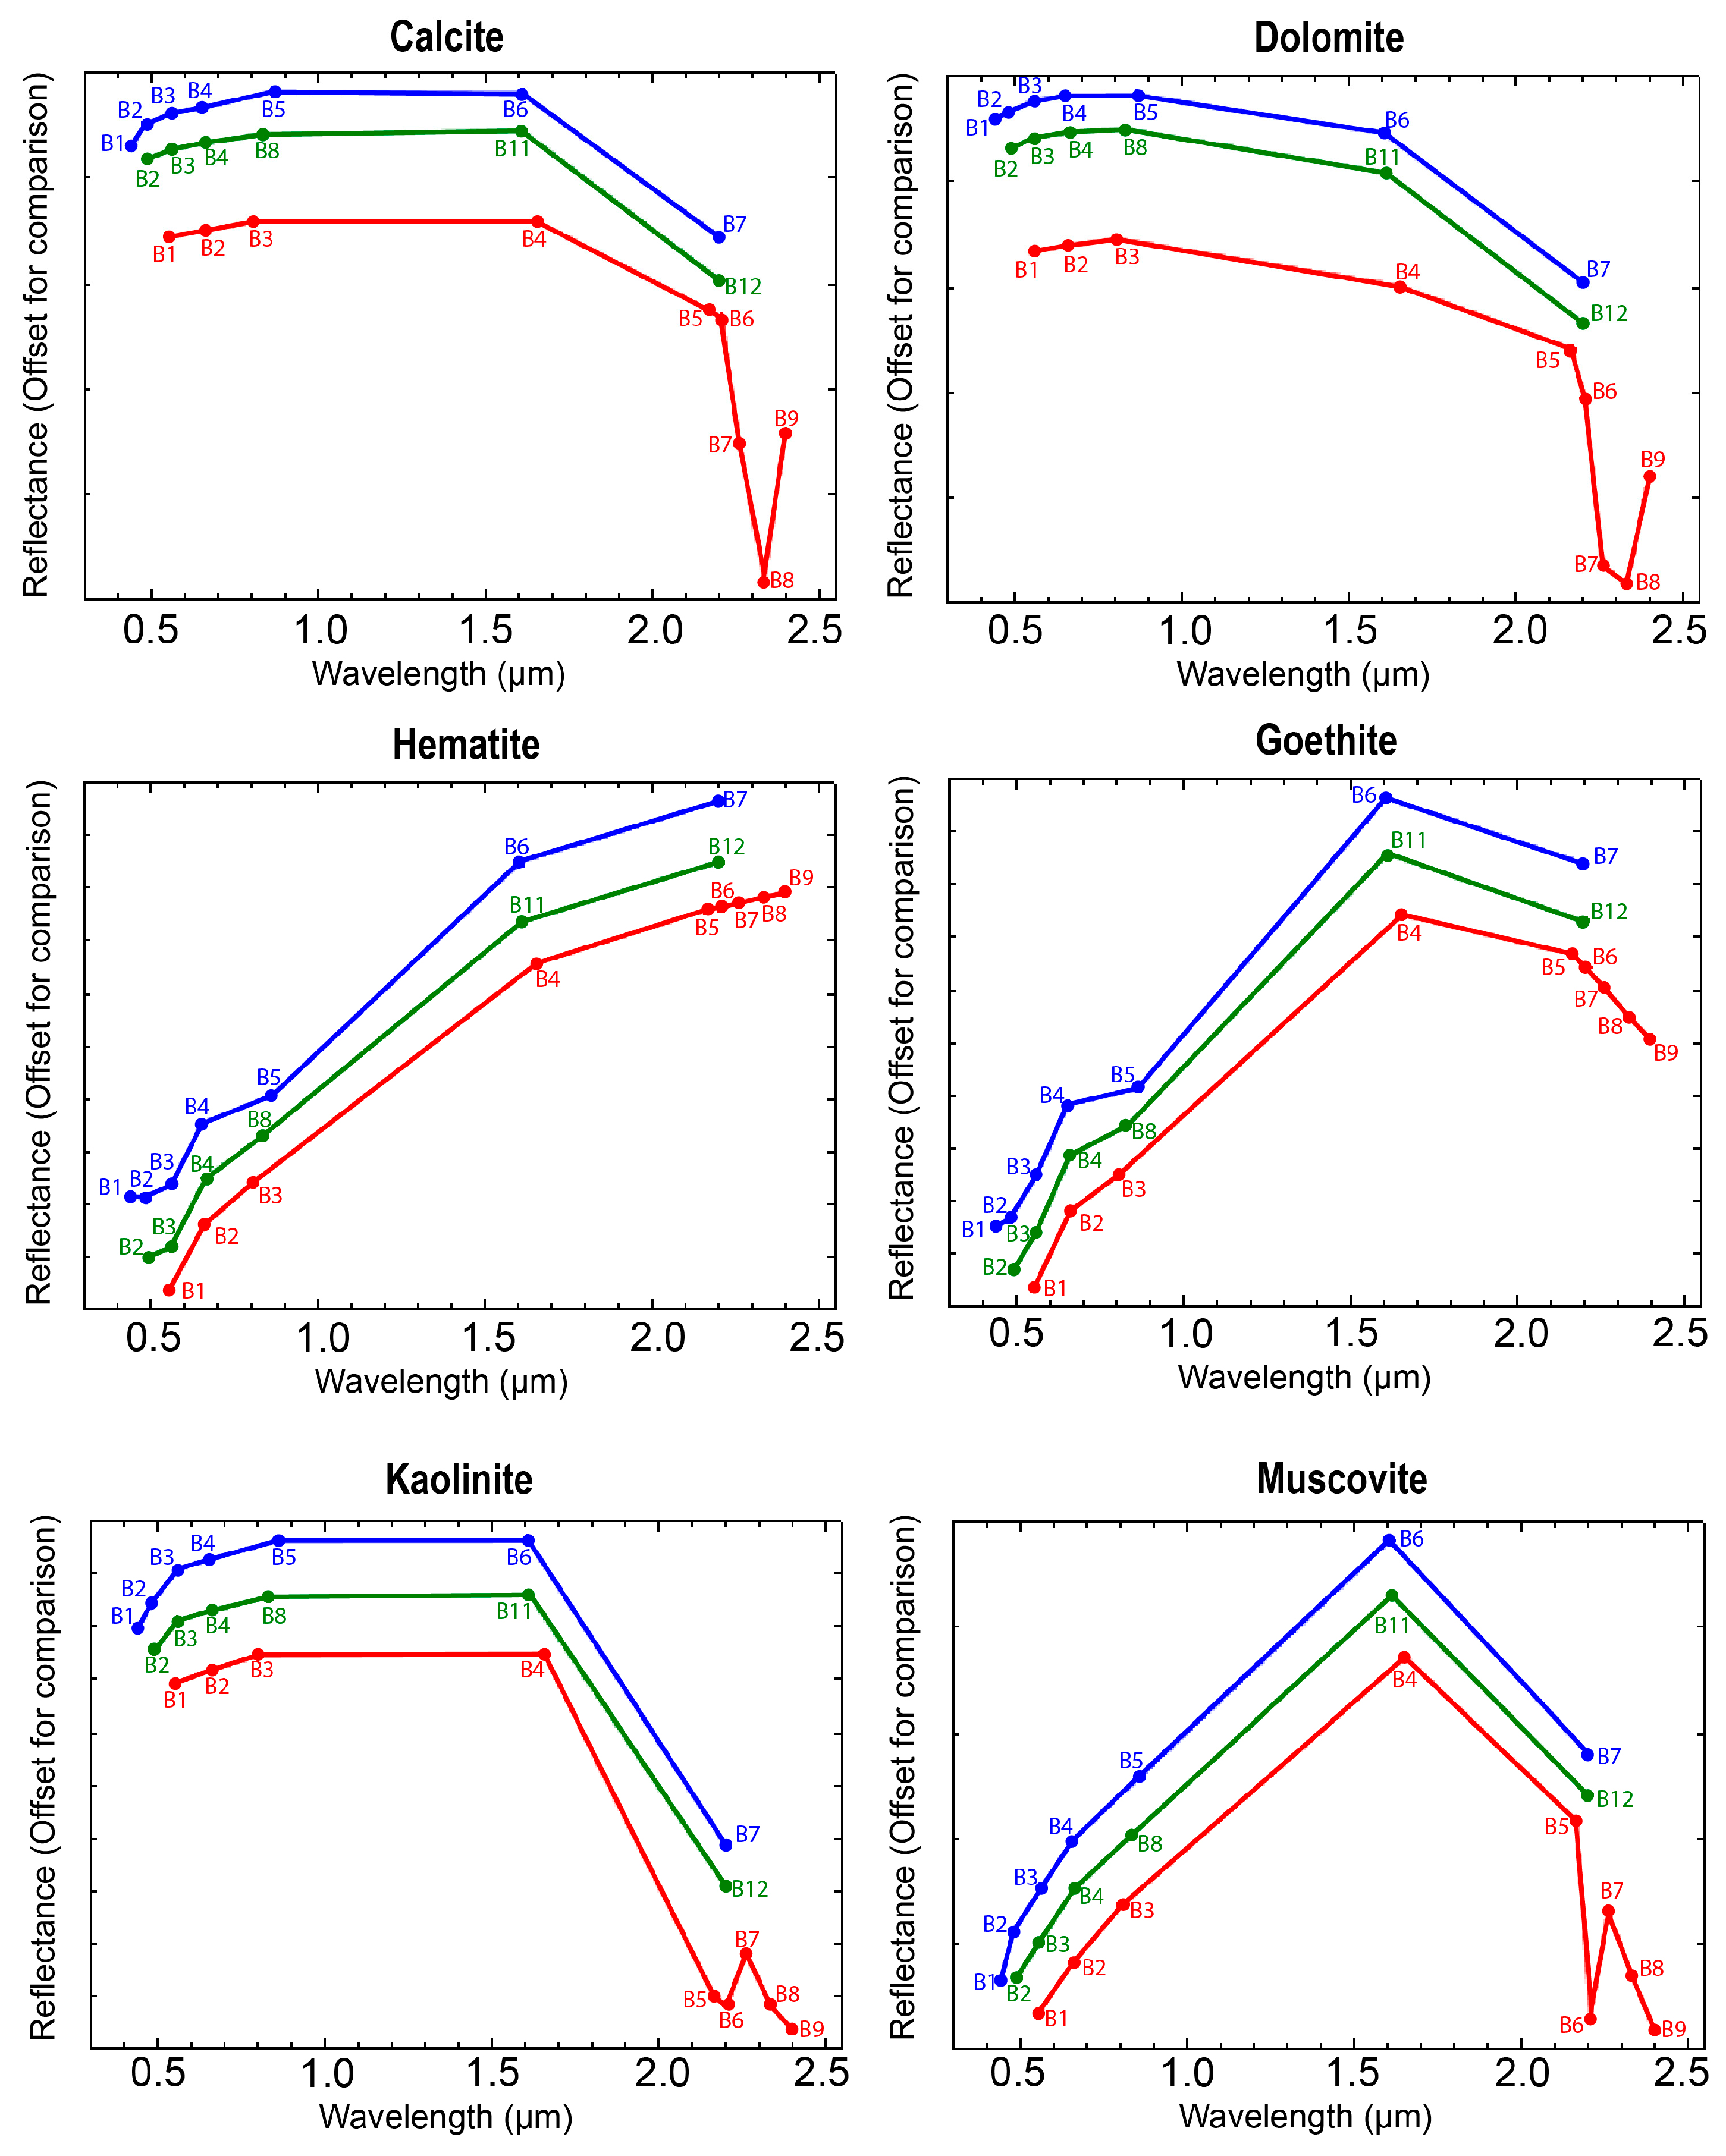
2.6. Spectral Angle Mapper Classification (SAM)

The Spectral Angle Mapper classification (SAM) relies on the spectral angle to assess the spectral resemblance between the spectrum of an image pixel and that of a reference spectrum within an n-dimensional feature space [32,33]. These reference spectra can be extracted directly from the image, or can originate from laboratory or field measurements [32]. In the context of spectral analysis, each band of a pixel can be treated as a vector characterized by its length and direction. Smaller spectral angles between these vectors and a reference spectrum indicate a closer match. Consequently, when assigning pixels to classes, the one with the smallest spectral angle to the reference spectrum is selected, reflecting the highest similarity [33]. The selection of regions of interest (ROIs) in the study area was performed using data from a detailed in situ sampling campaign (collecting coordinates with a GPS device, taking pictures, writing brief description of each sampling site), GeoEye images from Google Earth, geological maps, and outcomes from BR and PCA analyses. This combined approach ensured the identification of the ROIs used as input to classify the satellite images by SAM, as well as ground control points to validate the results of the classification (Table 2 and Figure 6).

2.7. Accuracy Assessment

The accuracy assessment utilized validation data gathered from ground truth points. Several methods were employed for accuracy assessment, including the standard kappa coefficient, overall accuracy, producer’s accuracy, and user’s accuracy [34]. The kappa coefficient measures the agreement between classification and truth values. A kappa value of 1 represents perfect agreement, while a value of 0 represents no agreement. Overall accuracy calculates the number of pixels accurately classified in the image being evaluated. User’s accuracy quantifies the number of pixels identified as one class but actually beloning to another, while producer’s accuracy measures the number of pixels classified to a class that genuinely belongs to that class only.
The kappa coefficient was computed using the following formula:
K c = N i = 1 r n i i ( i = 1 r n i c o l · i = 1 r n i r o w ) N 2 ( i = 1 r n i c o l · i = 1 r n i r o w )
The formulas for overall accuracy, producer’s accuracy, and user’s accuracy are as follows:
Overall accuracy:
O A = i = 1 r n i i N
Producer’s accuracy:
P A = n i i n i c o l
User’s accuracy:
U A = n i i n i r o w
where n i i is the number of pixels correctely classified in a category; N is the total number of pixels in the confusion matrix; r is the number of rows; and n i c o l and n i r o w are the column (reference data) and row (predicted classes) total, respectively.

3. Results

3.1. Red–Green–Blue False-Color Composite Results (FCC)

The selected bands for FCC were as follows: R: B11; G: band 4; Blue: band 2 for Sentinel-2; R: band 4; G: band 2; Blue: band 1 for ASTER; and R: band 7; G: band 4; B: band 2 for Landsat-8 satellite data (Figure 7). While all three sensors produced similar results, they differed primarily in their spatial resolution. Sentinel-2 and ASTER were chosen for futher analysis due to their high spatial resolution (10 m and 15 m, respectively), enabling a more precise delineation of geological units within the JBD region. Figure 7 shows the results of combining the selected bands to differentiate and represent the geological units by distinct colors in the study area. The Paleozoic socle including the Ordovician (Or) and Silurian (Sl) appears in a dark color. Dolomite formations (Do), alluvial and colluvial deposits (Al), and areas around the extracted mineralized veins are highlighted in bright yellow. The coastal plain unit (Cp) is represented in a greenish-brown hue. Lime-mudstone (Lm) and marl formations (Ml) exhibit varying shades from dark to light brown. Carbonate formations (Cb) are distinguished by a reddish-orange shade, highlighting their composition. The platform carbonate (Pc) unit is visualized in a gray-brown color, and the CAMP basalt (Bs) unit stands out in a distinctive bluish-cyan shade. The gabbro–diorite intrusions (GD) appeared as dark brown patches, marking their geological presence. The vegetation (Vg) is represented as a very dark brown color. The stream sediments (Ss) are indicated by a white color, outlining areas around the riverbeds. Additionally, the galleries and extracted mineralized veins are delineated in a distinctive mineral green color, positioned close to the JBD study area (target zone).

3.2. Band Ratio Results

The band ratio composition technique effectively minimizes topographic effects and allows for the distinction of different mineral types. Figure 8 presents the results of band ratios (BR) applied to Landsat-8 and Sentinel-2 images in the JBD study. Specific bands were chosen to capture distinct absorption features corresponding to diverse lithological compositions and minerals. Using band ratio B4/B2 for both sensors, the resulting images show the spatial distribution of iron oxide minerals represented by bright pixels, primarily located in the Al unit, Cp unit, Do unit, and the extracted mineralized veins and galleries (Figure 8a,c). In the analysis of Sentinel-2 data, the band ratio B11/B12 was calculated to identify carbonate and OH-bearing minerals exploiting the reflectance and absorption characteristics in these bands. The resulting image reveals bright pixels, signifying elevated concentrations of OH-bearing and carbonate minerals within the Cb unit, Bs unit, GD unit, Do unit, Sl unit, and some regions within the Al unit and Or unit (Figure 8b). For the Landsat-8 image, the band ratio utilized the reflectance and absorption peaks at B6 and B7, respectively. The Cb unit, Bs unit, GD unit, Do unit, Sl unit, and some parts of the Al unit and Or unit are mapped due to their content of carbonate and OH-bearing minerals (muscovite, kaolinite) (Figure 8d).
For the ASTER data, the presence of iron oxide is calculated using band ratio B2/B1. The resulting image shows the spatial distribution of iron oxide minerals, primarily concentrated in the Al and Cp units (Figure 9a). In comparison to the iron oxide maps by Sentinel-2 and Landsat-8, the ASTER image did not cover all zones rich in iron oxide minerals, particularly those near the extracted mineralized veins and surrounding galleries in the area. To individuate the carbonate minerals in the ASTER image, the band ratio (B7 + B9)/B8 is applied. This choice is based on the absorption feature observed around 2.30 to 2.35 µm, corresponding to B7 and B8. In Figure 9b, the bright pixels show a high concentration of carbonate minerals, while the darker pixels indicate a low concentration or absence of carbonate minerals. The high abundance of carbonate minerals is associated with the lithological units of Cb and Pc. To identify zones dominated by dolomite, the band ratio (B6 + B8)/B7 is applied. The dolomite absorption feature is primarily concentrated around 2.20 to 2.30 µm coinciding with B6 and B7 in the ASTER data. The Do unit is marked by bright pixels due to the high content of dolomite in this unit (Figure 9c). OH-bearing minerals show an absorption feature at 2.17 to 2.20 µm, corresponding to B5 and B6 in the ASTER data. The band ratio (B5 + B7)/B6 is applied to discriminate the OH-bearing minerals in the study area. Figure 9d shows significant concentrations of OH-bearing minerals highlighted by bright pixels in specific geological units, notably within the Or unit, Sl unit, Bs unit, and GD unit. The presence of OH-bearing minerals is also detected in other areas such as the Lm unit, Ml unit, and Ss unit. Vegetation shows the absorption features in the blue and red regions, coinciding with B2 (0.63–0.69 µm), and high reflectance in the NIR region equivalent to B3 (0.78–0.86 µm) in ASTER. Therefore, the band ratio B3/B2 is used for the discrimination and classification of vegetation (Vg), where bright pixels denote its presence (Figure 9e). Additionally, for the TIR bands in the ASTER data, the band ratio B14/B12 is applied to identify and classify quartz, which is typically associated with the Or, Sl, Bs, and Al units (Figure 9f). Comparing the BR results for the three sensors, the ASTER data highlight a good reliability in discriminating the spatial distribution of carbonate and OH-bearing minerals. On the other hand, iron oxide minerals are well identified by Sentinel-2 and Landsat-8 sensors.

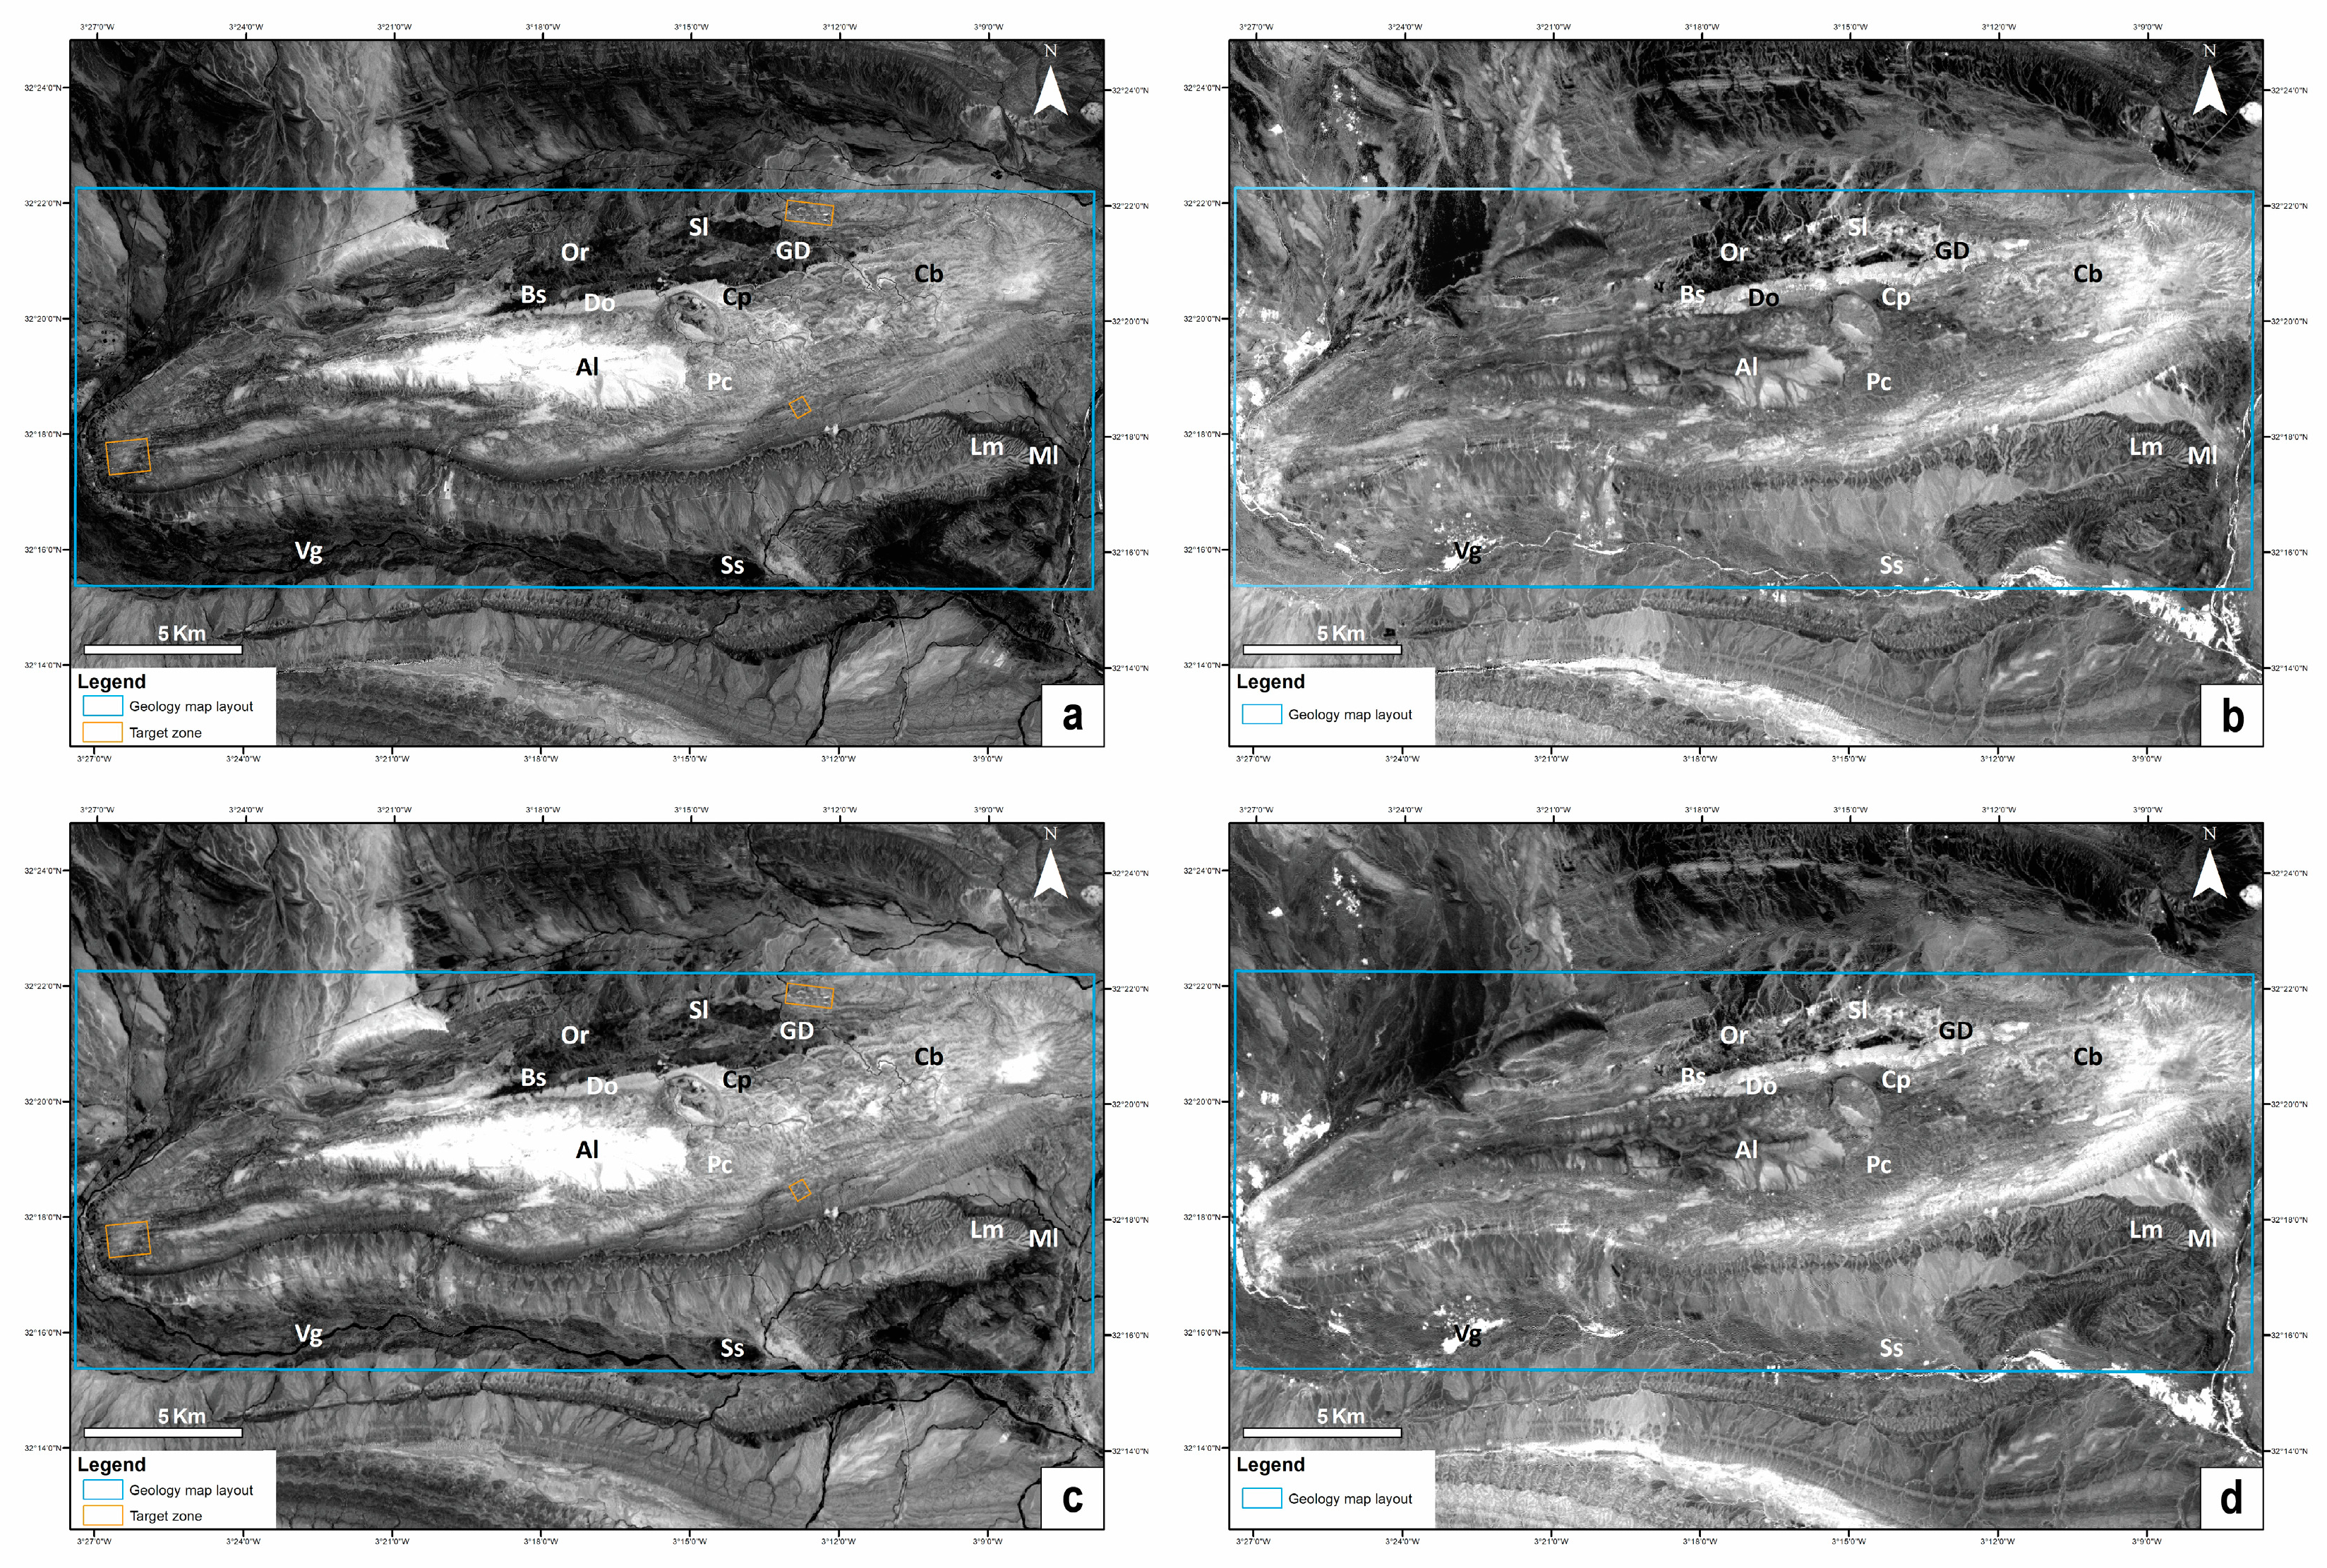
3.3. Principal Component Analysis Results (PCA)

The utility of the PCA approach became evident when considering the PC images. In these images, the presence of moderate to high eigenvector loadings of opposing signs, corresponding to specific bands indicative of particular minerals, carried out a very important role in enhancing mineral identification. This phenomenon caused the variation in pixel tones, with brightness or darkness contingent upon the positivity or negativity of the loading in the reflective band, respectively [26,35]. This systematic procedure not only contributed to refining the mineral identification but also facilitated a comprehensive visualization of mineralogical variations within the study area.
For the ASTER data, the PCA resulting in the eigenvector loading matrix is analyzed (Table 3). PC3 exhibited a strong positive loading in band 8 (0.5965) and a moderate to strong negative loading in band 4 (−0.4978). The carbonate minerals exhibited a high reflectance around 1.6 µm, and distinctive absorption features close to 2.30–2.35 µm, coinciding with band 4 and band 8, respectively.
Examining the eigenvector loading matrix of Sentinel-2 (Table 4), PC4 exhibited a robust negative loading in band 4 (−0.8024) and a moderate positive loading in band 2 (0.3835). This configuration indicated the presence of iron oxide minerals.
The eigenvector loading matrix of Landsat-8 (Table 5) showed that PC4 had a substantial negative loading in band 4 (−0.7974) and a moderate positive loading in band 2 (0.3274). This configuration indicated the presence of iron oxide minerals.
In the Sentinel-2 image, the areas in the Al unit, Cp unit, and regions near mineralized veins and galleries showed a high concentration of iron oxide minerals (target zone) (Figure 10a). On the other hand, PC5 showed a strong positive loading in band 12 (0.6804) and a moderate to strong negative loading in band 11 (−0.5972), suggesting the presence of OH-bearing and carbonate minerals, represented as dark pixels, inverted to bright pixels to better identify the minerals (Figure 10b). In particular, the Cb unit, Do unit, GD unit, Bs unit, Sl unit, and specific parts of the Al unit and Or unit highlighted a significant abundance of these minerals.
The PC4 image in Landsat-8 showed areas rich in iron oxide minerals such as the Al unit, Cp unit, and mineralized zones (target zone) (Figure 10c). Furthermore, carbonate and OH-bearing minerals are distinctly represented as dark pixels in the PC5 image (Figure 10d). This is due to the strong negative loading in band 6 (−0.6452) (reflective band) and strong positive loading in band 7 (0.6246). These dark pixels were inverted to bright pixels. A high concentration of carbonate and OH-bearing minerals were seen in the Cb unit, Do unit, GD unit, Bs unit, Sl unit, and specific parts of the Al unit and Or unit.
These results revealed a notable correspondence in the spatial distribution of iron oxide, carbonate, and OH-bearing minerals between the data from Sentinel-2 and Landsat-8, underscoring the significant match in the results.
In the ASTER data, carbonate minerals appeared as dark pixels in the PC3 image, which were inverted to bright pixels (Figure 10e). These carbonate minerals were primarily concentrated in the Cb unit and Do unit. PC6 provided information about iron oxide minerals, whereas PC8 revealed insights into OH-bearing minerals. However, the resulting images for both components were significantly affected by high noise.

3.4. Spectral Angle Mapper (SAM) Classification Results

In this study, finding the Regions of Interest (ROIs), used as input to classify the datasets and ground control points to validate the results, was accomplished by the selection of the most informative data such as outcomes from BR combinations, PCA analysis, previous geological maps, detailed field observations recorded using GPS technology, and GeoEye images from Google Earth (Figure 6). This integrated approach ensured the precise delineation of the ROIs, facilitating the accurate production of the SAM maps. The results of SAM classification are summarized in Table 6. In particular, the results showed that ASTER outperformed Sentinel-2 and Landsat-8, demonstrating a higher accuracy in lithological mapping.
To evaluate the mapping accuracies of the datasets (ASTER, Sentinel-2, Landsat-8) by SAM classification, the confusion matrices were computed using a pixel-by-pixel comparison. These matrices offered valuable insights into the spatial distribution of classification errors (Figure 11). For the ASTER data, a detailed examination of the confusion matrix (Table 7) highlighted that the Ss and Al units showed the highest user’s and producer’s accuracies, both recording 100%. This result suggested that the SAM algorithm correctly classified the Al and Ss units. The GD unit had the lowest user’s accuracy (32.26%), showing a higher level of spectral mixing and confusion with the Pc and Or units. These results indicated lower spectral mixing and confusion among different classes, leading to a more accurate classification map for the ASTER image (Figure 11a). The confusion matrix of Landsat-8 (Table 8) showed the highest user’s and producer’s accuracies of 100% for the CE, Al, Bs, and Od units, whereas the lowest user’s accuracy of 22.73% was observed for Cb units. This observation implied that the Cb unit exhibited significant spectral mixing and confusion, particularly with the Pc unit (Figure 11b). For Sentinel-2 (Table 9), the highest user’s and producer’s accuracies of 100% were recorded for the Bs and Ss units, while the lowest user’s accuracy of 5.08% was associated with the Do unit. This result suggested that the Do unit highlighted substantial spectral mixing and confusion, particularly with the Cp and Pc units (Figure 11c).
We conducted a comparative analysis of pixel classification performance among three satellite sensors: ASTER, Landsat-8, Sentinel-2. The analysis compared the performance of the three remote sensors for classifying different mineral classes. The data indicate (Table 10, Figure 12) that ASTER (86 pixel) has the lowest overall misclassification rate followed by Landsat-8 (73) and then Sentinel-2 (677). ASTER has the most balanced distribution across classes compared to the other sensors.

4. Discussion

The JBD study area has not previously been subjected to mineralogical exploration or lithological mapping by satellite remote sensing techniques. This research has allowed us to compare the results from satellite image analyses with the previous geological research within the region, the observations by field survey, and the high-resolution GeoEye images from Google Earth. Processing techniques, including BR, PCA, and SAM, were applied to the ASTER, Landsat-8, and Sentinel-2 satellite data to individuate, classify, and map the spatial distribution of carbonate minerals, OH-bearing minerals, and iron oxide minerals within the study area. The results successfully highlighted the presence of these minerals with different accuracies based on the different spectral and spatial resolutions of the three sensors. For ASTER, the results of the PCA and BR techniques identified the spatial distribution of carbonate minerals (calcite and dolomite) within the Cb unit, Do unit, and certain portions of the Pc unit, marked by bright pixels. For Sentinel-2 and Landsat-8 images, the results from the PCA and BR analyses showed a relatively reduced surface of carbonate minerals respective to the ASTER data. This result could be attributed to the lower spectral resolution of Landsat-8 and Sentinel-2 in the SWIR region, where there are the characteristic absorption peaks of carbonates (2.30 to 2.35 µm) [36]. The presence of carbonate and dolomite rocks in the JBD region has been well documented in previous studies [17,19,20,37,38] and the GeoEye images and in situ pictures illustrated the distribution of carbonate rocks (Cb) and platform carbonate (Pc) (Figure 13c,d,f). Furthermore, the field observations validated the presence of carbonate rocks (limestone) hosting mineralization with red calamine, galena, and calcite, observed in mine galleries (Figure 13e). For Sentinel-2 and Landsat-8, the PCA and BR results showed a distinct spatial distribution of iron oxide minerals in the Al unit, Cp unit, in segments of the Pc unit, and close to extracted mineralization veins. This prevalence of iron oxide minerals in the Cp and Pc units can be explained by the presence of red-shale layers, as noted in the previous lithological studies [38]. Compared to Sentinel-2 and Landsat-8, the ASTER results from BR correctly classified the distribution of iron oxide minerals within the Cp and Al units, as well as specific areas within the Pc unit but the BR technique did not successfully map the iron oxide minerals close to extracted mineralized veins. This result can be attributed to the best spectral resolution of Sentinel-2 in the VNIR range. In fact, in this spectral range there are the specific absorption and reflectance peaks of iron minerals. Furthermore, the exploited structures exhibited a thickness less than 15 m, providing an explanation for the inability of the ASTER sensor to accurately detect these minerals [16]. The GeoEye image clearly showed the extracted mineralized veins surrounded by red sediments, confirming the presence of iron minerals within these sediments (Figure 13a). In addition, the field observations validated these results, highlighting the deposition of red calamine within carbonate formations and confirming the existence of iron oxide minerals (Figure 13e). The BR and the FCC analyses effectively distinguished the CAMP basalts (Bs) and the gabbro–diorite intrusion (GD), respectively (Figure 7 and Figure 8a). The GD intrusions have been correctly mapped, and their presence is also confirmed by previous studies [38]. The GeoEye images provided the distribution of the GD intrusions and the Bs unit (Figure 13b). For the ASTER data, OH-bearing minerals were accurately mapped utilizing the BR analysis, in the Or unit, Sl unit, Bs unit, Lm unit, and Ml unit. Compared to the ASTER data, the results of BR applied to the Sentinel-2 and Landsat-8 images showed a limited distribution of OH-bearing minerals due to the enhanced sensitivity of the ASTER sensor in the SWIR region. These results are confirmed by previous studies that have extensively documented the composition of the Paleozoic socle, comprising predominantly sandstones, slates, schists, and quartzites [16,17,19,20,37]. For the ASTER data, the BR results highlighted the presence of quartz minerals within the siliciclastic sediment of the Or, Sl, Bs, and Al units. Furthermore, for Sentinel-2 and Landsat-8, the PCA indicated a reduced spatial distribution of OH-bearing minerals within the Or, Sl, and Bs units, according to the observations regarding the band ratios. The SAM algorithm is a well-established spectral classification method in remote sensing, utilized for evaluating the spectral similarities between two vectors. The high accuracy achieved by the SAM technique applied to the ASTER imagery is primarily attributed to high spectral resolution in the SWIR range, respective to the Sentinel-2 and Landsat-8 satellite data. For the ASTER data, the SWIR bands offered in-depth insights into specific minerals, such as OH-bearing minerals and carbonate minerals, enabling the precise differentiation and mapping of various lithological units based on their unique spectral signatures. The detailed spectral feature facilitated an accurate discrimination between carbonate and OH-bearing minerals. On the other hand, respective to the Sentinel-2 and Landsat-8 satellite data, the ASTER results showed the low values of accuracy for iron oxide minerals, due to the limited spectral resolution in the VNIR. Future research could explore the potential applications of other commercially available and freely available sensors. High-resolution sensors like WorldView-2 and WorldView-3 offer finer spatial resolutions and enhanced SWIR coverage, potentially yielding even more detailed results. Archived data from sensors like QuickBird, with its high VNIR resolution, could be valuable for studies focused on specific minerals like iron oxides. However, for cost-effective options, Landsat-8 and Sentinel-2 remain valuable choices despite their limitations in distinguishing certain mineral groups compared to high-resolution sensors.

5. Conclusions

This research employed a comprehensive methodology, integrating multi-sensor satellite imageries, including ASTER, Landsat-8, and Sentinel-2, to conduct an in-depth exploration of the geological and mineralogical characteristics of the JBD region. The study area, previously not studied by remote sensing techniques, presented a unique opportunity for benchmarking against existing geological research, field observations, and high-resolution GeoEye images from Google Earth. By using different processing analyses, such as BR, PCA, and SAM, the spatial distribution of carbonate, OH-bearing, and iron oxide minerals have been individuated, classified, and mapped using three different satellite images. In particular, the results highlighted the accurate identification of carbonate minerals within the Cb unit, Do unit, and specific portions of the Pc unit as well as performing mapping of OH-bearing minerals in the Or unit, Sl unit, Bs unit, Lm unit, and Ml unit using the ASTER image. These results confirmed the enhanced sensitivity of ASTER in the SWIR region to identify the characteristic absorption and reflection peaks of these minerals. On the other hand, the Sentinel-2 sensor showed the high sensitivity to detect iron-bearing minerals, particularly in the Al unit, Cp unit, and segments of the Pc unit. The capability of the Sentinel-2 depended on the high spectral and spatial resolution in the VNIR region covering iron oxide mineral spectral features. The differences in the spatial distribution of carbonate minerals, OH-bearing minerals, and iron oxide minerals found by using different satellite images with different spectral and spatial resolution emphasized the importance of selecting the appropriate sensors for specific mapping objectives.
The SAM classification showed the superior accuracy of ASTER (93.76%) compared to Sentinel-2 (76.21%) and Landsat-8 (83.37%), primarily due to the high ASTER spectral resolution in the SWIR bands for carbonate and OH-bearing minerals mapping.
This study acknowledges the inherent limitations associated with the different spectral and spatial resolutions of the three satellites, but the results underscore the importance and advantages of remote sensing technologies in geological exploration (i.e., fast, low cost, simple, and non-environmentally invasive). However, in the last years, there has been a growing development and exploitation of new satellites with better spectral and spatial resolution for improved mineralogical and lithological mapping. For example, WorldView-3 stands out as a promising solution to deepen the geological and mineralogical knowledge in regions not yet studied due to its high spectral and spatial resolution features. Our work thus not only contributes valuable insights to the current understanding of the study area but also paves the way for future investigations leveraging cutting-edge technologies for a more improved exploration of the JBD region, considering the presence of Pb-Zn deposits that are raw materials of economic importance for industries and the digital transition.

Author Contributions

Conceptualization, M.C.; methodology, M.C.; software, M.C.; validation, M.C., D.G. and A.W.; formal analysis, M.C.; investigation, M.C.; resources, M.C.; data curation, M.C.; writing—original draft preparation, M.C.; writing—review and editing, M.C., A.W., Y.D. and D.G.; visualization, M.C.; supervision, A.W. and Y.D. All authors have read and agreed to the published version of the manuscript.

Funding

This research received no external funding.

Data Availability Statement

The original contributions presented in the study are included in the article, further inquiries can be directed to the corresponding author.

Conflicts of Interest

The authors declare no conflicts of interest.

References

  1. Ewais, M.M.M.; El Zalaky, M.A.; Selim, A.Q.; Abu Sharib, A.S.A.A. Implementation of ASTER data for lithologic and alteration zones mapping: Derhib area, South Eastern Desert, Egypt. J. Afr. Earth Sci. 2022, 196, 104725. [Google Scholar] [CrossRef]
  2. Mahanta, P.; Maiti, S. Regional scale demarcation of alteration zone using ASTER imageries in South Purulia Shear Zone, East India: Implication for mineral exploration in vegetated regions. Ore Geol. Rev. 2018, 102, 846–861. [Google Scholar] [CrossRef]
  3. Sheikhrahimi, A.; Pour, A.B.; Pradhan, B.; Zoheir, B. Mapping hydrothermal alteration zones and lineaments associated with orogenic gold mineralization using ASTER data: A case study from the Sanandaj-Sirjan Zone, Iran. Adv. Space Res. 2019, 63, 3315–3332. [Google Scholar] [CrossRef]
  4. Traore, M.; Çan, T.; Tekin, S. Mapping carbonate-hosted Pb-Zn mineralization zones in Yahyali Province (Eastern Taurus-Turkey) using ASTER data. Adv. Space Res. 2022, 69, 266–281. [Google Scholar] [CrossRef]
  5. Guglietta, D.; Belardi, G.; Passeri, D.; Salvatori, R.; Ubaldini, S.; Casentini, B.; Trapasso, F. Optimising the management of mining waste by means Sentinel-2 imagery: A case study in Joda West Iron and Manganese Mine (India). J. Sustain. Min. 2020, 19, 4. [Google Scholar] [CrossRef]
  6. Scotti, A.; Milia, S.; Silvani, V.; Cappai, G.; Guglietta, D.; Trapasso, F.; Tempesta, E.; Passeri, D.; Godeas, A.; Gómez, M.; et al. Sustainable Recovery of Secondary and Critical Raw Materials from Classified Mining Residues Using Mycorrhizal-Assisted Phytoextraction. Metals 2021, 11, 1163. [Google Scholar] [CrossRef]
  7. Guglietta, D.; Conte, A.M.; Paciucci, M.; Passeri, D.; Trapasso, F.; Salvatori, R. Mining Residues Characterization and Sentinel-2A Mapping for the Valorization and Efficient Resource Use by Multidisciplinary Strategy. Minerals 2022, 12, 617. [Google Scholar] [CrossRef]
  8. Yang, M.; Ren, G.; Han, L.; Yi, H.; Gao, T. Detection of Pb–Zn mineralization zones in west Kunlun using Landsat 8 and ASTER remote sensing data. J. Appl. Remote Sens. 2018, 12, 1. [Google Scholar] [CrossRef]
  9. Di Tommaso, I.; Rubinstein, N. Hydrothermal alteration mapping using ASTER data in the Infiernillo porphyry deposit, Argentina. Ore Geol. Rev. 2007, 32, 275–290. [Google Scholar] [CrossRef]
  10. Sekandari, M.; Masoumi, I.; Pour, A.B.; Muslim, A.M.; Rahmani, O.; Hashim, M.; Zoheir, B.; Pradhan, B.; Misra, A.; Aminpour, S.M. Application of Landsat-8, Sentinel-2, ASTER and Worldview-3 spectral imagery for exploration of carbonate-hosted Pb-Zn deposits in the Central Iranian Terrane (CIT). Remote Sens. 2020, 12, 1239. [Google Scholar] [CrossRef]
  11. Phiri, D.; Simwanda, M.; Salekin, S.; Ryirenda, V.R.; Murayama, Y.; Ranagalage, M.; Oktaviani, N.; Kusuma, H.A.; Zhang, T.; Su, J.; et al. remote sensing Sentinel-2 Data for Land Cover / Use Mapping: A Review. Remote Sens. 2019, 42, 14. [Google Scholar]
  12. Liu, L.; Li, Y.; Zhou, J.; Han, L.; Xu, X. Gold-copper deposits in Wushitala, Southern Tianshan, Northwest China: Application of ASTER data for mineral exploration. Geol. J. 2018, 53, 362–371. [Google Scholar] [CrossRef]
  13. Mehdikhani, B.; Imamalipour, A. ASTER-based remote sensing image analysis for prospection criteria of podiform chromite at the khoy ophiolite (NW Iran). Minerals 2021, 11, 960. [Google Scholar] [CrossRef]
  14. Ghorbani, A.; Honarmand, M.; Shahriari, H.; Hassani, M.J. Regional scale prospecting for non-sulphide zinc deposits using ASTER data and different spectral processing methods. Int. J. Remote Sens. 2019, 40, 8647–8667. [Google Scholar] [CrossRef]
  15. Honarmand, M.; Shahriari, H.; Hosseinjani Zadeh, M.; Ghorbani, A. Enhancing Zn-bearing gossans from GeoEye-1 and Landsat 8 OLI data for non-sulphide Zn deposit exploration. Egypt. J. Remote Sens. Space Sci. 2024, 27, 93–107. [Google Scholar] [CrossRef]
  16. Bouabdellah, M.; Sangster, D.F. Geology, Geochemistry, and Current Genetic Models for Major Mississippi Valley-Type Pb–Zn Deposits of Morocco. In Mineral Deposits of North Africa; Springer: Cham, Switzerland, 2016. [Google Scholar] [CrossRef]
  17. Rddad, L.; Bouhlel, S. The Bou Dahar Jurassic carbonate-hosted Pb-Zn-Ba deposits (Oriental High Atlas, Morocco): Fluid-inclusion and C-O-S-Pb isotope studies. Ore Geol. Rev. 2016, 72, 1072–1087. [Google Scholar] [CrossRef]
  18. Michard, A.; Hoepffner, C.; Soulaimani, A.; Baidder, L. The Variscan Belt. In Continental Evolution: The Geology of Morocco; Michard, A., Saddiqi, O., Chalouan, A., de Lamotte, D.F., Eds.; Springer: Cham, Switzerland, 2008; p. 116. [Google Scholar]
  19. Agard, J.; Dresnay, D.R. Les gîtes plombo-zincifères du jbel Bou Dahar près de Beni-Tajjite (Haut Atlas oriental). Notes Mém. Serv. Géol. Maroc 1965, 181, 135–166. [Google Scholar]
  20. Blomeier, D.P.G.; Reijmer, J.J.G. Facies architecture of an early jurassic carbonate platform slope (Jbel Bou Dahar, High Atlas, Morocco). J. Sediment. Res. 2002, 72, 462–475. [Google Scholar] [CrossRef]
  21. Verwer, K.; Oscar, M.T.; Kenter, J.A.M.; Della Porta, G. Evolution of a high-relief carbonate platform slope using 3D digital outcrop models: Lower jurassic djebel bou dahar, high atlas, Morocco. J. Sediment. Res. 2009, 79, 416–439. [Google Scholar] [CrossRef]
  22. Cooley, T.; Anderson, G.P.; Felde, G.W.; Hoke, M.L.; Ratkowski, A.J.; Chetwynd, J.H.; Gardner, J.A.; Adler-Golden, S.M.; Matthew, M.W.; Berk, A.; et al. FLAASH, a MODTRAN4-Based Atmospheric Correction Algorithm, Its Application and Validation. In Proceedings of the IEEE International Geoscience and Remote Sensing Symposium, Toronto, ON, Canada; 2002; Volume 3, pp. 1414–1418. [Google Scholar] [CrossRef]
  23. Drusch, M.; Del Bello, U.; Carlier, S.; Colin, O.; Fernandez, V.; Gascon, F.; Hoersch, B.; Isola, C.; Laberinti, P.; Martimort, P.; et al. Sentinel-2: ESA’s Optical High-Resolution Mission for GMES Operational Services. Remote Sens. Environ. 2012, 120, 25–36. [Google Scholar] [CrossRef]
  24. Fujisada, H. Design and Perfonnance of ASTER Instrument. In Advanced and Next-Generation Satellites; Fujisada, H., Sweeting, M.N., Eds.; Society of Photo-Optical Instrumentation Engineers (SPIE) Conference Series; SPIE: Bellingham, WA, USA, 1995; Volume 2583, pp. 16–25. [Google Scholar] [CrossRef]
  25. Irons, J.R.; Dwyer, J.L.; Barsi, J.A. The next Landsat satellite: The Landsat Data Continuity Mission. Remote Sens. Environ. 2012, 122, 11–21. [Google Scholar] [CrossRef]
  26. Pour, A.B.; Hashim, M. Identification of hydrothermal alteration minerals for exploring of porphyry copper deposit using ASTER data, SE Iran. J. Asian Earth Sci. 2011, 42, 1309–1323. [Google Scholar] [CrossRef]
  27. Crowley, J.K.; Brickey, D.W.; Rowan, L.C. Airborne imaging spectrometer data of the Ruby Mountains, Montana: Mineral discrimination using relative absorption band-depth images. Remote Sens. Environ. 1989, 29, 121–134. [Google Scholar] [CrossRef]
  28. Hunt, G.R. Spectral signature of particulate minerals in the visible and near infrared. Geophysics 1977, 42, 501–513. [Google Scholar] [CrossRef]
  29. Mars, J.C.; Rowan, L.C. Regional mapping of phyllic- and argillic-altered rocks in the zagros magmatic arc, Iran, using advanced spaceborne thermal emission and reflection radiometer (ASTER) data and logical operator algorithms. Geosphere 2006, 2, 161–186. [Google Scholar] [CrossRef]
  30. Manuel, R.; Brito, M.d.G.; Chichorro, M.; Rosa, C. Remote sensing for mineral exploration in central Portugal. Minerals 2017, 7, 184. [Google Scholar] [CrossRef]
  31. Schowengerdt, R.A. Remote Sensing: Models and Methods for Image Processing, 3rd ed.; Academic Press: Orlando, FL, USA, 2007. [Google Scholar]
  32. Kruse, F.A.; Lefkoff, A.B.; Boardman, J.W.; Heidebrecht, K.B.; Shapiro, A.T.; Barloon, P.J.; Goetz, A.F.H. The Spectral Image Processing System (SIPS) Interactive Visualization and Analysis of Imaging Spectrometer Data. J. South Am. Earth Sci. 1993, 44, 145–163. [Google Scholar]
  33. Weyermann, J.; Schläpfer, D.; Hueni, A.; Kneubühler, M.; Schaepman, M. Spectral Angle Mapper (SAM) for anisotropy class indexing in imaging spectrometry data. Imaging Spectrom. XIV 2009, 7457, 74570B. [Google Scholar] [CrossRef]
  34. Petropoulos, G.P.; Kalivas, D.P.; Georgopoulou, I.A.; Srivastava, P.K. Urban vegetation cover extraction from hyperspectral imagery and geographic information system spatial analysis techniques: Case of Athens, Greece. J. Appl. Remote Sens. 2015, 9, 096088. [Google Scholar] [CrossRef]
  35. Loughlin, W.P. Principal component analysis for alteration mapping. Photogramm. Eng. Remote Sens. 1991, 57, 1163–1169. [Google Scholar]
  36. Rowan, L.C.; Mars, J.C. Lithologic mapping in the Mountain Pass, California area using Advanced Spaceborne Thermal Emission and Reflection Radiometer (ASTER) data. Remote Sens. Environ. 2003, 84, 350–366. [Google Scholar] [CrossRef]
  37. Bouabdellah, M.; Boukirou, W.; Potra, A.; Melchiorre, E.; Bouzahzah, H.; Yans, J.; Zaid, K.; Idbaroud, M.; Poot, J.; Dekoninck, A.; et al. Origin of the moroccan touissit-bou beker and jbel bou dahar supergene non-sulfide biomineralization and its relevance to microbiological activity, late miocene uplift and climate changes. Minerals 2021, 11, 4001. [Google Scholar] [CrossRef]
  38. Merino-Tomé, Ó.; Della Porta, G.; Kenter, J.A.M.; Verwer, K.; Harris, P.M.; Adams, E.W.; Playton, T.; Corrochano, D. Sequence development in an isolated carbonate platform (Lower Jurassic, Djebel Bou Dahar, High Atlas, Morocco): Influence of tectonics, eustacy and carbonate production. Sedimentology 2012, 59, 118–155. [Google Scholar] [CrossRef]
Figure 1. A structural geological map of major provinces of Morocco modified [18].
Mining 04 00018 g001
Figure 2. Geological map of JBD carbonate platform after [16,19].
Mining 04 00018 g002
Figure 3. Lithostratigraphic column of JBD [17].
Mining 04 00018 g003
Figure 4. Hand specimens illustrating the characteristic features of sulfide and non-sulfide minerals in the Bou Dahar ore district: (a) galena, identified as patches; (b) sphalerite, occurring as massive patches; (c) iron oxide; (d) hydrozincite with smithsonite and calcite; (e) smithsonite as botryoidal aggregates and galena as euhedral crystals; (f) galena in massive forms.
Mining 04 00018 g004
Figure 5. Spectral reflectance profiles of hematite, goethite, calcite, dolomite, muscovite, and kaolinite from the UGS Spectra Library, resampled according to ASTER (red line), Landsat-8 (blue line), and Sentinel-2 (green line) band ranges.
Mining 04 00018 g005
Figure 6. The location and geometric configuration of the regions of interest (ROIs) employed for training the SAM algorithm.
Mining 04 00018 g006
Figure 7. Regional representation of lithological units and mineralized zones using the RGB-FCC. Selected bands for the following: (a) Sentinel-2 image (R: band 11; G: band 4; B: band 2); (b) ASTER image (R: band 4; G: band 2; B: band 1); (c) Landsat-8 image (R: band 7; G: band 4; B: band 2). Active mine locations are delineated within target zones.
Mining 04 00018 g007
Figure 8. Band ratio image-maps show the spatial distribution of iron oxide minerals, OH-bearing minerals, and carbonate minerals: (a) band ratio B4/B2 in the Sentinel-2 image showing the iron oxide mineral distribution (target zone indicates mineralized zones, with bright pixels denoting the presence of iron oxide minerals); (b) band ratio B11/B12 in the Sentinel-2 image with the distribution of carbonate and OH-bearing minerals; (c) band ratio B4/B2 in the Landsat-8 image with the iron oxide mineral distribution; (d) band ratio B6/B7 in the Landsat-8 image highlighting the distribution of carbonate and OH-bearing minerals.
Mining 04 00018 g008
Figure 9. Spatial distribution maps of mineralogy using band ratios in ASTER data: (a) iron oxide (B2/B1); (b) carbonate ((B7 + B9)/B8); (c) dolomite ((B6 + B8)/B7); (d) OH-bearing ((B5 + B7)/B6); (e) vegetation (B3/B2); (f) quartz (B14/B12).
Mining 04 00018 g009
Figure 10. Maps derived from PCA, highlighting iron oxide minerals, OH-bearing minerals, and carbonate minerals as bright pixels: (a) PC4 image from Sentinel-2 illustrating iron oxide minerals; (b) PC5 image from Sentinel-2 displaying OH-bearing minerals and carbonate minerals; (c) PC4 image from Landsat-8 highlighting iron oxide minerals; (d) PC5 image from Landsat-8 showing OH-bearing minerals and carbonate minerals; (e) PC3 image from ASTER with the spatial distribution of carbonate minerals.
Mining 04 00018 g010
Figure 11. SAM maps of (a) ASTER image; (b) Landsat-8 image; (c) Sentinel-2 image in the JBD study area.
Mining 04 00018 g011
Figure 12. Comparative analysis of pixel classification across satellite sensors: ASTER, Landsat-8, Sentinel-2.
Mining 04 00018 g012
Figure 13. High-resolution GeoEye images from Google Earth (a,b,c,d) showing the extracted mineralized veins, carbonate rocks, gabbro–diorite intrusions and CAMP basalts; and field pictures (e,f) detailing the presence of some minerals in the study area.
Mining 04 00018 g013
Table 1. Specifications and characteristics of ASTER, Landsat-8, and Sentinel-2 sensors [23,24,25].
Sensor Spectral RegionBand NumberSpectral Range (μm)Spatial Resolution
ASTERVNIR10.520–0.60015 m
20.630–0.690
3N0.780–0.860
SWIR41.600–1.70030 m
52.145–2.185
62.185–2.225
72.235–2.285
82.295–2.365
92.360–2.430
TIR108.125–8.47590 m
118.475–8.825
128.925–9.275
1310.25–10.95
1410.95–11.65
Landsat-8VNIRPAN (8)0.500–0.68015 m
Coastal aerosol (1)0.433–0.45330 m
Blue (2)0.450–0.515
Green (3)0.525–0.600
Red (4)0.630–0.680
NIR (3)0.845–0.885
SWIRSWIR1 (6)1.560–1.660
SWIR2 (7)2.100–2.300
Cirrus (9)1.360–1.390
TIRTIRS1 (10)10.60–11.19100 m
TIRS2 (11)11.50–12.51
Sentinel-2VNIRCoastal aerosol (1)0.433–0.45360 m
Blue (2)0.458–0.52310 m
Green (3)0.543–0.578
Red (4)0.650–0.680
Vegetation Red Edge (5)0.698–0.71320 m
Vegetation Red Edge (6)0.733–0.748
Vegetation Red Edge (7)0.773–0.793
NIR (8)0.785–0.90010 m
Water-vapor (9)0.935–0.95560 m
SWIRSWIR-Cirrus (10)1.360–1.390
SWIR1 (11)1.565–1.65520 m
SWIR2 (12)2.100–2.280
Table 2. Specification of regions of interest (ROIs) used in the SAM algorithm.
SensorsSentinel-2Landsat-8ASTER
ROI ClassPixel. NoCoverage Area (m2)Pixel. NoCoverage Area (m2)Pixel. NoCoverage Area (m2)
Do1616004360081800
Cp10010,0002219,8005913,275
Sl5252001412,600347650
Lm9696001513,5004810,800
Ss43943,9006054,00020145,225
CE15115,1002724,3007817,550
Cb9797001816,2005111,475
Pc32532,5005448,60016236,450
Al1309130,900164147,600598134,550
GD17170043600102250
Or6969001311,700378325
Bs353500109000173825
Ml4747001210,800286300
Od121200654004900
Vg8181001614,400429450
Table 3. Eigenvector matrix resulting from the Principal Component Analysis applied to the VNIR and SWIR bands of the ASTER data.
EigenvectorsBand 1Band 2Band 3Band 4Band 5Band 6Band 7Band 8Band 9% Total VarianceCumulative %
PC10.20460.28860.30600.41460.35180.35470.36520.33620.336693,38193,381
PC20.46990.51280.5292−0.1975−0.2332−0.2466−0.1685−0.0508−0.22594.04297,422
PC30.29290.0929−0.4442−0.4978−0.0691−0.15590.23000.59650.15051.35198,774
PC40.47550.2369−0.56350.21420.22480.21160.0152−0.3403−0.37820.47599,249
PC5−0.1639−0.13350.10150.2515−0.0610−0.10520.30020.4305−0.76910.37599,625
PC60.5504−0.72390.2663−0.14030.2313−0.03640.1281−0.1026−0.02320.13199,756
PC7−0.25290.13750.1676−0.62810.22010.47560.3453−0.2230−0.22580.10099,856
PC8−0.16710.1678−0.0114−0.02110.5714−0.70380.2780−0.20580.04240.08199,937
PC90.0609−0.0075−0.04490.1321−0.5782−0.10190.6943−0.35330.15870.063100
Table 4. Eigenvector matrix resulting from the Principal Component Analysis applied to the VNIR and SWIR bands of the Sentinel-2 data.
EigenvectorsBand 2Band 3Band 4Band 8Band 11Band 12% Total VarianceCumulative %
PC10.21860.27590.37860.50750.53950.429291,65491,654
PC20.45150.45750.30900.2270−0.5259−0.40406.22497,878
PC3−0.4605−0.33140.03640.7309−0.0605−0.37271.59799,475
PC40.38350.1473−0.80240.25690.2680−0.22270.30899,784
PC50.0347−0.0737−0.28910.3004−0.59720.68040.18499,968
PC6−0.62290.7600−0.1802−0.0228−0.01550.03400.032100
Table 5. Eigenvector matrix resulting from the Principal Component Analysis applied to the VNIR and SWIR bands of the Landsat-8 data.
EigenvectorsBand 1Band 2Band 3Band 4Band 5Band 6Band 7% Total VarianceCumulative %
PC10.13420.15710.25900.36740.43630.55720.504490,24590,245
PC2−0.3849−0.4109−0.4896−0.3266−0.13810.42970.36466.97397,218
PC30.25280.22940.17410.0086−0.80460.00730.45352.15499,371
PC40.34470.32710.1109−0.79740.14870.2968−0.12620.36099,732
PC50.0422−0.0117−0.0432−0.26740.3439−0.64520.62460.21899,950
PC6−0.5321−0.22210.7834−0.2251−0.0530−0.00020.01850.04299,992
PC70.6051−0.77290.1871−0.0179−0.00380.0224−0.02490.008100
Table 6. The results of the SAM classification algorithm.
SatelliteOverall AccuracyKappa Coefficient
ASTER 93.76%0.92
Landsat-883.37%0.79
Sentinel-276.21%0.69
Table 7. The confusion matrix of the ASTER image obtained using the SAM method.
ClassDoCpSlLmSsCECbPcAlGDOrBsMlOdVgTotalProducer’s Accuracy (%)User’s Accuracy (%)
Unclassified0000000000000000
Do8700000000000001510053.33
Cp05200000100000005388.1498.11
Sl00201000800400003358.8260.61
Lm00045000800000005393.7584.91
Ss00002010000000000201100100
CE00000780000010038210095.12
Cb00000042600000004882.3587.50
Pc0001009121000000013174.6992.37
Al00000000598000000598100100
GD001100015010400003110032.26
Or001100002002900004278.3869.05
Bs00000000000160001694.12100
Ml00200001000028003110090.32
Od0000000000000404100100
Vg00000000000000393992.86100
Total85934482017851162598103717284421377
Table 8. The confusion matrix of the Landsat-8 image obtained using the SAM method.
ClassDoCpSlLmSsCECbPcAlGDOrBsMlOdVgTotalProducer’s Accuracy (%)User’s Accuracy (%)
Unclassified0000000000000055
Do4300003000000001010040
Cp01900000000000001986.36100
Sl007100030000000115063.64
Lm0007003700400002146.6733.33
Ss00106000100000006210096.77
CE000002700000000027100100
Cb00000051700000002227.7822.73
Pc00030042300000003042.5976.67
Al00000000164000000164100100
GD000000030410000810050
Or0064003000700001453.8550
Bs000000000001000010100100
Ml00000000001012001910063.16
Od0000000000000606100100
Vg00000000000000111168.75100
Total42214156027185416441310126116439
Table 9. The confusion matrix of the Sentinel-2 image obtained using the SAM method.
ClassDoCpSlLmSsCECbPcAlGDOrBsMlOdVgTotalProducer’s Accuracy (%)User’s Accuracy (%)
Unclassified003000100000033542
Do1224000003197000000236755.08
Cp3760000100000000807695
Sl002130000001700004140.3851.22
Lm001759006880025000019561.4630.26
Ss00004390000000000439100100
CE0000015100000001015210099.34
Cb00000021118040000014321.6514.69
Pc00010004102000000011631.3887.93
Al100000101112000000111484.9599.82
GD000000170013000003076.4743.33
Or002200046120027000010739.1325.23
Bs000000000003500035100100
Ml00940002000047006210075.81
Od000000000000080866.67100
Vg00000000000000464656.79100
Total1610052964391519732513091769354712812846
Table 10. Pixel classification comparison for different sensors: ASTER, Landsat-8, Sentinel-2.
SensorsASTERLandsat-8Sentinel-2
ClassNo. Pixel of ROINo. Pixel ClassifiedNo. Pixel MisclassifiedNo. Pixel of ROINo. Pixel ClassifiedNo. Pixel MisclassifiedNo. Pixel of ROINo. Pixel ClassifiedNo. Pixel Misclassified
Unclassified-----5--42
Do8874461612224
Cp5952122190100764
Sl3420131474522120
Lm48458157149659136
Ss2012010606024394390
CE78784272701511511
Cb51426185179721122
Pc162121105423732510214
Al59859801641640130911122
GD101021444171317
Or3729131377692780
Bs171601010035350
Ml2828312127474715
Od4406601280
Vg423901611081460
Total13771291864393667328462169677
Disclaimer/Publisher’s Note: The statements, opinions and data contained in all publications are solely those of the individual author(s) and contributor(s) and not of MDPI and/or the editor(s). MDPI and/or the editor(s) disclaim responsibility for any injury to people or property resulting from any ideas, methods, instructions or products referred to in the content.

