Article

Interactions of Low-Energy Muons with Silicon: Numerical Simulation of Negative Muon Capture and Prospects for Soft Errors

by
Jean-Luc Autran
1,2,* and
Daniela Munteanu
1
1
Aix-Marseille Univ, CNRS, IM2NP (UMR 7334), 13397 Marseille, CEDEX 20, France
2
Univ. Rennes, CNRS, IPR (UMR 6251), 35042 Rennes, CEDEX, France
*
Author to whom correspondence should be addressed.
J. Nucl. Eng. 2024, 5(1), 91-110; https://0-doi-org.brum.beds.ac.uk/10.3390/jne5010007
Submission received: 30 December 2023 / Revised: 22 January 2024 / Accepted: 29 January 2024 / Published: 5 March 2024

Abstract

:
In this paper, the interactions of low-energy muons (E < 10 MeV) with natural silicon, the basic material of microelectronics, are studied by Geant4 and SRIM simulation. The study is circumscribed to muons susceptible to slowdown/stop in the target and able to transfer sufficient energy to the semiconductor to create single events in silicon devices or related circuits. The capture of negative muons by silicon atoms is of particular interest, as the resulting nucleus evaporation and its effects can be catastrophic in terms of the emission of secondary ionizing particles ranging from protons to aluminum ions. We investigate in detail these different nuclear capture reactions in silicon and quantitatively evaluate their relative importance in terms of number of products, energy, linear energy transfer, and range distributions, as well as in terms of charge creation in silicon. Finally, consequences in the domain of soft errors in microelectronics are discussed.

Graphical Abstract

1. Introduction

Muons originate in the Earth’s atmosphere as secondary particles resulting from the interaction between high-energy cosmic rays and atmospheric particles. Their high speeds induce relativistic effects, allowing a considerable number of muons to reach the Earth’s surface. Upon reaching the surface, they interact with matter and can be detected using various detectors and experimental setups that capitalize on the unique characteristics of these particles. The interaction of muons with silicon is crucial to the functionality of numerous particle detectors, employed in high-energy physics experiments [1] and applications such as medical imaging. As charged particles, muons have the potential to affect microelectronic devices and circuits through their interaction with semiconductor materials [2]. For instance, muons can cause single-event upsets (SEUs) in static random-access memories (SRAMs), where a charged particle such as a muon strikes a sensitive node within an SRAM cell, resulting in a bit flip [3,4,5,6,7]. In charge-coupled devices (CCDs), muons, like other ionizing particles, can induce single-event effects (SEEs), leading to pixel-level errors and impacting the accuracy of recorded images [8,9,10]. The interaction of muons with the CCD substrate can also contribute to an increase in radiation-induced dark current, resulting in elevated background noise in images and reducing the ability to discern faint details.
Since atmospheric radiation is particularly complex in terms of particle composition (neutrons, protons, and muons in particular) and energy range (from thermal energies to tens of GeV), the effects of muons on electronics have been specifically isolated and characterized using monoenergetic muon beams in particle accelerators [3,4,5,6,7,11,12], benefiting from and supporting experimental facilities and advances in muon spin spectroscopy [13,14]. In particular, these studies have highlighted the differences between the effects of positive and negative muons on SRAM memories, also as a function of their energy. All these experimental results under beam conditions, together with other previous works [15,16,17], show or suggest that in practice only a small fraction of atmospheric muons are likely to be a potential threat to electronics—especially those with low energies, typically below a few MeV. This is because the average stopping power of atmospheric muons is significantly lower than that of protons, alpha particles, or heavy ions. In other words, for the vast majority of muons (those above a few MeV of energy), the energy deposited by these atmospheric particles in silicon through direct ionization is very low, and the resulting charge (electron–hole pairs created) is negligible, even for modern electronics. As we will see later, the muon stopping power in silicon peaks at an energy in the 1–10 keV range [3]. This means that only sufficiently slowed atmospheric positive or negative muons entering the silicon layer will be able to deposit significant charge in sensitive areas of the circuit. Additionally, negative muons stopping in silicon can be captured by atoms, producing secondary particles such as protons, alphas, and ions ranging from lithium to aluminum. These secondary particles are efficient vectors for energy deposition and thus charge generation in the semiconductor material.
The mechanism of negative muon capture has previously been recognized as a significant threat to electronics, with its impact on device and circuit operation experimentally demonstrated [4,5,6,7]. This study aims to thoroughly investigate negative muon capture, specifically focusing on various nuclear capture reactions in silicon. The objective is to quantitatively assess their relative significance in terms of the number of products, energy, linear energy transfer, and range distributions, as well as their impact on charge creation in silicon. The implications of these findings in the realm of single-event occurrence and soft errors in microelectronics will be discussed in the final part of the study.
This paper is organized as follows: in Section 2, we briefly review the formation of muons in the atmosphere and the interactions of low-energy positive and negative muons with silicon, describing in detail the mechanisms leading to the capture of negative muons by silicon atoms. We also present the physical models and simulation tools used in this study. Section 3 presents our main results concerning the detailed analysis of the main nuclear reactions following the capture of negative muons. We detail the nature and percentage of muon nuclear capture reactions in silicon and specify the nature and percentage of secondary products. We also report a detailed analysis of the emitted neutrons as well as the energy distribution of the emitted light particles. Finally, Section 4 discusses the implications of these results in terms of the evolving risks of single-event effects in modern electronics.

2. Materials and Methods

2.1. Materials Properties

This study examines the interactions of low-energy muons with natural silicon, the basic material of microelectronics wafers. Table 1 lists the three isotopes of silicon and their natural abundances [18] considered in the following sections for the simulation of the passage of muons through this material. Table 2 summarizes several atomic and electronic properties of silicon, such as its density, number of atoms per cm3, energy bandgap, and energy value for electron–hole pair formation in bulk silicon [18].

2.2. Muons in the Atmosphere and Flux at the Sea Level

Muons are subatomic particles that belong to the family of leptons, which also includes electrons and neutrinos. They are elementary particles similar to electrons, with a unitary negative electric charge, but they are around 200 times more massive. The muon, denoted as μ and often referred to as the “negative muon”, has a corresponding particle of opposite charge and equal mass: the anti-muon, often called the “positive muon” ( μ + ).
Muons are primarily formed in the Earth’s atmosphere through the interaction of high-energy cosmic rays from space with atmospheric particles. Cosmic rays are high-energy particles, primarily protons, helium nuclei, and heavy ions, that originate from various sources in space. They come from all directions in deep space and from the Sun. When these cosmic rays enter the Earth’s atmosphere, they collide with the nuclei of atmospheric atoms (such as nitrogen and oxygen). These collisions result in the creation of a cascade of secondary particles. Among these are pions (positive pions, π + , and negative pions, π ) and kaons (positive kaons, K + and negative kaons, K ). Since their lifetime is less than the time it takes to travel to sea level, these particles will spontaneously decay if they do not interact after they are created. This decay process produces highly energetic muons [17] according to:
π + μ + + ν μ π μ + ν μ ¯ K + μ + + ν μ K μ + ν μ ¯
where ν μ and ν μ ¯ are the muon neutrino and the muon antineutrino, respectively. Formed at an average altitude of 15 km, muons have a high probability of reaching the Earth’s surface without triggering new cascades. They lose about 2 GeV of energy, only leaving an ionization wake in the atmosphere [17].
Both positive and negative muons are unstable and have a relatively short lifetime, with an average decay time of about 2.2 microseconds. Independently of any interaction with matter, they spontaneously decay into three particles through the weak force. Positive muons decay into one positron, one electron neutrino ( ν e ), and one muon antineutrino. Negative muons decay into one electron, one electron antineutrino ( ν e ¯ ), and one muon neutrino.
μ + e + + ν e + ν μ ¯ μ e + ν e ¯ + ν μ
Due to their high velocities, which can approach the speed of light, the muons experience time dilation according to Einstein’s theory of special relativity. This means that, from the perspective of an observer on Earth, the muons have a longer effective lifetime than they would if they were at rest. Despite their relatively short intrinsic lifetime, the time dilation effect allows a significant fraction of these muons to reach the Earth’s surface.
Of all the types of particles that reach sea level, muons are the most abundant. The total integrated flux (positive and negative muons) above 1 MeV is about 60 µ/cm2/h, as estimated by the EXPACS model [19]. The order of magnitude of one muon per square centimeter per minute for horizontal detectors is well known to high-energy physicists [20,21]. This is the equivalent of ~70 m−2 s−1 sr−1 above 1 GeV. This value may vary depending on geographic location, altitude, and other environmental factors [17]. Studies of muons at ground level and underground are numerous in the literature, but most of these papers deal with high-energy physics or particle physics with energies generally above GeV [22]. In the case of muon effects on electronics, we are clearly in a much lower energy range, typically corresponding to muons that can be stopped in the silicon of circuits. This depends on the incident path of the muons and the layers of material they pass through before entering the silicon. Considering an outdoor encapsulated electronic device, the relevant energy range tends to be in the 1–10 MeV range and below [2], an energy range that not only represents a small contribution to the total muon flux (less than 1 µ/cm2/h), but is also insufficiently covered by most characterization studies conducted to date. For the prediction of radiation effects in microelectronics, this lack of knowledge in the characterization of low-energy muons (typically below 10 MeV) at ground level is a challenging problem [6].
The charge ratio is another important characteristic of muons at sea level. From decades of observations, we know that the number of positively charged muons exceeds the number of negatively charged muons over a wide range of energies [2]. This muon charge ratio results from the excess of π + over π and K + over K in the forward fragmentation region of proton-initiated interactions, combined with the presence of more protons than neutrons in the primary spectrum. A typical muon charge ratio for muon momentum below 1 GeV/c is thus around 1.1–1.2 [20].

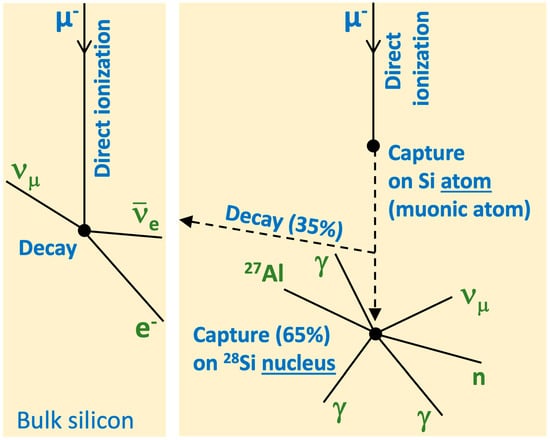
2.3. Interactions of Muons with Silicon

As already explained, muons have short lifetimes, but because of their relativistic nature, they are easily able to reach the level of the sea, where they are the most abundant charged particles. Muons do not interact with matter via strong forces but only through weak and electromagnetic forces. They can travel large distances in matter, thus deeply penetrating material circuits. Because the atmospheric spectrum of muon covers more than twelve decades of muon kinetic energy (with a peak at 3 GeV), these particles interact with matter following various processes, including ionization and bremsstrahlung at low and intermediate energies (E < 1 GeV), to multiple scattering, nuclear interactions, and even pair production at higher energies (E >> 10 GeV). Below a few MeV of energy, the interactions of muons with silicon primarily include direct ionization and nuclear capture [16,23]. The first process is related to the interaction of both positive and negative muons with silicon, while the nuclear capture involves uniquely negative muons stopping in the considered target semiconductor, as illustrated in Figure 1. Direct ionization and negative muon capture are detailed in the next subsections.

2.3.1. Direct Ionization of Muons in Silicon

Muons, being charged particles, lose their kinetic energy as they pass through the semiconductor material by excitation of bound electrons. As a result, electron–hole pairs are released along their path. This process, called direct ionization [2,24], is important for low-energy muons with energies typically below a few MeV but superior to 2 keV (see Section 2.3.2 and Section 2.5). The effect is primarily dominated by the charge and velocity of the particle, as shown by calculations of the energy loss due to electronic stopping. Then, although muons and protons have different masses, a muon with the same velocity as a proton will cause the same ionization [3]. We remind the reader that two key quantities can be introduced to characterize the energy transfer from an ionizing particle to the target material: the linear energy transfer (LET) and the range. The LET of a charged particle (typically expressed in units such as MeV/(mg/cm2) or keV/μm) refers to the electronic part of its stopping power, which denotes the energy dissipated per unit length as a result of electron collisions [2,24]. The range of a charged particle is the distance covered by the particle from its emission point until it completely decelerates and stops in the matter. The LET and range values essentially depend on factors such as the particle type, the initial energy, and the medium (i.e., the target material) through which the particle passes. LET and range curves versus energy for muons in silicon will be presented in Section 3.1.

2.3.2. Capture of Low-Energy Muon in Silicon

At very low energies, below 2 keV, an additional mechanism involves only negative muons that can be captured by an atom. The capture of negative muons is a complex mechanism that may be at the origin of the production of large particle showers in matter, as will be explained below. If the energy of the incoming muon exceeds 2 keV, its velocity will be higher than that of the valence electrons (the Bohr velocity) [25]. As a result, the muon passes through the target material, causing the electrons to be ejected. In the low-energy phase (less than 2 keV) up to rest, the velocity of the muon is lower than that of the valence electrons. The muon can then exchange energy with the electron gas in small steps (in about 10−13 s) and quickly come to rest [25]. The muon is then attracted by the Coulomb field of the nucleus [26] and it is captured by the host atom in high orbital momentum states, resulting in the creation of a muonic atom [25,26]. Rapid electromagnetic cascades follow, bringing the muon down to the innermost 1s Bohr level orbit. The time for a muon trapped in an atom to cascade down to the lowest Bohr orbit (1s) is negligible compared to its natural lifetime, as shown by Fermi and Teller [27]. The muon cascade to the ground state of the atom is accompanied by the emission of Auger electrons and radiative transition [26]. After reaching the 1s orbit, the muon either decays or is captured by the nucleus via weak interaction. As a muon is 200 times heavier than an electron, its 1s orbit is largely inside the nucleus and then has a high probability of combining with a proton via weak interaction [17]. The ratio of the capture probability to the decay probability depends on the atomic number Z. This ratio is of the order of 4 × 10⁻⁴ in hydrogen; it is 1 around Z = 11 and 25 for heavy nuclei (Z~50) [25]. For silicon, this ratio has been estimated to be between 1.72 and 1.93 [28].
The muon nuclear capture mechanism has been extensively studied and explained in detail in the literature [25,29,30,31,32]. The emission of particles after the capture of muons in intermediate and heavy nuclei has been described in detail in [25,26,30]. Here is just a summary of the general lines of the process. Due to the weak interaction, the following nuclear reaction occurs:
μ + A Z N ν μ + X
where X is a detectable product consisting of a residual heavy nucleus and light particles. As explained in [25], the average excitation energy in muon nuclear capture is around 15 to 20 MeV, above the threshold for nucleon emission in all complex nuclei. Thus, the daughter nucleus (A*, Z − 1) can de-excite by emitting particles and through the electromagnetic mode. The particles emitted are one or more neutrons and/or light charged particles. Light nuclei are more likely than heavy nuclei to emit charged particles. In the case of intermediate and heavy nuclei, the light particles are usually neutrons, gamma rays, or both. Very small percentages (a few percent) of lightly charged particles have also been observed. These particles are mostly protons. Even smaller amounts of deuterons and alpha particles have also been observed [30].
There are many possible channels for the nuclear muon capture reactions, but the emission of neutrons is the preferential channel [25]. This neutron emission can be roughly classified as either direct or from an intermediate “compound nucleus” that is formed after the muon capture process has taken place [30]. Neutrons produced by direct emission are neutrons produced in the elementary process:
μ + p n + ν μ
that manage to escape from the nucleus. These neutrons have relatively high energies, from a few MeV to 40–50 MeV [33]. Nevertheless, most of the neutrons emitted after muon capture appear to be “evaporation neutrons”. As explained in [30], in intermediate and heavy nuclei, the excitation energy acquired by the neutron formed during the capture process is shared with the other nucleons in the nucleus, and a “compound nucleus” is formed. The intermediate excited nuclear state then loses energy through evaporation of mainly low-energy neutrons. In order to explain this process, the following physical picture, which implies a two-step process, is used in [30]. First, the muon is captured by a quasi-free nucleon. The acquired energy is distributed among the nucleons of the nucleus, forming a compound nucleus:
μ + A Z N ν μ + A Z 1 N *
Then, the excited nuclear state loses energy by evaporating nuclear particles (mainly neutrons) and emitting γ rays until a ground state is reached.
In the case of silicon, an average of about 35% of the negative muons that stop in the material decay into one electron and two neutrinos. The remaining 65% are captured [28]. For muon nuclear capture in silicon, if we assume an intermediate state, the nuclear reaction is as follows:
μ + S i 28 A l * 28 + ν μ + 100.5   M e V
In Ref. [34], the authors measured the energy spectrum for the emission of charged particles resulting from the capture of muons in 28Si following certain modes of de-excitation of the fragment nucleus of 28Al:
A l * A l + n ( 12.4   M e V ) 27 28 A l * 28 M g + p ( 14.2   M e V ) 27 A l * 28 N a + α ( 15.5   M e V ) 24 A l * 28 M g + d ( 18.4   M e V ) 26
where the energy indicated with each final state is the energy of the ground state relative to the 28Si ground state. All of these channels of de-excitation of 28Al* as well as other possible reactions will be analyzed and discussed in Section 3.2.

2.4. Calculation of LET and Range for Low-Energy Muons

As reported previously in several works [2,35] and despite being leptons like electrons, muons can be considered light protons for their transport in matter. The reason is that unlike electrons, the quantum effects of the muon Coulomb elastic scattering are practically negligible, affecting only small scattering angles [23]. Their LET and energy-range relations can be thus computed by applying mass scaling to the proton data [35], knowing that the muon rest mass mμ with respect to the proton mass mp is 8.880 times lower, which gives mμ = 0.1135 × mp [36].
However, such a very useful approximation is limited to an energy of at least 2 keV, since below this limit negative muons are susceptible to being captured by silicon atoms and positive muons can undergo charge exchange collisions and muonium formation. This additional mechanism is beyond the scope of this paper. Briefly, a positive muon can directly capture an electron from silicon atoms to form a muonium (Mu or µ+e) and lose its electron to become a µ+ again [37]. After emerging from these charge exchange mechanisms, the positive muon enters a final thermalization regime, from the energy of the last Mu formation to kT [37]. In the case of solid materials, this regime of muonium formation and charge exchange at such a low energy level is not yet fully understood. Therefore, it seems reasonable to limit the estimation of LET and ranges, according to the conventional methods applicable to fast heavy particles, for muon kinetic energies above 2 keV [27]. In the following sections, we used SRIM (“Stopping and Range of Ions in Matter”) [38,39], a proprietary software which calculates tables of ion transport in matter from data computed with the Monte Carlo code TRIM (“Transport of Ions in Matter”) [38,39], to simulate muon slowdown down to 2 keV in silicon and to compute muon LET and range numerical data.

2.5. Geant4 Simulation Details

To study the negative muon capture process in silicon in detail, Monte Carlo simulations of the interactions between very-low-energy muons and a bulk silicon target were performed using the Geant4 (version 11.2.0) radiation transport code [40,41,42]. A target of parallelepiped geometry with a surface area of 1 cm2 and a thickness of 100 μm was considered and exposed to 106 negative muons of 1 MeV energy arriving perpendicular to the largest surface of the target.
The physical processes used for these simulations were limited to muon decay, muon ionization (G4MuIonization), and muon capture (G4MuonMinusCapture model with the G4MuMinusCapturePrecompound option enabled). The output of the simulation was a set of files containing exhaustive information about the interaction events between the muons and the target material. This information included, for each event, the type and coordinates of the interaction vertex, the energy of the incident neutron, and a detailed list of all secondary particles produced during the interaction. Additionally, for each event, the energy and emission direction vectors of each emitted particle are recorded. A post-processing of the files combining Geant4 results and SRIM data was used to calculate the LET and range of each secondary product (charged particles) emitted during the nucleus capture process.

3. Results

3.1. Muons LET and Range in Silicon

Figure 2 shows the LET and range (R) of positive low-energy muons (ranging from 2 keV to 10 MeV) in silicon material as given by SRIM when “light” protons with the mass of the muon are considered as projectiles.
These series of discrete tabulated data can be efficiently transformed in the form of fast and continuous numerical functions for intensive simulation, following a methodology previously developed for heavy ions in silicon [43]. In this reference, it has been demonstrated that both the LET and range SRIM tables can be described by the following functions:
L E T E = 10 A ( E )
R E = 10 B ( E )
where E is the muon energy and A(E) and B(E) are two functions of the particle energy.
With respect to reference [43] that used two different types of functions for A(E) and B(E) coefficients, we use, for muons, the same type of functions for both LET and range with different coefficient numbers (note that the order of coefficients is here renumbered with respect to [43]):
A E = p 13 + i = 1 12 p i × l o g 10 ( E ) i
B E = q 10 + i = 1 9 q i × l o g 10 ( E ) i
where coefficients pi and qi correspond to a set of 13 and 10 real coefficients, respectively, given in Table 3.
The values of coefficients reported in Table 3 are valid for muon kinetic energies in the energy domain [2 keV–10 MeV] for the reasons stated in Section 2.5. The upper inset of Figure 2 shows the relative numerical error made on LET and range values when using the functions (8) and (9) instead of the SRIM tabulated values. This error is always less than 0.1%, showing that these numerical approximations work perfectly over the entire energy range of Figure 2. These functions can thus be used to describe with accuracy the ionization path of charged muons in silicon down to 2 keV of energy.
Figure 2 shows that the Bragg peak [2] for muons in silicon is about 8 keV. The LET decreases as the particle kinetic energy (velocity) increases beyond the Bragg peak, as predicted by the Bethe–Bloch equation [1]. Figure 2 also shows that the range of muons in silicon increases continuously with the energy of the particle [2].
Figure 3 compares these range values obtained by SRIM for positive muons in silicon with the distributions of the negative muon capture depth positions obtained by Geant4 for four different energies.
Each distribution is the result of 104 negative muons arriving perpendicular to the silicon surface with an energy of 5, 10, 15, or 20 MeV. Muons penetrate in the silicon target and are slowed down until they are captured by a silicon atom. Because the muons experience ionization events during their slowing down in silicon, which is a stochastic process, their final stopping position is distributed in depth, as shown in Figure 3. SRIM data correspond, for their part, to an average value, the projected range (which corresponds to the depth of the peak concentration determined from TRIM simulations [38]). These values are in very good agreement with the Geant4 data, with a maximum difference of 3% with respect to the average values of the distributions shown in Figure 3. This good agreement between the results obtained for positive and negative muons is consistent with the theoretical results of the muon stopping process [27], which predicts that appreciable differences in the stopping of positive and negative muons should only be visible for kinetic energies below about 2 keV.

3.2. Capture of Low-Energy Negative Muons in Silicon

As previously explained, we used Geant4 to analyze the capture of low-energy negative muons in silicon. We firstly simulated 106 captures of negative muons in targets of silicon composed of 100% of the isotopes 28Si, 29Si, and 30Si and, secondly, with the natural isotopic composition of silicon material (“natural Si”). Table 4 gives, for each material, the percentage of muon decay and muon nuclear capture occurring after the muon atomic captures.
A decay/capture ratio equal to 35%/65% (respectively 34%/66%) was obtained for natural Si (respectively 28Si), in good agreement with previously reported values [31]. Note that the percentage of muon decay (and, respectively, the percentage of nucleus captures) increases (and, respectively, decreases) when increasing the mass number of the Si. There is 10% more decay for 30Si than for 28Si and, consequently, 10% fewer captures. Obviously, the ratio obtained for natural Si is the average of the ratios for the three isotopes, with each value being weighted by the weight of the corresponding isotope in the composition of natural silicon.

3.2.1. Case of a Pure 28Si Target

Before detailing the results for natural Si, the results for a pure 28Si target are examined. This is because it is easier to classify the main capture reactions with only one silicon isotope, and also because it is the nucleus for which most information is available [31,32]. The simulation of 106 atomic captures of negative muons by 28Si yields 343,084 decays and 656,916 nucleus captures. Eliminating neutrinos and antineutrino particles that do not interact with matter, these atomic captures produce the emission of 6,062,324 γ-ray photons (called “gamma” in Geant4), 2,534,605 electrons, 639,910 neutrons, and 876,561 elementary charged particles, light and heavy ions ranging from Z = 1 (protons, deuterons, tritons) to Z = 13 (aluminum ions). The details of these nuclear capture reactions and the particles and fragments produced are given later in this subsection. For now, we are interested in the electrons and γ-ray photons produced in these capture reactions. Table 5 shows an example of raw Geant4 output data for a single capture on 28Si. Auger electrons and X-ray photons are emitted during the first stage of the process, which corresponds to the muon cascade down to the ground state of the muonic 28Si atom. The second stage corresponds to the capture of the muon by the nucleus, which emits a muon neutrino, and the formation of an intermediate state (28Al*), immediately followed by the evaporation of this aluminum nucleus, which can be accompanied by the emission of secondary γ-ray photons during this third stage.
Figure 4 shows the energy distribution of these X-ray/γ-ray photons for all the atomic captures according to the process that generated them (cascade or evaporation). The photons produced during the muon cascade form a series of discrete muonic X-ray peaks ranging from keV to hundreds of keV, visible in Figure 4, while those emitted during nuclear evaporation form a continuum of X-rays/γ-rays from 1 keV to 20 MeV. The X-rays emitted in muonic X-ray transitions have characteristic energies corresponding to the differences in the energy levels of the electron shells involved. These energies are specific to the electronic structure of the atom involved in the process (here, a 28Si atom).
Similar to Figure 4, Figure 5 shows the energy spectrum of the electrons produced during muon capture events. The curve is the sum of two distinct distributions: those associated with the electrons ejected during the muon cascades (corresponding to Auger electrons) and those associated with the electrons emitted during muon decay. Auger electrons exhibit discrete energies ranging from hundreds of eV to hundreds of keV, while decay electrons form a continuum of energy from about 1 to 60 MeV.
We now turn our attention to the nuclear reactions that take place immediately after the muons are captured, leading to the evaporation of the nucleus which emits neutrons and charged fragments. These fragments are susceptible to depositing significant amounts of energy in the silicon material. Table 6 gives the main muon nuclear capture reactions and percentages from the total number of nuclear captures in 28Si. It also indicates the global percentages of reactions per secondary heavy fragments produced.
Of 656,916 nucleus captures, 517,495 (78.8%) produced at least one neutron: 396,175 (60.3%) reactions gave one neutron, 120,225 (18.3%) gave two neutrons, and 1095 (0.2%) gave three neutrons. There were also 101,866 (15.5%) reactions with no emitted particles, except the 28Al nucleus and one or several photons.

3.2.2. Case of Natural Silicon

The simulation of 106 atomic captures of negative muons in natural silicon yielded 347,987 decays (34.8%) and 652,013 (65.2%) nucleus captures. Geant4 data show that 17% resulted in no particle being emitted (except the 28Al nucleus and γ-ray(s)), 22.7% resulted in light-charged particle emission (protons, deuterons, tritons, alpha particles, and 3He) and 79.2% resulted in neutron emission, with 17.9% showing emission of both light-charged particles and neutrons.
With respect to the case of pure 28Si, the presence of 29Si (4.70%) and 30Si (3.10%) in natural silicon slightly complexifies the analysis because several capture reactions contribute in parallel to the production of certain nuclei. For example, 27Al is primarily produced in S i 28 ( μ , ν μ n ) A l 27 but now secondarily in S i 29 ( μ , ν μ 2 n ) A l 27 and in S i 30 ( μ , ν μ 3 n ) A l 27 . New reaction channels are also available; for example, to produce 29Al and 30Al from S i 30 ( μ , ν μ ) A l 30 and S i 29 ( μ , ν μ ) A l 29 , respectively, or 29Mg and 28Mg from S i 30 ( μ , ν μ p ) M g 29 and S i 29 ( μ , ν μ p ) M g 28 . Globally, the main muon nuclear capture reactions listed in Table 6 are still present in natural silicon but with slightly different percentages of yields.
The ensemble of these 106 negative muon captures in natural silicon produces the emission of 6,043,857 γ-ray photons, 2,539,477 electrons, 648,486 neutrons, and 861,241 elementary charged particles and light and heavy fragments. Eliminating neutrinos, antineutrinos, γ-ray photons, and electrons, Figure 6 gives the distribution of these secondary particles produced in the muon captures. Neutrons represent about 45% of the number of secondaries, and all light-charged particles and fragments represent about 55%. For this last category of emitted particles, more than half (57.9%) correspond to aluminum nuclei (498,810), followed by protons (13.1%), magnesium nuclei (11.8%), and alpha particles (5.0%).
Figure 7 shows the distribution in number of all light-charged particles and fragment nuclei as a function of their atomic number. For Z = 1, the products include protons (94,235), deuterons (15,381), and tritons (3309); for Z = 2, the products include alpha particles (42,576) and 3He nuclei (339). Beryllium (Z = 4) appears as the least-produced nucleus (764), followed by oxygen (1275), boron (1467), and fluorine (1620). When small nuclei are produced, the fragmentation of the initial silicon nucleus is important, and numerous lightly charged particles are also released. At this stage, we would like to mention some rare but remarkable reactions, such as S i 28 ( μ , ν μ 4 α n ) B 11 , S i 28 ( μ , ν μ 3 α p n ) C 14 , S i 28 ( μ , ν μ 3 α n ) N 15 , and S i 28 ( μ , ν μ 3 p n ) N e 24 .
Concerning the neutrons, and as we already mentioned, the latter were produced in the vast majority (516,512) of reactions. It must be noted that 75.0% of these reactions produced one neutron, 24.3% produced two neutrons, 0.64% produced three neutrons (e.g., S i 28 ( μ , ν μ 3 n ) A l 25 ), and a small number (32 reactions) produced four neutrons (e.g., S i 30 ( μ , ν μ 4 n ) A l 26 )). Figure 8 shows the energy spectrum of all neutrons produced in muon capture reactions. The spectrum extends from 10 keV to 40 MeV, with a maximum near 4 MeV. The mean energy of emitted neutrons is 5.5 MeV. The impact of these neutrons on single event occurrence in microelectronics devices will be discussed in Section 4.
Figure 9 shows the energy distribution of all lightly charged particles and fragment nuclei produced in all negative muon capture reactions. Protons, deuterons, tritons, and alpha particles are the most energetic particles, with some deuterons being produced above 40 MeV in S i 28 ( μ , ν μ d ) M g 26 and some alphas emitted up to 25 MeV in S i 28 ( μ , ν μ α ) N a 24 reactions. They are followed by light fragment nuclei that can reach 20 MeV in energy, such as 6Li in S i 28 ( μ , ν μ L i 6 ) N e 22 or 11B in S i 28 ( μ , ν μ B 11 ) O 17 . Finally, the less energetic products are the heavier fragments, i.e., Na, Mg, and Al nuclei ranging from the MeV to the keV ranges. The distribution of aluminum nuclei presents a peak around 0.15 MeV. This peak corresponds to a very narrow energy distribution of the 28Al nuclei produced in the numerous S i 28 ( μ , ν μ ) A l 28 reactions. To better show the origin of this peak, we have also plotted the particular distribution related to 28Al in Figure 9.
Finally, we used SRIM data to calculate the initial (i.e., after release) LET and range of all the secondaries of Figure 9. The results are shown in Figure 10 and Figure 11. As expected, the lightest particles (protons and alphas) have the lowest LETs (down to 10−2 MeV·cm2/mg) and the longest ranges (up to 10 mm), and the heaviest fragments (Al, Mg, Na) have the highest LETs (around 10 MeV·cm2/mg) and the shortest ranges (nanometer to micrometer ranges). In Figure 10, the distribution labelled “Others” corresponds to all fragments ranging from lithium to neon in the periodic table. This curve shows five visible peaks and a bump at low LETs corresponding, from high to low values, to Ne, F, O, N, and C fragment nuclei, the bump being the contribution of the three lightest fragments, i.e., B, Be, and Li.

4. Discussion

We first discuss our results on the inventory of negative muon capture reactions in silicon in the context of those already published. The different yields of the main muon capture reactions in 28Si summarized in Table 6 are generally in good agreement with those previously reported in the literature but with some differences. Measday [31] reported a total yield of 49% for S i 28 ( μ , ν μ n ) A l 27 and a measured yield of 16.6% for S i 28 ( μ , ν μ ) A l 28 , compared with 46.7% and 15.5%, respectively, obtained in this work with Geant4. Overall, these authors found a total yield of between 82 and 84% for all reactions producing Al fragments, between 13 and 15% for Mg, and about 3% for Na. Our results show a lower yield for Al (75.5%) and a similar yield for Mg (16.3%), but a higher yield for Na (6.6%), and finally a non-negligible contribution (1.6%) of other reactions producing fragments from lithium to neon. These results are therefore in rough agreement with the reported experimental values, since, as mentioned by Measday [31], a factor of two for smaller yields and ±5% for larger yields is a minimum uncertainty for these kinds of measurements.
In natural silicon, our results reported in Section 3.2.1 show that, of the muons that were captured, 17% resulted in no particle being emitted (except the 28Al nucleus and γ-ray(s)), 22.7% resulted in light-charged particle emission (protons, deuterons, tritons, alpha particles, and 3He), and 79.2% resulted in neutron emission, with 17.9% emission of both light-charged particles and neutrons. These percentages of capture reactions roughly agree with the values estimated or reported in previous papers [17,44,45,46,47]. According to Ziegler and Lanford [17], for example, 67% of the captured muons result in the emission of neutrons, and 10% produce both charged particles and neutrons, 28% of the muons that are captured do not emit any particles, and (light) charged particle emission is observed in 15% of the cases. Of these, about 10% are protons, 5% are deuterons, and less than 1% are tritons or alpha particles (in some cases, there may be several percent alpha particles). For memory, we found 13% of the capture reactions emitted one or several protons, 2.3% emitted deuterons, and 6.3% emitted alpha particles (note that certain reactions give multiple light-charged particles and then were counted several times in these percentages).
A second important aspect of these results concerns their possible implications in the field of single events and soft errors in microelectronics. As we have shown, the capture of negative muons in silicon produces particle showers with a large number of gammas, electrons, neutrons, and charged secondary particles as a result of the muon cascade, followed by the evaporation of the nucleus. On average, each capture event releases a tenth of γ-ray photons, more than three Auger electrons, more than one neutron and more than one charged particle (light or heavy fragments). On one hand, since gamma rays are unlikely to induce any significant single event effect or soft error in circuits, they can be excluded from the analysis. On the other hand, the majority of Auger electrons, however, have energies comparable to δ-rays produced in the direct ionization process: they can ionize surrounding atoms and produce electron–hole pairs in the semiconductor material. It has been shown by King et al. [48] that energy deposition from energetic δ-rays by inelastic scattering processes below 100 keV are sufficiently large to upset circuit nodes with low critical charges (for memory, the critical charge is defined for semiconductor memory circuits as the minimum amount of collected charge that will cause a device node to change its logical state and result in a single-event upset or soft error [2,49]). Predictions reported by King et al. [48] indicate that single electrons can deposit enough energy in the sensitive volume of a memory cell to cause upset. We conclude that these energetic electrons emitted in large numbers during the muon atomic capture with energies predominantly below 100 keV should be fully considered as ionizing particles likely to cause soft errors in modern circuits. An evaluation of the exact importance of these Auger electrons in the production of soft errors could be an interesting and relevant study.
Concerning the neutrons, these latter are therefore weakly susceptible to interaction with the silicon target once emitted since, at these energies, the total neutron–silicon interaction cross-section value is about 2.5 barns, which implies a mean free-range of about 8 cm [50]. For the rare possible interactions, neutrons in this energy range can preferentially induce elastic or inelastic scattering with silicon atoms, potentially inducing low-energy silicon recoils.
Another comment concerns the 861,241 charged particles released during muon captures, which are undoubtedly the most significant contributor to the production of soft errors. Their ionizing character combined with their energy distribution (Figure 9) shows that a single capture is capable of releasing an average of 1.92 MeV of energy, which corresponds to 532,400 electron–hole pairs in silicon, i.e., a deposited charge of 85 fC. If a muon capture occurs near the transistor level in a memory circuit, the probability of inducing an upset would be high, since this would result in a large amount of charge deposition on the sensitive region of the circuit due to the particle shower. Such an effect has been experimentally evidenced in [4,5,6,7] by varying the energy of a muon beam so that muons stop at the level of the sensitive zone of a circuit. Although there can be significant charge deposition by direct ionization (in Bragg’s peak condition) for both positive and negative muons, there is a very significant difference between the effect of negative muons, which includes capture, and positive muons, which do not include capture. Under negative muons, the soft-error rate (SER) is thus always much larger in this case than the SER induced by positive muons. For example, Liao et al. [5] measured a negative muon-induced SER 2.3 times larger in 28 nm bulk SRAM (at 0.6 V) and 104.3 times larger in 65 nm bulk SRAM (at 0.9 V) than the positive muon-induced SER. They confirmed that negative muons have higher error-inducing ability than positive muons at both 28 nm and 65 nm nodes.
The LET and range distributions of the charged particles released by the captures, shown in Figure 10 and Figure 11, respectively, also suggest that memory cells far from the strike location, potentially tens to hundreds of micrometers away, can be upset. In other words, the probability of multiple cell upsets (MCUs) following capture reactions is much higher than that resulting from the direct impact of a muon traversing multiple cells. Kato et al. [7] also noted that the ions produced by captures are emitted isotropically, regardless of the incident direction of the negative muons. In this case, some of these ions travel along the plane of the memory array, and hence their tracks can cover multiple SRAM cells. These authors also noted that the variety of secondary ions produced in capture events and their relatively high LET values are likely to result in the broad distribution of charge deposition and resulting collection, which is quite different from the case of positive muons [7]. These characteristics of the muon capture reactions, i.e., the high-LET ion production and the isotropic ion emission, also distinguish the MCU characteristics for the negative muon from those for the high-energy neutron and the thermal neutron [7].
Finally, a last remark must be made to place this work in the context of the atmospheric radiation environment and the problem of electronic reliability under natural radiation. As mentioned in the Introduction, atmospheric radiation is diverse in terms of particle composition (neutrons, protons, and muons in particular) and energy range (from thermal energies to tens of GeV) [2]. The result is a variety of interaction mechanisms and a certain hierarchy in the relative importance of these mechanisms in terms of ability to produce single events in devices or circuits. The respective contributions of atmospheric neutrons and muons have been weighted in several previous studies [4,5,6,7,51,52,53]. It has been clearly shown experimentally or by simulation that the muon-induced defect rate is limited to a fraction (ranging from a few percent to a maximum of 15 percent, depending on the circuit technology) of the neutron-induced defect rate. Although negative muons are of much greater concern than positive muons for SEE production in CMOS circuits, and even though the secondary LET distribution (with values up to about 10 MeV· cm2/mg) of negative muon captures is similar to that induced by high-energy neutron nuclear reactions, high-energy neutrons (>1 MeV) clearly dominate the overall event rate at sea level for the vast majority of CMOS technologies. In other words, the impact of negative muon capture relative to high-energy neutrons is small for current CMOS circuits exposed to natural radiation at sea level, as evidenced by the good agreement between the expected and measured ground level rates of SEE events from high-energy neutrons [2]. A similar statement can be made about Auger electrons produced during capture. Their impact would have to be at least compared to the delta ray electrons from direct muon ionization, which may dominate because they can come from muons in a much wider energy range than those stopping at or near the sensitive region. And even when considering an environment consisting entirely of atmospheric-like muons, the relative contribution of negative muon capture would also need to be weighed against energy deposition events from Coulomb scattering [23], which will come from muons in a much broader energy range, and which also have the potential to produce reasonably large LET silicon recoils. All this work remains to be carried out in future studies, as well as a global study to quantify as accurately as possible the contributions of these different mechanisms to the overall error rate of terrestrial electronics.

5. Conclusions

In this work, the interactions of low-energy muons (E < 10 MeV) with natural silicon have been studied by numerical simulation, in particular the capture of negative muons by silicon atoms. This mechanism has previously been recognized as a significant threat to electronics, and its effects on device and circuit operation have been experimentally demonstrated. Using Geant4 and SRIM, we have investigated the various muon nuclear capture reactions in silicon and quantitatively evaluated their relative importance in terms of number of products, energy, linear energy transfer, and range distributions. The simulation results for the yields of the main muon capture reactions are in good agreement with the experimental results from the literature. Our results highlight the importance of Auger electrons, which are emitted in large numbers during muon atomic capture at energies predominantly below 100 keV. At such moderate energies, the ionizing power of these electrons is not negligible, and they should be considered as a potential additional source of soft errors in current technologies characterized by low critical charge values. Finally, this study confirms previously published results in the field of soft errors, which have shown that negative muon capture can have a significant impact on single-event production in microelectronic circuits due to the release of large particle showers.

Author Contributions

Conceptualization, J.-L.A. and D.M.; methodology, J.-L.A. and D.M.; software, J.-L.A. and D.M.; formal analysis, J.-L.A. and D.M.; investigation, J.-L.A. and D.M.; writing—review and editing, J.-L.A. and D.M.; visualization, J.-L.A. and D.M. All authors have read and agreed to the published version of the manuscript.

Funding

This research received no external funding.

Data Availability Statement

The data presented in this study are available on reasonable request from the corresponding authors.

Conflicts of Interest

The authors declare no conflicts of interest.

References

  1. Grupen, C.; Shwartz, B. Particle Detectors, 2nd ed.; Cambridge University Press: Cambridge, UK, 2008. [Google Scholar]
  2. Autran, J.L.; Munteanu, D. Soft Errors: From Particles to Circuits; Taylor & Francis/CRC Press: Boca Raton, FL, USA, 2015. [Google Scholar]
  3. Sierawski, B.D.; Mendenhall, M.H.; Reed, R.A.; Clemens, M.A.; Weller, R.A.; Schrimpf, R.D.; Blackmore, E.W.; Trinczek, M.; Hitti, B.; Pellish, J.A.; et al. Muon-Induced Single Event Upsets in Deep-Submicron Technology. IEEE Trans. Nucl. Sci. 2010, 57, 3273–3278. [Google Scholar] [CrossRef]
  4. Manabe, S.; Watanabe, Y.; Liao, W.; Hashimoto, M.; Nakano, K.; Sato, H.; Kin, T.; Abe, S.-I.; Hamada, K.; Tampo, M.; et al. Negative and Positive Muon-Induced Single Event Upsets in 65-nm UTBB SOI SRAMs. IEEE Trans. Nucl. Sci. 2018, 65, 1742–1749. [Google Scholar] [CrossRef]
  5. Liao, W.; Hashimoto, M.; Manabe, S.; Watanabe, Y.; Abe, S.-I.; Nakano, K.; Sato, H.; Kin, T.; Hamada, K.; Tampo, M.; et al. Measurement and Mechanism Investigation of Negative and Positive Muon-Induced Upsets in 65-nm Bulk SRAMs. IEEE Trans. Nucl. Sci. 2018, 65, 1734–1741. [Google Scholar] [CrossRef]
  6. Hashimoto, M.; Kobayashi, K.; Furuta, J.; Abe, S.-I.; Watanabe, Y. Characterizing SRAM and FF soft error rates with measurement and simulation. Integration 2019, 69, 161–179. [Google Scholar] [CrossRef]
  7. Kato, T.; Tampo, M.; Takeshita, S.; Tanaka, H.; Matsuyama, H.; Hashimoto, M.; Miyake, Y. Muon-Induced Single-Event Upsets in 20-nm SRAMs: Comparative Characterization with Neutrons and Alpha Particles. IEEE Trans. Nucl. Sci. 2021, 68, 1436–1444. [Google Scholar] [CrossRef]
  8. Smith, A.R.; McDonald, R.J.; Hurley, D.L.; Holland, S.E.; Groom, D.E.; Brown, W.E.; Gilmore, D.K.; Stover, R.J.; Wei, M. Radiation events in astronomical CCD images. In Proceedings of the SPIE 4669, San Jose, CA, USA, 19–25 January 2002; pp. 172–183. [Google Scholar]
  9. Saad Saoud, T.; Moindjie, S.; Autran, J.L.; Munteanu, D.; Wrobel, F.; Saigné, F.; Cocquerez, P.; Dilillo, L.M.; Glorieux, M. Use of CCD to Detect Terrestrial Cosmic Rays at Ground Level: Altitude vs. Underground Experiments, Modeling and Numerical Monte Carlo Simulation. IEEE Trans. Nucl. Sci. 2014, 61, 3380–3388. [Google Scholar] [CrossRef]
  10. Saad Saoud, T.; Moindjie, S.; Munteanu, D.; Autran, J.L. Natural radiation events in CCD imagers at ground level. Microelectron. Reliab. 2016, 64, 68–72. [Google Scholar] [CrossRef]
  11. Sierawski, B.D.; Reed, R.A.; Mendenhall, M.H.; Weller, R.A.; Schrimpf, R.D.; Wen, S.-J.; Wong, R.; Tam, N.; Baumann, R.C. Effects of scaling on muon-induced soft errors. In Proceedings of the IEEE International Reliability Physics Symposium, Monterey, CA, USA, 10–14 April 2011; pp. 3C.3.1–3C.3.6. [Google Scholar]
  12. Sierawski, B.D.; Bhuva, B.; Reed, R.; Tam, N.; Narasimham, B.; Ishida, K.; Hillier, A.; Trinczek, M.; Blackmore, E.; Wen, S.-J.; et al. Bias dependence of muon-induced single event upsets in 28 nm static random-access memories. In Proceedings of the IEEE International Reliability Physics Symposium, Waikoloa, HI, USA, 1–5 June 2014; pp. 2B.2.1–2B.2.5. [Google Scholar]
  13. Blundell, S.J.; De Renzi, R.; Lancaster, T.L.; Pratt, F.L. Muon Spectroscopy: An Introduction; Oxford University Press: Oxford, UK, 2021. [Google Scholar]
  14. Hillier, A.D.; Blundell, S.J.; McKenzie, I.; Umegaki, I.; Shu, L.; Wright, J.A.; Prokscha, T.; Bert, F.; Shimomura, K.; Berlie, A.; et al. Muon spin spectroscopy. Nat. Rev. Methods Primers 2022, 2, 4. [Google Scholar] [CrossRef]
  15. Blackmore, E.W.; Stukel, M.; Trinczek, M.; Slayman, C.; Wen, S.-J.; Wong, R. Terrestrial Muon Flux Measurement at Low Energies for Soft Error Studies. IEEE Trans. Nucl. Sci. 2015, 62, 2792–2796. [Google Scholar] [CrossRef]
  16. Serre, S.; Semikh, S.; Autran, J.L.; Munteanu, D.; Gasiot, G.; Roche, P. Effects of Low Energy Muons on Electronics: Physical Insights and Geant4 Simulation. In Proceedings of the European Workshop on Radiation and Its Effects on Components and Systems, Biarritz, France, 24–28 September 2012. [Google Scholar]
  17. Ziegler, J.F.; Lanford, W.A. Effect of cosmic rays on computer memories. Science 1979, 206, 776–788. [Google Scholar] [CrossRef]
  18. Autran, J.L.; Munteanu, D. Atmospheric Neutron Radiation Response of III-V Binary Compound Semiconductors. IEEE Trans. Nucl. Sci. 2020, 67, 1428–1435. [Google Scholar] [CrossRef]
  19. EXPACS, Excel-Based Program for Calculating Atmospheric Cosmic-ray Spectrum. Available online: https://phits.jaea.go.jp/expacs/ (accessed on 20 October 2023).
  20. Beringer, J.; Arguin, J.-F.; Barnett, R.M.; Copic, K.; Dahl, O.; Groom, D.E.; Lin, C.-J.; Lys, J.; Murayama, H.; Wohl, C.G.; et al. (Particle Data Group). The Review of Particle Physics. Phys. Rev. D 2012, 86, 010001. [Google Scholar] [CrossRef]
  21. Cecchini, S.; Spurio, M. Atmospheric muons: Experimental aspects. Geosci. Instrum. Methods Data Syst. 2012, 1, 185–196. [Google Scholar] [CrossRef]
  22. Grieder, P.K.F. Cosmic Rays at Earth; Elsevier Press: Amsterdam, The Netherlands, 2001. [Google Scholar]
  23. Akkerman, A.; Barak, J.; Yitzhak, N.M. Role of Elastic Scattering of Protons, Muons, and Electrons in Inducing Single-Event Upsets. IEEE Trans. Nucl. Sci. 2017, 64, 2648–2660. [Google Scholar] [CrossRef]
  24. Munteanu, D.; Autran, J.L. Modeling and Simulation of Single-Event Effects in Digital Devices and ICs. IEEE Trans. Nucl. Sci. 2008, 55, 1854–1878. [Google Scholar] [CrossRef]
  25. Mukhopadhyay, N.C. Nuclear Muon Capture. Phys. Rep. 1977, 30, 1–144. [Google Scholar] [CrossRef]
  26. Knecht, A.; Skawran, A.; Vogiatzi, S.M. Study of nuclear properties with muonic atoms. Eur. Phys. J. Plus 2020, 135, 777. [Google Scholar] [CrossRef]
  27. Fermi, E.; Teller, E. The capture of negative mesotrons in matter. Phys. Rev. 1947, 72, 399–408. [Google Scholar] [CrossRef]
  28. Suzuki, T.; Measday, D.F.; Roalsvig, J.P. Total nuclear capture rates for negative muons. Phys. Rev. C 1987, 35, 2212–2224. [Google Scholar] [CrossRef]
  29. Tiomno, J.; Wheeler, J.A. Charge-exchange reaction of the μ-meson with the nucleus. Rev. Mod. Phys. 1949, 21, 153–165. [Google Scholar] [CrossRef]
  30. Singer, P. Emission of particles following muon capture in intermediate and heavy nuclei. Nucl. Phys. Springer Tracts Mod. Phys. 1974, 71, 39–87. [Google Scholar]
  31. Measday, D.F. The nuclear physics of muon capture. Phys. Rep. 2001, 354, 243–409. [Google Scholar] [CrossRef]
  32. Measday, D.F.; Stocki, T.J.; Moftah, B.A.; Tam, H. g rays from muon capture 27Al and natural Si. Phys. Rev. C 2007, 76, 035504. [Google Scholar] [CrossRef]
  33. Sundelin, R.M.; Edelstein, R.M.; Suzuki, A.; Takahashi, K. Spectrum of neutrons from muon capture in silicon, sulfur, and calcium. Phys. Rev. Lett. 1968, 20, 1198–1200. [Google Scholar] [CrossRef]
  34. Sobottka, S.E.; Wills, E.L. Energy spectrum of charged particles emitted following muon capture in 28Si. Phys. Rev. Lett. 1968, 20, 596. [Google Scholar] [CrossRef]
  35. Tang, H.H.K. SEMM-2: A new generation of single-event-effect modeling tools. IBM J. Res. Dev. 2008, 52, 233–244. [Google Scholar] [CrossRef]
  36. Tiesinga, E.; Mohr, P.; Newell, D.; Taylor, B. CODATA recommended values of the fundamental physical constants: 2018. Rev. Mod. Phys. 2021, 93, 025010. [Google Scholar] [CrossRef] [PubMed]
  37. Senba, M.; Arseneau, D.J.; Pan, J.J.; Fleming, D.G. Slowing-down times and stopping powers for ~2−MeV μ+ in low-pressure gases. Phys. Rev. A 2006, 74, 042708. [Google Scholar] [CrossRef]
  38. Ziegler, J.F.; Ziegler, M.D.; Biersack, J.P. SRIM—The stopping and range of ions in matter. Nucl. Instrum. Meth. B 2010, 268, 1818–1823. [Google Scholar] [CrossRef]
  39. SRIM. The Stopping and Range of Ions in Matter. Available online: http://srim.org (accessed on 20 October 2023).
  40. Agostinelli, S.; Allison, J.; Amako, K.; Apostolakis, J.; Araujo, H.; Arce, P.; Asai, M.; Axen, D.; Banerjee, S.; Barrand, G.; et al. Geant4—A simulation toolkit. Nucl. Instrum. Meth. A 2003, 506, 250–303. [Google Scholar] [CrossRef]
  41. Allison, J.K.; Amako, K.; Apostolakis, J.; Araujo, H.; Arce Dubois, P.; Asai, M.G.; Barrand, G.R.; Capra, R.S.; Chauvie, S.; Chytraceket, R.; et al. Geant4 developments and applications. IEEE Trans. Nucl. Sci. 2006, 53, 270–278. [Google Scholar] [CrossRef]
  42. Allison, J.; Amako, K.; Apostolakis, J.; Arce, P.; Asai, M.; Aso, T.; Bagli, E.; Bagulya, A.; Banerjee, S.; Barrand, G.; et al. Recent developments in Geant4. Nucl. Instrum. Meth. A 2016, 835, 186–225. [Google Scholar] [CrossRef]
  43. Martinie, S.; Saad-Saoud, T.; Moindjie, S.; Munteanu, D.; Autran, J.L. Behavioral modeling of SRIM tables for numerical simulation. Nucl. Instrum. Methods Phys. Res. Sect. B Beam Interact. Mater. At. 2014, 322, 2–6. [Google Scholar] [CrossRef]
  44. Budyashov, Y.G.; Zinov, V.G.; Konin, A.D.; Mukhin, A.I.; Chatrchyan, A.M. Charged Particles from the Capture of Negative Muons by the Nuclei 28Si, 32S, 40Ca, and 64Cu. Sov. J. Exp. Theor. Phys. 1971, 33, 11. [Google Scholar]
  45. Macdonald, B.; Diaz, J.A.; Kaplan, S.N.; Pyle, R.V. Neutrons from Negative-Muon Capture. Phys. Rev. 1965, 139, B1253–B1263. [Google Scholar] [CrossRef]
  46. Sundelin, R.M.; Edelstein, R.M. Neutron Asymmetries and Energy Spectra from Muon Capture in Si, S, and Ca. Phys. Rev. C 1973, 7, 1037–1060. [Google Scholar] [CrossRef]
  47. Wyttenbach, A.; Baertschi, P.; Bajo, S.; Hadermann, J.; Junker, K.; Katcoff, S.; Hermes, E.A.; Pruys, H.S. Probabilities of muon induced nuclear reactions involving charged particle emission. Nucl. Phys. A 1978, 294, 278–292. [Google Scholar] [CrossRef]
  48. King, M.P.; Reed, R.A.; Weller, R.A.; Mendenhall, M.H.; Schrimpf, R.D.; Alles, M.L.; Auden, E.C.; Armstrong, S.E.; Asai, M. The Impact of Delta-Rays on Single-Event Upsets in Highly Scaled SOI SRAMs. IEEE Trans. Nucl. Sci. 2010, 57, 3169–3175. [Google Scholar] [CrossRef]
  49. JESD89B; Measurement and Reporting of Alpha Particle and Terrestrial Cosmic Ray-Induced Soft Errors in Semiconductor Devices. Revision of JESD89A; JEDEC: Arlington, VA, USA, 2021.
  50. Gaillard, R. Single Event Effects: Mechanisms and Classification. In Soft Errors in Modern Electronic Systems; Nicolaidis, M., Ed.; Springer: New York, NY, USA, 2011. [Google Scholar]
  51. Roche, P.; Autran, J.L.; Gasiot, G.; Munteanu, D. Technology downscaling worsening radiation effects in bulk: SOI to the rescue. In Proceedings of the IEEE International Electron Device Meeting, Washington, DC, USA, 9–11 December 2013; pp. 766–769. [Google Scholar]
  52. Fang, Y.-P.; Oates, A.S. Muon-Induced Soft Errors in SRAM Circuits in the Terrestrial Environment. IEEE Trans. Device Mater. Reliab. 2015, 15, 115–122. [Google Scholar] [CrossRef]
  53. Seifert, N.; Jahinuzzaman, S.; Velamala, J.; Patel, N. Susceptibility of planar and 3D tri-gate technologies to muon-induced single event upsets. In Proceedings of the IEEE International Reliability Physics Symposium, Monterey, CA, USA, 19–23 April 2015; pp. 2C.1.1–2C.1.6. [Google Scholar]
Figure 1. Schematic of stopping mechanisms of low-energy muons in silicon and schematic of negative muon capture on a silicon atom.
Jne 05 00007 g001
Figure 2. LET and range of positive muons in silicon deduced from SRIM simulations considering “light” protons with the mass of the muon.
Jne 05 00007 g002
Figure 3. Spatial distributions (given by Geant4) of negative muon capture positions with respect to the silicon surface for 104 muons with incident energies of 5, 10, 15, and 20 MeV. The corresponding average values of the muon range in silicon given by SRIM for the corresponding energy are also shown (vertical bars).
Jne 05 00007 g003
Figure 4. Energy distributions of the X-ray/γ-ray photons emitted during the muon cascades (left y-scale) and during the 28Al* nucleus evaporations (right y-scale) for all the atomic events.
Jne 05 00007 g004
Figure 5. Spectrum for all the electrons (2,534,605 electrons) ejected during the muon cascades (Auger electrons) and emitted during the decay of muons.
Jne 05 00007 g005
Figure 6. Secondary products emitted in muon nuclear captures in natural silicon expressed as percentage of the total number of products (γ-rays, electrons, neutrinos, and antineutrinos excluded).
Jne 05 00007 g006
Figure 7. Number of charged products (light-charged particles and fragment nuclei) emitted in muon nuclear captures in natural silicon for 106 captures as a function of the atomic number Z.
Jne 05 00007 g007
Figure 8. Energy distribution of secondary neutrons produced in all negative muon capture reactions.
Jne 05 00007 g008
Figure 9. Energy distribution of all light-charged particles and fragment nuclei produced in all negative muon capture reactions. For aluminum, we detailed the particular case of 28Al (discussed in the text).
Jne 05 00007 g009
Figure 10. Initial linear energy transfer (LET) distribution in silicon of all light-charged particles and fragment nuclei produced in all negative muon capture reactions.
Jne 05 00007 g010
Figure 11. Range distribution in silicon of all light-charged particles and fragment nuclei produced in all negative muon capture reactions.
Jne 05 00007 g011
Table 1. Abundance of Si isotopes in the natural silicon material studied in this work.
SymbolAtomic NumberIsotopeNatural Abundance
Si1428Si92.20%
29Si4.70%
30Si3.10%
Table 2. Main properties of Si at 300 K.
SemiconductorBandgap @ 300 K Eg (eV)Number of Atoms per cm3 (×1022)Density (g/cm3)Electron–Hole Pair
Creation Energy Eeh (eV)
Si1.1245.02.3293.6
Table 3. Values of the coefficients pi and qi used in Equations (8)–(11) to analytically calculate the LET and range of muons in silicon as a function of the kinetic muon energy E in the energy domain limited to [2 keV–10 MeV].
ipiqi
1−0.30049−0.36483
23.638332.16872
3−8.04761−2.59854
41.000001.74777
5−7.58899−6.8565 × 10⁻¹
63.698871.6021 × 10−1
7−1.19032−2.188 × 10⁻²
82.5518 × 10−11.612 × 10−3
9−3.604 × 10⁻²−4.94 × 10⁻⁵
103.219 × 10⁻³−9.69882
11−1.65 × 10⁻⁴-
123.69 × 10⁻⁶-
13−1.93759-
Table 4. Muon decay and muon nuclear capture expressed as a percentage of the total number of atomic captures in targets composed of 100% of 28Si, 29Si, or 30Si isotopes and in a natural Si target.
Type of Mechanism28Si29Si30SiNatural Si
Muon decay34.30%40.55%44.28%34.80%
Muon nuclear capture65.70%59.45%55.72%65.20%
Table 5. Example of Geant4 raw output data for a negative muon capture on 28Si atom.
SecondaryEnergy (MeV)Event Start TimeEvent Mechanism
e-2.801 keV0.1024 psMuon atomic capture and cascade down to the ground state accompanied by
γ-ray emission.

* Energy for transition Lα (3d → 2p)
# Energy for transition Kα (2p → 1s)
gamma12.45 keV
e-6.709 keV
gamma12.35 keV
gamma26.68 keV
gamma76.24 keV *
gamma386.8 keV #
nu_mu84.49 MeV873 ns Muon   nucleus   capture
μ + S i 28 A l * 28 + ν μ + 100.5   M e V
neutron782.1 keV874 ns28Al* nucleus evaporation
Al27288.4 keV
gamma3.013 MeV
gamma2.668 MeV
gamma1.017 MeV
Table 6. Main muon nuclear capture reactions and percentages from the total number of nuclear captures in 28Si.
Total per Secondary Heavy Fragments ProducedMuon Capture Reaction in 28SiYield (%)
S i 28 ( μ , ν μ ) A l 28 15.51
Al S i 28 ( μ , ν μ n ) A l 27 46.68
75.48% S i 28 ( μ , ν μ 2 n ) A l 26 13.26
S i 28 ( μ , ν μ 3 n ) A l 25 0.03
S i 28 ( μ , ν μ p ) M g 27 1.77
S i 28 ( μ , ν μ p n ) M g 26 8.09
Mg S i 28 ( μ , ν μ d ) M g 26 0.52
16.33% Reactions   with   emission   of   25 Mg 5.41
Reactions   with   emission   of   24 Mg 0.54
S i 28 ( μ , ν μ 2 p n ) N a 25 0.22
Na S i 28 ( μ , ν μ α ) N a 24 1.90
6.57% S i 28 ( μ , ν μ α n ) N a 23 3.18
S i 28 ( μ , ν μ α 2 n ) N a 22 0.72
Other reactions with emission of Na isotopes0.55
Other Reactions   with   emission   of   Ne   isotopes 0.76
1.62% Reactions   with   emission   of   F   isotopes 0.26
Other reactions0.60
Total 100.00
Disclaimer/Publisher’s Note: The statements, opinions and data contained in all publications are solely those of the individual author(s) and contributor(s) and not of MDPI and/or the editor(s). MDPI and/or the editor(s) disclaim responsibility for any injury to people or property resulting from any ideas, methods, instructions or products referred to in the content.

