Article

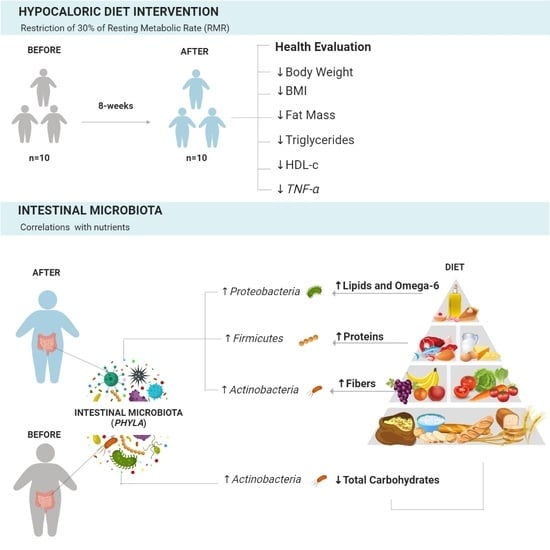
Ability of Hypocaloric Diets to Change Nutrient–Phyla Associations after 8 Weeks of Intervention

by
Natália Yumi Noronha
1,†,
Luzânia dos Santos Martins
1,†,
Lígia Moriguchi Watanabe
2,
Marcela Augusta de Souza Pinhel
1,
Guilherme da Silva Rodrigues
1,
Isabelle Mello Schneider
2,
Carolina Ferreira Nicoletti
1,
Heitor Bernardes Pereira Delfino
1,
Daniela Carlos
3 and
Carla Barbosa Nonino
1,2,*
1
Department of Internal Medicine, Ribeirão Preto Medical School, University of São Paulo, Av. Bandeirantes, 3900-Vila Monte Alegre, Ribeirão Preto 14040-900, SP, Brazil
2
Department of Health Sciences, Ribeirão Preto Medical School, University of São Paulo, Ribeirão Preto 14040-900, SP, Brazil
3
Department of Biochemistry and Immunology, Ribeirão Preto Medical School, University of São Paulo, Ribeirão Preto 14040-900, SP, Brazil
*
Author to whom correspondence should be addressed.
These authors contributed equally to this work.
Submission received: 19 February 2024 / Revised: 21 March 2024 / Accepted: 25 March 2024 / Published: 26 March 2024
(This article belongs to the Special Issue How to Prevent Obesity and Inflammatory Disease 2024)

Abstract

:
Background: Previous studies have suggested that changes in the composition of intestinal microbiota may be influenced by dietary quality. Objective: This study aimed to assess the impact of a hypocaloric diet on the relationship between microbiota and clinical/dietary variables. Methods: This was a longitudinal study. Ten women with obesity (Obese Group, ObG) participated in an 8-week home-based hypocaloric diet intervention. Anthropometric, dietary intake, biochemical, and gut microbiota assessments were conducted before and after the intervention. Microbiota relative abundance was determined using real-time PCR in triplicate. Results: In the ObG, the hypocaloric diet intervention led to significant weight loss (before: 119.5 ± 10.3 kg; after: 114.9 ± 10.2 kg; p = 0.003). Following the intervention, positive correlations were observed between nutrient intake and phyla composition: Actinobacteria phylum with fibers (r = 0.787; p = 0.012), Firmicutes phylum with proteins (r = 0.736; p = 0.024), and Proteobacteria phylum with lipids (r = 0.669; p = 0.049). Conclusions: The hypocaloric diet intervention improved health parameters associated with obesity and its comorbidities, demonstrating associations between nutrient intake and specific phyla.

Graphical Abstract

1. Introduction

Non-communicable chronic diseases (NCDs), including cardiovascular diseases, cancer, diabetes, and chronic respiratory diseases, pose significant public health challenges globally due to their high prevalence and rapid emergence as leading causes of death [1]. Despite being a heterogeneous condition, obesity is often inadequately addressed in terms of sex/gender considerations within prevention and clinical care. Nonetheless, sex/gender disparities in obesity have been observed across various aspects of the disease’s progression, encompassing overall prevalence, comorbidities, and treatment. While obesity is more prevalent in women than men in most countries, certain regions and population subsets exhibit more pronounced disparities [2]. In Brazil, from 2003 to 2019, female obesity increased from 14.5% to 30.2%, while male obesity rose from 9.6% to 22.8% [3].
The composition of microbiota varies across different regions of the human body, with the intestinal microbiota harboring the greatest diversity and microbial complexity, rivaled only by the oral cavity [4]. Bacteria comprise the majority of the human microbiota (92.3%), with Actinobacteria (36.6%), Firmicutes (34.3%), Proteobacteria (11.9%), and Bacteroides (9.5%) phyla being predominant [5] the symbiotic relationship between gut microbiota and its host plays a crucial role, with bacteria capable of assimilating and modifying components of the host environment and producing molecules with potential beneficial or harmful effects [6]. This relationship significantly influences gut mucosa protection, energy and nutrient metabolism, immune function, and inflammatory processes, with diverse implications for health or disease conditions [6].
In this context, investigating the relationship between food intake, nutritional status, and gut microbiota can elucidate the mechanisms underlying nutrient metabolism and offer new perspectives for personalized dietary approaches.
We hypothesize that associations with phyla will change following dietary re-education, given that the intervention entails a shift in food types in addition to caloric restriction.
Therefore, the present study aims to evaluate the effect of a hypocaloric diet for 8 weeks on gut microbiota associations with nutrient intake.

2. Materials and Methods

2.1. Study Design

This was a longitudinal study. Participants in Obese Group (ObG) were evaluated for anthropometric, dietary intake, biochemical, and gut microbiota relative abundance parameters. Assessments for the ObG were performed during the pre- and post-hypocaloric diet intervention.

2.2. Study Participants

In the present study, ten women with severe obesity (BMI 43.6 ± 2.4 kg/m2) were selected from an Obesity Outpatient Clinic at Ribeirão Preto University Hospital (HCFMRP-USP). The sample size for this study was determined by convenience according to time and financial availability to perform the study. They were submitted to a hypocaloric dietary intervention. Non-inclusion criteria were the use of antibiotics, anti-inflammatory, antifungal, or anti-allergy medication, probiotics, or prebiotics; lactation period, tobacco use, or frequent alcohol consumption; previous or recent chemotherapy; history of gastrointestinal surgery, gastrointestinal disease, hypothyroidism, or hyperthyroidism; and physical exercise intervention or dietary interventions already in course. In addition, the exclusion criteria were the use of any new medical therapy that could influence the gut microbiota or loss to follow-up during the intervention.
The study protocol was approved by the Ethics Committee of Ribeirão Preto Medical School at the University of São Paulo, Brazil (process CAAE: 57459816.1.0000.5440, 26 October 2016). Written consent was obtained from all the participants. The study was conducted following the Declaration of Helsinki.

2.3. Hypocaloric Diet Intervention

Patients in the ObG group were instructed to follow a hypocaloric diet for eight weeks. Each participant’s choice of food plan was based on the assessment of indirect calorimetry. From the energy expenditure value at rest, 30% was subtracted, and one of the six previously structured food plans was selected.

2.3.1. Food Plan Selection

Six food plans were structured with caloric values of 1100 kcal, 1200 kcal, 1300 kcal, 1400 kcal, 1500 kcal, and 1600 kcal, with the distribution of macronutrients according to the Dietary Reference Intakes (DRIs) [7]. Carbohydrates: 55% to 60% of the total energetic value (TEV), with less than 20% of simple absorption. Fat: 20% to 25% of TEV, with saturated fat < 7% of TEV; 10% of TEV from polyunsaturated fatty acids; 13% of TEV from monounsaturated fatty acids and up to 300 mg of total cholesterol. Proteins: 15% to 20% of VET. Each food plan was accompanied by a replacement list of food, to favor adherence to the intervention.

2.3.2. Food Plan Follow-Up

Biweekly follow-ups were carried out at the Metabolic Unit of HCFMRP-USP, always assisted by the dietitian responsible for the research. At each follow-up, data on eating behavior, difficulties in following the eating plan, and emphasis on positive changes in eating were observed. Participants were instructed to contact, via email or telephone, a nutritionist to clarify any eventual doubts during the participation in the project. The intervention lasted 8 weeks for all participants.

2.4. Anthropometric Evaluation

The weight of the participants was measured using a Filizola platform digital scale with a capacity of 300 kg and precision of 0.2 kg, and a vertical rod with a graduation of 0.5 cm was adopted to assess each participant’s height. Subsequently, the body mass index was calculated by dividing weight (kg) by height squared (m2). The assessment of abdominal circumference was performed with a measuring tape with a 0.1 mm graduation; we positioned the tape at the largest circumference around the navel and between the midpoint of the last rib and the iliac crest, respectively.
We adopted the electrical bioimpedance technique (Quantum BIA 101 Q model, RJL System) to assess the participants’ body compositions. At the time of the examination, the patients were without adornments or other metallic objects, wearing light clothes, with empty bladders, and not having their menstrual period.
We used the QUARK-RMR Indirect Calorimetry device (COSMED, Rome, Italy). We measured the RMR for 30 min, and the initial 10 min was discarded to ensure data homogeneity. The evaluation consisted of measuring the volume of oxygen consumed during rest (VO2) and the volume of carbon dioxide produced by the participants during rest (VCO2) for later calculation of the RMR. We adopt the Weir equation to calculate the energy demand of individuals at rest.

2.5. Dietary Intake Assessment

For the analysis of food consumption, three surveys were collected using a 24-h recall (24HR) at each time point. The first and second 24HR were carried out by telephone on days before the assessment, and the third in person on the collection day, totaling two 24HR on weekdays and one corresponding to a weekend day. With the aid of Dietwin® software V.2.0, a quantitative analysis of the 24HR was carried out, in which the daily intake of calories, macronutrients (carbohydrates, proteins, and lipids), and micronutrients (vitamin B12) were observed. Final consumption was considered as the average derived from the three 24HR.

2.6. Biological Sampling and Blood Analysis

We performed the collection of blood samples after 12 h of fasting; the collections occurred in EDTA tubes for the DNA extraction. The serum was separated and used for biochemical analysis. In addition, stool samples were collected for the analysis of gut microbiota. All samples were immediately identified and stored at −80 °C until processed. Standardized methods from the HCFMRP-USP hospital analyzed fasting glucose, total cholesterol, LDL-cholesterol, HDL-cholesterol, and triglycerides.

2.7. Gut Microbiota Analysis

Stool DNA was extracted using the kit QIAamp® Fast DNA Stool Mini (QIAGEN, Redwood City, CA, USA). The quantitative PCR (qPCR, Thermo Fisher Scientific|Waltham, MA, USA) of the relative quantification of the Firmicutes, Bacteroides, Actinobacteria, and Proteobacteria phyla was performed using universal ribosomal 16S (16S rRNA) or taxon-specific gene primers. Differences (ΔCT) between cycle threshold (CT) values of eubacteria and specific bacterial groups were used to obtain normalized levels of each bacterial group (2 −ΔCT) [8].
The primer sequences used for each Phylum are described in Table 1. The primers used in the study were based on the primer sequences already described by Barman M, et al. (2008) [9], Yang, YW et al., 2015 [10]. Before their use in qPCR, all of them were tested and standardized relative to the adequate primer concentrations (efficiency), and DNA concentrations, and the better threshold was determined.
Primers were at 10 µM. In each assay well, 20 ng of DNA, ultrapure water, and master mix (Sybr Green, Promega®, Fitchburg, WI, USA) were used with a final volume of 10 µL. The relative quantification of the different phyla (Firmicutes, Bacteroides, Actinobacteria, Proteobacteria, and Verrucomicrobia) was performed in triplicate by the real-time PCR method using the Step One Plus Real-Time apparatus PCR System® (qPCR, Thermo Fisher Scientific|Waltham, MA, USA). As a reference, a primer was used for the sequence of universal 16S rRNA. The 16S rRNA gene is a widely used sequence to study bacterial phylogeny and taxonomy, as it is the most common reference gene among the taxon Eubacteria. After the reaction, the results were analyzed by the software Step One Plus® V2.3 (Thermo Fisher Scientific, Waltham, MA, USA).

2.8. Statistical Analysis

Descriptive statistics are shown in mean and standard deviation. Firstly, the Shapiro–Wilk test was used to evaluate the normality distribution of data. Next, independent t-tests or Mann–Whitney tests were used to compare groups. Paired t-tests or Wilcoxon was used to compare times for the hypocaloric diet intervention. Finally, Pearson or Spearman correlations were performed to verify associations. SPSS (v 23.0, Chicago, IL, USA) Software package (SPSS. Inc., Chicago, IL, USA) was used for all statistical analysis analyses. Statistical significance was set at p < 0.05. Function lm in R was used to perform linear regressions.

3. Results

3.1. Phenotypic Characteristics

A total of 20 women were eligible for the present study. The Obese Group (ObG) composed of 10 women who completed the 8-week intervention. The ObG was composed of women with grade III obesity, with a mean age of 33.7 ± 3.1 years (Figure 1).
The anthropometric, body composition, and biochemical data are described in Table 2. After the hypocaloric diet intervention in ObG, we observed a significant decrease in body weight, fat mass (kg), and BMI (p < 0.05). As expected, lipid levels were significantly higher in the ObG, and after the hypocaloric diet intervention, we found a reduction in triglyceride levels (p < 0.05) (Table 2).
After the intervention, we found a decrease in energy intake, carbohydrates, proteins, SFAs, and PUFAs (Table 3).

3.2. Relationship between Gut Microbiota and Dietary Intake

Interestingly, we found a negative correlation between the relative abundance of Actinobacteria phylum and the percentage of carbohydrate intake in ObG before the intervention (r = −0.929; p = 0.001) (Table 4).
Linear regression showed that CHO (%) explained 40% of the relative abundance of Actinobacteria phylum (r2 = 0.405, p = 0.047). On the other hand, after the intervention, there was a positive correlation between the relative abundance of Actinobacteria phylum and fibers intake (g) (r = 0.787; p = 0.012), between Firmicutes phylum and protein intake (%) (r = 0.736; p = 0.024), and between Proteobacteria phylum and lipids (%) (r = 0.669; p = 0.049) (Table 4). The linear regressions revealed that after the intervention, the intake of lipids (%) (r2 = 0.66, p = 0.007) explained 66% (r2 = 0.742, p = 0.017), and the omega-6 (g) intake explained 74% of the relative abundance of Proteobacteria phylum (r2 = 0.742; p = 0.01).

4. Discussion

Our study aimed to investigate the relationship between dietary intake, nutritional status, and intestinal microbiota, to elucidate the mechanisms underlying nutrient metabolism and offer new perspectives for personalized dietary approaches. As a result, the nutritional intervention showed reductions in weight, BMI, and fat mass values, in addition to presenting significant biochemical changes in the concentrations of HDL-cholesterol, LDL-cholesterol, and triglycerides. Other patterns that underwent significant changes after 8 weeks of dietary intake under the hypocaloric diet intervention were significant increases in energy and reductions in carbohydrates, protein, saturated fatty acids, and polyunsaturated fatty acids. When we observed the correlation analysis, we identified a negative correlation between the relative abundance of the phylum Actinobacteria and the percentage of carbohydrate intake in the ObG before the intervention.
Diet plays a significant role in microbial metabolism and may present positive or negative modulation of the individual’s microbiome [11]. Individualized home-based nutritional interventions centered on quantitative and qualitative modifications in the patient’s diet enable successful weight management due to the provision of portion control, improving the quality of the diet [12]. In the present study, the individualized diet plan with a 30% restriction in energy requirements and micronutrient adequacy for 8 weeks was effective in decreasing body weight. On average, there was a decrease in the BMI, FM, and triglyceride levels in the women with obesity. Corroborating with our findings, Hernández-Reyes et al., 2019 showed that a short-term 12-week hypocaloric diet (reduction of 500 kcal/day) allied with nutritional counseling was beneficial to weight loss, demonstrating the importance of the home-based nutritional intervention to manage and treat obesity [13].
Restricted energy intake and food choices could be responsible for the triglyceride-lowering effect, especially carbohydrate restriction, resulting in a fundamental shift in cellular energy provision to reliance on predominantly fatty acids and ketones, with a concomitant reduction in glycolytic flux. The shift in metabolic fuel partitioning results in significant reductions in circulating fatty acid levels and anti-inflammatory effects [14]. Indeed, we observed a decrease in triglyceride levels after a hypocaloric diet intervention in women with obesity, similar to the results found in the literature [15], indicating that this nutritional approach promotes weight loss and assists in the improvement of metabolic parameters related to obesity-associated diseases.
The literature demonstrates that microbiota modulates the pathogenesis, progression, and treatment of diseases.
In this sense, diet is the critical determinant of microbiota configuration by modulating specific species’ abundance and individual or collective functions [11]. In a review by Koloziejczyk et al., 2019, the authors emphasized that the specific effects of a diet differ from person to person and that they are influenced by a combination of characteristics of the host and the microbiome; it is worth mentioning that the latter’s influence is mainly determined by the environment in which the individual is inserted and not by genetic history and, therefore, is potentially more amenable to interventions [11]. Johnson et al., 2017 also pointed to the individual variance in the gut microbiota, considering the distinctive influence of environmental factors across hosts in a population and highlighting diet as a significant driver of microbiome diversity [16].
The effect is mediated by changes in the capacity of the human microbiota to harvest energy from the diet and by the interaction between bacteria and the host. The observations suggest that diet composition is not the only determinant to be analyzed for weight gain and underscores that the microbiota is a key factor in regulating human energy absorption and metabolism.
Interestingly, we found that the carbohydrate intake affected the Actinobacteria phylum relative abundance before and after the hypocaloric diet intervention in different ways, depending on the type and amount of carbohydrate. In the pre-intervention period, there was a negative strong correlation between Actinobacteria and total carbohydrates (r = −0.929, p = 0.001), and in the post-intervention period, there was a positive correlation of fibers and Actinobacteria (r = 0.787, p = 0.012). A study reported that the consumption of dietary fibers and prebiotic substances in food leads to beneficial relative proportions of the phyla Actinobacteria [17]. Barczynska et al., 2015, confirmed that dietary fiber preparations obtained from potato starch stimulated the growth of strains belonging to the phylum Bacteroides and Actinobacteria and concluded that dietary fiber might be used prophylactically as a mechanism to prevent obesity [18]. Differences in the effect of carbohydrates on the human gut microbiota, especially under conditions of obesity, may occur, as specific bacteria can grow on certain types of consumed carbohydrates [19].
Dietary fat significantly affects the composition and function of the gut microbiota, influencing host metabolism [20]. We observed a positive correlation between total lipid intake and Proteobacteria abundance [21]. The study by Vaughn et al., 2017 also found an increase in Proteobacteria proliferation after a high-fat diet [22]. Remarkably, preliminary investigations have shown that the abundance of these bacterial lineages represents a significant risk factor for human health, such as dysbiosis [21]. Although the literature presents strong evidence that fat from different sources has different effects on the intestinal microbiota, the role of specific fatty acids is still unknown [23].
Protein content in food also influences the composition of the intestinal microbiota, showing substantial interpersonal variation in the composition and abundance of species [24]. Protein digestibility and amino acid composition, when influenced by their source of ingestion, play a fundamental role in determining the microbiota. The literature shows, in animal studies, that the consumption of red meat significantly increases the relative abundance of the phylum Firmicutes while decreasing the phylum Bacteroides; increasing the Firmicutes/Bacteroides ratio is often associated with increased BMI in humans [24]. Indeed, there was a positive correlation between the phylum Firmicutes and protein intake, even after the hypocaloric diet intervention. Although the intervention promoted significant weight loss, patients were still classified as obese.
Alterations in short-chain fatty acid (SCFA) production can influence metabolic outcomes through various mechanisms. For instance, SCFAs contribute to energy homeostasis by serving as substrates for hepatic gluconeogenesis and lipid synthesis, thereby impacting glucose and lipid metabolism. The interplay between dietary composition, gut microbiota, and SCFA production underscores the complexity of metabolic regulation [23]. While our study focused on changes in gut microbiota composition and dietary intake, the role of SCFAs in mediating metabolic outcomes warrants consideration. Future investigations exploring SCFA profiles in response to dietary interventions in obesity management can provide valuable insights into the mechanisms underlying metabolic improvements. Furthermore, strategies aimed at modulating SCFA production through dietary manipulation or targeted prebiotic supplementation may represent promising avenues for optimizing metabolic health in individuals with obesity. Integrating SCFA analysis into future studies can enhance our understanding of the intricate relationships between diet, gut microbiota, and metabolic health, facilitating the development of personalized dietary approaches for obesity management.
Regarding the methodology, we can point out some technical limitations of qPCR compared to 16s sequencing. In this study, we analyzed the gut microbiota at the phylum level. The number of participants in the study is also a limitation. Depending on the sequencing methodology, it is possible to evaluate gut microbiota at different species levels. We also chose qPCR because it is more suitable for clinical practice. Together, the results presented and discussed here pointed to dietary composition as a central factor in the metabolic output of the gut microbiota, mainly because the diet affects the gut microbiota composition and, thereby, its metabolic potential and impact on the host.
We also suggest that future studies evaluate the effects of the washout period post-diet intervention. The relationships observed between nutrients and microbiota were highly dependent on food intake, indicating a dynamic interaction. Understanding how these relationships change during the washout period can provide further insights into the dynamic nature of the connections between nutrients and microbiota.

5. Conclusions

Our study on obese women undergoing an 8-week hypocaloric diet intervention revealed significant improvements in anthropometric parameters, body composition, and lipid profile. Dietary changes included reduced energy intake, carbohydrates, proteins, SFAs, and PUFAs. Before the intervention, Actinobacteria abundance negatively correlated with carbohydrate intake, while after the intervention, Actinobacteria correlated positively with fiber intake, Firmicutes with protein intake, and Proteobacteria with lipid intake. Linear regression highlighted the influence of specific dietary components on gut microbiota composition. These findings underscore the complex interplay between diet, gut microbiota, and metabolic health in obesity management, emphasizing the potential for personalized dietary interventions to optimize outcomes. Further research is needed to elucidate underlying mechanisms and refine personalized dietary strategies for obesity treatment and prevention.

Author Contributions

Conceptualization, N.Y.N., L.d.S.M., L.M.W., M.A.d.S.P. and G.d.S.R.; methodology, N.Y.N., L.d.S.M., L.M.W. and I.M.S.; validation, N.Y.N., L.d.S.M., L.M.W., G.d.S.R. and C.F.N.; formal analysis, N.Y.N., L.d.S.M., L.M.W. and H.B.P.D.; investigation, C.F.N. and H.B.P.D.; resources, D.C. and C.B.N.; data curation, N.Y.N., L.d.S.M., L.M.W., M.A.d.S.P., I.M.S. and G.d.S.R.; writing—preparation of the original draft, N.Y.N., L.d.S.M. and L.M.W.; financing acquisition, D.C. and C.B.N. All authors wrote, revised, and made necessary edits. All authors have read and agreed to the published version of the manuscript.

Funding

This work was supported by Brazilian grants from Fundação de Amparo à Pesquisa do Estado de São Paulo (BR) (FAPESP) to C.B.N. under grant 2018/24069-3, to N.Y.N. under grant 2014/16740-6, to L.M.W. under grant 2020/08687-9, and to D.C. under grants 2012/10395-0 and 2018/14815-0. Coordenação de Aperfeiçoamento de Pessoal de Nível Superior (CAPES) also supported N.Y.N. under grant 88882.180020/2018-01.

Institutional Review Board Statement

The study was conducted in accordance with the Declaration of Helsinki, and approved by the Ethics Committee of Ribeirão Preto Medical School at the University of São Paulo, Brazil (process CAAE: 57459816.1.0000.5440).

Informed Consent Statement

Informed consent was obtained from all subjects involved in the study.

Data Availability Statement

The data that support the findings of this study are available on request from the corresponding author, GSR. The data are not publicly available as they contain information that could compromise the privacy of research participants.

Conflicts of Interest

The authors declare no conflicts of interest. The funders had no role in the design of the study; in the collection, analyses, or interpretation of data; in the writing of the manuscript; or in the decision to publish the results.

References

  1. Pesquisa do IBGE Mostra Aumento da Obesidade Entre Adultos. Available online: https://www.gov.br/pt-br/noticias/saude-e-vigilancia-sanitaria/2020/10/pesquisa-do-ibge-mostra-aumento-da-obesidade-entre-adultos#:~:text=A%20propor%C3%A7%C3%A3o%20de%20obesos%20na,%25%20para%2022%2C8%25 (accessed on 13 January 2023).
  2. Bernal, R.T.I.; Iser, B.P.M.; Malta, D.C.; Claro, R.M. Sistema de Vigilância de Fatores de Risco e Proteção para Doenças Crônicas por Inquérito Telefônico (Vigitel): Mudança na metodologia de ponderação. Epidemiol. Serviços Saúde 2017, 26, 701–712. [Google Scholar] [CrossRef] [PubMed]
  3. James, P.T.; Leach, R.; Kalamara, E.; Shayeghi, M. The Worldwide Obesity Epidemic. Obes. Res. 2001, 9, 228S–233S. [Google Scholar] [CrossRef] [PubMed]
  4. Hall, A.; Versalovic, J. Microbial Metabolism in the Mammalian Gut: Molecular Mechanisms and Clinical Implications. J. Pediatr. Gastroenterol. Nutr. 2018, 66, S72–S79. [Google Scholar] [CrossRef] [PubMed]
  5. Costello, E.K.; Lauber, C.L.; Hamady, M.; Fierer, N.; Gordon, J.I.; Knight, R. Bacterial Community Variation in Human Body Habitats Across Space and Time. Science 2009, 326, 1694–1697. [Google Scholar] [CrossRef]
  6. Gomes, A.C.; Hoffmann, C.; Mota, J.F. The human gut microbiota: Metabolism and perspective in obesity. Gut Microbes 2018, 18, 1–18. [Google Scholar] [CrossRef] [PubMed]
  7. Institute of Medicine (US) Panel on Energy and Related Compounds. Dietary Reference Intakes for Energy, Carbohydrates, Fibers, Fat, Fat Acids, Cholesterol, Protein and Aminoacids; National Academies Press: Washington, DC, USA, 2000. [Google Scholar]
  8. Livak, K.J.; Schmittgen, T.D. Analysis of Relative Gene Expression Data Using Real-Time Quantitative PCR and the 2−ΔΔCT Method. Methods 2001, 25, 402–408. [Google Scholar] [CrossRef]
  9. Barman, M.; Unold, D.; Shifley, K.; Amir, E.; Hung, K.; Bos, N.; Salzman, N. Enteric Salmonellosis Disrupts the Microbial Ecology of the Murine Gastrointestinal Tract. Infect. Immun. 2008, 76, 907–915. [Google Scholar] [CrossRef] [PubMed]
  10. Yang, Y.W.; Chen, M.K.; Yang, B.Y.; Huang, X.J.; Zhang, X.R.; He, L.Q.; Zhang, J.; Hua, Z.C. Use of 16S rRNA Gene-Targeted Group-Specific Primers for Real-Time PCR Analysis of Predominant Bacteria in Mouse Feces. Appl. Environ. Microbiol. 2015, 81, 6749–6756. [Google Scholar] [CrossRef] [PubMed]
  11. Kolodziejczyk, A.A.; Zheng, D.; Elinav, E. Diet–microbiota interactions and personalized nutrition. Nat. Rev. Microbiol. 2019, 17, 742–753. [Google Scholar] [CrossRef]
  12. Sorgente, A.; Pietrabissa, G.; Manzoni, G.M.; Re, F.; Simpson, S.; Perona, S.; Rossi, A.; Cattivelli, R.; Innamorati, M.; Jackson, J.B.; et al. Web-Based Interventions for Weight Loss or Weight Loss Maintenance in Overweight and Obese People: A Systematic Review of Systematic Reviews. J. Med. Internet Res. 2017, 19, e229. [Google Scholar] [CrossRef]
  13. Hernández-Reyes, A.; Cámara-Martos, F.; Molina-Luque, R.; Romero-Saldaña, M.; Molina-Recio, G.; Moreno-Rojas, R. Changes in body composition with a hypocaloric diet combined with sedentary, moderate and high-intense physical activity: A randomized controlled trial. BMC Womens Health 2019, 19, 167. [Google Scholar] [CrossRef] [PubMed]
  14. Magkos, F.; Fraterrigo, G.; Yoshino, J.; Luecking, C.; Kirbach, K.; Kelly, S.C.; de Las Fuentes, L.; He, S.; Okunade, A.L.; Patterson, B.W.; et al. Effects of Moderate and Subsequent Progressive Weight Loss on Metabolic Function and Adipose Tissue Biology in Humans with Obesity. Cell Metab. 2016, 23, 591–601. [Google Scholar] [CrossRef] [PubMed]
  15. Cortes-Oliveira, C.; Nicoletti, C.F.; de Souza Pinhel, M.A.; de Oliveira, B.A.P.; Quinhoneiro, D.C.G.; Noronha, N.Y.; Marchini, J.S.; da Silva Júnior, W.A.; Júnior, W.S.; Nonino, C.B. UCP2 expression is associated with weight loss after hypocaloric diet intervention. Eur. J. Clin. Nutr. 2017, 71, 402–406. [Google Scholar] [CrossRef]
  16. Johnson, E.L.; Heaver, S.L.; Walters, W.A.; Ley, R.E. Microbiome and metabolic disease: Revisiting the bacterial phylum Bacteroidetes. J. Mol. Med. 2017, 95, 1–8. [Google Scholar] [CrossRef] [PubMed]
  17. Deehan, E.C.; Zhang, Z.; Riva, A.; Armet, A.M.; Perez-Muñoz, M.E.; Nguyen, N.K.; Krysa, J.A.; Seethaler, B.; Zhao, Y.Y.; Cole, J.; et al. Elucidating the role of the gut microbiota in the physiological effects of dietary fiber. Microbiome 2022, 10, 77. [Google Scholar] [CrossRef] [PubMed]
  18. Barczynska, R.; Slizewska, K.; Litwin, M.; Szalecki, M.; Zarski, A.; Kapusniak, J. The effect of dietary fiber preparations from potato starch on the growth and activity of bacterial strains belonging to the phyla Firmicutes, Bacteroidetes, and Actino-bacteria. J. Funct. Foods 2015, 19, 661–668. [Google Scholar] [CrossRef]
  19. Ballard, K.D.; Quann, E.E.; Kupchak, B.R.; Volk, B.M.; Kawiecki, D.M.; Fernandez, M.L.; Seip, R.L.; Maresh, C.M.; Kraemer, W.J.; Volek, J.S. Dietary carbohydrate restriction improves insulin sensitivity, blood pressure, microvascular function, and cellular adhesion markers in individuals taking statins. Nutr. Res. 2013, 33, 905–912. [Google Scholar] [CrossRef] [PubMed]
  20. Schoeler, M.; Caesar, R. Dietary lipids, gut microbiota and lipid metabolism. Rev. Endocr. Metab. Disord. 2019, 20, 461–472. [Google Scholar] [CrossRef] [PubMed]
  21. Méndez-Salazar, E.O.; Ortiz-López, M.G.; Granados-Silvestre M de los, Á.; Palacios-González, B.; Menjivar, M. Altered Gut Microbiota and Compositional Changes in Firmicutes and Proteobacteria in Mexican Undernourished and Obese Children. Front. Microbiol. 2018, 9, 2494. [Google Scholar]
  22. Vaughn, A.C.; Cooper, E.M.; DiLorenzo, P.M.; O’Loughlin, L.J.; Konkel, M.E.; Peters, J.H.; Hajnal, A.; Sen, T.; Lee, S.H.; de La Serre, C.B.; et al. Energy-dense diet triggers changes in gut microbiota, reorganization of gut-brain vagal communication and increases body fat accumulation. Acta Neurobiol. Exp. 2017, 77, 18–30. [Google Scholar] [CrossRef]
  23. He, J.; Zhang, P.; Shen, L.; Niu, L.; Tan, Y.; Chen, L.; Zhao, Y.; Bai, L.; Hao, X.; Li, X.; et al. Short-Chain Fatty Acids and Their Association with Signalling Pathways in Inflammation, Glucose and Lipid Metabolism. Int. J. Mol. Sci. 2020, 21, 6356. [Google Scholar] [CrossRef] [PubMed]
  24. Albracht-Schulte, K.; Islam, T.; Johnson, P.; Moustaid-Moussa, N. Systematic Review of Beef Protein Effects on Gut Microbiota: Implications for Health. Adv. Nutr. 2021, 12, 102–114. [Google Scholar] [CrossRef] [PubMed]
Figure 1. ObG group flow chart and process of adherence to the study.
Obesities 04 00005 g001
Table 1. Primer sequences used in this study.
PhylumPrimer Sequence
FirmicutesF-ATGTGGTTTAATTCGAAGCA
R-AGCTGACGACAACCATGCAC
BacteroidesF-GTTTAATTCGATGATACGCGAG
R-TTAASCCGACACCTCACGG
ActinobacteriaF-TGTAGCGGTGGAATGCGC
R-AATTAAGCCACATGCTCCGCT
ProteobacteriaF-CATGACGTTACCCGCAGAAGAAG
R-CTCTACGAGACTCAAGCTTGC
VerrucomicrobiaF-TCAKGTCAGTATGGCCCTTAT
R-CAGTTTTYAGGATTTCCTCCGCC
rRNA 16S universalF-AACAGGATTAGATACCCTGGTAG
R-GGTTCTTCGCGTTGCATC
Table 2. Anthropometric and body composition data of obese women before and after hypocaloric diet intervention and control group.
ParametersObese Group (ObG)
(n = 10)
BeforeAfter
Weight (kg)119.5 ± 10.3114.9 ± 10.2 *
BMI (kg/m2)43.6 ± 2.441.9 ± 2.6 ± 2.6 *
Abdominal circumference (cm)123.3 ± 10.8121.4 ± 7.1
Fat mass (kg)62.4 ± 7.558.9 ± 7.7 *
Fat mass (%)51.9 ± 2.550.9 ± 2.7
Fat-free mass (kg)57.1 ± 3.855.9 ± 3.6
Fat-free mass (%)48.1 ± 2.549.1 ± 2.7
RMR (kcal/day)1976.3 ± 256.11942.1 ± 288.9
Fasting glucose (mg/dL)95.2 ± 18.191 ± 14.9
Total cholesterol (mg/dL)196.0 ±25.7184.0 ± 41.7
HDL-cholesterol (mg/dL)45.9 ± 6.841.2 ± 8.0 *
LDL-cholesterol (mg/dL)121.4 ± 27.8119.4 ± 23.9
Triglycerides (mg/dL)143.2 ±60.9117.94 ± 48.3 *
Values are shown as mean ± standard deviation. BMI: body mass index, and RMR: resting metabolic rate. * p < 0.05 related to ObG before the diet.
Table 3. Dietary intake data of ObG before and after hypocaloric diet intervention.
NutrientsObese Group (ObG)
(n = 10)
BeforeAfter
Energy (kcal/day)1679.9 ± 279.01140.5 ± 196.1 *
Carbohydrate (g/day)196.4 ± 43.7127.6 ± 23.1 *
Carbohydrate (%TEI)47.2 ± 4.746.2 ± 10.6
Protein (g/day)78.4 ± 15.763.0 ± 10.4 *
Protein (%TEI)18.8 ± 2.522.7 ± 4.7
Total Lipids (g/day)62.1 ± 9.141.3 ± 23.7
Total Lipids (%TEI)32.2 ± 6.930.7 ± 13.1
Fibers (g/day)9.3 ± 3.511.4 ± 2.5
Cholesterol (mg/day)269.5 ± 64.5240.7 ± 110.3
SFAs (g/day)22.4 ± 5.213.7 ± 8.4 *
MUFAs (g/day)19.9 ± 5.215.9 ± 12.01
PUFAs (g/day)9.9 ± 3.16.0 ± 2.2 *
Values are shown as mean ± standard deviation. TEI: total energy intake; SFAs: saturated fatty acids; MUFAs: monounsaturated fatty acids; PUFA: polyunsaturated fatty acids. * p < 0.05 related to the ObG group before the diet.
Table 4. Correlation between the relative abundance of each Phylum and variables of food intake of obese women before and after hypocaloric diet intervention (intervention group).
PhylaFirmicutesActinobacteriaProteobacteria
Before Intervention
Correlationrprprp
CHO (%)0.0170.966−0.9290.001 *0.360.342
After Intervention
Correlationrprprp
Fibers (g)0.5860.0970.7870.012 *0.2180.574
Protein (%)0.7360.024 *0.2850.485−0.4350.242
Total Lipids (%)0.4690.203−0.1170.7640.6690.049 *
Omega-6 (g)0.4850.1850.2010.6040.6800.045 *
r: correlation coefficient; %: percentage; g: grams; kcal: calories. * p < 0.05.
Disclaimer/Publisher’s Note: The statements, opinions and data contained in all publications are solely those of the individual author(s) and contributor(s) and not of MDPI and/or the editor(s). MDPI and/or the editor(s) disclaim responsibility for any injury to people or property resulting from any ideas, methods, instructions or products referred to in the content.

