Article

Benefits of Combined Fluorescence Lifetime Imaging Microscopy and Fluorescence Correlation Spectroscopy for Biomedical Studies Demonstrated by Using a Liposome Model System

by
Kristina Bruun
1,
Hans-Gerd Löhmannsröben
1,* and
Carsten Hille
2
1
Physical Chemistry, Institute of Chemistry, University of Potsdam, Karl-Liebknecht-Str. 24-25, 14476 Potsdam, Germany
2
Center for Research and Transfer, Technical University of Applied Sciences Wildau, Hochschulring 1, 15745 Wildau, Germany
*
Author to whom correspondence should be addressed.
Submission received: 12 March 2024 / Revised: 17 April 2024 / Accepted: 23 April 2024 / Published: 25 April 2024

Abstract

:
Drug delivery systems play a pivotal role in targeted pharmaceutical transport and controlled release at specific sites. Liposomes, commonly used as drug carriers, constitute a fundamental part of these systems. Moreover, the drug–liposome model serves as a robust platform for investigating interaction processes at both cellular and molecular levels. To advance our understanding of drug carrier uptake mechanisms, we employed fluorescence lifetime imaging microscopy (FLIM) and fluorescence correlation spectroscopy (FCS), leveraging the unique benefits of two-photon (2P) excitation. Our approach utilized giant unilamellar vesicles (GUVs) as a simplified model system for cell membranes, labelled with the amphiphilic fluorescent dye 3,3′-dioctadecyloxa-carbocyanine (DiOC18(3)). Additionally, large unilamellar vesicles (LUVs) functioned as a drug carrier system, incorporating the spectrally distinct fluorescent sulforhodamine 101 (SRh101) as a surrogate drug. The investigation emphasized the diverse interactions between GUVs and LUVs based on the charged lipids employed. We examined the exchange kinetics and structural alterations of liposome carriers during the uptake process. Our study underscores the significance of employing 2P excitation in conjunction with FLIM and FCS. This powerful combination offers a valuable methodological approach for studying liposome interactions, positioning them as an exceptionally versatile model system with a distinct technical advantage.

1. Introduction

In recent decades, the biomedical use of nanoparticles has seen remarkable growth, particularly in areas such as targeted drug delivery, cancer therapy, and gene treatment [1,2,3,4,5]. Among these nanoparticles, liposomes have garnered significant attention from researchers. They serve as models for biological membranes and offer potential as carriers for various bioactive substances, with applications in both human and animal therapeutics [6,7,8]. In particular, the complex interplay between large unilamellar vesicles (LUVs) and giant unilamellar vesicles (GUVs) serves as a captivating model system to unravel fundamental insights into vesicle-mediated drug delivery processes. The versatility of this model system lies in its ability to imitate essential aspects of complex biological phenomena, allowing for controlled experimentation and observation [8]. However, in this study, we employ this system not solely to replicate biological processes, but as a powerful testbed to assess, evaluate, and demonstrate the unique advantages of our chosen technical approach: two-photon fluorescence lifetime imaging microscopy (2P-FLIM) and two-photon fluorescence correlation spectroscopy (2P-FCS).
The concept of vesicle-mediated drug delivery holds immense promise in the realm of targeted therapies [9,10,11]. By encapsulating therapeutic agents within LUVs, with sizes of approximately 100 nm in diameter, it becomes possible to precisely control the spatiotemporal release of these agents, enhancing their efficacy while minimizing off-target effects [12]. GUVs, characterized by their large size and distinct membrane properties, bear a striking resemblance to cellular membranes and serve as a remarkable surrogate to explore the dynamics of vesicle interactions and fusion events, which are crucial in drug delivery scenarios [13,14].
Traditionally, the investigation of such interactions has heavily relied on conventional fluorescence microscopy techniques [15,16]. While valuable insights have been gained through these methods, they are often accompanied by limitations related to photobleaching, phototoxicity, and spatial resolution. This is where 2P-FLIM and 2P-FCS enter the scene. These advanced techniques, especially in combination with 2P excitation, provide advantages that overcome the limitations of conventional fluorescence microscopy. Thus, 2P-FLIM enables us to not only visualize fluorescently labelled structures, but also to extract invaluable information about their fluorescence lifetimes. By doing so, we can discriminate between different fluorophores, assess their microenvironment, and reveal dynamic changes in molecular interactions—all with heightened spatial resolution and reduced photodamage [17,18]. On the other hand, 2P-FCS allows us to examine the diffusion dynamics of fluorescently tagged molecules within the confines of vesicular systems. The high specificity and non-invasiveness of 2P excitation, coupled with the excellent sensitivity of FCS, provide an unprecedented opportunity to probe the mobility of molecules within vesicles with exceptional precision [19,20].
In this study, we used the GUV-LUV model system to exploit the potential of 2P-FLIM and 2P-FCS. While the system itself mirrors critical aspects of vesicle interactions, our primary goal was to demonstrate how these advanced techniques could significantly contribute to a better understanding of vesicle dynamics. To study the effects of membrane charge, we encapsulated a hydrophilic fluorescent surrogate drug sulforhodamine 101 (SRh101) into cationic LUVs of different membrane compositions. The in vitro characteristics of the prepared SRh101-loaded LUVs were compared with the behaviour of the free fluorescent dye. Furthermore, GUVs (anionic or neutral) with increasing charge density in the membrane, obtained by changing the ratio of charged and zwitterionic lipids, represented a simplified cellular membrane. The LUV-GUV interaction process was triggered upon the addition of cationic LUVs. For fluorescence microscopic analysis, the GUV membrane was labelled with the amphiphilic fluorescent dye 3,3′-dioctadecyloxacarbocyanine (DiOC18(3)). Thus, 2P-FLIM and 2P-FCS could be successfully applied to the fluorophore–liposome combination (or model) used here. The resulting spatially resolved fluorescence lifetimes and diffusion characteristics allowed for a better understanding of the LUV-GUV interaction.

2. Materials and Methods

2.1. Material and Sample Preparation

The neutral lipids 1,2-dioleoyl-sn-glycero-3-phosphocholine (DOPC), 1,2-dioleoyl-sn-glycero-3-phosphoethanolamine (DOPE), the anionic lipid 1,2-dioleoyl-sn-glycero-3-phospho-L-serine (DOPS) and the cationic lipid 1,2-dioleoyl-3-trimehtylammonium-propane (DOTAP) were purchased from Avanti Polar Lipids (Alabaster, AL, USA). The fluorescent dye 3,3′-dioctadecyloxacarbocyanine perchlorate (DiOC18(3)) was from Life Technologies (Carlsbad, CA, USA), fluorescein was from Merck (Darmstadt, Germany) and rhodamine 6G was from Sirah (Grevenbroich, Germany). Sulforhodamine 101 (SRh101) and phosphate-buffered saline (PBS) were from Sigma-Aldrich (Steinheim, Germany), and chloroform and other chemicals were from Carl Roth (Karlsruhe, Germany).
Large unilamellar vesicles (LUVs) were prepared using a thin film hydration method [21,22]. DOPC:DOTAP (1:1 molar ratio) and DOPC:DOPE:DOTAP (1:1:2 molar ratio) were dissolved in chloroform and dried in a glass vial under nitrogen stream followed by removal of residual solvent under vacuum for ~3 h. The final concentration of lipids was 1 mM. Multilamellar vesicles were obtained by hydrating the lipid films using PBS (pH 7.4) supplemented with 10 μM SRh101. After 60 min incubation at 25 °C, the suspensions were subjected to 15 freeze–thaw cycles in liquid nitrogen with vortexing after each cycle. To form large unilamellar vesicles, the suspensions were passed 35 times through a mini-extruder (Avanti Polar Lipids, Alabaster, AL, USA) using two-stacked polycarbonate filters with a pore size of 100 nm. The final LUV preparations were stored in the dark at 4 °C until use, but for a maximum of 7 days.
Giant unilamellar vesicles (GUVs) with the lipid compositions DOPC:DOPE (3:1 molar ratio), DOPC:DOPS (3:1 molar ratio) and DOPC:DOPE:DOPS (8:3:2 molar ratio) were produced by the electroformation method [23]. The lipid mixture (5 mM) was supplemented with 0.1 mol% DiOC18(3) for fluorescence imaging during the fusion experiments. Briefly, a 10 μL lipid solution of a given lipid mixture in chloroform was spread on conductive indium tin oxide glass plates and the solvent was evaporated for 30 min under a stream of nitrogen and additional vacuum for ~3 h. A home-made Teflon spacer was sandwiched between two glass plates forming a chamber with ~1 mL volume, which was filled with a 100 mM sucrose solution and connected to a function generator (1.2 Vpp nominal voltage at 10 Hz). Vesicles were allowed to grow at room temperature for 2–3 h. After GUV formation, the vesicles were transferred into an Eppendorf tube and stored in the dark at 4 °C until use, for up to 5–7 days. For fluorescence recordings, GUVs were immobilised within an observation chamber constructed with a glass coverslip of precise thickness (170 ± 5 µm) and a 0.5 mm thick press-to-seal silicone isolator with adhesive (Life Technologies, Darmstadt, Germany). For immobilisation of the GUVs, the coverslip was pretreated with the tissue adhesive Vectabond (Axxora, Lörrach, Germany) and the GUVs could then passively adhere to the glass surface. For the GUV-LUV interaction experiments, 100 µL of LUV solution was added to the observation chamber with the immobilised GUVs diluted in 100 mM glucose solution.

2.2. Fluorescence Measurements

Fluorescence emission spectra (450 nm–800 nm, spectral bandwidth Δλ = 1 nm) were recorded with a FluoroMax 4 (Horiba, Kyoto, Japan) at an excitation wavelength of λex = 450 nm for DiOC18(3) and λex = 547 nm for SRh101. Concentrations were adjusted to avoid inner filter effects (absorption maximum below 0.1).
Time-resolved fluorescence measurements were performed by using a femtosecond fibre laser (C-Fiber A 780; Menlo System, Martinsried, Germany) operating at λex,2P = 780 nm with a repetition rate of 50 MHz, a pulse width of ~90 ps and laser power adjusted to ~5 mW. The emitted fluorescence intensity I(t) was detected by single-photon avalanche diodes (SPCM-AQR-13 and SPCM-CD-2801; Perkin Elmer, Waltham, MA, USA) in a time-correlated single-photon counting (TCSPC) mode. The fluorescence decay curves were fitted multi-exponentially, with α i being the amplitude of the ith component with the corresponding decay time τ i (Equation (1)). Additionally, the intensity-weighted average decay time τ a v ( i n t ) was calculated according to Equation (2). The goodness of the fits was judged on the reduced χ R 2 values and randomly distributed residuals.
I ( t ) = i α i exp ( t τ i ) + I b a c k g r o u n d with i = 1 3
τ av ( int ) = i = 1 n α i τ i 2 / i = 1 n α i τ i with i = 1 3

2.3. 2P Fluorescence Excitation Spectra

2P fluorescence excitation action cross-sections Φ F σ 2 were determined from relative measurements using the well-characterized 2P-reference dyes fluorescein (pH 13) and rhodamine 6G in methanol [24]. The concentrations of the reference dyes were adjusted for the respective samples and controlled by absorption spectra, if possible. Thus, for liposome-bound DiOC18(3), the fluorescein concentration was adjusted to 1.3 µM. For the encapsulated SRh101, the rhodamine 6G concentration was adjusted to 0.35 µM.
2P fluorescence excitation action cross-sections Φ F σ 2 (with 10−50 cm4 s/photon = 1 GM) were calculated according to the following equation:
Φ F σ 2 = I d υ c S σ 2 , S Φ F , S I S d υ c ,
where ∫ Idv is the integral of the 2P emission spectrum, c is the dye concentration and Φ F is the fluorescence quantum yield [25]. The subscript S indicates the parameters of the reference dye fluorescein and rhodamine 6G, which were used as 2P excitation standards with Φ F , S   determined to Φ F , S = 0.84 ± 0.04 and Φ F , S = 0.90 ± 0.05 (means ± SEM, N = 3), respectively [26], and known 2P absorption cross-sections σ 2 , S [24,27]. The absorption measurements were performed with a Lambda 750 UV/VIS spectrometer (Perkin Elmer, Waltham, MA, USA). Fluorescence quantum yields were determined absolutely with the C 9929 integration sphere system (Hamamatsu, Hamamatsu City, Japan). For ∫ Idv determination, a mode-locked Ti:Sa laser system (Tsunami 3960; Spectra Physics, Mountain View, CA, USA) was used as an excitation source operating at a 82 MHz repetition rate with a pulse width of ~80 fs. Average laser power at 780 nm was adjusted to ~260 mW by a circular neutral density filter. The Ti:Sa laser was tuned from 720 nm to 900 nm in 20 nm steps. The excitation light was coupled into the fluorescence lifetime spectrometer FL 920 (Edinburgh Instruments, Edinburgh, UK) and was focused via a lens on the quartz cuvette. The fluorescence emission was detected with a photomultiplier (S300 blue-sensitive R1527, Hamamatsu, Hamamatsu City, Japan) in a spectral range of 400 nm–700 nm in 1 nm steps. Stability of the average laser power was controlled between the measurements with a power meter (Fieldmaster LM10 HTD with a detection range of 10 mW to 10 W).

2.4. 2P-FLIM Recordings

2P microscopy in combination with FLIM was carried out by using the MicroTime 200 fluorescence lifetime microscope system (PicoQuant, Berlin, Germany). The setup included an inverted microscope (Olympus IX 71) equipped with an Olympus PlanApo ×100/NA 1.4 oil-immersion objective, on which the recording chamber could be mounted. 2P excitation was performed with the above-mentioned femtosecond fibre laser. The near infrared (NIR) laser beam was guided toward the objective via the microscope side port by using a dichroic mirror (2P-dichroic 725; Chroma, Fürstenfeldbruck, Germany). For the rejection of excitation light in the emission pathway, a short-pass filter was used (SP680 OD4, Edmund Optics, Karlsruhe, Germany). The emitted light was guided through a 100 µm pinhole, split by a dichroic mirror FF605 (AHF Analysentechnik, Tübingen, Germany) into the two detection channels and, additionally, filtered by passing through the bandpass filters 514/44 (“green” channel) and 700/75 (“red” channel) (AHF Analysentechnik, Tübingen, Germany), respectively. Single-photon avalanche diodes (SPCM-AQR-13 and SPCM-CD-2801; Perkin Elmer, Waltham, MA, USA) were used for fluorescence detection.
Time-resolved fluorescence image acquisition occurred by raster scanning the objective using a xy-piezo-positioner (Physik Instrumente, Karlsruhe, Germany) in the time-correlated single-photon counting (TCSPC) mode by using a PicoHarp 300 device with the applied time resolution of 8 ps (PicoQuant). Laser power was adjusted to achieve average photon counting rates ≤ 105 photons/s and peak rates close to 106 photons/s when recording FLIM images, thus below the maximum counting rate allowed by the TCSPC electronics to avoid pulse pile up. Full frame images of 80 µm × 80 µm with 150 pixel × 150 pixel and a pixel dwell time of 2.3 ms were recorded in ~50–60 s. Data acquisition and analysis were performed by using the SymPhoTime 64 software version 2.3 (PicoQuant). Briefly, all photons collected in a region of interest (ROI) were used to calculate a global histogram for the quantification of the mean fluorescence decay time. Fluorescence decay analysis occurred by deconvolution fitting. The decay fitting was estimated using residuals and χ R 2 values as quality parameters. Fluorescence intensity images were calculated by integrating all detected photons in every pixel, thereby ignoring the temporal information. The full width at half-maximum (FWHM) of the daily measured instrument response function (IRF) of the 2P-FLIM setup from backscattered excitation light was (220 ± 3) ps (mean ± SEM, N = 25). Based on the fluorescence lifetime analysis, every pixel in the image was then treated in the SymPhoTime 64 software in the same way, but this time with a maximum likelihood estimator resulting in false colour-coded FLIM images.
FLIM images were calculated separately for each detection channel using the SymPhoTime 64 software. The false-colour spectrum for displaying the respective decay times was adjusted to match the fluorescence spectrum of the specific dyes used. In the “green” detection channel (BP 514/44), decay times were displayed using green colour gradations, while in the “red” detection channel (BP 700/75), decay times were displayed using red colour gradations. Subsequently, the FLIM images generated in this manner were overlaid using additive colour mixing to visualize colocalization areas, where the overlapping regions appeared yellow. This method allowed us to identify areas within the sample where both fluorophores were present in close proximity or overlapped, indicating potential colocalization or interaction.

2.5. Fluorescence Correlation Spectroscopy

By using the MicroTime 200 system, we also performed FCS experiments to determine the diffusion characteristics of the fluorescently labelled samples. For experiments in aqueous solution, we used single-point FCS. In this case, the size of the 2P-excitation effective volume Veff,2P was daily calibrated using a 100 nM aqueous solution of rhodamine 6G with literature-known diffusion coefficient [28]. The size of Veff,2P can be calculated by the following equation [29]:
V eff , 2 P = ( π 2 ) 3 2 ω 0 2 z 0
where ω 0 and z 0 are the characteristic lateral and axial detection volume dimensions. The resulting lateral 1/e2 radius was ω 0 = (0.29 ± 0.01) μm, yielding an effective volume element of Veff,2P = (0.135 ± 0.006) fL (means ± SEM, N = 50). The experiments were performed at room temperature (22 ± 1 °C) with an excitation power set to ~5 mW (measured at the objective). The liposome systems were analysed at initially applied phospholipid and SRh101 concentrations of 1 mM and 10 μM, respectively. The SymPhoTime 64 software was used for data acquisition and the calculation of the corresponding correlation curve, which was based on a cross-correlation routine using the signal of both photodiodes.
The autocorrelation function G(τ) of free diffusing probes was analysed assuming a three-dimensional Gaussian 2P-excitation profile using the following equation [29,30]:
G ( τ ) = G ( 0 ) ( 1 + 8 D τ ω 0 2 ) 1 ( 1 + 8 D τ z 0 2 ) 1 / 2
with   D = ω 0 2 8 τ D
where τ is the lag time, D is the diffusion coefficient, G(0) is the amplitude at τ = 0 and τ D is the average diffusion time of the fluorescent particles diffusing through the focal volume.
For a known effective detection volume Veff, the concentration of the fluorescent diffusing particles C can by derived from the autocorrelation amplitude G(0) at τ = 0 by the following relationship [31]:
C = [ V eff G ( 0 ) ] 1 .

3. Results and Discussion

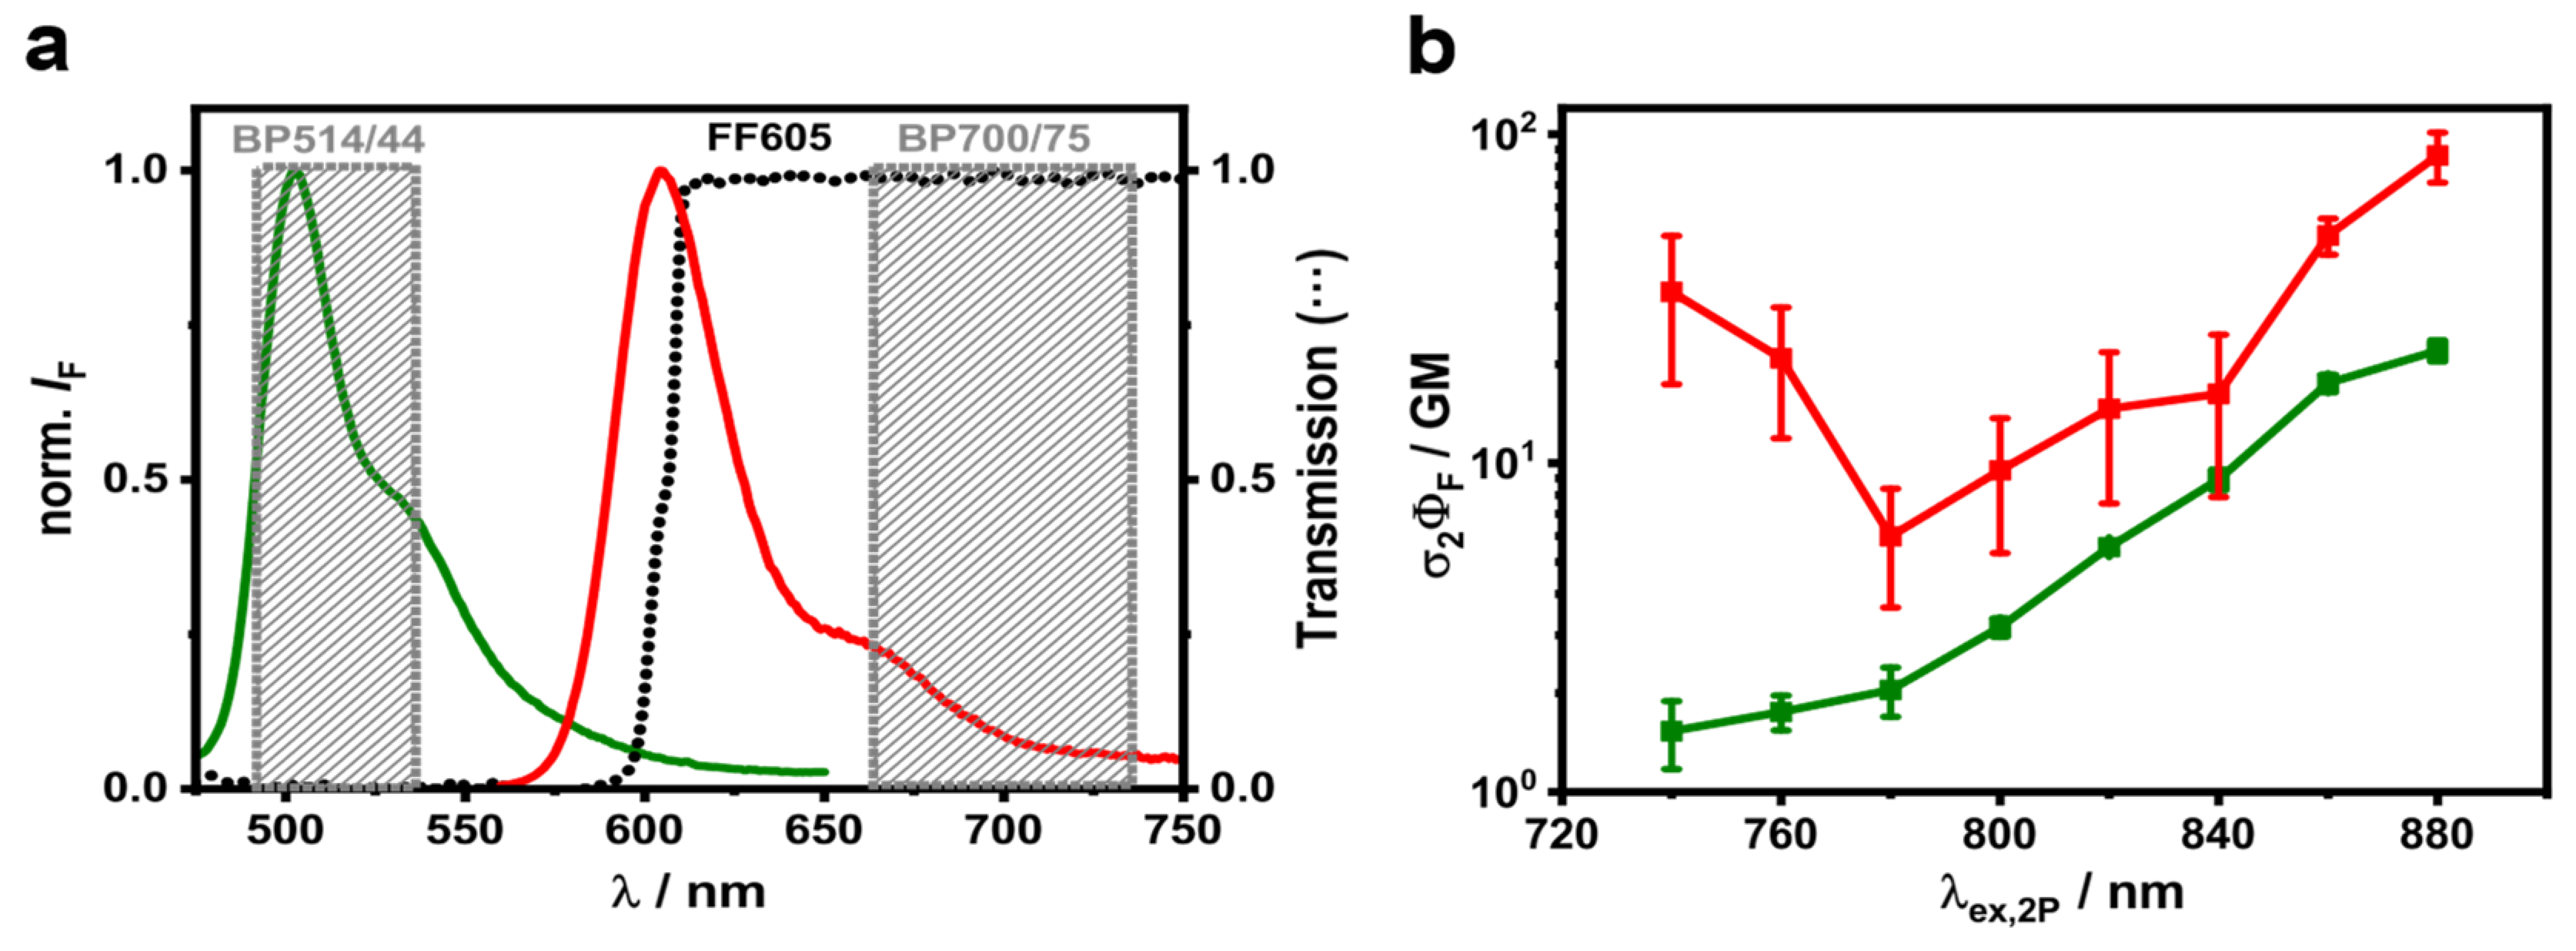
3.1. 2P Fluorescence Excitation Spectra of Fluorescently Labelled LUVs

Since liposomes are established model systems for studying targeted drug delivery, specific fluorescent labelling is required to observe the involved mechanisms in more detail with fluorescence measurements. Thereby, the selection of a suitable pair of dyes plays a crucial role in the application of both techniques, 2P-FCS and 2P-FLIM. First, the spectral overlap of their fluorescence emission characteristics should be minimal. Second, both dyes must be well 2P excitable by the same two-photon laser line and they should also tolerate the same excitation power without significant photobleaching [32]. In practice, it is important to recognize that every optimized two-photon dual-colour setup represents a carefully considered compromise, which arises from the inherent variations in photostability, quantum yield, absorption spectra, and other characteristics of the selected dye system. In this work, the dye system selected for the liposome interaction experiments consisted of the “green-emitting” dye DiOC18(3) and the “red-emitting” dye SRh101. While SRh101 is water soluble and accumulates as a surrogate drug inside liposomes, the lipophilic dye DiOC18(3) serves as a marker of liposome membranes. Since spectral properties of dyes often differ depending on their microenvironment, the proposed dye pair were first measured in their intended liposome environment rather than in a pure solvent. Figure 1a shows the fluorescence emission spectra for both dyes in LUVs. The dyes exhibited fluorescence peaks at λem,max = 502 nm and λem,max = 604 nm, respectively, which fit well with previously published data [33,34]. Compared to free dyes in solution, both fluorescent markers showed no significant changes in their emission spectra concerning shape and peak maxima in a liposomal environment. In addition, the rather well-separated fluorescence maxima allowed for a sufficient separation of the recorded fluorescence signals when using suitable optical elements. The transmission curves of the optical elements chosen for the dual-colour detection (dichroic and filters) were also measured and the results are shown in Figure 1a.
To determine the optimal excitation properties, the knowledge of 2P fluorescence excitation spectra was necessary. The efficiency of the 2P-excitation process could be quantified by the fluorescence excitation action cross-section as a product of the 2P-absorption cross-section σ 2 and fluorescence quantum yield Φ F . For that, the fluorescence quantum yields of the membrane-bound DiOC18(3) and encapsulated SRh101 were determined absolutely to Φ F = 0.40 ± 0.02 (mean ± SEM, N = 3) and Φ F = 0.26 ± 0.03 (mean ± SEM, N = 3), respectively. The 2P-absorption cross-sections were determined by relative measurements using fluorescein in an NaOH solution (pH 13) and rhodamine 6G in methanol as well-characterised 2P references [24].
In the measured spectral range of λex,2P = (740–880) nm, the obtained 2P fluorescence excitation action cross-section Φ F σ 2 of DiOC18(3)-labelled LUVs exhibited a continuous increase from 1.5 GM to 22 GM (Figure 1b, green dots). Furthermore, the calculated Φ F σ 2 value at λex,2P = 780 nm, the wavelength used for 2P-FCS and 2P-FLIM recordings, was determined to be Φ F σ 2 = (2.04 ± 0.35) GM (mean ± SEM, N = 3). A similar trend was published for other lipophilic dyes dialkyl carbocyanine DiOC5 and DiOC6, but these were only measured in methanol [35]. So, in the spectral range of λex,2P = (690–960) nm for these dyes, Φ F σ 2   values between 0.04 GM and 5 GM were reported, which were slightly lower than those measured here for DiOC18(3) in LUVs. This result indicated that the incorporation of DiOC18(3) into the lipid bilayer did not dramatically influence the efficiency of the 2P-excitation process.
The Φ F σ 2 values for SRh101 encapsulated in LUVs showed a local minimum at λex,2P = 780 nm and continued to increase at longer 2P-excitation wavelengths (Figure 1b, red dots). In the measured spectral range of λex,2P = (740–880) nm, Φ F σ 2 values of (6–86) GM were determined, thus slightly lower than those of the available data published for SRh101 in pure MOPS buffer [36]. Similar to DiOC18(3) in LUVs, the calculated Φ F σ 2 value at λex,2P = 780 nm was determined to be Φ F σ 2 = (6.0 ± 0.24) GM (mean ± SEM, N = 3), and thus, both liposome dye systems could be successfully applied in the 2P experiments. To the best of our knowledge and based on our literature review, this is the first time that these parameters have been determined within these liposomal contexts.

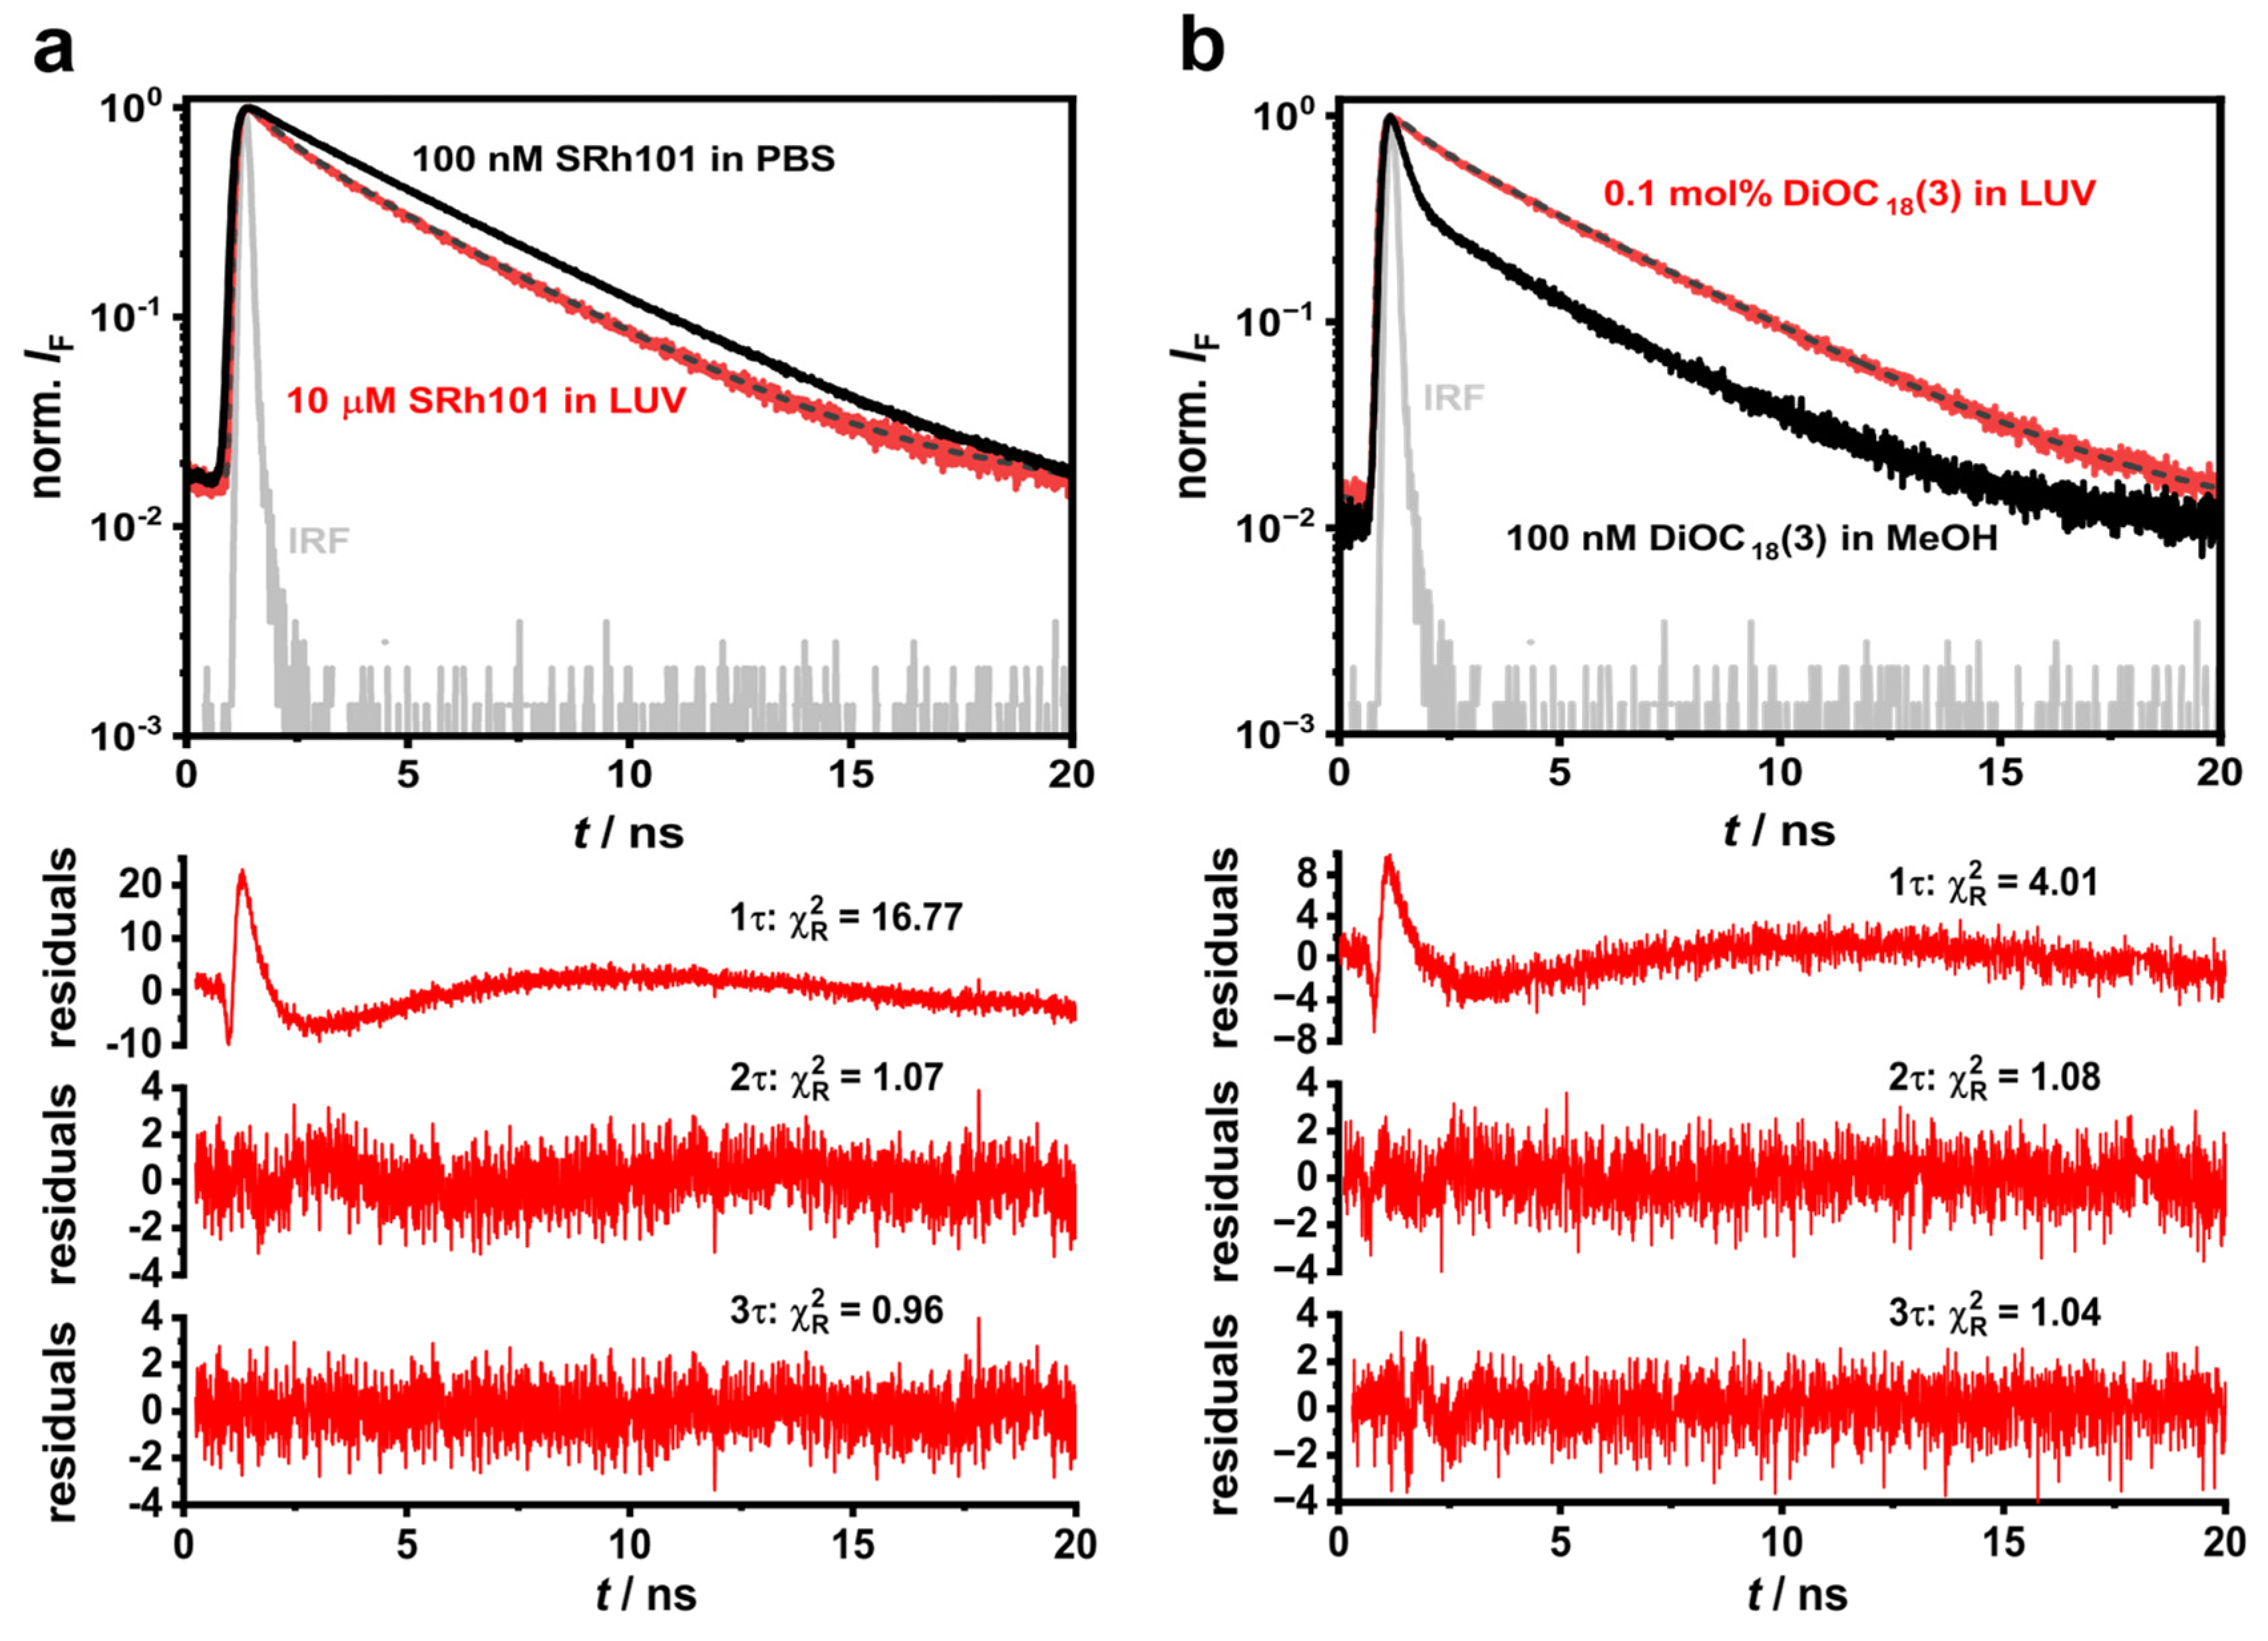
3.2. Time-Resolved Fluorescence Recordings of Fluorescently Labelled LUVs

The application of time-resolved fluorescence measurements is an attractive alternative approach to well-established fluorescence intensity measurements. Accessing the fluorescence decay time has the advantage of being mostly independent of the dye concentration, thus circumventing issues such as dye leakage and bleaching [37]. This is because the fluorescence lifetime primarily depends on the intrinsic properties of the fluorophore and its local microenvironment. Concerning quantitative recordings of GUV-LUV interactions, we compared the fluorescence decay behaviour of free and liposome-encapsulated SRh101, both dissolved in PBS. For this, cationic LUVs of varying SRh101 concentrations from (1–1000) µM were prepared, and subsequently analysed in time-resolved fluorescence measurements at λex,2P = 780 nm. In Figure 2a, representative fluorescence decay curves for both 100 nM free SRh101 and 10 μM SRh101 encapsulated in LUVs are shown, clearly revealing the different decay behaviour. The corresponding average decay times resulted from a deconvolution fitting analysis. As expected, for free SRh101, a monoexponential fit model provided the best fitting results with a decay time of τ = 3.96 ns ( χ R 2 = 1.12). The obtained value is similar to the data reported in the literature for free SRh101 in a buffer with τ = (4.2 ± 0.1) ns [34], as well as for the structurally similar fluorescent dye 6-carboxyfluorescein (τ = 4.42 ns) [38]. In the case of SRh101-encapsulated LUVs, the obtained fluorescence decay curves displayed a multiexponential decay behaviour. Hence, deconvolution fitting by means of a biexponential decay function yielded uniformly alternating residuals and reasonable χ R 2 values in comparison to a monoexponential decay function ( χ R 2 1.07 vs. 16.77). However, the application of a triexponential fitting analysis did not significantly improve the quality of the residuals and χ R 2 values ( χ R 2 1.07 vs. 0.96). Thus, all measured decay curves were analysed using the biexponential fitting model, yielding two decay time constants, whereby no significant change in their normalised amplitudes (α1 and α2) with increasing SRh101 concentration was observed. The long decay time component τ 1 = (3.80 ± 0.02) ns most probably represents the liposome-associated complexes, and the short decay time component τ 2 = (0.45 ± 0.04) ns is assumed to be related to a SRh101 environment with strong fluorescence quenching. This can be ascribed to diverse factors associated with the higher intravesicular concentration and the specific microenvironment within the liposomal membrane. Such multiexponential decay behaviour has been already discussed for SRh101 in DPPC:DCP liposomes [34] and for 6-carboxyfluorescein in DPPC liposomes [38]. Interestingly, VanderMeulen et al. have reported the occurrence of a third, very short decay time component, which is the major component at very high SRh101 concentrations (20–100 mM) supporting the strong dye quenching effect [34]. This phenomenon has been attributed to the complete quenching of the dye fluorescence inside the liposomes. For further analyses, the intensity-weighted average fluorescence decay time of liposome-encapsulated SRh101 was calculated to be τ a v ( i n t ) = (3.88 ± 0.03) ns (mean ± SEM, N = 10).
Analogous to SRh101, we investigated the fluorescence decay behaviour of DiOC18(3) in a methanol solution and in LUVs. Thus, the membrane of the cationic LUVs was labelled with the lipophilic dye using five different concentrations varying from 0.1 mol% to 10 mol%. The obtained fluorescence decay curves showed a complex, multiexponential decay behaviour, which changed as a function of the DiOC18(3) concentration. Figure 2b shows representative fluorescence decay curves for free 100 nM DiOC18(3) in methanol and for 0.1 mol% DiOC18(3) in LUVs. A monoexponential fit showed strongly fluctuating residuals for both the free and liposome-bound DiOC18(3) and large χ R 2 values of 22.6 and 4.01, respectively. In contrast, when using a biexponential fitting model, significantly smaller χ R 2 values were obtained ( χ R 2 1.19 for free DiOC18(3) and χ R 2 1.08 for liposome-bound DiOC18(3)). Since these values also showed no improvement using a triexponential fitting model (free DiOC18(3): χ R 2 1.12 vs. 1.19 and liposome-bound DiOC18(3): χ R 2 1.04 vs. 1.08), a biexponential fitting model was used to determine the fluorescence decay times. However, it turned out that, in liposomes, τav(int) decreased significantly with increasing dye concentration from τ a v ( i n t ) = (3.08 ± 0.18) ns to τ a v ( i n t ) = (0.72 ± 0.05) ns (means ± SEM, N = 4) for 0.1 mol% and 10 mol% DiOC18(3), respectively. A similar behaviour has already been observed for the lipophilic cyanine dyes CNdiI (with N = 12, 18, and 22) in a variety of membranes with lipid bilayers [39]. The sensitivity of these dyes to the chemical composition of the lipid membranes is cited as the cause for the occurrence of multiexponential fluorescence decays. Another factor contributing to such behaviour has been attributed to potential differences in energy levels and excited-state reactions [39,40]. Conversely, the reduction in τ a v ( i n t ) in LUVs with increasing DiOC18(3) concentration could be attributed to the dimerisation and extensive aggregation of this dye [41,42]. For free DiOC18(3) in methanol, the intensity-weighted average decay time from the biexponential fit analysis also exhibits a strong dependence on dye concentration. So, it decreased from τ a v ( i n t ) = (2.71 ± 0.02) ns for 100 nM DiOC18(3) to τ a v ( i n t ) = (0.43 ± 0.06) ns for 5 µM DiOC18(3) (means ± SEM, N = 4). This behaviour could suggest the formation of two distinct species, such as monomers and excimers, as previously demonstrated in the literature for DiOC18(3) in cyclohexanol [33].

3.3. Diffusion Characteristics of Fluorescently Labelled LUVs

In the next step, we examined the diffusion behaviour of the dye-labelled liposomes. To accomplish this, we measured the fluctuations in fluorescence intensity resulting from molecules diffusing through the detection volume and calculated the corresponding diffusion times of the fluorescent probe using the 2P-FCS technique. Therefore, the concentration of fluorescent molecules typically needs to be in the pM-nM-range. Accordingly, LUVs were prepared using an initially applied 10 μM concentration of SRh101. Figure 3 shows the autocorrelation curves of free and SRh101-encapsulated LUVs. When SRh101 was encapsulated within an LUV, the observed diffusion behaviour aligned with the characteristics of the LUV entity and demonstrated a notable decrease in speed compared to freely diffusing SRh101. Both autocorrelation curves were fitted according to Equation (5). For freely diffusing SRh101 in a PBS solution (pH 7.4), we found a diffusion coefficient of Dt = (34.4 ± 2.0) 10−11 m2 s−1 (mean ± SEM, N = 6), which corresponds to the unhindered diffusing probe. The associated diffusion time of τ D = (4.2 ± 0.3) 10−2 ms was determined according to Equation (6). Comparable values have been described in the literature for known organic fluorescent markers with molecular weights < 1000 g mol1 [28,43,44]. In contrast, due to the larger size of LUVs, the autocorrelation curve of SRh101-encapsulated LUVs shifted to longer diffusion times and was calculated to be τ D = (2.3 ± 0.1) ms (mean ± SEM, N = 9). The corresponding diffusion coefficient was decreased, yielding Dt = (0.59 ± 0.03) 10−11 m2 s1. The revealed trend is in good agreement with the data published for the dyes rhodamine in POPC vesicles, sulforhodamine B in polymeric nanocontainers, as well as ATTO-647N and rhodamine B in POPC-LUVs [43,44,45].
Additionally, FCS recordings allow for the determination of the average dye concentration encapsulated in the liposomes, even in the nM range. Using the amplitude of the correlation function G(τ) at time τ = 0, we calculated an average SRh101 concentration inside the LUVs of CSRh101 = (25 ± 3) nM (mean ± SEM, N = 9) (Equation (7)). Initially, 10 µM of SRh101 was applied during LUV preparation, resulting in the majority being washed out, leaving only a small amount accumulated in the liposomes. Nevertheless, the presented results indicate a sufficient and stable loading of SRh101 into LUVs under the applied experimental conditions.

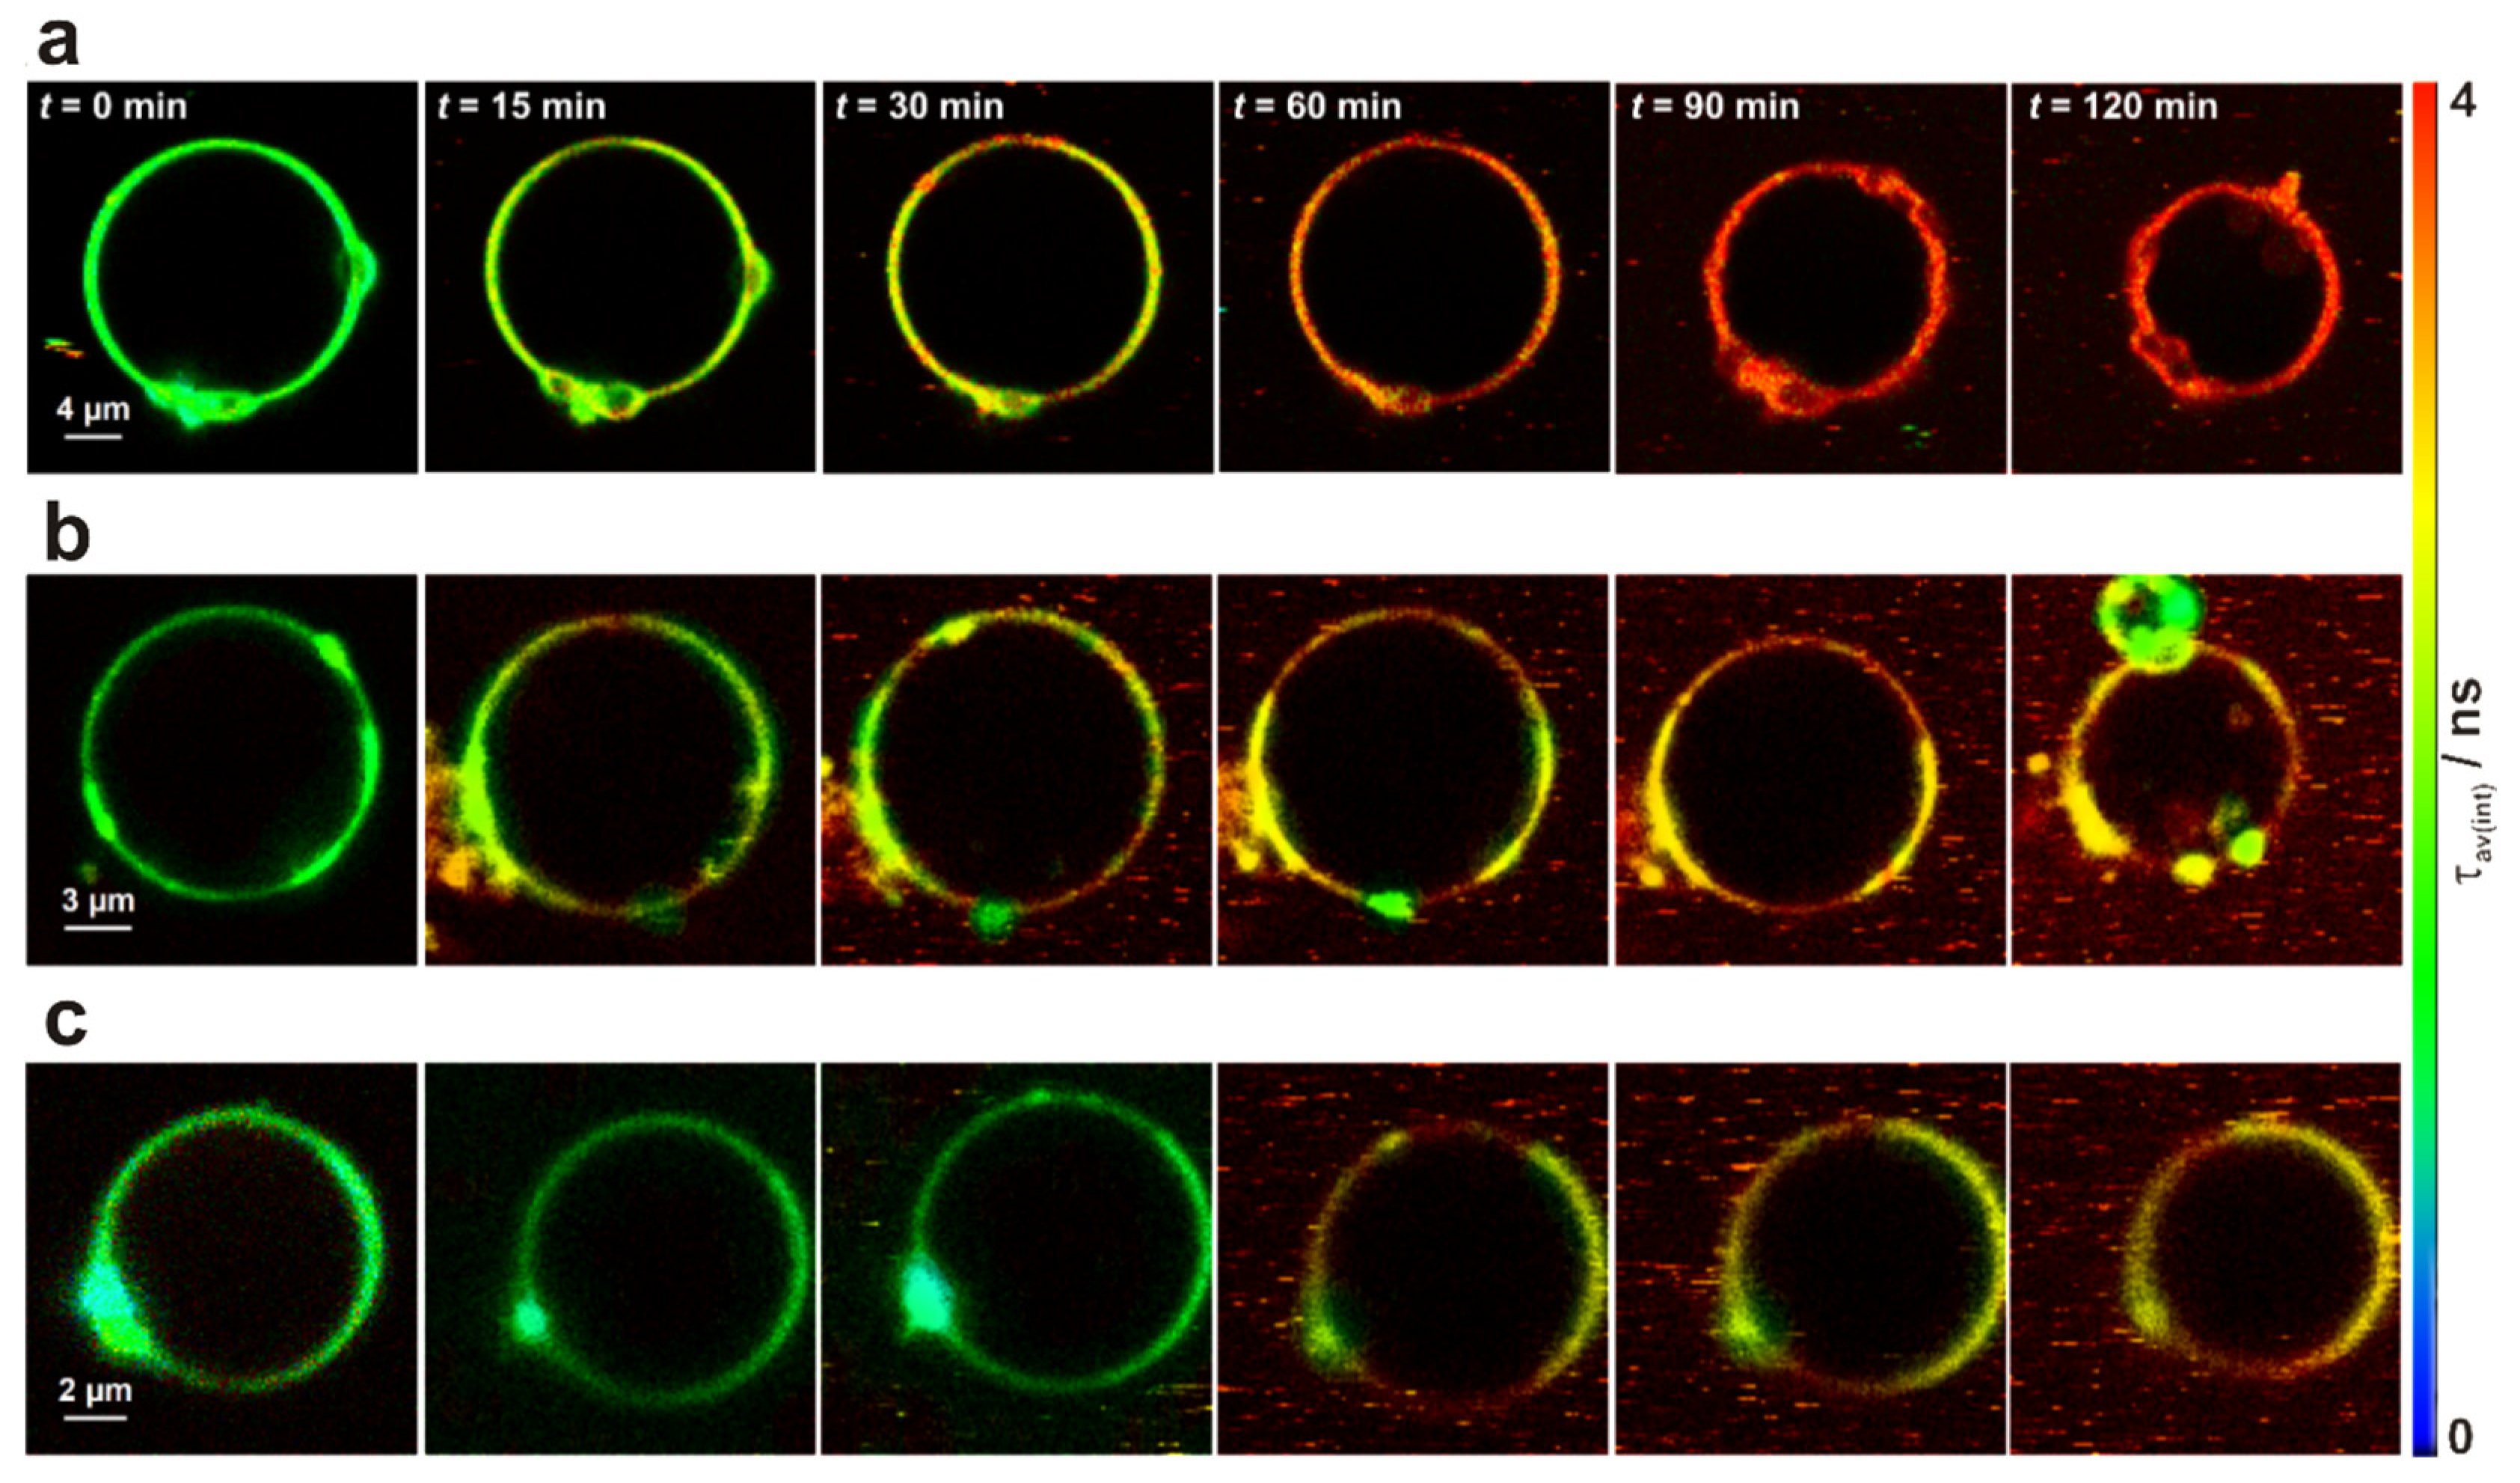
3.4. Interaction of Fluorescently Labelled LUVs and GUVs of Varying Lipid Composition Using 2P-FLIM Recordings

As SRh101-encapsulated LUVs were used as a drug carrier system, questions arose regarding the fate of this carrier during its interaction with GUVs, which served as artificial cells. Among others, one could imagine two simple scenarios, either an internalisation of the complete LUVs or a LUV-GUV–membrane fusion with the partial release of SRh101 into the GUV lumen. The results presented here were obtained with protein-free, SRh101-containing LUVs composed of DOPC:DOTAP (1:1, cationic) or DOPC:DOPE:DOTAP (1:1:2, cationic), respectively. The lipid compositions of the GUVs labelled with 0.1 mol% DiOC18(3) were DOPC:DOPS (3:1, anionic), DOPC:DOPE:DOPS (8:3:2, anionic) and DOPC:DOPE (3:1, neutral). We performed incubation experiments, in which GUVs were immobilised in an incubation chamber. Then, a suspension of cationic LUVs was added, and the subsequent diffusion behaviour of the LUVs was observed via 2P-FLIM recordings. Figure 4 shows false-colour-coded 2P-FLIM images of a neutral GUV (DOPC:DOPE, 3:1) from both detection channels, imaging the green and the red spectral regions, approx. 30 min after addition of cationic LUVs (DOPC:DOPE:DOTAP, 1:1:2). As expected from the fluorescence spectra (see Figure 1), only the fluorescence signal from DiOC18(3) embedded in the GUV membrane is observed in the green detection channel. In addition, the SRh101 fluorescence signal from the LUVs was not detectible in the green detection channel. Thus, bleed-through is minimal, which is important for analysing FCS signals. The fluorescence signal of SRh101 in the red detection channel was exclusively seen near the GUV membrane and exhibited a dot-like pattern. This observation supported the idea of an accumulation of the cationic LUVs at the neutral GUV membrane. Furthermore, the docking of LUVs to the GUV membrane appeared to be stable and randomly distributed.
In order to evaluate the effect of the lipid composition on the LUV-GUV interactions, we started with incubation experiments and the analysis of 2P-FLIM images of a time series. Figure 5 shows the respective time sequences of a neutral GUV (a) and an anionic GUV (b,c) interacting with LUVs. Initially, at t = 0, the GUVs were homogenously fluorescent (=DiOC18(3) labelled membrane), tense and spherical. For the GUVs with the membrane composition of DOPC:DOPE (3:1) and DOPC:DOPE:DOPS (8:3:2), we observed changes in the fluorescence pattern approx. 15 min after the addition of LUVs with a lipid composition of DOPC:DOTAP (1:1). These changes manifested as red or yellow spots, corresponding to longer fluorescence decay times, as expected for SRh101, distributed along the vesicle’s rim in the confocal images. The appearance of these spots became more pronounced after 30 or 60 min (see Figure 5a,b). In particular, in the case of the neutral GUV (Figure 5a), the distribution of SRh101 fluorescence on the GUV surface appeared to be quite homogeneous. Similar reports on the docking of cationic LUVs immediately followed by hemifusion or fusion have been published previously [46,47]. As a consequence of the ongoing LUV accumulation, as well as the asymmetric transfer of LUV lipids in the outer GUV membrane layer, it is quite common that spontaneous curvature and the deformation of the GUV surface (here at 90 min) can occur [47,48]. Further, the process of docking and hemifusion can lead to vesicle rupture and collapse (here, at 120 min).
In contrast, incubation of the cationic LUVs (DOPC:DOTAP, 1:1) with GUVs having the lipid composition DOPC:DOPS (3:1) did not lead to visible accumulation of LUVs on GUVs after 30 min. However, after approx. 45–60 min of observation, we observed a slight increase in longer fluorescence decay times at the GUV surface (Figure 5c). Furthermore, membrane budding and the surface deformation of the GUV were not detected. This may indicate that the stability of the anionic DOPC:DOPS (3:1) GUVs towards surface-docked LUVs was probably higher than that of the GUVs containing the lipid DOPE. GUVs containing a high amount of DOPE, a lipid with a preferred negative curvature and a tendency to form hexagonal phases [49], probably tend to deform or collapse after long incubation times with positively charged LUVs. Due to the continuous aggregation of LUVs at the GUV membrane, it is reasonable to assume that different bilayers may form, resulting in smaller and more permeable vesicles.
Similar to the interaction experiment with DOPC:DOTAP (1:1) LUVs, the incubation of GUVs with cationic LUVs composed of DOPC:DOPE:DOTAP (1:1:2), resulted in liposome docking to GUVs, indicated by warmer colours in the 2P-FLIM images at the GUV’s surface (Figure 6). Interestingly, in case of neutral GUVs with the lipid composition DOPC:DOPE (3:1), the process of docking and interacting with these LUVs seemed to be fast and efficient. Within just 30 min after adding the LUV solution, the GUV showed a sharp fluorescence increase, homogeneously distributed over the entire lipid bilayer, and this fluorescence intensity continued to increase after 60 min (Figure 6a). Additionally, the fluorescence pattern on the GUV surface did not change significantly after the sample was left to interact with the injected LUVs for an additional 60 min. Such interactions have been previously reported in lipid-mixing studies using both protein-free and lipopeptide-functionalised systems [47,50]. In contrast, membrane activity in the case of anionic GUVs was considerably lower (Figure 6b,c); especially for GUVs with the lipid composition DOPC:DOPS (3:1), we observed the preservation of membrane tension and sphericity over the whole acquisition time of 120 min. This behaviour is in good agreement with previous studies, which concluded that cationic lipid composition is more important for in vitro fusion and content release than the type of colloidal structure [47,51,52].
Taken together, these incubation experiments with 2P-FLIM aimed to assess the impact of lipid composition on vesicle interactions, membrane fusion, perturbation, and dye transfer dynamics. Leveraging the advanced capabilities of FLIM, the study provided a detailed and quantitative assessment of these processes at a subcellular level. The selection of DiOC18(3) and SRh101 fluorophores demonstrated FLIM’s specificity in identifying and understanding their behaviour within the system, crucial for studying complex interactions like LUV-GUV fusion. Both DiOC18(3) and SRh101 fluorophores are excited with a single wavelength during two-photon excitation, unlike in single-photon excitation methods. Additionally, the potential for two-photon excitation offered deeper imaging capabilities, crucial for studying interactions in physiologically relevant contexts. These aspects collectively highlight the unique benefits of FLIM in investigating complex subcellular phenomena.

3.5. Interaction of Fluorescently Labelled LUVs and GUVs of Varying Lipid Composition Using Time-Resolved Fluorescence and 2P-FCS Recordings

To examine the observations from 2P-FLIM recordings more quantitatively and with a complementary approach, we applied 2P time-resolved fluorescence spectroscopy and 2P-FCS to measure and analyse the changes in the diffusion time and fluorescence decay time of the fluorescently labelled LUVs. First, the autocorrelation curves and fluorescence decay curves of the positively charged LUVs were recorded at different time points outside the GUV in the surrounding medium. Figure 7a,b show representative results for the incubation of anionic, DiOC18(3)-labelled GUV (DOPC:DOPE:DOPS, 8:3:2) with cationic, SRh101-encapsulated LUVs (DOPC:DOTAP, 1:1). The autocorrelation curves of the fluorescent signals from the “red” detection channel were connected to the SRh101 fluorescent dye and were fitted with Equation (5) (see Figure 1a). As expected, the curve analysis over time showed a consistent diffusion behaviour with a mean diffusion time of τ D = (4.3 ± 0.1) ms, as well as a continuous increase in the LUV concentration from (3.3 ± 1.3) nM at 15 min to (18.4 ± 2.7) nM at 120 min (means ± SEM, N = 6) (see Figure 7d). At the beginning of the experiment, the liposomes were present in low concentrations, providing sufficient space for their movement and diffusion. Over time, the number of liposomes in the solution increased, resulting in a higher local liposome content. Since liposomes can interact with each other, this may reduce the available area for motion, leading to a slight reduction in diffusion time. This is evident from the plotted mean values of the diffusion times and concentrations of SRh101 in LUVs against the measurement time (Figure 7c,d). Additionally, the corresponding fluorescence decay curves (Figure 7b), recorded at various time intervals after initiating the incubation, were fitted with a biexponential model (Equation (1), i = 2). Subsequently, the resulting intensity-weighted average decay times τ a v ( i n t ) were calculated using Equation (2) and plotted as a function of time (Figure 7e). A continuous increase in τ a v ( i n t ) was observed, ranging from τ a v ( i n t ) = (3.59 ± 0.09) ns at 15 min to τ a v ( i n t ) = (3.84 ± 0.02) ns at 120 min (means ± SEM, N = 10–13). Therefore, as the incubation time increased, the concentration of LUVs in the surrounding medium also increased, leading to a reduction in the statistical fluctuations of noise. This led to a more precise and stable determination of the fluorescence decay time. These experiments demonstrated that the positively charged LUVs were effectively dispersed in the surrounding medium within the initial 15 min of LUV incubation and remained stable throughout the measurement period.
Secondly, we examined the diffusion times and decay times of the applied LUVs directly inside a GUV by exploiting the advantage of confocal measurements. Before the addition of LUVs and for approximately the first 30 min post-addition, no FCS data could be analysed. However, after about 30 min of incubation time, a noticeable SRh101 fluorescence signal was detected inside the GUV. The FCS autocorrelation curves of SRh101, recorded inside the GUV lumen due to LUV interaction with the membrane lipids of the GUV, were measured for different membrane compositions. The mean diffusion time of SRh101 within the lumen of GUVs at different time points was found to be τ D = (4.4 ± 0.5) ms (mean ± SEM, N = 6), with representative curves shown in Figure 8a. Comparing the G(0) values for FCS measurements inside and outside the filled GUVs revealed that the SRh101 concentration inside the vesicle was approximately 4-fold higher compared to the outside solution (see Figure 7d and Figure 8d). The diffusion time from measurements inside the GUV lumen, regardless of the lipid composition of the interacting membranes, were in good agreement with the mean diffusion time of the SRh101 encapsulated in liposomes, indicating a controlled and stable internalisation process (Figure 8c). Additionally, in several cases, autocorrelation curves were recorded, resulting in two different diffusion times: τ D 1 = (11 ± 1.6) ms (f1 = 55%) and τ D 2 = (2.7 ± 1.5) 10−2 ms (f2 = 45%) (means ± SEM, N = 5). The slower diffusion time τ D 1 was attributed to the movement of the liposome entity within the GUV interior. This slower diffusion is indicative of the internalisation of the liposomes, suggesting a possible mechanism of uptake or the engulfment of the liposome structures by the GUVs. Conversely, the faster diffusion time τ D 2 was associated with the freely diffusing dye, indicating the possible release of the encapsulated SRh101 from the LUVs in the GUV interior. This observation suggests the occurrence of certain processes leading to the release of the encapsulated dye, possibly linked to the membrane dynamics and properties of the liposomes within the GUVs. The coexistence of these two distinct diffusion times emphasizes the complexity of the interaction dynamics between the liposomes and the GUVs.
Furthermore, we examined the fluorescence decay times of SRh101 trapped in the LUVs by performing time-resolved fluorescence measurements directly inside the GUV lumen. The detected fluorescence decayed biexponentially and the resulting intensity-weighted average decay times τ a v ( i n t ) were in the same order of magnitude as those of the LUVs diffusing in the extravesicular environment, as presented above. Near the inner GUV membrane, we obtained τ a v ( i n t ) values increasing from τ a v ( i n t ) = (2.87 ± 0.15) ns at 15 min up to τ a v ( i n t ) = (3.51 ± 0.05) ns at 120 min (means ± SEM, N = 12) (Figure 8b,e). The slow increase in τ a v ( i n t ) values over time may indicate changes in the microenvironment of the fluorescent dye SRh101 within the LUVs. This could be attributed to processes such as liposome degradation, structural changes, or interactions with the GUV membrane. If the LUVs decay over time, it might lead to the release of SRh101 dye into the GUV lumen, contributing to the observed changes in fluorescence decay characteristics. The obtained results provide a quantitative confirmation of a potential internalisation process of the cationic LUVs, suggesting the subsequent release of the SRh101 dye into the GUV lumen. This conclusion aligns with the observations derived from the 2P-FCS measurements. Indeed, prior research indicates that these liposomes possess fusogenic properties. Cationic LUVs exhibit rapid and spontaneous docking to anionic or neutral GUVs, efficiently fusing with their external membranes [39,40,45,46,47]. The interaction dynamics between cationic LUVs and GUVs are influenced by factors such as membrane charge, lipid composition, and particle size [39,40,48]. It has been proposed that a surface charge density within the range of 10–25% often results in a hemifusion state, which commonly occurs but does not consistently progress to full fusion; adhesion may be the stable final state in some cases [39,49]. Consequently, it is plausible that the moderate proportion of negatively charged lipids in the GUV membranes, as observed in this case, leads to LUV engulfment rather than fusion. Additionally, it has been suggested that the tendency for engulfment occurs more frequently when vesicles are prepared in a sucrose solution rather than in water [50].
Furthermore, we investigated the internalisation efficiency of positively charged LUVs in the GUVs of different lipid compositions after a 60 min incubation period. In general, DOPC:DOPE:DOTAP (1:1:2) LUVs showed, in all cases, slightly higher internalisation efficiencies than DOPC:DOTAP (1:1) LUVs (Figure 9a). Nevertheless, GUVs with the lipid composition DOPC:DOPE (3:1) demonstrated the highest uptake efficiency. This suggests that the neutral DOPE is equally effective in inducing liposome interactions without interference from anionic DOPS. Due to its specific structure with a small hydrophilic head group, DOPE is inclined to influence the packing of the lipid bilayer structure and can, therefore, provide fusogenic properties [53,54,55]. Berezhna et al. showed that membrane vesiculation in response to lipoplex binding, analogous to the engulfment process, tends to occur more frequently as the amount of DOPE in the membrane increases [51].
To assess the impact of LUV membrane composition on internalisation efficiency, we measured the time-dependent accumulation of SRh101 within individual GUVs (Figure 9b). Both LUV species, DOPC:DOTAP (1:1) and DOPC:DOPE:DOTAP (1:1:2), showed similar kinetic behaviour with a time to half saturation t 1 / 2 of 10 min. The SRh101 fluorescence intensity in the GUV lumen exhibited a rapid increase with incubation time, reaching equilibrium at approximately 60 min. Notably, LUVs with the lipid composition DOPC:DOPE:DOTAP (1:1:2) showed a slightly higher mean fluorescence intensity of SRh101 compared to DOPC:DOTAP (1:1) LUVs, regardless of the incubation time. Possible reasons for this observation could be the role of the “helper lipid” DOPE, which may promote the internalisation of liposomes, as well as the higher membrane charge density of the DOPC:DOPE:DOTAP (1:1:2) LUVs at a lower fraction of DOPC [51,57]. In general, our data show that SRh101 delivery and release from the cationic LUVs during complex interaction with the membrane lipids strongly depends on the lipid composition of a target membrane.
The study highlights the effectiveness of combining 2P-FLIM and 2P-FCS for investigating complex membrane interactions with high sensitivity and precision. However, to further refine the precision and depth of our findings, there is potential to enhance our current methods. Advancements in high-speed FLIM modalities could improve the method’s ability to capture rapid events, as demonstrated in recent studies [58,59,60]. Additionally, spectral FLIM shows promise in differentiating between fluorophores with similar fluorescence lifetimes, thereby enhancing specificity in identifying molecular species within the membrane environment [61,62]. While the study successfully utilized multi-exponential fittings for fluorescence lifetime analysis, incorporating phasor plot analysis could further enhance robustness and provide insights into interaction heterogeneity. The spatial resolution, depth sectioning, and field of view offered by 2P-FLIM proved sufficient for studying LUV-GUV interactions, with considerations for optimizing potential photobleaching effects and temporal resolution. Future directions could explore strategies to minimize fluorescence quenching and toxicity effects, aiming to improve the overall reliability of fluorescence measurements. Additionally, transitioning to 3D-FLIM imaging could offer deeper insights into vesicle dynamics within complex membrane environments [18,63]. However, it also brings challenges, such as longer acquisition time, photon budget considerations and the complexity of data processing. In exploring further biomedical applications, it is also important to consider the potential interaction of small molecules with plasma components [64,65]. Investigating these interactions could reveal insights into the systemic behaviour and clearance pathways of liposomal carriers in vivo, offering a comprehensive understanding of their therapeutic potential and biological fate.

4. Conclusions

In the present study, we investigated the possibility of using both FLIM and FCS techniques, each combined with 2P excitation, to study the interactions of LUVs and GUVs. For this, liposomal vesicles were labelled with fluorescent dyes that are spatially localized and spectrally separated in different ways. GUVs of different lipid compositions and surface charges were used as a simplified cell model to observe the charge-dependent interactions with carrier systems at easily controllable conditions rather than using complex living cells or even tissues and organs. LUVs, loaded with fluorescent dye SRh101, which served as an observable surrogate drug, were characterised by using time-resolved fluorescence spectroscopy and FCS. With access to the microenvironment-dependent fluorescence decay times and the size-dependent translational diffusion times of the fluorescent dye, one can evaluate its encapsulation into, or its release from, a carrier system. After a 30 min incubation period, we noted a rapid accumulation of the cationic LUVs at the GUV membrane surface. Fluorescence decay time measurements and FCS data analysis from the GUV interior revealed an uptake of the whole LUVs into the GUV interior, followed by a release of the content inside the GUV interior. Furthermore, we investigated the efficiency of the LUV internalisation, which seemed to be dependent on the lipid composition. Time-resolved measurements in the GUV interior showed an increase in LUV internalisation with increasing incubation times, with the maximum efficiency being reached at 60 min. The use of the zwitterionic phospholipid DOPE led to an improvement in the uptake efficiency, probably due to changes in the packing of the lipid bilayer structure as a function of the environment. The principal novelty of our study, compared to earlier studies analysing liposome interactions, lies in the utilisation of advanced biophysical techniques such as 2P-FLIM and 2P-FCS. These techniques provide access to additional parameters, which are useful for a more detailed and quantitative analysis of the dynamics of a fluorescent drug/liposomal carrier system. The integration of these modern methods can enhance our understanding of liposome–membrane interactions, although the technical implementation and interpretation of the measurement data is rather complex. However, given that fluorescence decay times and diffusion times exhibit reduced susceptibility to photobleaching effects, their application becomes particularly advantageous in monitoring liposome uptake and cargo release during in vivo imaging experiments, especially when utilising 2P excitation.

Author Contributions

Conceptualization, C.H.; methodology, K.B. and C.H.; formal analysis, K.B.; investigation, K.B.; data curation, K.B.; writing—original draft preparation, K.B.; writing—review and editing, C.H. and H.-G.L.; visualization, K.B.; supervision, C.H. and H.-G.L.; project administration, C.H.; funding acquisition, C.H. and H.-G.L. All authors have read and agreed to the published version of the manuscript.

Funding

This work was funded by the Federal Ministry of Education and Research (“ALSComBi”, Grant Number 03IPT517Y, www.bmbf.de (accessed on 11 March 2024)) and by the University of Potsdam (to K.B.). We also acknowledge support by the German Research Foundation and the Open Access Publication Funds of the University of Potsdam.

Data Availability Statement

All relevant data are included in this published article. The datasets generated and/or analysed during the current study are available from the corresponding author upon reasonable request.

Conflicts of Interest

The authors declare no conflicts of interest. The funders had no role in the design of the study; in the collection, analyses, or interpretation of data; in the writing of the manuscript; or in the decision to publish the results.

References

  1. Farokhzad, O.C.; Langer, R. Impact of Nanotechnology on Drug Delivery. ACS Nano 2009, 3, 16–20. [Google Scholar] [CrossRef] [PubMed]
  2. Babu, A.; Templeton, A.K.; Munshi, A.; Ramesh, R. Nanodrug Delivery Systems: A Promising Technology for Detection, Diagnosis, and Treatment of Cancer. AAPS PharmSciTech 2014, 15, 709–721. [Google Scholar] [CrossRef] [PubMed]
  3. Jahangirian, H.; Lemraski, G.E.; Webster, T.J.; Rafiee-Moghaddam, R.; Abdollahi, Y. A Review of Drug Delivery Systems Based on Nanotechnology and Green Chemistry: Green Nanomedicine. Int. J. Nanomed. 2017, 12, 2957–2978. [Google Scholar] [CrossRef]
  4. Hart, S.L. Lipid Carriers for Gene Therapy. Curr. Drug Deliv. 2005, 2, 423–428. [Google Scholar] [CrossRef] [PubMed]
  5. Bae, Y.H.; Park, K. Advanced Drug Delivery 2020 and beyond: Perspectives on the Future. Adv. Drug Deliv. Rev. 2020, 158, 4–16. [Google Scholar] [CrossRef] [PubMed]
  6. Poste, G.; Papahadjopoulos, D.; Vail, W.J. Lipid Vesicles as Carriers for Introducing Biologically Active Materials into Cells. In Methods in Cell Biology; Prescott, D.M., Ed.; Academic Press: New York, NY, USA, 1976. [Google Scholar]
  7. Kozubek, A.; Gubernator, J.; Przeworska, E.; Stasiuk, M. Liposomal Drug Delivery, a Novel Approach: PLARosomes. Acta Biochim. Pol. 2000, 47, 639–664. [Google Scholar] [CrossRef] [PubMed]
  8. Li, J.; Wang, X.; Zhang, T.; Wang, C.; Huang, Z.; Luo, X.; Deng, Y. A Review on Phospholipids and Their Main Applications in Drug Delivery Systems. Asian J. Pharm. Sci. 2015, 10, 81–98. [Google Scholar] [CrossRef]
  9. Mentkowski, K.I.; Snitzer, J.D.; Rusnak, S.; Lang, J.K. Therapeutic Potential of Engineered Extracellular Vesicles. AAPS J. 2018, 20, 50. [Google Scholar] [CrossRef] [PubMed]
  10. Sil, S.; Dagur, R.S.; Liao, K.; Peeples, E.S.; Hu, G.; Periyasamy, P.; Buch, S. Strategies for the Use of Extracellular Vesicles for the Delivery of Therapeutics. J. Neuroimmune Pharmacol. 2020, 15, 422–442. [Google Scholar] [CrossRef] [PubMed]
  11. Liu, X.; Cao, Y.; Wang, S.; Liu, J.; Hao, H. Extracellular Vesicles: Powerful Candidates in Nano-Drug Delivery Systems. Drug Deliv. Transl. Res. 2023, 14, 295–311. [Google Scholar] [CrossRef]
  12. Nagayasu, A.; Uchiyama, K.; Kiwada, H. The Size of Liposomes: A Factor Which Affects Their Targeting Efficiency to Tumors and Therapeutic Activity of Liposomal Antitumor Drugs. Adv. Drug Deliv. Rev. 1999, 40, 75–87. [Google Scholar] [CrossRef] [PubMed]
  13. Dimova, R.; Aranda, S.; Bezlyepkina, N.; Vesselin, N.; Riske, K.A.; Lipowsky, R. A Practical Guide to Giant Vesicles. Probing the Membrane Nanoregime via Optical Microscopy. J. Phys. Condens. Matter 2006, 18, 1151–1176. [Google Scholar] [CrossRef] [PubMed]
  14. Dimova, R. Giant Vesicles and Their Use in Assays for Assessing Membrane Phase State, Curvature, Mechanics, and Electrical Properties. Annu. Rev. Biophys. 2019, 48, 93–119. [Google Scholar] [CrossRef] [PubMed]
  15. Sanderson, M.J.; Smith, I.; Parker, I.; Bootman, M.D. Fluorescence Microscopy. Cold Spring Harb. Protoc. 2014, 2014, 1042–1065. [Google Scholar] [CrossRef] [PubMed]
  16. Combs, C.A.; Shroff, H. Fluorescence Microscopy: A Concise Guide to Current Imaging Methods. Curr. Protoc. Neurosci. 2017, 79, 2.1.1–2.1.25. [Google Scholar] [CrossRef] [PubMed]
  17. Becker, W. Fluorescence Lifetime Imaging—Techniques and Applications. J. Microsc. 2012, 247, 119–136. [Google Scholar] [CrossRef] [PubMed]
  18. Datta, R.; Heaster, T.M.; Sharick, J.T.; Gillette, A.A.; Skala, M.C. Fluorescence Lifetime Imaging Microscopy: Fundamentals and Advances in Instrumentation, Analysis, and Applications. J. Biomed. Opt. 2020, 25, 071203. [Google Scholar] [CrossRef] [PubMed]
  19. Schwille, P.; Haupts, U.; Maiti, S.; Webb, W.W. Molecular Dynamics in Living Cells Observed by Fluorescence Correlation Spectroscopy with One- and Two-Photon Excitation. Biophys. J. 1999, 77, 2251–2265. [Google Scholar] [CrossRef] [PubMed]
  20. Mütze, J.; Ohrt, T.; Schwille, P. Fluorescence Correlation Spectroscopy in Vivo. Laser Photonics Rev. 2011, 5, 52–67. [Google Scholar] [CrossRef]
  21. Bangham, A.D.; Standish, M.M.; Watkins, J.C. Diffusion of Univalent Ions across the Lamellae of Swollen Phospholipids. J. Mol. Biol. 1965, 13, 238–252. [Google Scholar] [CrossRef] [PubMed]
  22. Hope, M.J.; Bally, M.B.; Webb, G.; Cullis, P.R. Production of Large Unilamellar Vesicles by a Rapid Extrusion Procedure. Characterization of Size Distribution, Trapped Volume and Ability to Maintain a Membrane Potential. Biochim. Biophys. Acta BBA—Biomembr. 1985, 812, 55–65. [Google Scholar] [CrossRef]
  23. Angelova, M.I.; Dimitrov, D.S. Liposome Electroformation. Faraday Discuss. Chem. Soc. 1986, 81, 303–311. [Google Scholar] [CrossRef]
  24. Makarov, N.S.; Drobizhev, M.; Rebane, A. Two-Photon Absorption Standards in the 550–1600 Nm Excitation Wavelength Range. Opt. Express 2008, 16, 4029. [Google Scholar] [CrossRef]
  25. Rumi, M.; Ehrlich, J.E.; Heikal, A.A.; Perry, J.W.; Barlow, S.; Hu, Z.; McCord-Maughon, D.; Parker, T.C.; Röckel, H.; Thayumanavan, S.; et al. Structure-Property Relationships for Two-Photon Absorbing Chromophores: Bis-Donor Diphenylpolyene and Bis(Styryl)Benzene Derivatives. J. Am. Chem. Soc. 2000, 122, 9500–9510. [Google Scholar] [CrossRef]
  26. Magde, D.; Wong, R.; Seybold, P.G. Fluorescence Quantum Yields and Their Relation to Lifetimes of Rhodamine 6G and Fluorescein in Nine Solvents: Improved Absolute Standards for Quantum Yields. Photochem. Photobiol. 2002, 75, 327–334. [Google Scholar] [CrossRef]
  27. Sjöback, R.; Nygren, J.; Kubista, M. Absorption and Fluorescence Properties of Fluorescein. Spectrochim. Acta A Mol. Biomol. Spectrosc. 1995, 51, L7–L21. [Google Scholar] [CrossRef]
  28. Culbertson, C.T.; Jacobson, S.C.; Ramsey, J.M. Diffusion Coefficient Measurements in Microfluidic Devices. Talanta 2002, 56, 365–373. [Google Scholar] [CrossRef]
  29. Lakowicz, J.R. Principles of Fluorescence Spectroscopy Principles of Fluorescence Spectroscopy, 3rd ed.; Springer Science & Business Media: New York, NY, USA, 2006. [Google Scholar]
  30. Kim, S.A.; Heinze, K.G.; Bacia, K.; Waxham, M.N.; Schwille, P. Two-Photon Cross-Correlation Analysis of Intracellular Reactions with Variable Stoichiometry. Biophys. J. 2005, 88, 4319–4336. [Google Scholar] [CrossRef]
  31. Haustein, E.; Schwille, P. Fluorescence Correlation Spectroscopy: Novel Variations of an Established Technique. Annu. Rev. Biophys. Biomol. Struct. 2007, 36, 151–169. [Google Scholar] [CrossRef]
  32. Heinze, K.G.; Koltermann, A.; Schwille, P. Simultaneous Two-Photon Excitation of Distinct Labels for Dual-Color Fluorescence Crosscorrelaion Analysis. Proc. Natl. Acad. Sci. USA 2000, 97, 10377–10382. [Google Scholar] [CrossRef]
  33. Bhowmik, B.B.; Basu, S.; Ray, D. Photophysical Studies of 3,3′ Dioctadecyloxacarbocyanine Dye in Model Biological Membranes and Different Solvents. Chem. Phys. Lipids 2001, 109, 175–183. [Google Scholar] [CrossRef]
  34. VanderMeulen, D.L.; Misra, P.; Michael, J.; Spears, K.G.; Khoka, M. Laser Mediated Release of Dye from Liposomes. Photochem. Photobiol. 1992, 56, 325–332. [Google Scholar]
  35. Albota, M.A.; Xu, C.; Webb, W.W. Two-Photon Fluorescence Excitation Cross Sections of Biomolecular Probes from 690 to 960 Nm. Appl. Opt. 1998, 37, 7352–7356. [Google Scholar] [CrossRef]
  36. Mütze, J.; Iyer, V.; Macklin, J.J.; Colonell, J.; Karsh, B.; Petrášek, Z.; Schwille, P.; Looger, L.L.; Lavis, L.D.; Harris, T.D. Excitation Spectra and Brightness Optimization of Two-Photon Excited Probes. Biophys. J. 2012, 102, 934–944. [Google Scholar] [CrossRef]
  37. Suhling, K.; French, P.M.; Phillips, D. Time-Resolved Fluorescence Microscopy. Photochem. Photobiol. Sci. 2005, 4, 13–22. [Google Scholar] [CrossRef]
  38. Chen, R.F.; Knutson, J.R. Mechanism of Fluorescence Concentration Quenching of Carboxyfluorescein in Liposomes: Energy Transfer to Nonfluorescent Dimers. Anal. Biochem. 1988, 172, 61–77. [Google Scholar] [CrossRef]
  39. Packard, B.S.; Wolf, D.E. Fluorescence Lifetimes of Carbocyanine Lipid Analogs in Phospholipid Bilayers. Biochemistry 1985, 24, 5176–5181. [Google Scholar] [CrossRef]
  40. Sims, P.J.; Waggoner, A.S.; Wang, C.-H.; Hoffman, J.F. Studies on the Mechanism by Which Cyanine Dyes Measure Membrane Potential in Red Blood Cells and Phosphatidylcholine Vesicles. Biochemistry 1974, 13, 3315–3330. [Google Scholar] [CrossRef]
  41. DeToma, R.P.; Brandt, L. Excited State Solvation Dynamics of 2-Anilinonaphthalene. Chem. Phys. Lett. 1976, 47, 231–236. [Google Scholar] [CrossRef]
  42. Matayoshi, E.D.; Kleinfeld, A.M. Emission Wavelength-Dependent Decay of the 9-Anthroyloxy-Fatty Acid Membrane Probes. Biophys. J. 1981, 35, 215–235. [Google Scholar] [CrossRef]
  43. Pramanik, A.; Thyberg, P.; Rigler, R. Molecular Interactions of Peptides with Phospholipid Vesicle Membranes as Studied by Fluorescence Correlation Spectroscopy. Chem. Phys. Lipids 2000, 104, 35–47. [Google Scholar] [CrossRef]
  44. Rigler, P.; Meier, W. Encapsulation of Fluorescent Molecules by Functionalized Polymeric Nanocontainers: Investigation by Confocal Fluorescence Imaging and Fluorescence Correlation Spectroscopy. J. Am. Chem. Soc. 2006, 128, 367–373. [Google Scholar] [CrossRef]
  45. Brewer, J.; Bloksgaard, M.; Kubiak, J.; Sorensen, J.A.; Bagatolli, L.A. Spatially Resolved Two-Color Diffusion Measurements in Human Skin Applied to Transdermal Liposome Penetration. J. Investig. Dermatol. 2013, 133, 1260–1268. [Google Scholar] [CrossRef]
  46. Pantazatos, D.P.; MacDonald, R.C. Directly Observed Membrane Fusion between Oppositely Charged Phospholipid Bilayers. J. Membr. Biol. 1999, 170, 27–38. [Google Scholar] [CrossRef]
  47. Lira, R.B.; Robinson, T.; Dimova, R.; Riske, K.A. Highly Efficient Protein-Free Membrane Fusion: A Giant Vesicle Study. Biophys. J. 2019, 116, 79–91. [Google Scholar] [CrossRef]
  48. Agudo-Canalejo, J.; Lipowsky, R. Critical Particle Sizes for the Engulfment of Nanoparticles by Membranes and Vesicles with Bilayer Asymmetry. ACS Nano 2015, 9, 3704–3720. [Google Scholar] [CrossRef]
  49. Koltover, I.; Salditt, T.; Rädler, J.O.; Safinya, C.R. An Inverted Hexagonal Phase of Cationic Liposome-DNA Complexes Related to DNA Release and Delivery. Science 1998, 281, 78–81. [Google Scholar] [CrossRef]
  50. Mora, N.L.; Boyle, A.L.; van Kolck, B.J.; Rossen, A.; Pokorná, Š.; Koukalová, A.; Šachl, R.; Martin, H.; Kros, A. Controlled Peptide-Mediated Vesicle Fusion Assessed by Simultaneous Dual-Colour Time-Lapsed Fluorescence Microscopy. Sci. Rep. 2020, 10, 3087. [Google Scholar] [CrossRef]
  51. Berezhna, S.; Schaefer, S.; Heintzmann, R.; Jahnz, M.; Boese, G.; Deniz, A.; Schwille, P. New Effects in Polynucleotide Release from Cationic Lipid Carriers Revealed by Confocal Imaging, Fluorescence Cross-Correlation Spectroscopy and Single Particle Tracking. Biochim. Biophys. Acta—Biomembr. 2005, 1669, 193–207. [Google Scholar] [CrossRef]
  52. Cavalcanti, R.R.M.; Lira, R.B.; Riske, K.A. Membrane Fusion Biophysical Analysis of Fusogenic Liposomes. Langmuir 2022, 38, 10430–10441. [Google Scholar] [CrossRef]
  53. Hope, M.J.; Mui, B.; Ansell, S. Cationic Lipids, Phosphatidylethanolamine and the Intracellular Delivery of Polymeric, Nucleic Acid-Based Drugs (Review). Mol. Membr. Biol. 1998, 15, 1–14. [Google Scholar] [CrossRef]
  54. Hafez, I.M.; Maurer, N.; Cullis, P.R. On the Mechanism Whereby Cataionic Lipids Promote Intracellular Delivery of Polynucleic Acids. Gene Ther. 2001, 8, 1188–1196. [Google Scholar] [CrossRef]
  55. Kim, B.-K.; Hwang, G.-B.; Seu, Y.-B.; Choi, J.-S.; Jin, K.S.; Doh, K.-O. DOTAP/DOPE Ratio and Cell Type Determine Transfection Efficiency with DOTAP-Liposomes. Biochim. Biophys. Acta—Biomembr. 2015, 1848, 1996–2001. [Google Scholar] [CrossRef]
  56. Jain, A.; Jain, S.K. In Vitro Release Kinetics Model Fitting of Liposomes: An Insight. Chem. Phys. Lipids 2016, 201, 28–40. [Google Scholar] [CrossRef]
  57. Lin, A.J.; Slack, N.L.; Ahmad, A.; George, C.X.; Samuel, C.E.; Safinya, C.R. Three-Dimensional Imaging of Lipid Gene-Carriers: Membrane Charge Density Controls Universal Transfection Behavior in Lamellar Cationic Liposome-DNA Complexes. Biophys. J. 2003, 84, 3307–3316. [Google Scholar] [CrossRef]
  58. Bower, A.J.; Li, J.; Chaney, E.J.; Marjanovic, M.; Spillman, D.R.; Boppart, S.A. High-Speed Imaging of Transient Metabolic Dynamics Using Two-Photon Fluorescence Lifetime Imaging Microscopy. Optica 2018, 5, 1290–1296. [Google Scholar] [CrossRef]
  59. Karpf, S.; Riche, C.T.; Di Carlo, D.; Goel, A.; Zeiger, W.A.; Suresh, A.; Portera-Cailliau, C.; Jalali, B. Spectro-Temporal Encoded Multiphoton Microscopy and Fluorescence Lifetime Imaging at Kilohertz Frame-Rates. Nat. Commun. 2020, 11, 2062. [Google Scholar] [CrossRef]
  60. Ma, Y.; Lee, Y.; Best-Popescu, C.; Gao, L. High-Speed Compressed-Sensing Fluorescence Lifetime Imaging Microscopy of Live Cells. Proc. Natl. Acad. Sci. USA 2021, 118, e2004176118. [Google Scholar] [CrossRef]
  61. Hanley, Q.S.; Arndt-Jovin, D.J.; Jovin, T.M. Spectrally Resolved Fluorescence Lifetime Imaging Microscopy. Appl. Spectrosc. 2002, 56, 155–166. [Google Scholar] [CrossRef]
  62. Niehörster, T.; Löschberger, A.; Gregor, I.; Krämer, B.; Rahn, H.-J.; Patting, M.; Koberling, F.; Enderlein, J.; Sauer, M. Multi-Target Spectrally Resolved Fluorescence Lifetime Imaging Microscopy. Nat. Methods 2016, 13, 257–262. [Google Scholar] [CrossRef]
  63. Park, J.; Gao, L. Advancements in Fluorescence Lifetime Imaging Microscopy Instrumentation: Towards High Speed and 3D. Curr. Opin. Solid State Mater. Sci. 2024, 30, 101147. [Google Scholar] [CrossRef]
  64. Stater, E.P.; Sonay, A.Y.; Hart, C.; Grimm, J. The Ancillary Effects of Nanoparticles and Their Implications for Nanomedicine. Nat. Nanotechnol. 2021, 16, 1180–1194. [Google Scholar] [CrossRef] [PubMed]
  65. Najer, A.; Rifaie-Graham, O.; Yeow, J.; Adrianus, C.; Chami, M.; Stevens, M.M. Differences in Human Plasma Protein Interactions between Various Polymersomes and Stealth Liposomes as Observed by Fluorescence Correlation Spectroscopy. Macromol. Biosci. 2023, 23, e2200424. [Google Scholar] [CrossRef] [PubMed]
Figure 1. Spectroscopic properties of the used dyes. (a) Normalised fluorescence spectra of the LUV membrane-bound DiOC18(3) (green line) and LUV-encapsulated SRh101 (red line) in phosphate-buffered saline (pH 7.0). The transmission characteristics of dichroic mirror (FF605) and filters (BP514/44 and BP700/75) used for the spectral separation of the emission signal are also indicated (dotted lines). (b) The 2P fluorescence excitation action cross-section spectra of DiOC18(3) (green dots) and SRh101 (red dots) in LUVs (means ± SEM, N = 3). Fluorescein in NaOH (pH 13) and rhodamine 6G in methanol served as references [24]. The 2P action cross-section is the product of the fluorescence quantum yield Φ F   and the absolute 2P absorption cross-section σ 2 [25]; 1 GM = 10−50 cm4 s/photon [29].
Biophysica 04 00015 g001
Figure 2. Comparative in vitro characterisation of the fluorescent dyes SRh101 and DiOC18(3) free in solution and in LUVs. Representative fluorescence decay curves of (a) SRh101 in PBS (black line) and SRh101-encapsulated LUVs (red line) as well as (b) DiOC18(3) in methanol (MeOH, black line) and DiOC18(3) incorporated into LUVs (red line), were recorded at λex,2P = 780 nm; the corresponding biexponential reconvolution fits (black dashed lines) of the SRh101-encapsulated LUVs and DiOC18(3) incorporated into LUVs are also shown. The weighted residuals of mono-, bi- and triexponential fits and their corresponding χ R 2 values are displayed below. IRF: instrument response function (grey line).
Biophysica 04 00015 g002
Figure 3. 2P-FCS data analysis obtained by measuring SRh101 in phosphate-buffered saline (PBS) and in LUVs. Normalised fluorescence autocorrelation curves and the corresponding weighted residuals of free SRh101 (black circles) and SRh101-encapsulated LUVs (red circles) fitted by using a two-component diffusion model according to Equation (5) (solid lines) [29,30]. The curves were normalized by multiplying with the total number of fluorescent molecules in the detection volume, N, derived from the fits (G(0) = 1/N).
Biophysica 04 00015 g003
Figure 4. Interaction of cationic LUVs (DOPC:DOPE:DOTAP, 1:1:2) containing SRh101 with an immobilised neutral GUV (DOPC:DOPE, 3:1) labelled with 0.1 mol% DiOC18(3). Representative 2P-FLIM images recorded 30 min after the addition of the LUV solution showed the fluorescence signals from DiOC18(3) in the green detection channel ((left), BP 514/44) and from SRh101 in the red detection channel ((middle), BP 700/75), as well as merged images of DiOC18(3) and SRh101 direct excitation and emission channels (right). The images represent an equatorial cross-section of the GUV. Recording parameters: image acquisition time~60 s, pixel dwell time 2.3 ms/pixel.
Biophysica 04 00015 g004
Figure 5. Analysis of the LUV-GUV interaction by 2P-FLIM recordings. GUVs contained 0.1 mol% DiOC18(3) and were composed of (a) DOPC:DOPE (3:1), (b) DOPC:DOPE:DOPS (8:3:2) or (c) DOPC:DOPS (3:1). GUVs were treated for 120 min with SRh101-encapsulated and positively charged LUVs with the lipid composition DOPC:DOTAP (1:1). Representative 2P-FLIM images are overlays of the fluorescence signals from the green (BP 514/44) and red (BP 700/75) detection channels at distinct time points. The results are representative for N = 3–4 independent repeat measurements.
Biophysica 04 00015 g005
Figure 6. Analysis of the LUV-GUV interactions by 2P-FLIM recordings. GUVs contained 0.1 mol% DiOC18(3) and were composed of (a) DOPC:DOPE (3:1), (b) DOPC:DOPE:DOPS (8:3:2) and (c) DOPC:DOPS (3:1). GUVs were treated for 120 min with SRh101-encapsulated and positively charged LUVs with the lipid composition DOPC:DOPE:DOTAP (1:1:2). Representative 2P-FLIM images are overlays of the fluorescence signals in the green (BP 514/44) and red (BP 700/75) detection channels at distinct time points. The results are representative for N = 3–4 independent repeat measurements.
Biophysica 04 00015 g006
Figure 7. Fluorescence recordings of LUVs obtained outside the GUVs in the surrounding medium. Representative 2P-excited fluorescence autocorrelation curves (a) and 2P-excited fluorescence decay curves (b) obtained at distinct time points during the incubation of an immobilised anionic GUV (DOPC:DOPE:DOPS, 8:3:2) with cationic LUVs (DOPC:DOTAP, 1:1) for 120 min. The colour code for (a) and (b) is defined within the legend of (a). The measuring point in the medium with immobilized GUV and added LUVs is shown schematically in (b). Determined diffusion times (c), concentrations of SRh101 in LUVs, (d) and intensity-weighted average decay times (e) vs. the measurement time; means ± SEM of N = 6 (c,d) and N = 10–13 (e).
Biophysica 04 00015 g007
Figure 8. Fluorescence recordings of LUVs obtained inside the GUV lumen. Representative 2P-excited fluorescence autocorrelation curves (a) and 2P-excited fluorescence decay curves (b) obtained at distinct time points during the incubation of an immobilised anionic GUV (DOPC:DOPE:DOPS, 8:3:2) with cationic LUVs (DOPC:DOTAP, 1:1) for 120 min. The colour code for (a) and (b) is defined within the legend of (a). The measuring point in the GUV lumen and added LUVs are shown schematically in (b). Determined diffusion times (c), the concentrations of SRh101 in LUVs (d) and intensity-weighted average decay times (e) vs. the measurement time; means ± SEM of N = 6 (c,d) and N = 12 (e).
Biophysica 04 00015 g008
Figure 9. Analysis of the internalisation of SRh101-encapsulated LUVs into the GUV interior. (a) Internalisation efficiency of DOPC:DOTAP (1:1) LUVs (red columns) and DOPC:DOPE:DOTAP (1:1:2) LUVs (black columns) into the GUVs of three different lipid compositions determined after a 60 min incubation period; means ± SEM of N = 3–4. (b) Time-dependent relative fluorescence intensity changes inside the lumen of neutral GUVs (DOPC:DOPE, 3:1) recorded during an incubation period of 120 min for DOPC:DOTAP (1:1) LUVs (red) and DOPC:DOPE:DOTAP (1:1:2) LUVs (black). Intensity changes relative to the starting point (t = 0) were analysed from 2P-FLIM images recorded in the red detection channel; means ± SEM of N = 4; data were fit to the first-order kinetics model [56].
Biophysica 04 00015 g009
Disclaimer/Publisher’s Note: The statements, opinions and data contained in all publications are solely those of the individual author(s) and contributor(s) and not of MDPI and/or the editor(s). MDPI and/or the editor(s) disclaim responsibility for any injury to people or property resulting from any ideas, methods, instructions or products referred to in the content.

