
3D Point Cloud and GIS Approach to Assess Street Physical Attributes

Architecture, Heritage and Management for Sustainable Development Research Centre (PEGASO), Universitat Politècnica de València, 46022 Valencia, Spain
*
Author to whom correspondence should be addressed.
Smart Cities 2024, 7(3), 991-1006; https://0-doi-org.brum.beds.ac.uk/10.3390/smartcities7030042
Submission received: 8 March 2024
/
Revised: 22 April 2024
/
Accepted: 23 April 2024
/
Published: 25 April 2024
Abstract
:The present research explores an innovative approach to objectively assessing urban streets attributes using 3D point clouds and Geographic Information Systems (GIS). Urban streets are vital components of cities, playing a significant role in the lives of their residents. Usually, the evaluation of some of their physical attributes has been subjective, but this study leverages 3D point clouds and digital terrain models (DTM) to provide a more objective perspective. This article undertakes a micro-urban analysis of basic physical characteristics (slope, width, and human scale) of a representative street in the historic centre of Valencia (Spain), utilizing 3D laser-scanned point clouds and GIS tools. Applying the proposed methodology, thematic maps were generated, facilitating the objective identification of areas with physical attributes more conducive to suitable pedestrian dynamics. This approach provides a comprehensive understanding of urban street attributes, emphasizing the importance of addressing their assessment through advanced digital technologies. Moreover, this versatile methodology has diverse applications, contributing to social sustainability by enhancing the quality of urban streets and open spaces.
1. Introduction
Streets, as essential components of an urban fabric, play a pivotal role in shaping our cities and the daily lives of their inhabitants. A street is considered the core and the reflection of the public space of a city. Throughout history, no other space has managed to fulfil the role of public space more prominently than the street. It has come to symbolize social life in its most essential form and has evolved as a fundamental element in the design and understanding of our modern cities [1,2].
These spaces not only serve as transit routes but also function as points of encounter, social interaction, and public activity. The quality of streets and their ability to facilitate a satisfying urban experience are crucial aspects of contemporary or neo-traditional urbanism [1], and they also function as urban sceneries for tourism development.
However, the assessment of urban street attributes tends to be a subjective exercise. The perceptions, expectations, and levels of appreciation of streets can vary significantly based on individual backgrounds, experiences, and preferences [2]. Because of this, the need for a more objective and quantitative approach to understanding urban streets has become increasingly evident.
This article aims to address this issue by exploring the opportunities presented by 3D modelling technologies and point clouds for conducting a micro-urban analysis of street attributes. It will specifically focus on the assessment of physical qualities with the potential for subsequent use in studies of walkability, publicness, streetscape, or other key attributes that define their character.
This article will emphasize how the digitization of streets has appeared as a promising tool for obtaining objective measurements of these qualities, reducing the influence of bias in the evaluation of urban public spaces.
Spatial data obtained through laser scanning and publicly accessible geospatial data will be used to conduct a detailed analysis. A representative street in the urban historic city centre of Valencia (Spain) is the urban space where the methodology was tested.
The obtained results focus on the utility of these techniques for data-driven urban environment management, which is fundamental in building a smart city. This approach ultimately aims to contribute to the advancement in the understanding and design of urban streets by harnessing digital technologies to significantly enhance the liveliness, functionality, and social sustainability of contemporary cities.
1.1. Research Background
1.1.1. Urban Street Attributes
From a theoretical perspective, a street, as a physical space, can be understood at various levels of dimensionality, with its one-dimensional nature usually being related to vehicular and people movement traffic and pedestrian movement, its two-dimensional approach linked to urban planning and land use, and its three-dimensional approach addressing urban design [1]. Therefore, the street is defined as a linear three-dimensional spatial entity delimited by two lines of adjacent buildings [3], in which both the surrounding buildings and the street surface itself play equally significant roles [2].
However, the street transcends its mere physical dimension and takes on a social character. Factors such as ownership, control, management, purpose, and its dynamic socioeconomic function become fundamental elements for its understanding [3]. This broader conception allows for the identification of three main roles that the street plays in urban life. Firstly, it acts as a space for circulation, fulfilling its function as a “link”, providing the necessary infrastructure for the movement of people and vehicles. Secondly, it becomes a collective public space that encourages social interaction and the satisfaction of socio-collective needs, making it a significant “place” for the community [2,4]. Thirdly, the street also functions as a building front, defining the urban experience and the perception of the city that its inhabitants and users have [1].
However, in the assessment of a street’s qualities, there is a tendency to narrowly focus on its one-dimensionality, perceiving it merely as a linear unidimensional entity or the “link” mentioned above. This simplistic view often reduces the street to a uniform line, overlooking the intricate layers of its social, functional, and aesthetic dimensions. This type of analysis is entirely suitable when dealing with urban scales.
A notable example is the spatial syntax approach [5,6], widely used these days [4] in multidisciplinary studies [7,8,9,10,11], which focuses on analysing the integration, intersection, and centrality of streets based on graphical analysis, determining its importance in the urban fabric. In the same line, it is possible to talk about the shortest routes and a street’s straightness analysis used in walkability studies [12,13].
On the other hand, when the street is considered as a functional “place”, where community gatherings and activities happen, its two- and three-dimensions are typically analysed. For this case, it is possible to mention the studies on open spaces that take into consideration the users and how they interact with the street, such as urban furniture supply [12,14,15,16], walkable areas [14,15,17,18], crowding dynamics [19,20], street frontage quality [21,22,23], and human scale [16,23], among others. It is necessary to mention that even if streets are analysed in two- or three-dimensional approaches, the results are usually simplified to their linear representation.
1.1.2. Street Digitization
This diversity of approaches highlights the richness and multidimensionality of urban streets as essential elements of an urban environment and underscores the need to approach them from interdisciplinary perspectives, not only qualitatively but with an objective focus, understanding them as a space instead of just a line. This multidimensionality of streets is typically analysed within Geographic Information Systems (GIS) because of its capability to handle multiple layers of information seamlessly. Furthermore, when considering more intricate aspects of streets, an equally sophisticated digitization is required. Hence, alternative methods such as digital modelling are gaining prominence.
The digitization of streets has emerged as a solution and an essential component to study these new challenges. Often, studies have focused on the digitization of buildings, overlooking the potential that lies in the digital representation of urban streets and other public spaces. However, this perspective is changing with the recognition of the importance of achieving smart cities that implement techniques like the digitization of streets and other public open spaces for precise urban planning and improvement in the quality of life in urban environments [24,25].
In recent years, a wide variety of approaches and applications have been developed in the field of digital tools and 3D models to address the study of various properties and characteristics [26,27,28,29,30], such as 3D modelling, satellite images, point clouds, and even gamification, allowing users to evaluate physical attributes, such as ground surface and pavement conditions, urban planning, people and vehicular dynamics, and weather conditions, among others. These methods not only allow for the evaluation of physical attributes, such as ground surface and topographical conditions using digital terrain models [20,31,32,33], but also delve into more detailed aspects of the urban environment being studied, such as the identification of urban furniture, like lampposts, trees, traffic, and pedestrian signs, and so on [34,35,36].
These approaches and applications typically show a certain disconnection with studies that consider aspects related to the users of streets, like the ones mentioned above. In these studies, physical data such as street width or building height are analysed, taking into account optimal widths in relation to the number of people or suitable scales regarding users’ perceptions. Therefore, the combination of digital tools offers a range of possibilities for analysing and optimizing non-solely quantitative aspects of urban streets, thus contributing to people-focused urban planning and socially sustainable urban management. In this context, the convergence of Geographic Information Systems (GIS) and 3D modelling techniques emerges as a highly relevant discipline. This combination not only provides insights into various attributes of urban streets but also facilitates the integration of cartographic data and 3D point clouds. Such integration opens new possibilities for analysing streets, identifying key attributes, and enhancing decision-making processes at the management level.
1.2. Objective
The objective of this article is to explore some valuable tools to generate a methodology for analysing the suitability of a street for pedestrian dynamics, by taking into account its physical characteristics based on point clouds and GIS analysis, which can be used to create a graphical representation of streets in a cartographic format. This approach aims to reduce subjective bias, enabling a better understanding of the street on a micro-urban scale as a two- and three- dimensional place.
In the present research, the operational definition of this qualitative variable considers the attributes of width, slope, and scale relationships with adjacent buildings. Other works, such as Ewing and Handy [22], addressed similar approaches to quantitative attributes. These factors were significant in various studies, including the ones focused on street design quality [12,16,37], as well as studies on walkability [22,23,33,38]. For this research, we considered the width as the distance between two vertical elements or obstructions; the slope or grade as the vertical variation concerning the horizontal distance between two points expressed in percentage; and the scale as the proportion between the width of the street and the height of its adjacent building.
2. Methods and Materials
The methodological development phases undertaken in this study follow the guidelines developed in the design sciences and encompass the following steps: (1) identify the diverse applications of 3D modelling and GIS to measure and accurately score the width, slope, and scale of a street; (2) establish the procedural framework for developing these applications and characterizing their outcomes; (3) test the procedures in a real-world case to assess their applicability and scope; and (4) evaluate the solution. For this purpose, the developed solution is described and implemented in the designated testing area of Miguelete Street, near the Cathedral (Ciutat Vella neighbourhood), located in the historic centre of Valencia (Spain) (Figure 1). This street was chosen due to its proximity to the mentioned cultural heritage site and because it is a heavily pedestrian-transited street with a pedestrian-friendly design, with vegetation, changing floor levels, and the presence of the tower of the Cathedral (Miguelete Tower), whose height will be important for the present research.
2.1. Data Acquisition and Point Cloud Processing
To obtain the digital terrain model (DTM) of the street, a 3D laser scanner survey was employed following the methodology described in Figure 2. The study area’s point cloud is part of a bigger survey that consists of 94 positions that were taken in the Cathedral and Valencia city centre’s surroundings; for Miguelete Street, the survey consists of 10 scan positions (Figure 3). Environmental factors were negligible as weather conditions were similar on all sampling days, but due to pedestrian traffic, data collection was difficult in some places. A Leica RTC 360 scanner (manufactured by Leica, Heerbrugg, Switzerland obtained from Leica España) with nominal resolution of clouds at 6 mm at a 10 m distance was used. The range employed was from 0.5 to 130 m. Ranging noise as defined by the producer was 0.4 mm at 10 m and 0.5 mm at a 20 m distance. The average error of registration of the 94 scanning stations was 4.7 mm. Then, Cyclone Register 360 2022.0.0 software associated with Leica was used to register and process the scanned points.
The point cloud was prepared in .rcs format for import using the software Autodesk® Recap 2023 version 23.0, where an initial clean-up of point noise was applied to improve processing and analysis in the open-source software Cloud Compare version 2.13 alpha. At this stage, only the points representing Miguelete Street were retained for its further analysis in Cloud Compare and QGIS version 3.28.3—Firenze.
A differentiated point cloud of the ground was obtained to distinguish the walkable surface of the street (Figure 4). To obtain the ground, “CSF Filter” and calculation of the “Geometric Features—Verticality” from the open-source software Cloud Compare were employed, and then noise points, mostly generated by pedestrian traffic, were filtered out using the “RANSAC Shape detection” function. For the segmentation of facades, vegetation, and urban furniture, the segmentation tool “Label Connected Components” was utilized.
Some additional geodata layers were used for further analysis, including “Street axes” and “Buildings parcels”, from the Open Data Portal of Ayuntamiento de Valencia and the local cadastre, respectively (Table 1).
2.2. Digital Terrain Model (DTM)
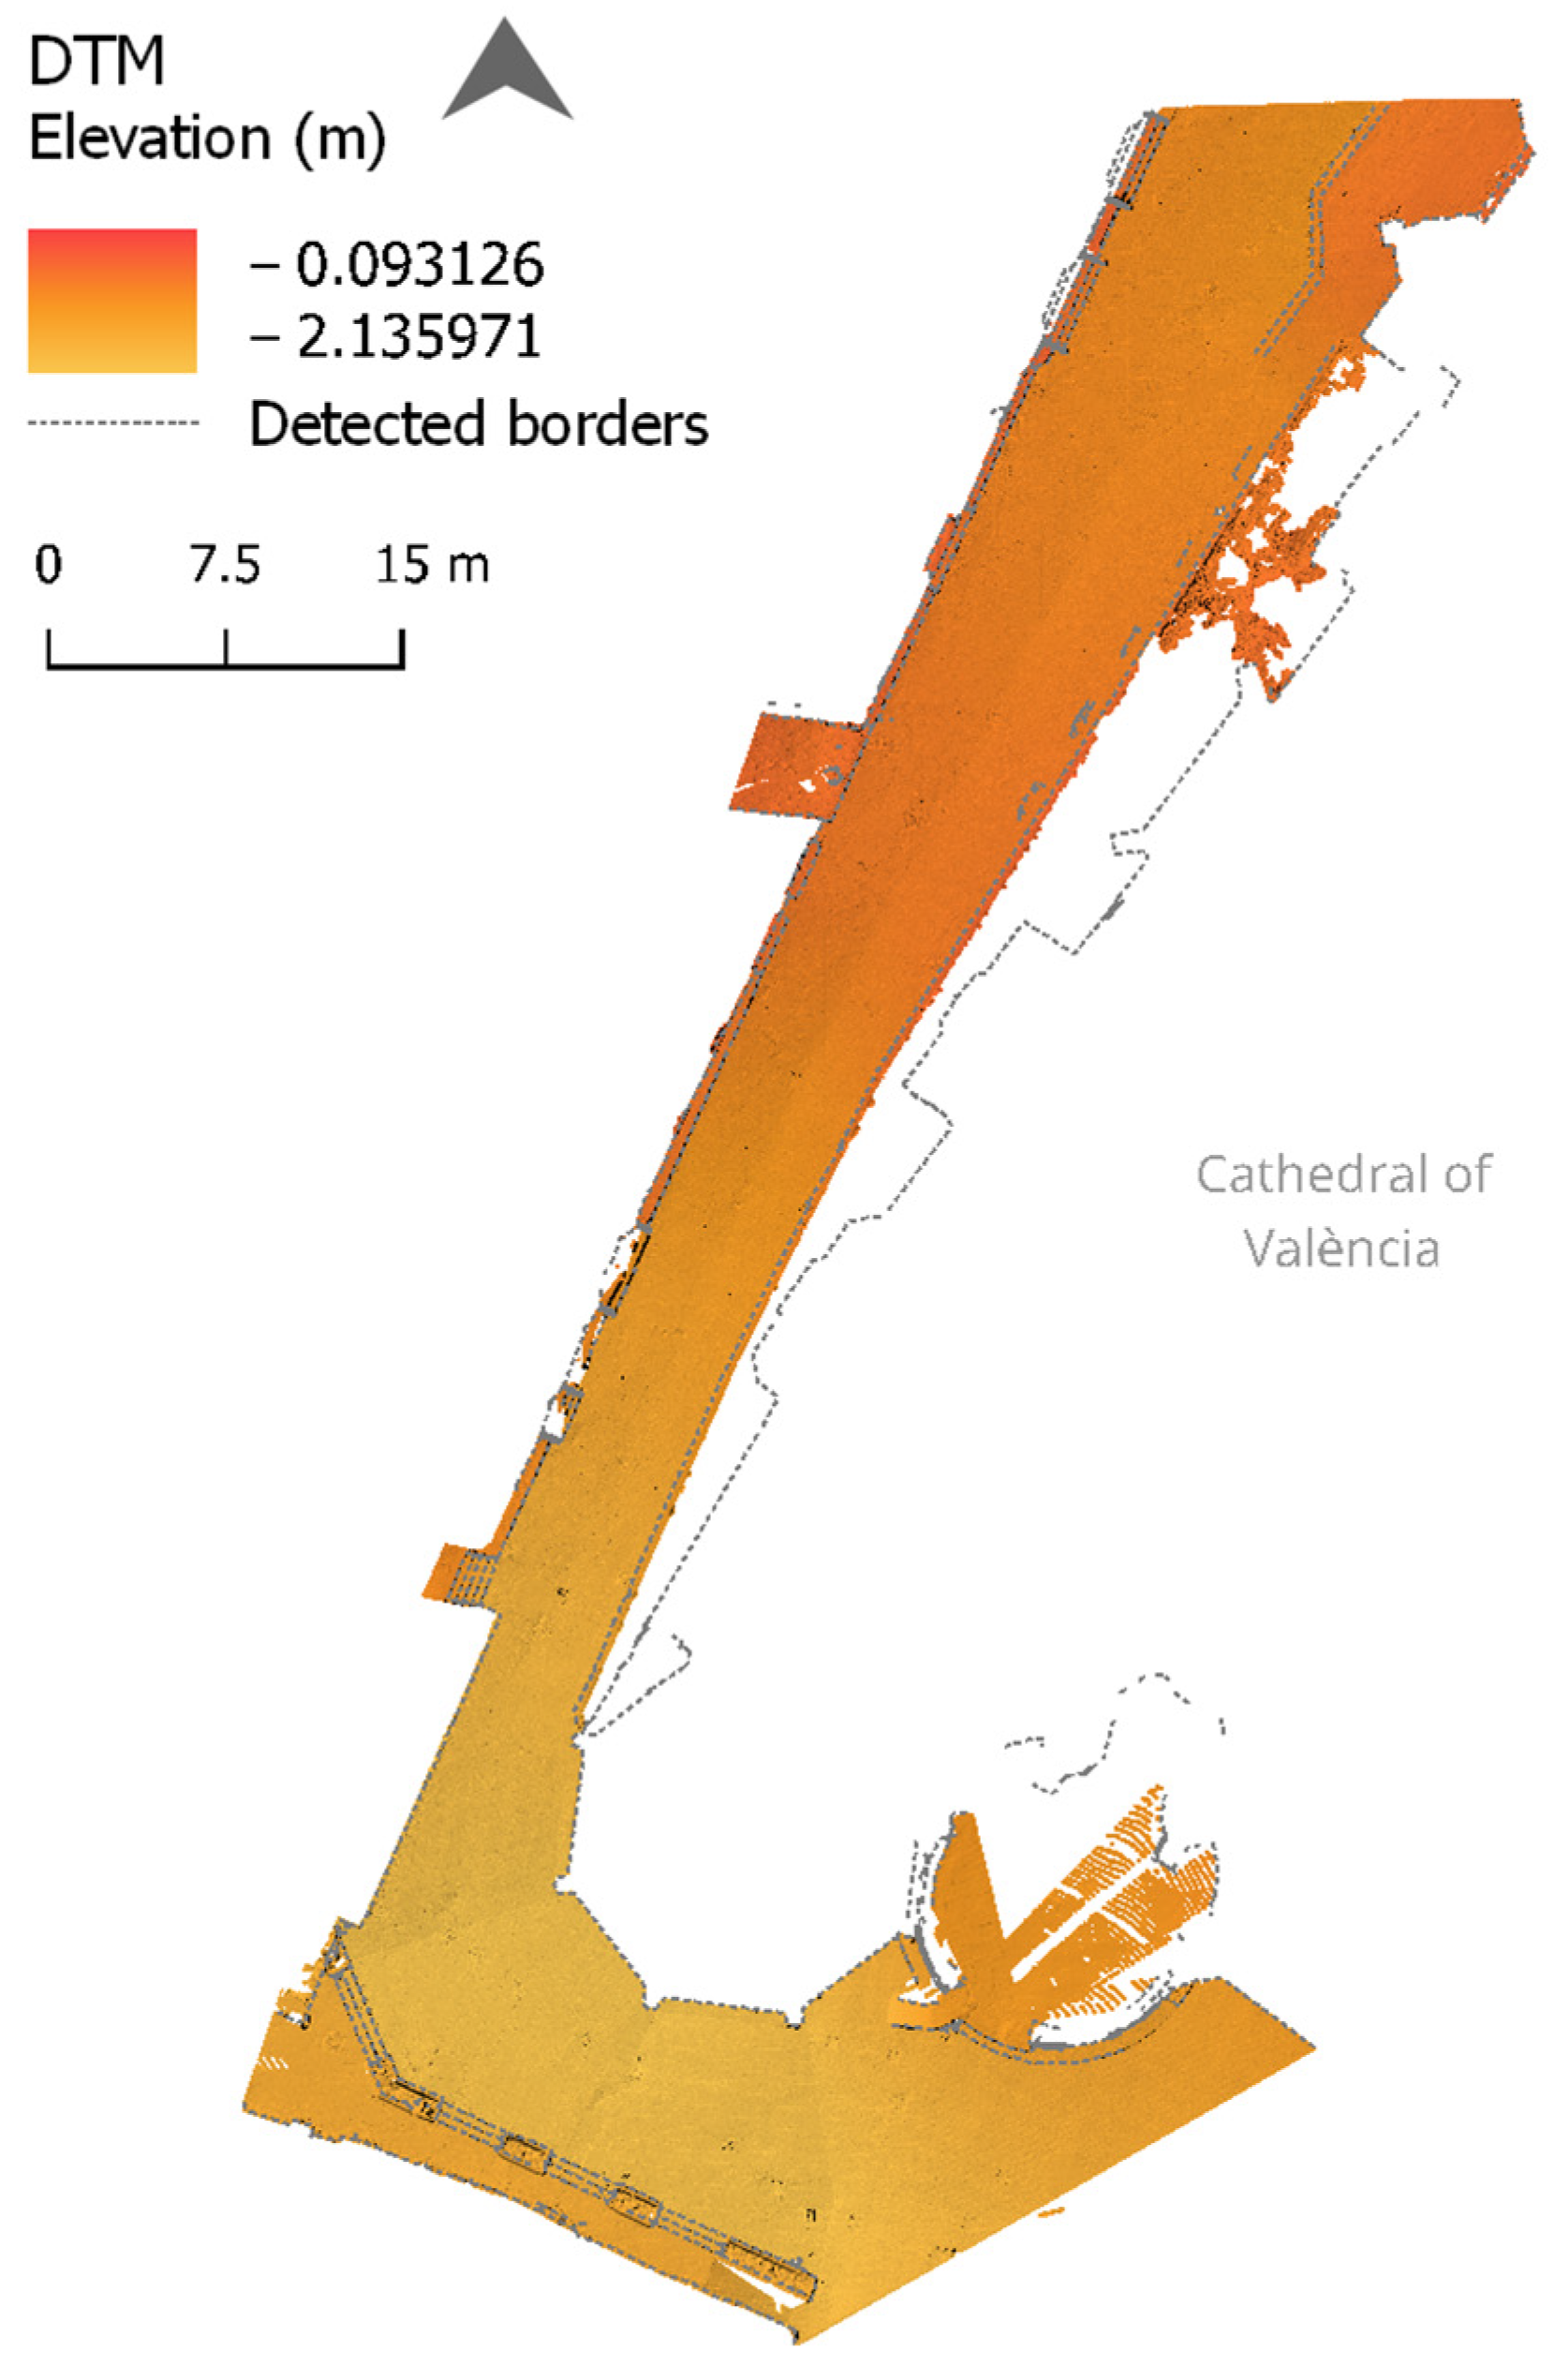
2.3. Detected Borders
A vectorized border layer (Figure 5) was generated. To find the street borders, raster zones with the highest population density of points were extracted from the DTM through reclassification and conversion. Subsequently, using the “Thin greyscale image to skeleton” plugin in QGIS, a raster that could be vectorized and simplified was obtained. Then, it was possible to vectorize it using the “r.to.vect” GRASS tool.
2.4. Slope Detection
To determine the slope of the street, the “Raster analysis—slope tool” on the DTM in QGIS, a raster with a street’s slopes expressed as percentages, were obtained (Figure 6a).
2.5. Width Detection
For this step, width detection was performed using cross-sections created in QGIS. This approach was chosen for its convenience in simultaneously creating multiple sections, allowing for evaluation and comparison in a 2D surface. To obtain these sections, points were first interpolated every 1 m along the street axis, obtained from the “Street Axes” layer downloaded from the Ayuntamiento de Valencia’s Open Data Portal [41]. Using the “geometry by expression” tool, perpendicular lines to the axis were generated on these points. Then, through the “intersection of lines” and “SAGA. Split lines at points” tools, they were cut with respect to the previously created borders. Lines with less than 2 intersection points were filtered to exclude any section residues left outside the streets. Subsequently, using the field calculator, the widths of all sections were determined (Figure 6b). Then, the information was converted to raster format to interpolate the data obtained over the entire street area.
2.6. Scale Detection
Taking the cross-section lines created before, the starting and ending points of these were obtained using the “geometry by expression” tool. Using the “sample raster values” tool on the borders’ raster layer with the point cloud information (Figure 7a), the heights of the facades were obtained. Due to the inclinations of certain historic buildings, correction was necessary. To perform this, points were generated through an expression 5 cm from the end of the sections, selecting the point with the greatest height using the “join attributes by proximity” tool and applying a filter in the field calculator. The data from these points were exported to the section line using the “join attributes by location (summary)” tool, calculating the highest and lowest points. With this data, it was possible to calculate the scale relationship using the field calculator, dividing the width and, for practical purposes in this article, the highest height values of the bounding buildings. This calculation excluded building overhangs, vegetation, and other urban elements which provided a human scale to the streets. Therefore, by exporting the section lines to Cloud Compare, more precise sections could be obtained using the “Segmentation—Extract section” tool. These sections were then exported back to QGIS to obtain heights, and consequently scales, beneath tree canopies and similar elements (Figure 7b). All these data were further processed into a raster format to interpolate the information.
2.7. Attribute Assessment
For the attribute assessment, a grid-based analysis was performed, which allowed for a comparative study of aggregated statistics and an understanding of the data obtained concerning the total area of the street as a comparative point. For this purpose, a grid of hexagons with an area of 1 m2 was generated in QGIS using the “MMQGIS—Create grid layer” plugin. Using the “Zonal statistics” tool, the majority value of each variable was determined for each cell. With this information, qualitative scoring values were assigned to each variable based on commonly accepted thresholds for different levels of steepness in urban streets for the slope variable, and the proposed ones by Massengale and Dover [37], based on traditional principles of urbanism, for scale and width variables (Table 2).
Subsequently, the suitability of each space was determined by summing the assigned scores for the three variables in every cell generated. For this case, all the variables had the same relative weight of importance:
Combined score = Slope score + Scale score + Width score
3. Results
3.1. Slope Score Map
A slope map with qualification scores (Figure 8) was obtained by evaluating areas with a higher or lower slope, using the method for assessment described in the previous section. Then, qualitative scores were assigned to slope values considering factors such as accessibility. For this purpose, the maximum score was assigned to a flat surface with a slope less than 3%, followed by gently sloping surfaces with slopes of 3–6%; then, slopes commonly used in ramps ranging from 6 to 10% were considered; and finally, slopes exceeding theses values had the lowest value (Table 2).
The generated slope score map shows that the street has a very low slope and makes it possible to detect the presence of accessibility ramps.
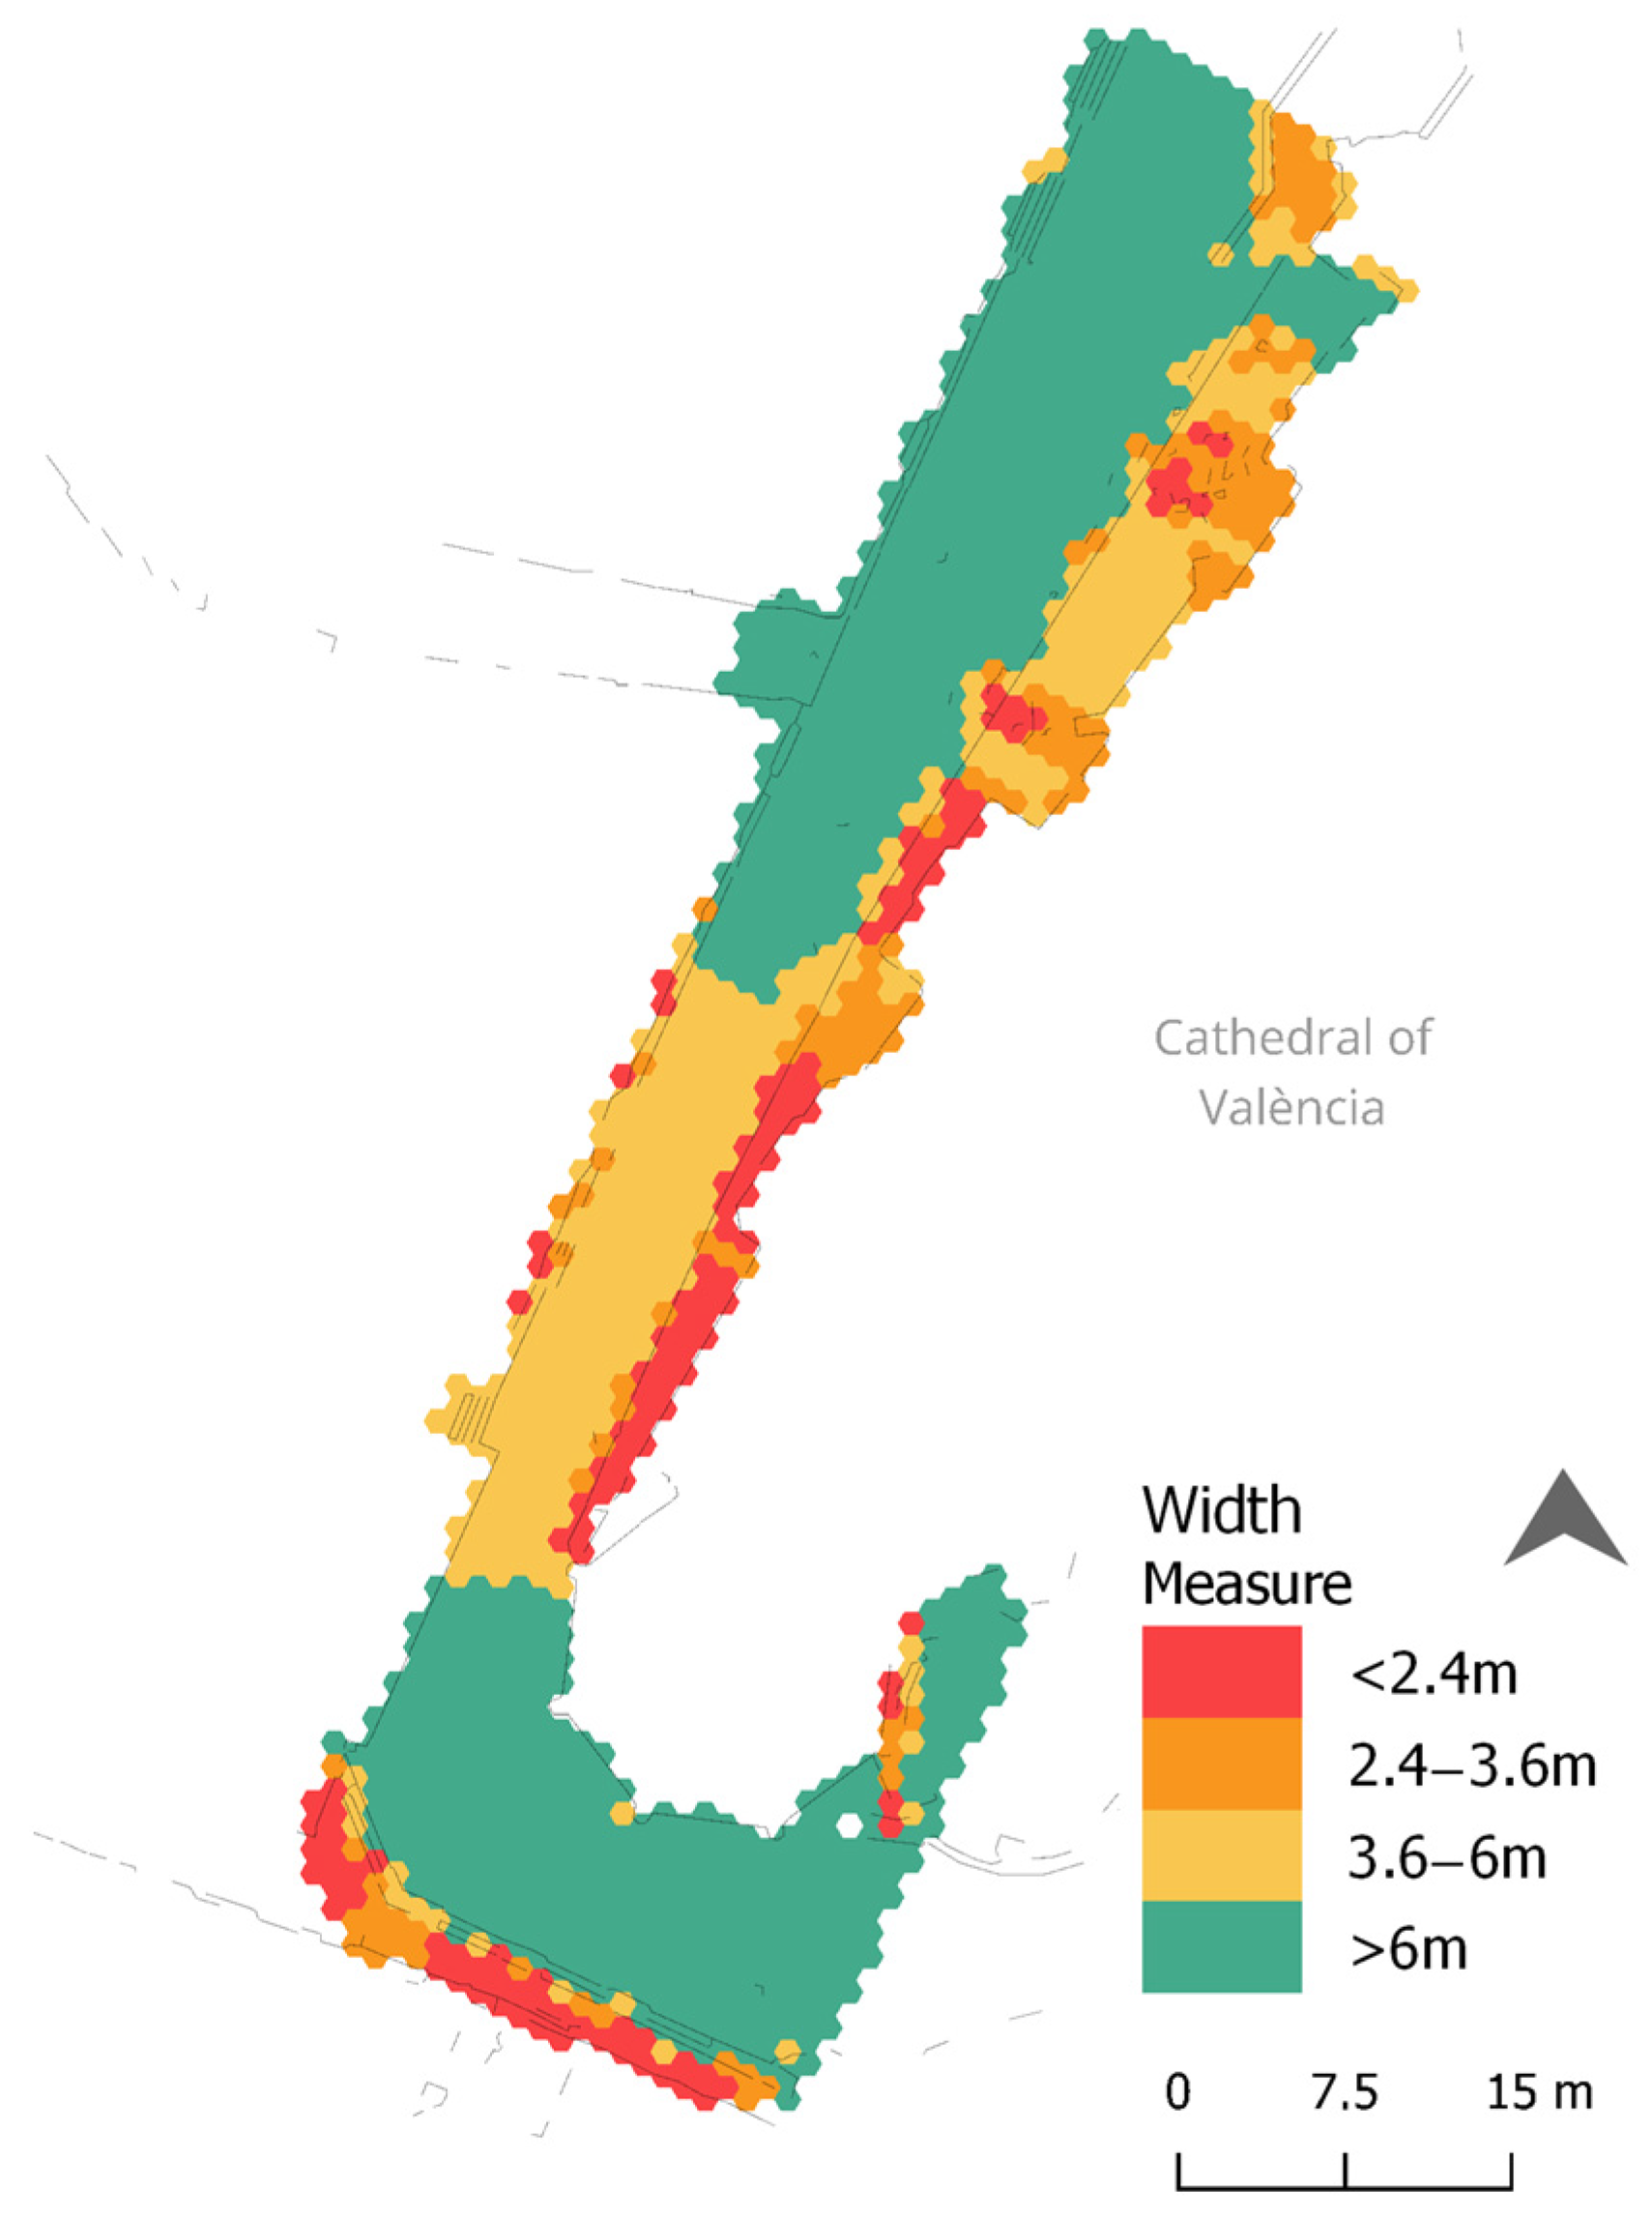
3.2. Width Score Map
Using the same assessment method, a width map with qualification scores was obtained (Figure 9). In this case, the scores proposed by Massengale and Dover [37] were used, approximated to metric values (Table 2).
The map in Figure 9 displays a narrower central zone of the street, reduced areas between urban furniture and the street edge, and a narrow section in the southern part of the street.
3.3. Scale Map
As in the previous section, a scale map with qualification scores was generated (Figure 10). The qualification of scale values was elaborated using the scores proposed by Massengale and Dover [37] (Table 2).
The scale score map shows that the street has a scale that differs from the ideal standards mentioned by the cited authors. It approaches these standards when the street opens up to its perpendicular roads or when there is vegetation present. It is also noteworthy how the presence of Miguelete Tower (the Cathedral) affects the scale of the adjacent pedestrians, which is visible in the lower part of the image.
3.4. Combined Score Map
Using the three obtained maps and summating their scores, it was possible to obtain a combined score map (Figure 11) related to the suitability of a street for pedestrian dynamics, with the areas with the highest scores being the most suitable, and vice versa.
The values of the suitable slope, width, and human scale were obtained, totalling the results presented in Table 3, along with their respective qualitative assessments, revealing areas with a higher propensity for pedestrian use or functioning as stay or meeting zones, showing that most of the street is adequate, with 69.45% of its area having a high score (Table 4).
4. Conclusions
The efficacy of accurately measuring physical characteristics of streets that influence people’s dynamics was demonstrated using point clouds and GIS tools. This included attributes such as the street width, slope, and human scale. The application of 3D scanning techniques and GIS tools not only facilitates data collection but also allows for the objective collection of qualitative information. This reduces the dependence on direct observations and minimizes the inherent bias in subjective interpretation, adding a new option for operationalizing qualitative variables and aligning with studies such as those presented by Ewing and Handy [22] or Yin [23].
Considering the two- and three-dimensionality of a street when representing it is crucial for conducting urban analyses at smaller scales. This approach enables the observation of the diverse elements present on streets and how their qualities vary along the thoroughfare. The presented results could contribute an additional layer of understanding to similar studies conducted on larger scales, such as those by Bassiri et al. [33] and Ortega et al. [38], helping in understanding the street as a place where urban life happens, instead of just being a link that connects different areas of cities.
It is essential to recognize that while publicly accessible data are useful for large-scale decisions, such as mobility management or zoning regulation, they lack the necessary detail for analyses focused on pedestrian perception and needs. Elements like vegetation, urban furniture, or accessibility features like ramps are overlooked due to resolution limitations.
The methodology presented is replicable but also highly adaptable to various conditions and diverse variables of public space. It can become a valuable management tool for data-driven decision-making, especially in environments where public geospatial information is not available, making on-site laser scanning more feasible.
Furthermore, the applications of this methodology are varied and diverse, making it a valuable resource for social sustainability. It can be used in managing historic centres, planning tourist routes or events, identifying areas suitable for creating rest spaces, detecting streets or areas with accessibility limitations, potential congestion problems, and crowding management, and many other applications. This opens the door to future research focused on understanding and improving the various qualities of streets and other open urban spaces for the benefit of the community and social well-being in urban environments.
This methodology can be applied using other variables, such as areas with climatic protection, well-lit spaces, less visible zones, and highly trafficked areas, among others. This diversity of variables opens the door to hierarchical analyses where some variables may carry more weight than others. For instance, the current study could be replicated by assigning a higher value to the slope variable compared to others, for a hypothetical examination of suitable areas for individuals with reduced mobility. Another scenario could involve the width variable becoming more significant, for a potential investigation into optimal areas for large groups of people.
It is important to emphasize that the measurement scores used in the evaluation of urban streets must adapt to the specificities of each case study and the variables under analysis. For example, in the studied case, it can be observed that the analysed historic street of Valencia has a non-ideal scale, but one that is characteristic of a medieval layout, where such a scale could be desired by pedestrians because it highlights the historical streetscape value of the city’s streets. In the same way, the presence of vegetation on Miguelete Street contributes to achieving a conventionally suitable human scale. This consideration underscores the importance of recognizing the relationship between the physical attributes of streets and the perception and satisfaction of users and how a possible analysis spanning two different scales can bring to light crucial street characteristics.
Author Contributions
Conceptualization, P.R.O.C.; methodology, P.R.O.C. and M.J.V.; software, P.R.O.C.; validation, P.R.O.C., M.J.V. and M.C.L.-G.; formal analysis, P.R.O.C.; investigation, P.R.O.C.; resources, P.R.O.C., M.J.V. and M.C.L.-G.; data curation, P.R.O.C.; writing—original draft preparation, P.R.O.C.; writing—review and editing, P.R.O.C., M.J.V. and M.C.L.-G.; visualization, P.R.O.C.; supervision, M.J.V. and M.C.L.-G.; project administration, M.J.V. and M.C.L.-G.; funding acquisition, M.J.V. and M.C.L.-G. All authors have read and agreed to the published version of the manuscript.
Funding
This research was funded by the project “Analysis and Development of HBIM Integration into GIS for Creating a Cultural Heritage Tourism Planning Protocol” (ref. PID2020-119088RB-I00), funded by the Ministry of Science and Innovation, Government of Spain, and the “Programa de Ayudas de Investigación y Desarrollo (PAID-01-22)” by the Universitat Politècnica de València. The APC will be funded by Universitat Politècnica de València.
Data Availability Statement
The datasets used and/or analysed during the current study are available from the first author upon reasonable request.
Acknowledgments
GPT-3.5 OpenAI’s large-scale language generation model, January–April 2024, was used to improve the translation of this document. The authors assume full responsibility for the final content of this publication.
Conflicts of Interest
The authors declare no conflicts of interest.
References
- Marshall, S. Street & Patterns, 1st ed.; Spon Press: Oxon, ON, Canada, 2005; ISBN 0203589394. [Google Scholar]
- Mehta, V. The Street: A Quintessential Social Public Space; Earthscan (Routledge): New York, NY, USA, 2013; ISBN 9780203067635. [Google Scholar]
- Moughtin, C. Urban Design: Street and Square, 3rd ed.; Elsevier Science: Oxford, UK, 2003; ISBN 0750657170. [Google Scholar]
- Carmona, M. Explorations in Urban Design: An Urban Design Research Primer, 1st ed.; Routledge: New York, NY, USA, 2014; ISBN 978-1-4094-6264-4. [Google Scholar]
- Hillier, B.; Hanson, J. The Social Logic of Space; Cambridge University Press: Cambridge, UK, 1984; ISBN 9780521233651. [Google Scholar]
- DepthmapX: Visual and Spatial Network Analysis Software. Available online: https://github.com/SpaceGroupUCL/depthmapX/ (accessed on 10 January 2024).
- Capitanio, M. Attractive Streetscape Making Pedestrians Walk Longer Routes: The Case of Kunitachi in Tokyo. J. Arch. Urban. 2019, 43, 131–137. [Google Scholar] [CrossRef]
- Xu, Y.; Rollo, J.; Jones, D.S.; Esteban, Y.; Tong, H.; Mu, Q. Towards Sustainable Heritage Tourism: A Space Syntax-Based Analysis Method to Improve Tourists’ Spatial Cognition in Chinese Historic Districts. Buildings 2020, 10, 29. [Google Scholar] [CrossRef]
- Pan, M.; Shen, Y.; Jiang, Q.; Zhou, Q.; Li, Y. Reshaping Publicness: Research on Correlation between Public Participation and Spatial Form in Urban Space Based on Space Syntax—A Case Study on Nanjing Xinjiekou. Buildings 2022, 12, 1492. [Google Scholar] [CrossRef]
- Wang, X.; Zhu, R.; Che, B. Spatial Optimization of Tourist-Oriented Villages by Space Syntax Based on Population Analysis. Sustainability 2022, 14, 11260. [Google Scholar] [CrossRef]
- Wu, Y.; Wang, J.; Lau, S.S.Y.; Lau, S.S.Y.; Miao, Y. An Improved Publicness Assessment Tool Based on a Combined Spatial Model: Case Study of Guangzhou, China. Sustainability 2022, 14, 14711. [Google Scholar] [CrossRef]
- Salazar Miranda, A.; Fan, Z.; Duarte, F.; Ratti, C. Desirable Streets: Using Deviations in Pedestrian Trajectories to Measure the Value of the Built Environment. Comput. Environ. Urban Syst. 2021, 86, 101563. [Google Scholar] [CrossRef]
- Hosseini, R.; Tong, D.; Lim, S.; Sun, Q.C.; Sohn, G.; Gidófalvi, G.; Alimohammadi, A.; Seyedabrishami, S. A Novel Method for Extracting and Analyzing the Geometry Properties of the Shortest Pedestrian Paths Focusing on Open Geospatial Data. ISPRS Int. J. Geo-Inf. 2023, 12, 288. [Google Scholar] [CrossRef]
- Lopes, M.; Santos Cruz, S.; Pinho, P. Revisiting Publicness in Assessment of Contemporary Urban Spaces. J. Urban Plan. Dev. 2019, 145, 04019013. [Google Scholar] [CrossRef]
- Lopes, M.; Santos Cruz, S.; Pinho, P. Publicness of Contemporary Urban Spaces: Comparative Study Between Porto and Newcastle. J. Urban Plan. Dev. 2020, 146, 04020033. [Google Scholar] [CrossRef]
- Park, K.; Ewing, R.; Sabouri, S.; Larsen, J. Street Life and the Built Environment in an Auto-Oriented US Region. Cities 2019, 88, 243–251. [Google Scholar] [CrossRef]
- Nagata, S.; Nakaya, T.; Hanibuchi, T.; Amagasa, S.; Kikuchi, H.; Inoue, S. Objective Scoring of Streetscape Walkability Related to Leisure Walking: Statistical Modeling Approach with Semantic Segmentation of Google Street View Images. Health Place 2020, 66, 102428. [Google Scholar] [CrossRef] [PubMed]
- Wang, R.; Rasouli, S. Contribution of Streetscape Features to the Hedonic Pricing Model Using Geographically Weighted Regression: Evidence from Amsterdam. Tour. Manag. 2022, 91, 104523. [Google Scholar] [CrossRef]
- de Almeida, D.S.B. Urban Tourism Crowding Dynamics: Carrying Capacity and Digital Twinning; University Institute of Lisbon: Lisbon, Portugal, 2021. [Google Scholar]
- Orozco Carpio, P.R.; Viñals, M.J.; Escudero, P.A.; Rolim, R.C.V.S. Geospatial Tools for Determining Visitor Carrying Capacity in Tourist Streets and Public Spaces of Historic Centres. Heritage 2023, 6, 7100–7114. [Google Scholar] [CrossRef]
- Speck, J. Walkable City Rules; Island Press: Washington, DC, USA; Covelo, CA, USA; London, UK, 2018. [Google Scholar]
- Ewing, R.; Handy, S. Measuring the Unmeasurable: Urban Design Qualities Related to Walkability. J. Urban Des. 2009, 14, 65–84. [Google Scholar] [CrossRef]
- Yin, L. Street Level Urban Design Qualities for Walkability: Combining 2D and 3D GIS Measures. Comput. Environ. Urban Syst. 2017, 64, 288–296. [Google Scholar] [CrossRef]
- Tamborrino, R.; Rinaudo, F. Digital Urban History as an Interpretation Key of Cities’ Cultural Heritage. In Proceedings of the 2015 Digital Heritage, Granada, Spain, 28 September–2 October 2015; pp. 235–242. [Google Scholar]
- Guzzetti, F.; Anyabolu, K.; Ambrosio, L.D.; Marchetti, G.; Sarrecchia, S. Dal Rilievo Al Modello BIM Di Una Piazza. ASITA 2018, 577–584. [Google Scholar]
- Dembski, F.; Wössner, U.; Letzgus, M.; Ruddat, M.; Yamu, C. Urban Digital Twins for Smart Cities and Citizens: The Case Study of Herrenberg, Germany. Sustainability 2020, 12, 2307. [Google Scholar] [CrossRef]
- Schrotter, G.; Hürzeler, C. The Digital Twin of the City of Zurich for Urban Planning. PFG J. Photogramm. Remote Sens. Geoinf. Sci. 2020, 88, 99–112. [Google Scholar] [CrossRef]
- Botín-Sanabria, D.M.; Mihaita, S.; Peimbert-García, R.E.; Ramírez-Moreno, M.A.; Ramírez-Mendoza, R.A.; Lozoya-Santos, J.D.J. Digital Twin Technology Challenges and Applications: A Comprehensive Review. Remote Sens. 2022, 14, 1335. [Google Scholar] [CrossRef]
- Gholami, M.; Torreggiani, D.; Tassinari, P.; Barbaresi, A. Developing a 3D City Digital Twin: Enhancing Walkability through a Green Pedestrian Network (GPN) in the City of Imola, Italy. Land 2022, 11, 1917. [Google Scholar] [CrossRef]
- Kumalasari, D.; Koeva, M.; Vahdatikhaki, F.; Petrova Antonova, D.; Kuffer, M. Planning Walkable Cities: Generative Design Approach towards Digital Twin Implementation. Remote Sens. 2023, 15, 1088. [Google Scholar] [CrossRef]
- Di Benedetto, A.; Fiani, M. Characterisation of the Road Surface Using Integrated Remote Sensing Techniques. In D-Site, Drones—Systems of Information on Cultural Heritage for a Spatial and Social Investigation; Salvatore, B., Limogiello, M., Parrinello, S., Dell’Amico, A., Eds.; Pavia University Press: Pavia, Italy, 2020; pp. 346–351. [Google Scholar]
- Yang, N.; Jiang, L.; Chao, Y.; Li, Y.; Liu, P. Influence of Relief Degree of Land Surface on Street Network Complexity in China. ISPRS Int. J. Geo-Inf. 2021, 10, 705. [Google Scholar] [CrossRef]
- Bassiri Abyaneh, A.; Allan, A.; Pieters, J.; Davison, G. Developing a GIS-Based Tourist Walkability Index Based on the AURIN Walkability Toolkit—Case Study: Sydney CBD. In Urban Informatics and Future Cities; Springer: Cham, Switzerland, 2021; pp. 233–256. [Google Scholar]
- Zai, D.; Chen, Y.; Li, J.; Yu, Y.; Wang, C.; Nie, H. Inventory of 3D Street Lighting Poles Using Mobile Laser Scanning Point Clouds. In Proceedings of the 2015 IEEE International Geoscience and Remote Sensing Symposium (IGARSS), Milan, Italy, 26–31 July 2015; pp. 573–576. [Google Scholar]
- Xirui, M.; Yueqian, S.; Jinhu, W.; Teng, H. Hierarchical Extraction Method for Street Lamp Point Cloud Considering Relative Distance. Laser Optoelectron. Prog. 2022, 59, 1–8. [Google Scholar] [CrossRef]
- Xu, J.; Jia, X.; Cheng, Z. Detection Method of Street Tree Trunks from Point Clouds Based on Multilayer Aggregation. Laser Optoelectron. Prog. 2023, 60, 1228009. [Google Scholar] [CrossRef]
- Massengale, J.; Dover, V. Street Design: The Secret to Great Cities and Towns; Wiley: New York, NY, USA, 2014; ISBN 978-1-118-06670-6. [Google Scholar]
- Ortega, E.; Martín, B.; De Isidro, Á.; Cuevas-Wizner, R. Street Walking Quality of the ‘Centro’ District, Madrid. J. Maps 2020, 16, 184–194. [Google Scholar] [CrossRef]
- Institut Cartogràfic Valencià—ICV. Available online: https://icv.gva.es/ (accessed on 10 February 2024).
- Liu, J.; Azhar, S.; Willkens, D.; Li, B. Static Terrestrial Laser Scanning (TLS) for Heritage Building Information Modeling (HBIM): A Systematic Review. Virtual Worlds 2023, 2, 90–114. [Google Scholar] [CrossRef]
- Ayuntamiento de Valencia Portal de Datos Abiertos de Valencia. Available online: https://valencia.opendatasoft.com/ (accessed on 10 February 2024).
Figure 1.
Location map of the study area. Top-left, the location of the Comunitat Valenciana Region in Spain. Top-right, the location of Ciutat Vella into the city of Valencia. Botton-left, Valencia city centre (Ciutat Vella neighbourhood) and the location of Miguelete Street. Botton-right, Miguelete Street urban context. Cartographic source: aerial orthophoto 2022CVAL [39].

Figure 2.
Methodology diagram to assess street physical attributes using point clouds and GIS.

Figure 3.
Laser scanner survey: (a) complete point cloud project and (b) point cloud of the study area with the scan positions.
Figure 3.
Laser scanner survey: (a) complete point cloud project and (b) point cloud of the study area with the scan positions.

Figure 4.
Isometric views of Miguelete Street. Showing east facades: (a) point cloud with RGB colours and (b) differentiated walkable surface. Showing west facades: (c) point cloud with RGB colours and (d) differentiated walkable surface. Facades on the opposite side of the street were hidden for better visualization.

Figure 5.
Miguelete Street DTM and detected borders, with a Hillshade effect, on QGIS.

Figure 6.
Isometric view of (a) slope raster and (b) resulting sections with width values. Facades on one side of the street were hidden for better visualization.
Figure 6.
Isometric view of (a) slope raster and (b) resulting sections with width values. Facades on one side of the street were hidden for better visualization.

Figure 7.
Isometric view of (a) point cloud with height values and (b) height points and resulting sections with scale values. Facades on one side of the street were hidden for better visualization.
Figure 7.
Isometric view of (a) point cloud with height values and (b) height points and resulting sections with scale values. Facades on one side of the street were hidden for better visualization.

Figure 8.
Slope score map of Miguelete Street.

Figure 9.
Width score map of Miguelete Street.

Figure 10.
Scale map of Miguelete Street.

Figure 11.
Combined score map of Miguelete Street. The scores are related to the suitability of a street for pedestrian dynamics.
Figure 11.
Combined score map of Miguelete Street. The scores are related to the suitability of a street for pedestrian dynamics.


Table 1.
Overview of used geodata.
| Name | Type | Use | Scale; Resolution | Source |
|---|---|---|---|---|
| Aerial Orthophoto 2022 | Orthorectified aerial image | Reference, location map | 1/5000; 0.25 m | Institut Cartogràfic Valencià |
| Boundaries of the districts of the city of Valencia | Vector boundary map | Reference, location map | – | Ayuntamiento de Valencia |
| Boundary of the Comunitat Valenciana | Vector boundary map | Reference, location map | 1/[“25,000”, “5000”] | Institut Cartogràfic Valencià; Instituto Geográfico Nacional |
| Point cloud of Miguelete Street | 3D LiDAR point cloud | Analysis, DTM generation, border detection | 6 mm | Research group—acquisition |
| Digital terrain model (DTM) of Miguelete Street | Digital terrain model | Border detection, attribute detection | 0.02 m | Self-acquisition based on point cloud |
| Borders of Miguelete Street | Vector boundary map | Width and scale analysis | 0.02 m | Self-acquisition based on point cloud and MDT |
| Street axes of the city of Valencia | Vector map | Section generation | – | Ayuntamiento de Valencia |
| Building parcels of the city of Valencia | Vector building map | Reference | 1/[“1000”, “500”] | Cadastral Electronic Site, Government of Spain |
Table 2.
Score table for slope, scale, and width.
| Variable | Class Interval | Score |
|---|---|---|
| Slope (%) | ≥10 | 0 |
| 10–6 | 6 | |
| 6–3 | 8 | |
| <3 | 10 | |
| Scale (Street width/adjacent building height) | <1:6 | 0 |
| 1:6–1:3 | 6 | |
| 1:3–1:1 | 8 | |
| ≥1:1 | 10 | |
| Width (m) | <2.4 | 0 |
| 2.4–3.6 | 4 | |
| 3.6–6.0 | 6 | |
| ≥6.0 | 10 |
Table 3.
Percentage results of the slope, scale, and width of Miguelete Street.
| Variable | Class Intervals | Frequency | Percentage | Cumulative Frequency | Cumulative Percentage |
|---|---|---|---|---|---|
| Slope | <3 | 563 | 42.78% | 563 | 42.78% |
| 3–6 | 497 | 37.77% | 1060 | 80.55% | |
| 6–10 | 78 | 5.93% | 1138 | 86.47% | |
| ≥10 | 32 | 2.43% | 1170 | 88.91% | |
| N/A | 146 | 11.09% | 1316 | 100.00% | |
| Scale | <1:6 | 54 | 4.10% | 54 | 4.10% |
| 1:6–1:3 | 163 | 12.39% | 217 | 16.49% | |
| 1:3–1:1 | 728 | 55.32% | 945 | 71.81% | |
| ≥1:1 | 371 | 28.19% | 1316 | 100.00% | |
| N/A | 0 | 0.00% | 1316 | 100.00% | |
| Width | <2.4 | 122 | 9.27% | 122 | 9.27% |
| 2.4–3.6 | 122 | 9.27% | 244 | 18.54% | |
| 3.6–6.0 | 300 | 22.80% | 544 | 41.34% | |
| ≥6.0 | 751 | 57.07% | 1295 | 98.40% | |
| N/A | 21 | 1.60% | 1316 | 100.00% |
Table 4.
Miguelete Street qualification.
| Combined Score | Quantile | Frequency | Percentage | Cumulative Frequency | Cumulative Percentage |
|---|---|---|---|---|---|
| Highest | 1.00 | 593 | 45.08% | 593 | 45.08% |
| High | 0.75 | 321 | 24.37% | 914 | 69.45% |
| Moderate | 0.50 | 301 | 22.89% | 1215 | 92.34% |
| Low | 0.25 | 101 | 7.66% | 1316 | 100.00% |
| Lowest | 0.00 | 0 | 0.00% | 1316 | 100.00% |
Disclaimer/Publisher’s Note: The statements, opinions and data contained in all publications are solely those of the individual author(s) and contributor(s) and not of MDPI and/or the editor(s). MDPI and/or the editor(s) disclaim responsibility for any injury to people or property resulting from any ideas, methods, instructions or products referred to in the content. |
© 2024 by the authors. Licensee MDPI, Basel, Switzerland. This article is an open access article distributed under the terms and conditions of the Creative Commons Attribution (CC BY) license (https://creativecommons.org/licenses/by/4.0/).
Share and Cite
MDPI and ACS Style
Orozco Carpio, P.R.; Viñals, M.J.; López-González, M.C. 3D Point Cloud and GIS Approach to Assess Street Physical Attributes. Smart Cities 2024, 7, 991-1006. https://0-doi-org.brum.beds.ac.uk/10.3390/smartcities7030042
AMA Style
Orozco Carpio PR, Viñals MJ, López-González MC. 3D Point Cloud and GIS Approach to Assess Street Physical Attributes. Smart Cities. 2024; 7(3):991-1006. https://0-doi-org.brum.beds.ac.uk/10.3390/smartcities7030042
Chicago/Turabian StyleOrozco Carpio, Patricio R., María José Viñals, and María Concepción López-González. 2024. "3D Point Cloud and GIS Approach to Assess Street Physical Attributes" Smart Cities 7, no. 3: 991-1006. https://0-doi-org.brum.beds.ac.uk/10.3390/smartcities7030042