1. Introduction
The increased electrical energy demand from utilities resulted in the rapid development of new power networks. The reliability of the insulation of the high-voltage transmission networks is vital to ensuring the continuity of the electrical supply. Solid dielectrics, particularly polymers, are the backbone of high-voltage insulation [
1,
2,
3]. Continuous high-voltage stress can initiate localised discharges at specific sites where the electric stress is higher than the breakdown strength, leading to the deterioration of dielectric insulating materials [
4,
5,
6]. The presence of a void or cavity within the insulation during the manufacturing of cable insulation, the surface roughness, or the presence of any protrusion at the interface of different layers of the power cable, either because of a manufacturing fault or due to mechanical stress, alters the homogeneity of the material, which affects the dielectric characteristics (specifically the dielectric constant) of the material [
7,
8,
9]. Due to the non-homogeneity, highly divergent electric stress occurs around the cavity or defect, which ionises the gas inside the cavity, and PDs are developed inside the insulation, which can lead to insulation breakdown [
10,
11,
12].
To ensure reliability and continuous electric supply, in parallel with the engineering of novel insulation materials with better dielectric strength, it is necessary to develop suitable monitoring techniques to observe the reliability and life of the power cables. Many online and offline PD detection techniques, such as chemical, electrical, and optical, are widely used to detect and locate PD events in various insulating mediums [
13]. Chemical detection techniques can only be applied offline, while electrical and optical techniques can be used online to detect PD [
13,
14,
15]. The disadvantage of the latter two techniques is that the electrical and optical signals are prone to external interference, and the interpretation of the resultant electrical or optical signal becomes very complex [
8].
The PD events also produce short-duration acoustic pulses, which ultrasonic transducers can detect, and the information can be used to locate the source of these PD events [
13,
16,
17,
18]. This technique is well established in gas-insulated systems (GIS) and in systems insulated with liquids to detect the PD and locate its source, but it is still not fully explored in solid insulation systems. Further, the effect of scattering and reflections on a propagating acoustic pulse is a fundamental challenge in AE detection techniques, as they can attenuate the propagating signal and make the signal interpretation more complex. Thus far, many models have been suggested in the recent past to detect the AE from a PD event [
19,
20] in different mediums. Still, the effects of acoustic scattering and reflections on the propagating acoustic pulse are not addressed yet. This is particularly the case when employing this technique to locate PD sources in liquid insulation, which is characterised by substantial reflections and scattering of acoustic pulses, as well as in underground power cables with solid polymeric insulation that can cause reflections and scattering of the acoustic signals due to the morphology of the polymers. Neglecting the effects of acoustic scattering and reflections and interpreting the attenuated acoustic signal can lead to inaccurate information about the PD event.
Hence, this article analyses the effects of reflections and scattering on the propagating acoustic pulse in the solid insulating medium. The approach can also help address the impact of reflections and scattering on the propagating acoustic pulse in other media. The findings of this study have the potential to contribute to future research involving the use of acoustic emission as a detection technique in various types of insulating mediums.
2. Simulation of Acoustic Emission (AE) and Propagation from Discharge
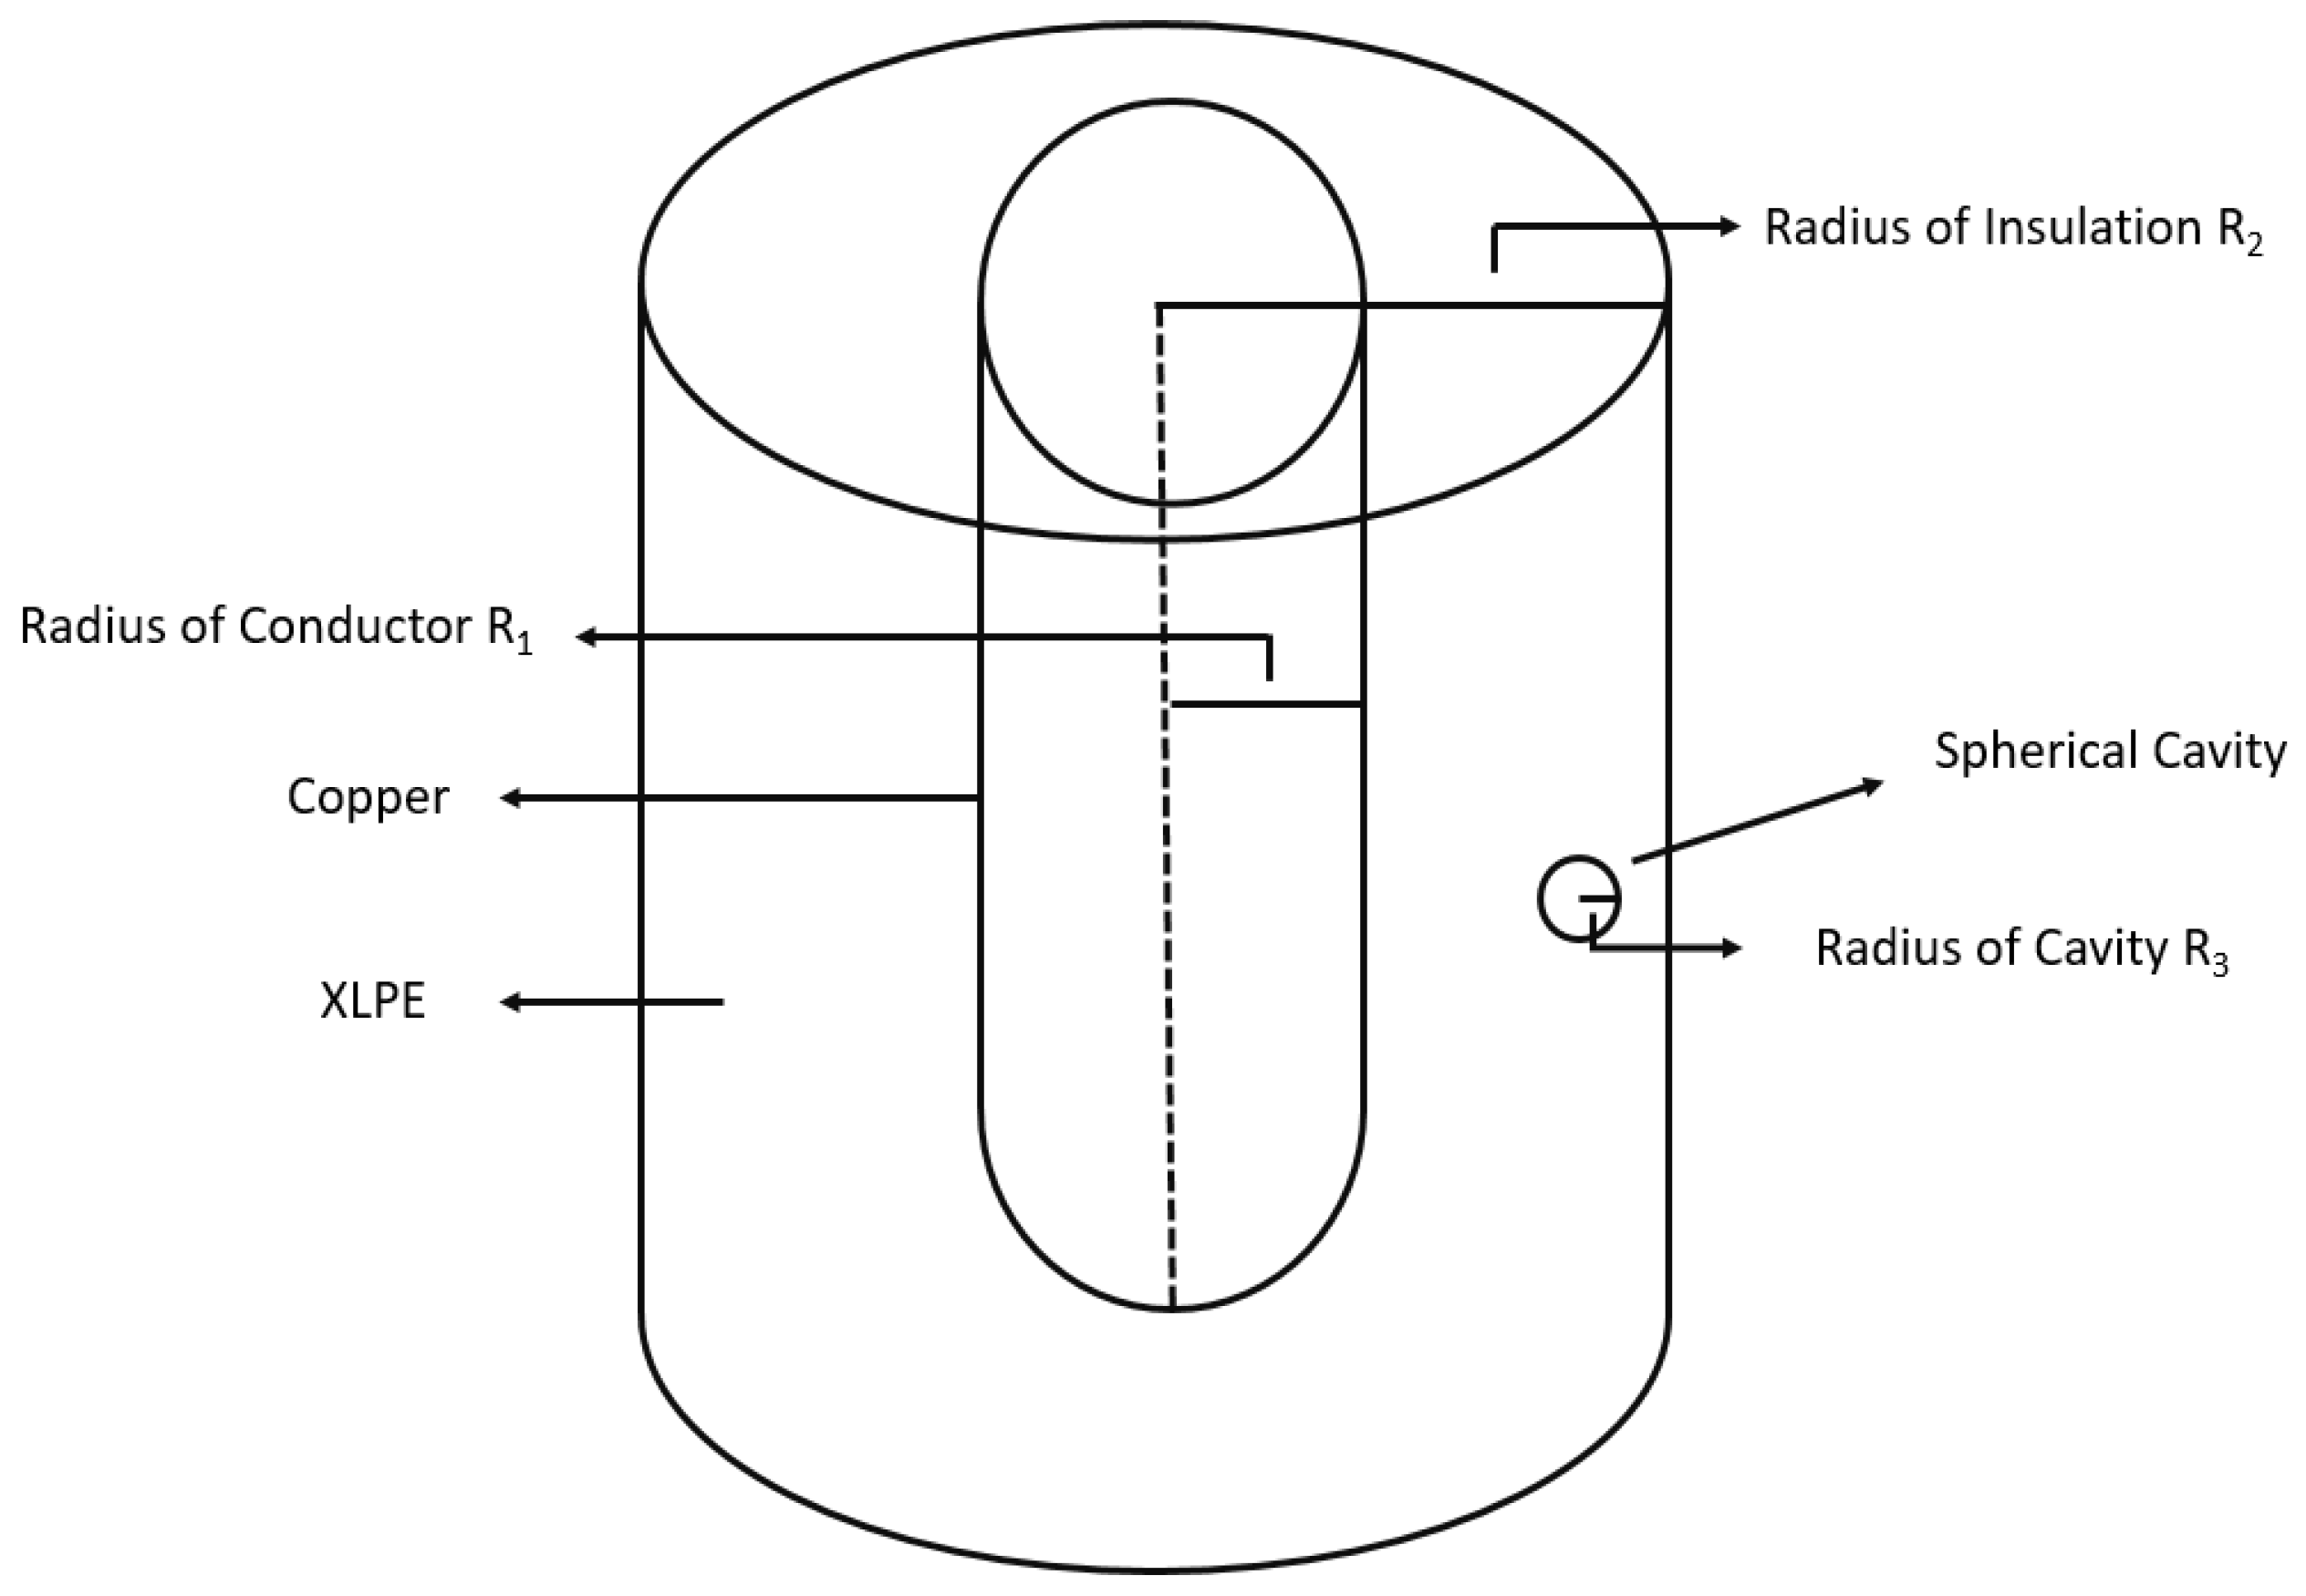
The PD event releases energy, and because of the short duration of the PD event, it creates an acoustic pressure pulse that can propagate through the material. The propagation of this acoustic pulse depends upon the energy supplied at the time of initiation and the material’s response to this propagating pulse. A simulation model was developed in the electrostatic module of COMSOL Multiphysics 4.3b to predict the electric field inside the spherical cavity for a 33 kV high-voltage cable topology, as shown in
Figure 1. The geometric parameters considered are shown in
Table 1.
The electric field across the cavity is not uniform. It is higher around the surface facing the conductor and lower at the cavity’s surface opposite the conductor. As the diameter of the cavity is much smaller than the diameter of the insulation, the percentage change in the electric field across the cavity is very small. Hence, it was assumed that the electric field across the cavity is uniform. The electric field ‘
’ inside the cavity estimated from the COMSOL Multiphysics model was 5.5 × 10
6 V/m. Further, the electrostatic energy stored in the cavity can be calculated by using the following equation:
For a spherical cavity with radius
3, the expression
can be represented as follows:
The electrostatic energy stored in the cavity was calculated using the above equations and found to be 5.6 × 10
−7 J. It is assumed that the energy stored in the cavity is converted into a shock wave propagating through the insulation material. Further, the amount of pressure developed by this energy can be calculated using the equation below [
21].
where
V is the volume of the cavity. The pressure calculated from the above equations was
. This was used to define the peak value of the acoustic pulse at the source to analyse the propagation characteristics of AE in COMSOL Multiphysics 4.3b.
A three-dimensional (3D) COMSOL Multiphysics 4.3b model was developed using partial differential equations to analyse the propagation characteristics of the acoustic pulse. Moreover, the mathematical module was chosen from the application mode of COMSOL Multiphysics, as this module provides the flexibility to specify customised mathematical equations, allowing for the precise definition of conditions governing the propagation of the acoustic pulse. In the mathematical mode of COMSOL Multiphysics 4.3b, the coefficient form of the partial differential equation was selected to analyse the propagation of the acoustic pulse.
Further, the wave equation governing the propagation characteristics of an acoustic wave can be represented as follows:
here,
is the density of the material in kg/m
3, P(x, t) is the pressure in Pa, and S(x, t) is the acoustic source, which represents the displacement of the wave at position x and time t in metres (m). Equation (4) was modified by changing the parameters and variables to obtain the PDE of acoustic wave propagation. The partial discharge was assumed to act as a point source emitting acoustic waves. This point source in the FEA model can be described as:
Here,
) is the Gaussian pulse, which can be described as follows:
The above equation is obtained from the acoustic model of the Gaussian pulse point source [
19]. Here,
represents the pulse width, and
represents the pulse bandwidth, which is inversely proportional to the pulse width (
= 1/
). The duration of a discharge event varies between tens and hundreds of nanoseconds. Therefore, in the simulation, the values for
can be adjusted to reduce the computing complexity. The above model
was used, and preliminary studies revealed that the pressure signal was not significantly sensitive to the pressure pulse width. Notation A represents the flow of energy away from the acoustic source in m
3/s. The value of the flow of energy defines the peak value of the acoustic pressure. The pressure value calculated analytically from Equation (3) was used to determine the peak of the pressure pulse emitted from the source as shown in
Figure 2.
Meshing: The polymer domain was meshed using tetrahedral-shaped elements of quadratic Lagrange order, divided into three sets. To accurately resolve the propagation of acoustic pulses, a minimum of five to six mesh elements per wavelength is required when using quadratic Lagrange elements. The maximum mesh size was calculated analytically using the following equation [
19]:
where
is the maximum size of the element in mesh,
is the minimum wavelength calculated at maximum frequency related to the bandwidth of the Gaussian pulse and speed of sound
in the polymer as defined in
Table 2, and
is the number of elements per wavelength. For the model,
,
N = 6 was considered. The frequency was selected to achieve results in a reasonable simulation time, taking into account the bandwidth of the Gaussian pulse following the established findings [
18]. The maximum element size
= 0.0017 m was taken for the meshing of the polymer domain.
Study and Solver: The model is computed for a time-dependent study of 1000 µs using the MUMPS (multifrontal massively parallel sparse) direct solver. To adequately resolve the propagation of an acoustic pulse in time, a minimum value of time step Δt is calculated by the following equation:
CFL is a dimensionless number; it can be interpreted as the fraction of an element the wave travels in a single time step. To minimise the error, the value of the
CFL number should be less than 0.2 for quadratic mesh elements [
19]. For the model,
CFL = 0.1 and a time step of
was considered to solve the model. Further, the elements used in the model are also described in previous work [
18].
3. Results from Simulations
3.1. Cylinderical Boundary
3.1.1. Description of the Model
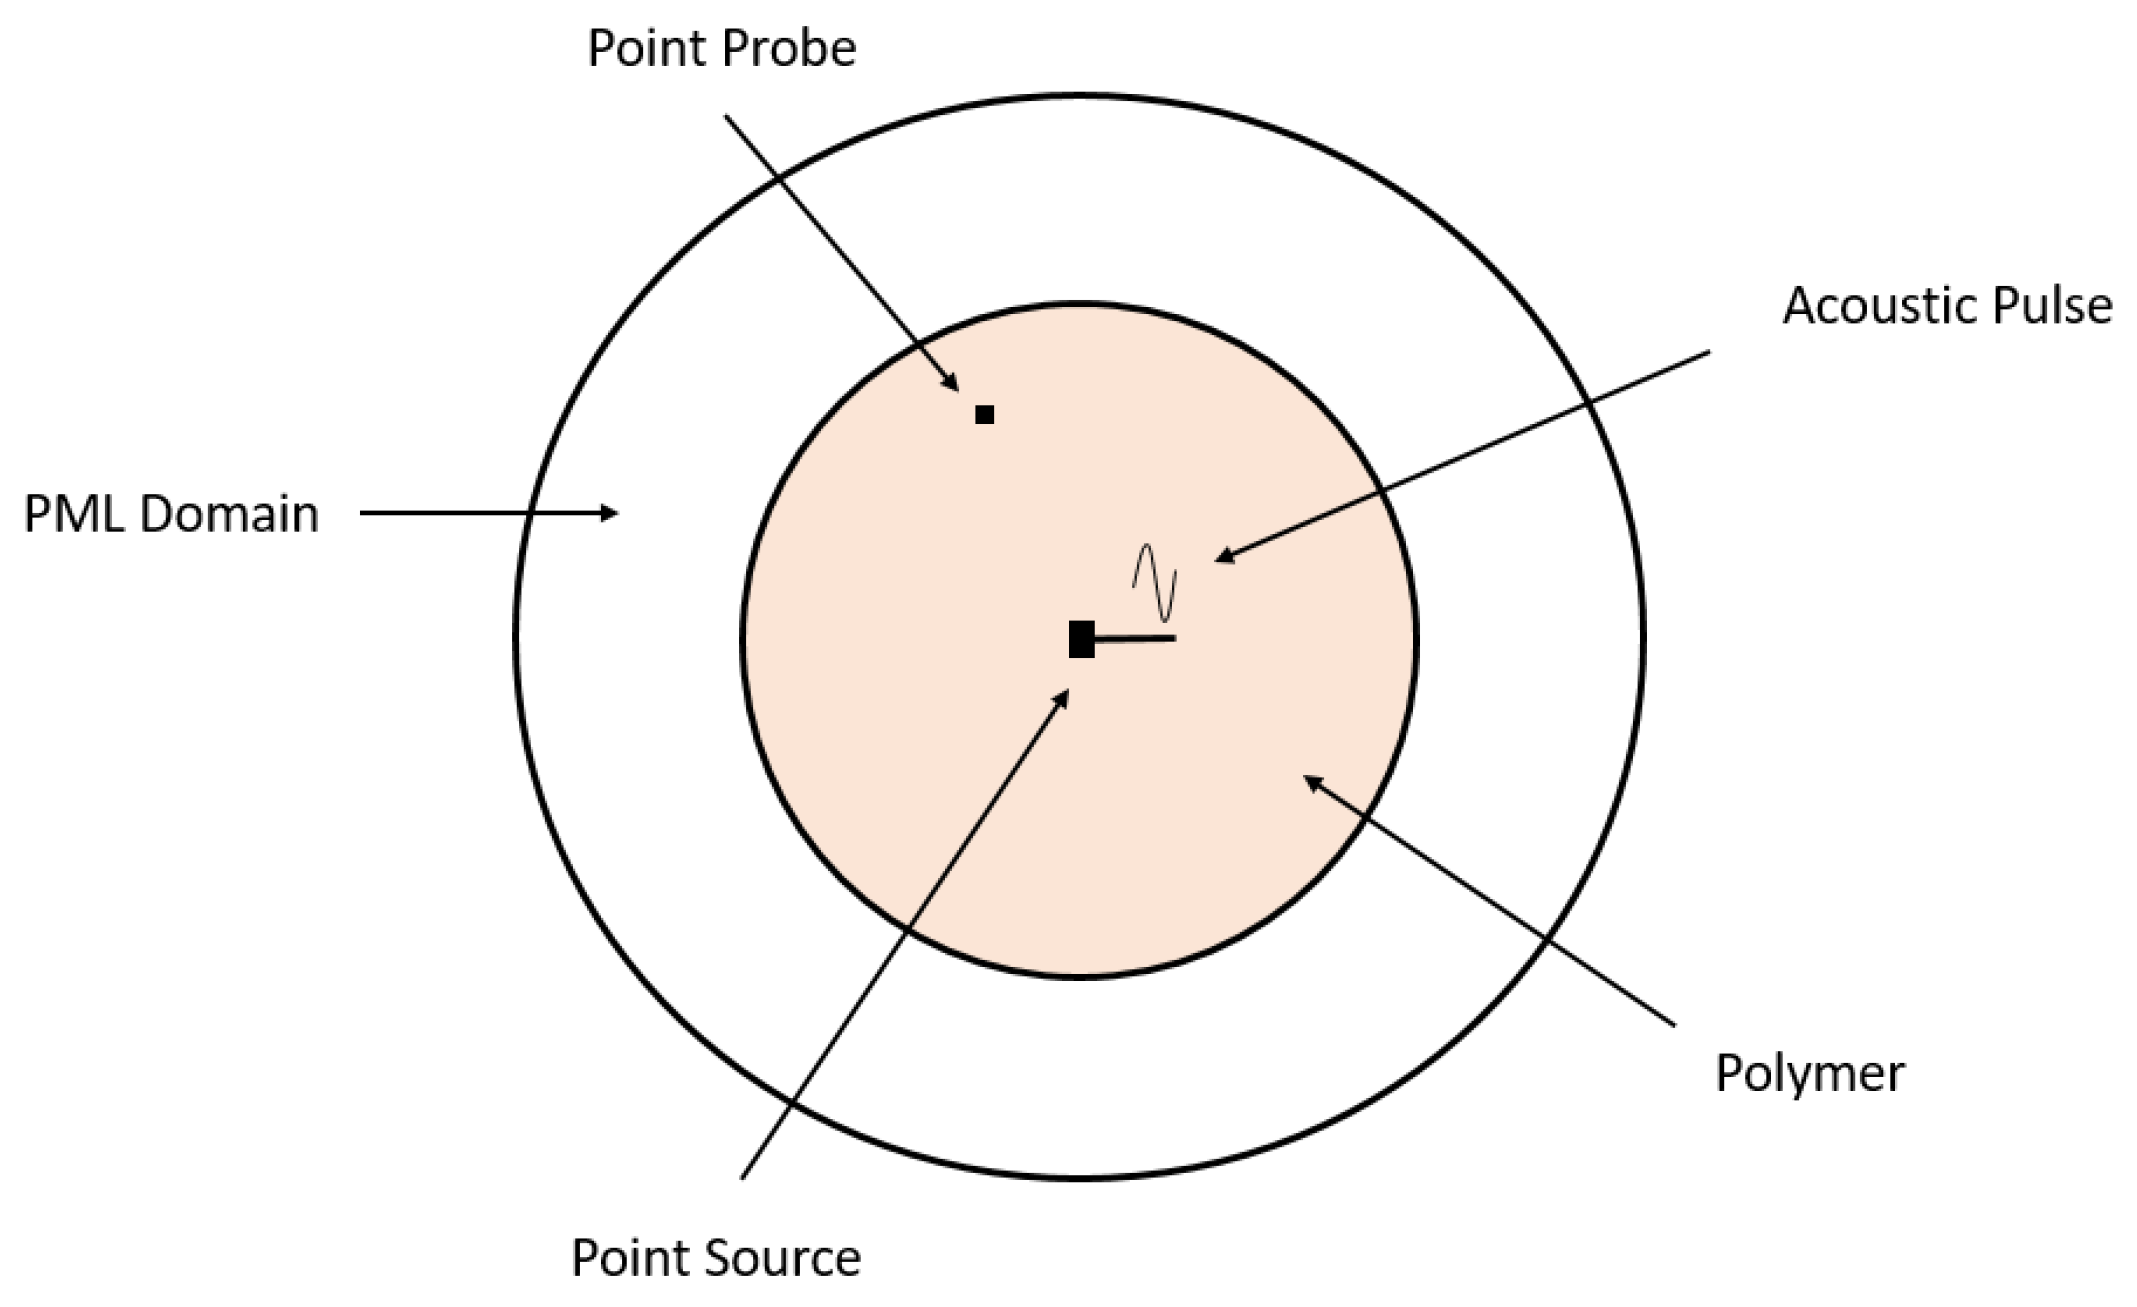
To analyse the propagation of an acoustic pulse, a cylinder with a length of 100 cm and a radius of 10 cm was modelled in COMSOL and surrounded by air. A point source located at a distance of 50 cm along the axial axis was considered. The point probe was used to observe the acoustic pulse at different points inside the geometry as shown in
Figure 3. The materials considered during the analysis and their characteristics are shown in
Table 2.
3.1.2. Results Obtained
The study analysed the propagation of acoustic pressure pulses generated by a point source in a cylindrical geometry at different points along the axial axis of the cylinder. The study observed that the reflections from the radial boundaries of the cylinder caused a shift in the shape and peak magnitude of the acoustic pulse. The extent of the shift in pulse shape and peak magnitude depended on the number of reflections.
Figure 4 depicts the propagation of an acoustic pulse within a cylindrical model, specifically in polyethylene and XLPE materials. Notably, both polymeric materials exhibited noticeable distortion in the pulse shape. Furthermore, it was observed that the degree of distortion increased with distance from the source, indicating a cumulative effect of multiple reflected pulses shaping the final pulse.
3.2. Modelling Role of Reflections
To gain deeper insights into the impacts of reflections on the propagating acoustic pulse, additional analysis was conducted using the MATLAB pulse propagation model. This computational approach allowed for a comprehensive exploration of the effects and behaviour of the pulse in the presence of reflections.
In this model, the following was assumed: (i) the rod is infinite in length with no reflections occurring at the end of the rod; (ii) the point of observation is assumed to lie on the axis of the rod; (iii) the material is linear and lossless; (iv) the pulses represent pressure; (v) the base unit for time is the microsecond; and (vi) the propagation velocity is constant.
Figure 5 shows a set of four possible paths for a pressure pulse to travel between the source ‘S’ and point of observation ‘P’.
The length of a path with n reflections can be expressed as follows:
The path length ‘
’ was defined for no reflection, and the remaining path lengths were calculated using Equation (10). Further, the sin of the angle
associated with the path with n reflections can be represented as follows:
To estimate the pressure after ‘
n’ reflections at point P, it was assumed that a pressure wave defined by the function
propagates along each path as follows:
where
is the propagation velocity of the pressure wave. The pressure wave normal to the cross-section of the rod associated with a path with
n reflections is given by the following:
If a reflection coefficient
is considered, the expression can be expressed as follows:
3.3. Pulse Set Up
A trapezoidal pulse was considered, and the following two parameters defined it: (i) the pulse is non-zero, and pulse width indicates the time in microseconds; and (ii) the maximum amplitude of the pulse is defined as the pulse ramp, which is the time taken for the pulse to transition between zero and one. The observation point ‘P’ away from the source was used to measure the pressure, and the distance was measured in metres. Further, the propagation speed was defined in m/µs, and the diameter of the rod was defined in meters. Moreover, the period of the simulation was defined in microseconds, and the path index was defined to observe the reflections. Further, an array was initiated to store the temporal behaviour of the pulse on each path. The temporal behaviour of all pulses was calculated at the point of observation. The sum of individual temporal behaviours was analysed, and the output was plotted in MATLAB.
The initial simulation of pulse propagation involved configuring the model to account for a single propagation path. Upon plotting the resulting pulse, it was observed that there were no effects on the shape of the pulse. Subsequently, the model was modified to simulate the pulse propagation through multiple paths, and the output was plotted again. The results are illustrated in
Figure 6. The MATLAB model showed that the shape, peak magnitude, and arrival time of an acoustic pulse are significantly affected by the number of propagation paths considered. Therefore, detecting and locating PD in high-voltage insulation materials using acoustic detection techniques, regardless of the material’s state (solid, liquid, or gas), is challenging without considering the effects of multiple propagation paths or reflection phenomena. Further, the characteristics of acoustic pulse propagation cannot be accurately analysed solely based on the results obtained from the COMSOL modelling. This is because the effects of the multiple path lengths and reflections need to be eliminated to obtain a clear understanding of the true nature of acoustic pulse propagation.
3.4. Perfect Matched Layer (PML)
The perfect matched layer (PML) is a common technique used to absorb outgoing waves in numerical simulations of wave propagation. In COMSOL, the PML can be built for a spherical or cylindrical geometry by defining an absorbing layer that surrounds the geometric region of interest. The layer absorbs the propagating waves before reaching the numerical boundaries of the simulation, reducing the reflections. The absorption properties can be adjusted by specifying the width of the PML. Therefore, to mitigate the effects of reflections on the propagating acoustic pulse in the above model, a PML was used in COMSOL Multiphysics. Unlike the frequency domain, the PML does not include any real stretching in the time domain and needs an adequate setting of the layers or geometric thickness to work as an absorbing boundary for the propagating acoustic pulse.
3.5. Model Geometry
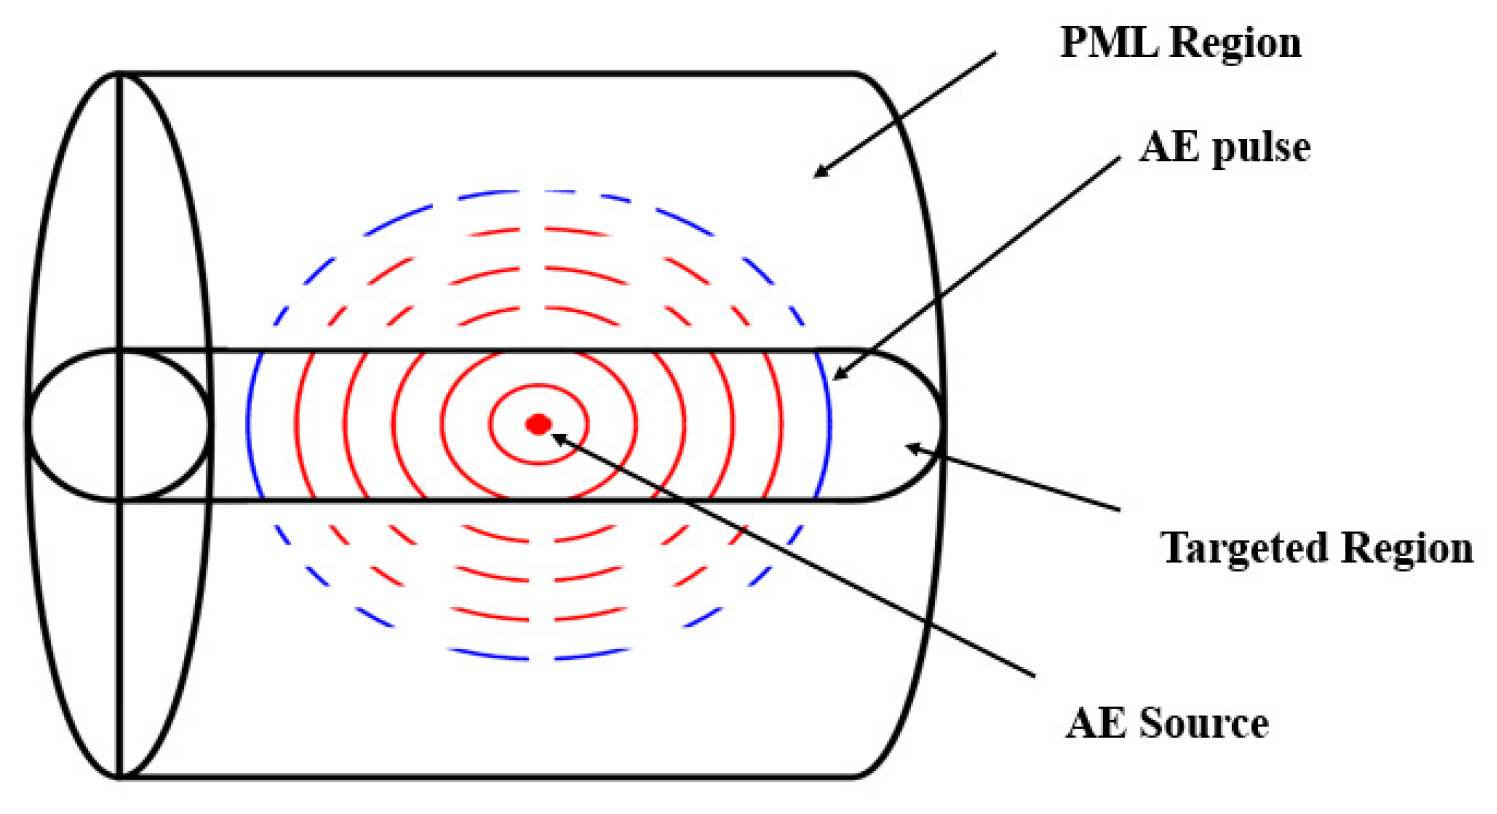
In time domain analysis, adding a PML for smaller geometries is challenging due to the absence of a real stretching component. In the case of cylinder geometry with a radial thickness much smaller than the length of the cylinder, implementing geometric thickness is critical. Therefore, to simplify the model, initially spherical geometry was used to analyse the performance of the PML, and the same approach was then used to implement the PML on cylindrical geometry as shown in
Figure 7.
The COMSOL model was run to observe the propagation of acoustic pulses after the implementation of PML. With the implementation of PML in the COMSOL simulation model, the distortion caused by reflections during the propagation of an acoustic pulse was mitigated. This resulted in an undistorted shape of the propagating pulse as compared with the model without PML.
Figure 8 shows the acoustic pulse detected at 40 cm away from the source in cylindrical model geometry using polyethylene and XLPE. It is to be noted that in addition to the shift in the shape of the acoustic pulse, there was also a noticeable damping in the pulse peak magnitude when observed without the presence of PML.
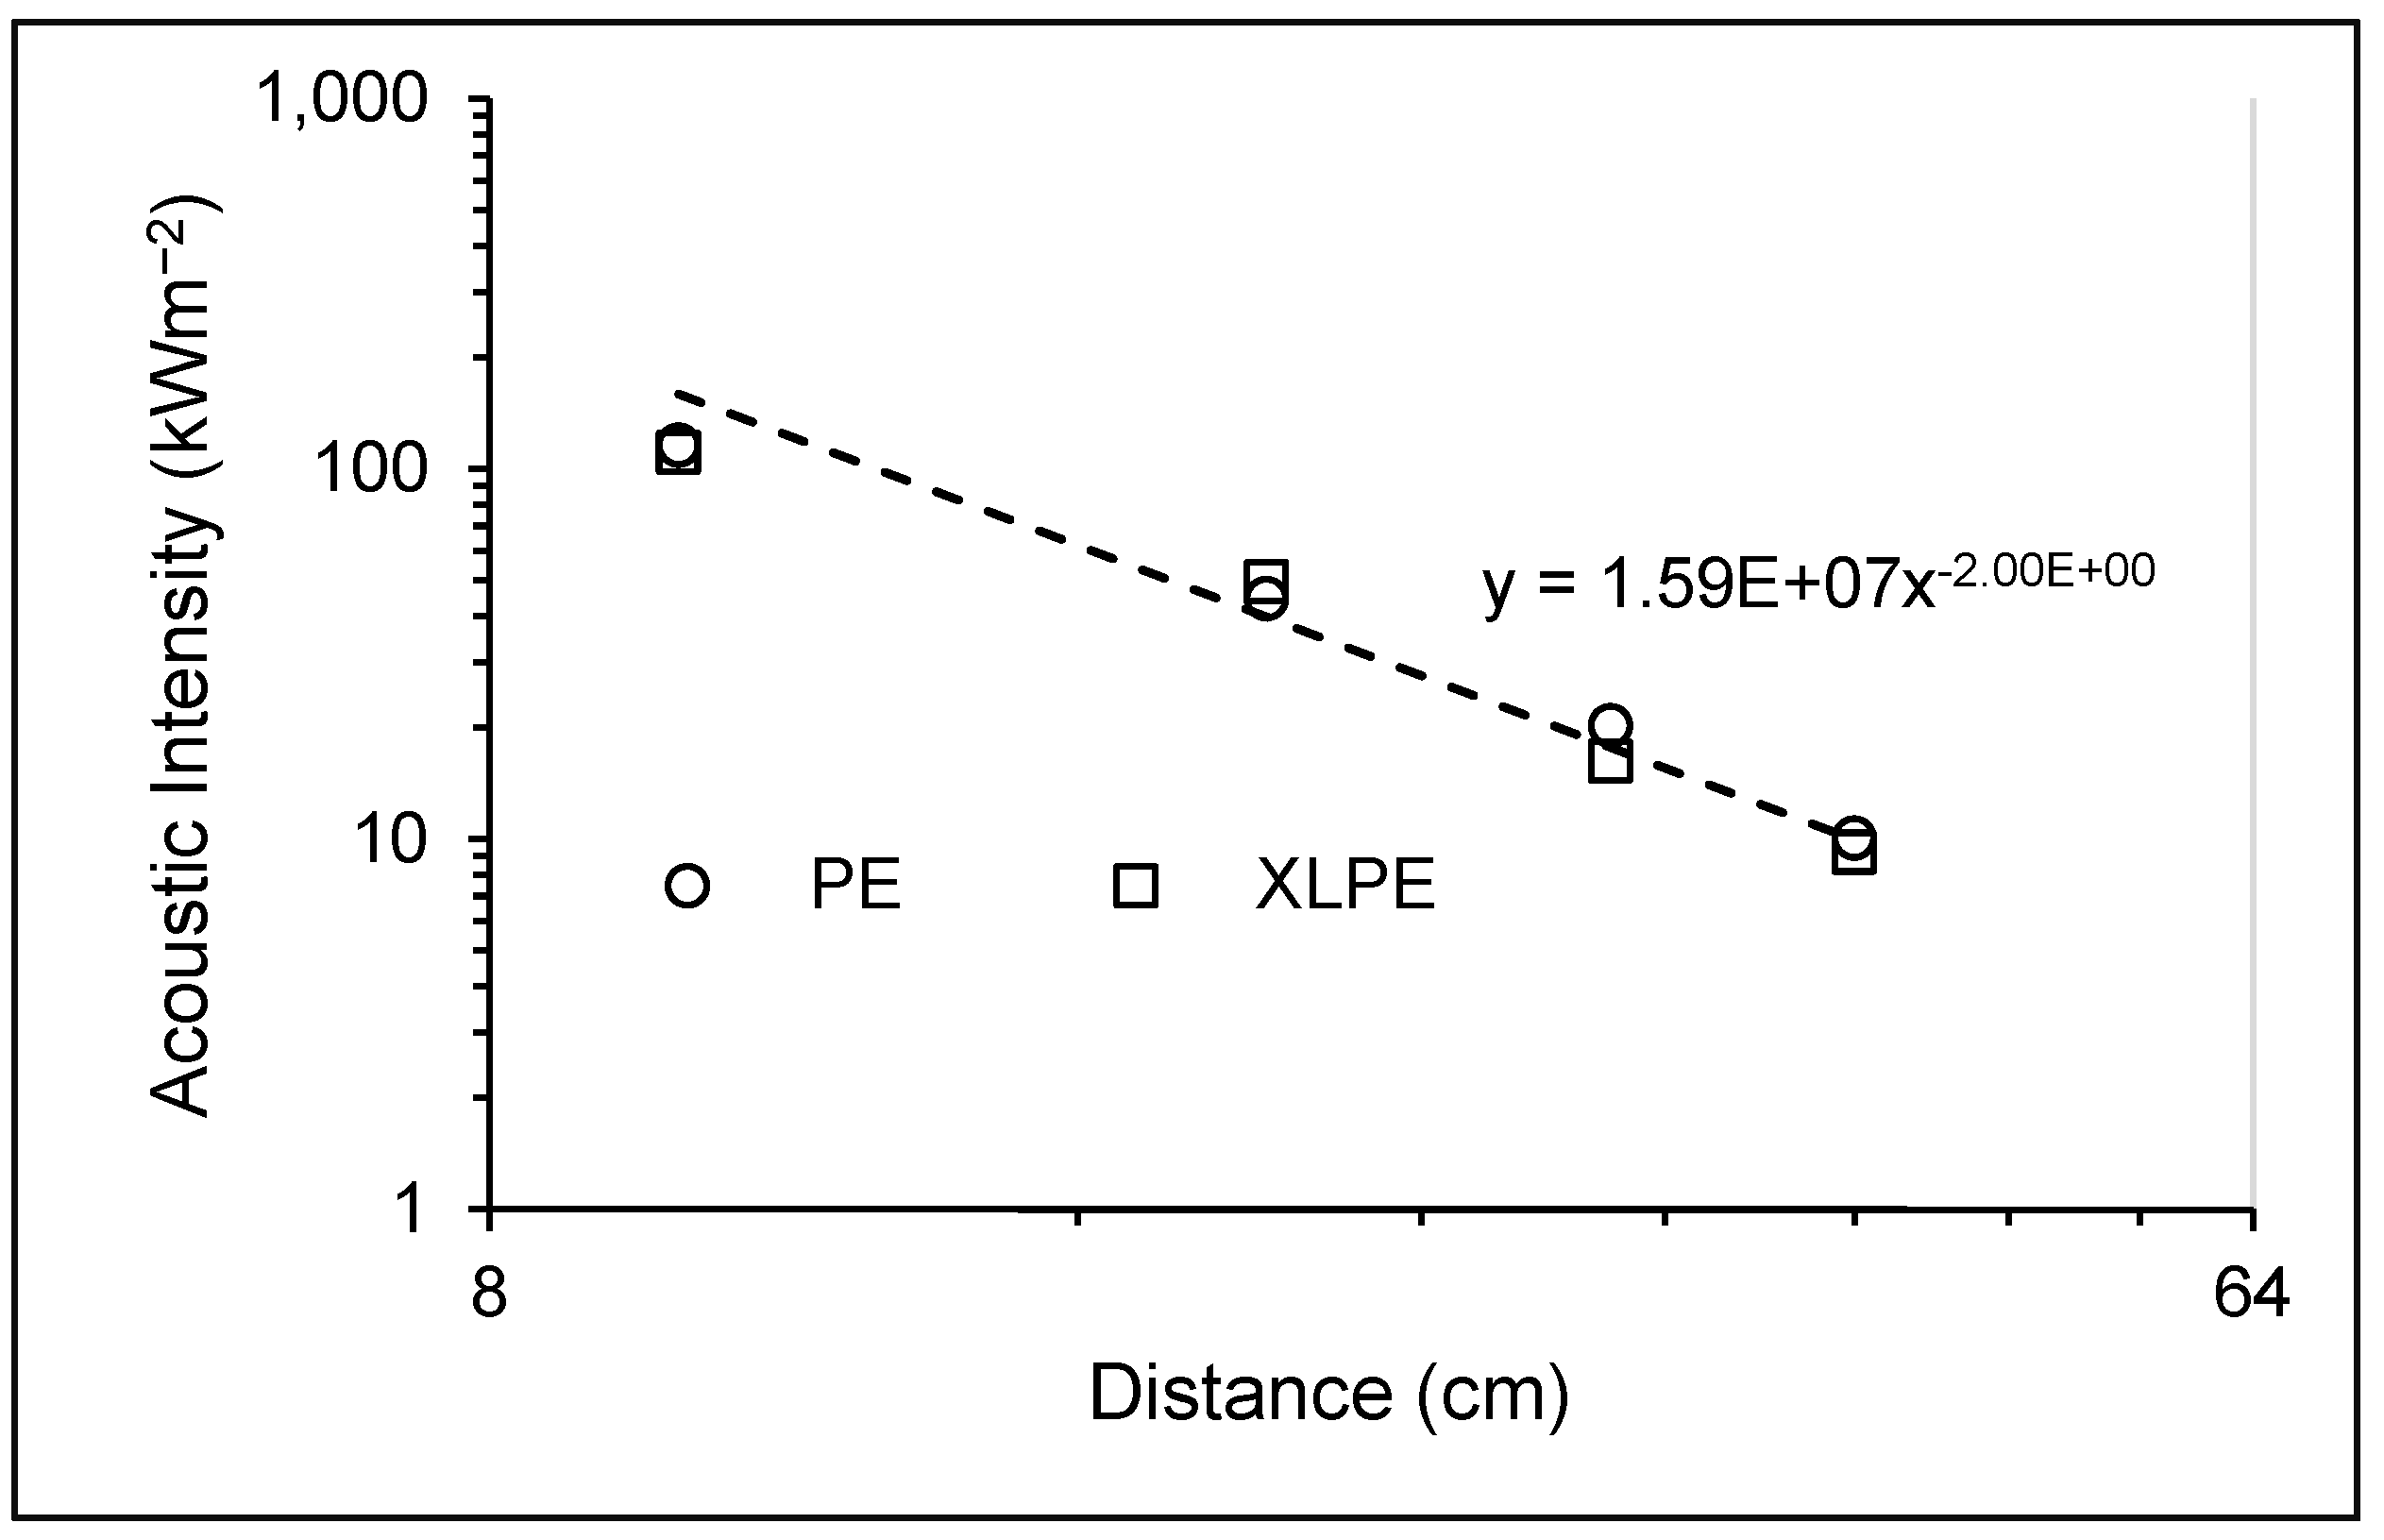
Further, the propagating acoustic pulse was analysed at different locations away from the source after the implementation of the PML to observe the drop in magnitude of the propagating acoustic pulse. It was observed that the magnitude of the propagating acoustic pulse decreases rapidly with distance, as shown in
Figure 9. This drop-in magnitude can be described by the inverse square law, where the decay is proportional to the square of the distance from the source.
4. Discussion
COMSOL Multiphysics was used for FEA modelling. Initially, it was used to model the propagation of an acoustic pulse without the PML, which resulted in a distorted pulse at the detector, as shown in
Figure 4. It was assumed that this distortion was due to reflections from the boundary of the cylinder in COMSOL. To further validate these assumptions, MATLAB was used to analyse the effects of reflections on the propagating acoustic wave in a cylinder, and the results from the MATLAB model, as shown in
Figure 6, endorsed our assumptions that the distortion in pulse shape detected at the detector in COMSOL is due to the reflections from the radial boundary of the cylinder. Therefore, to overcome the effects of reflections on the propagating acoustic pulse in the COMSOL Multiphysics model, PML was introduced around the radial boundary, and the propagation characteristics of the acoustic pulse were investigated without reflections. However, the distortion in pulse magnitude and shape in the COMSOL model is greater than in the MATLAB model. This could be due to the fact that the MATLAB model uses a very simple approach to the actual reflection coefficient at the boundary of the cylinder, while the COMSOL model considers the physical nature of the boundary. In addition, the MATLAB model does not consider some subtleties in the differences in the acoustic energy transmitted along the different path lengths.
The MATLAB simulation model revealed that multiple paths can also impact the arrival time of the acoustic pulse; a higher number of paths can cause a delay in the arrival time of the pulse. as shown in
Figure 6. This finding is significant in practical applications, particularly in locating the source of PD in transformer oil, where reflections and scattering can be high. In such scenarios, reflections or multiple paths can affect the arrival time of the pulse, which is used to estimate the location of the PD source. The quantified relationship between the number of paths and the delayed arrival time of the pulse can help improve the accuracy of locating the source of PD.
To further improve the accuracy of pulse detection, the implementation of PML in the acoustic pulse propagation model in COMSOL revealed that PML is effective in reducing reflections and preserving the amplitude of the propagating pulse. This is particularly crucial in scenarios with complex boundaries and geometries, which can cause significant interference and distortion without PML. The results revealed that the drop-in magnitude of the propagating pulse was high for both PE and XLPE, as shown in
Figure 8. The significant decay in magnitude is attributed to the interaction between the emitted spherical wave front from the source and the geometry of the system. As the wave front originates from the source along the axial direction, the radial boundary of the thin cylinder serves as an absorbing boundary, causing a rapid decrease in observed intensity with distance. The presence of PML along the radial boundary of the cylinder ensures that the spherical nature of the pulse is preserved within the cylindrical model. Consequently, the pulse propagates as a spherical wave front within the cylindrical geometry. The increasing radius of the spherical wave front leads to a reduction in the effective portion of the wave front observed within the cylinder, while a substantial portion is absorbed by the radial boundary, as shown in
Figure 10.
However, it is to be noted that the assumptions of constant acoustic properties of the materials and perfect uniform structures may not always hold in practical scenarios. Thus, future work can explore improving the pulse detection accuracy and develop more realistic and complex models that account for the variability of the materials and the impact of physical dimensions on the acoustic pulse characteristics.
Overall, the study’s findings have important implications for the practical detection of acoustic pulses in various materials, particularly for non-destructive testing and condition monitoring applications. Real cables will not have an equivalent of a PML, and this will impact the observed acoustic pulses. Depending on the acoustic properties of the layers of the cable adjacent to the insulation layer, reflections may occur, which will impact the pulse shape and magnitude. By accounting for the effects of reflections and multiple paths, more accurate detection techniques can be developed, leading to better maintenance and safety practices in various industries. The study’s approach of using a spherical model and later designing a cylindrical model can also be applied to more complex geometries in practical settings. Further investigations are necessary to analyse the presence of cavities or non-homogeneous characteristics within the material affecting the propagation of acoustic pulses.


