Article

Evaluating the Influence of Tool Material on the Performance of Refill Friction Stir Spot Welds in AA2029

1
Ira A Fulton School of Technology, Department of Manufacturing Engineering, Brigham Young University, 1060 N & E Campus Drive, Provo, UT 84604, USA
2
NASA Marshall Space Flight Center, Martin Rd. SW, Huntsville, AL 35808, USA
3
Spirit Aerosystems, 3420 S Oliver St., Wichita, KS 67210, USA
4
Bond Technologies, 1353 Wade Dr., Elkhart, IN 46514, USA
*
Author to whom correspondence should be addressed.
J. Manuf. Mater. Process. 2024, 8(3), 88; https://0-doi-org.brum.beds.ac.uk/10.3390/jmmp8030088
Submission received: 11 March 2024 / Revised: 20 April 2024 / Accepted: 22 April 2024 / Published: 27 April 2024

Abstract

:
Joining high strength 2xxx series aluminum is known to be complex and difficult; these alloys are traditionally considered non-weldable for fusion welding. This paper describes details on welding AA2029-T8 for skin-stiffened structures using refill friction stir spot welding (RFSSW). RFSSW is a solid-state process invented in the early 2000s that produces spot welds that are strong, lightweight, flush, and hermetic. Cycle times between 1 and 3 s are discussed, and process forces within a range of 8 to 14 kN are demonstrated. Furthermore, lap-shear quasi-static tensile strengths are shown to be between 10 kN and 12 kN in 9 mm diameter spots. A comparison of the performance of RFSSW welds made with various tool materials—which include H13 tool steel, tungsten carbide, and MP159—is detailed. Comparisons of parameters, weld consolidation, and heat-affected zones are presented with discussion related to heat generation specific to each tool material.

1. Introduction

Advanced high-strength aluminum alloys are in high demand in aerospace and automotive manufacturing because of their exceptional strength-to-weight ratio. Traditional joining methods include resistance spot welding (RSW) and self-piercing rivets (SPR), both of which come with limitations. RSW requires a high energy consumption and, in aluminum, creates joints that have porosity and cracking [1]; SPR adds weight and involves additional processing for a flush finish [2]. Solid-state joining, like friction stir welding (FSW), is energy-efficient and it can create lightweight, fully dense bonds in aluminum with a flash-free finish. For these reasons, it has enormous potential to be an effective method for joining advanced high-strength aluminum.
Refill friction stir spot welding (RFSSW) is a solid-state joining process invented in the early 2000s as a derivative of linear FSW [3]. The process is performed with a three-part non-consumable tool that consists of a clamp, a shoulder, and a probe, shown in Figure 1a. During the first stage of a typical weld, the toolset approaches the workpiece, and the non-rotating clamp applies a downward force. Then, the rotating shoulder plunges down into the material while the rotating probe simultaneously retracts upward; this syringe-like motion displaces a volume of material up into space left behind by the probe. In the final stage of the process, the probe and shoulder return to zero, which pushes that material back down and leaves a weld that is flat and ostensibly flush to the base material.
Since its invention, RFSSW has been developed with an eye towards replacing RSW and/or SPR in vehicle manufacturing. These applications demand fast cycle times and hard materials (like AA2xxx), both of which contribute to high process forces in RFSSW. In this high-stress environment, tools experience accelerated tool wear and, consequently, decreased tool life. Different tool materials have distinct issues when dealing with these demands.
Steels have been highly utilized as FSW and RFSSW tools, but they have been shown to have at least two particular limitations when it comes to tool life. The first is due to the fact that hardened steel tends to soften after enough time welding because of the high working temperatures. This, combined with the high shear forces, results in the tool wearing away, in both linear and spot applications. One investigation demonstrated that an uncoated steel wears significantly after only 200 m of welding in AA7075-T6 [4]. A study by Montag et al. showed how wear in an RFSSW toolset correlated with a decrease in weld surface quality [5]. And De Carvalho et al. recently published that an RFSSW H13 steel toolset wore away after fewer than 3000 welds in AA6061; welds at the end of its life were >2 kN weaker in lap-shear tensile strength than those at the beginning of its life. [6]. Therefore, wear on H13 tools will prove to be a problem for any high-volume application.
Furthermore, Larsen determined that, regardless of the overall life of an H13 tool, because aluminum and steel form intermetallic compounds (IMC) during welding, cleaning is a critical step that must happen every 70 or so welds [7]. Note that the chemical cleaning process involves disassembling the toolset and may take hours; it is rigorous enough to be prohibitive for any serious manufacturing environment. Thus, the usefulness of uncoated steel tools in aluminum spot applications is severely limited.
Ceramic metal compounds, called cermets, have also been under investigation for use in this application. One reason they are an attractive option is the fact that they do not significantly react with aluminum, copper, or stainless steel [8], so cleaning is valued but not a critical factor. However, although cermets are very hard, which is favorable for tool wear, they are also far more brittle and likely to fracture, especially when exposed to extreme thermal cycling and high tensile forces (as they are in RFSSW). Almoussawi saw that when peak temperatures exceeds a temperature threshold, the binder in tungsten-rhenium tools softens, which leads to failure [9]. This binder weakness has been observed in tungsten carbide (WC) with a cobalt binder as well [10]. Overall, cermets are desirable for wear resistance, but more research is necessary before they can be deemed reliable enough for sustained use in RFSSW.
Nickel- and cobalt-based alloys are another material category that has been useful as FSW tooling, particularly in aluminum, as they have high tensile strength, ductility, creep resistance, and corrosion resistance [11]. Furthermore, there is evidence to suggest that these alloys are less reactive with aluminum than steel is [12], which reduces concern about IMCs and the cleaning process described previously. Therefore, there may be a nickel–cobalt alloy that serves well as an RFSSW tool.
Considering the above, an investigation into the effect of tool material on weld quality will be useful in the search for a tool that will work for long-term performance applications. Although there have been investigations into tool longevity for steel tools [6,13] (or coated steels [14,15]), to date, there have been no studies that draw a line between tool material and weld properties. Thus, the aim of this study is to better understand the relationship between tool material and weld properties. Such an understanding will empower future researchers to better down-select tool material based on weld properties including process forces, ultimate lap-shear tensile strength (ULSS), and size of heat-affected zone (HAZ). The tool materials in question will include one from each of the categories previously discussed: a tool steel, H13; a cermet, WC; and a nickel-based alloy, MP159.

2. Materials and Methods

This work was executed entirely in aluminum alloy 2029-T8 (see Table 1) in a configuration with a 1.52 mm top coupon and a 2.54 mm bottom coupon. Welds were performed using the Bond Technologies RFSSW machine (shown in Figure 1c). Bond also developed the toolsets, an example of which can be seen in Figure 1b. All clamps were H13 tool steel, and the shoulder and probe were tested in H13, MP159, and WC. All spots were 9 mm in diameter, indicative of a tool shoulder with an outer diameter of 9 mm.
H13 was included in this study because the majority of weld development up until now has occurred using this material, so it may serve as a reference point for other studies. MP159 was selected for this study for its reported excellent tool wear resistance in linear FSW [16]. However, it is quite similar to H13 in key properties like hardness, tensile strength, and linear coefficient of thermal expansion (CTE), as seen in Table 2, so it may or may not perform better than H13 in an RFSSW application. WC, as shown in Table 2, is at least twice as hard as either of the other materials in this study, which is promising for tool life. The smaller CTE is also desirable, as it allows for smaller clearances at the probe/shoulder and shoulder/clamp interfaces. Additionally, if a coating becomes necessary (as has been indicated in the literature [14,15]), a low CTE may contribute to a longer life for the coating. WC’s clear weakness, though, is its tensile strength, at less than a fifth of that of H13. Moreover, being a brittle carbide, WC is at risk of a more catastrophic failure than ferrous-based materials. Therefore, although the tensile loads of this process are of a much smaller magnitude than the compressive loads, it has not yet been conclusively demonstrated that WC is capable of meeting the demands of the RFSSW process.
Development welds were performed on single-spot coupons, which were each 76.2 mm by 25.4 mm and were welded on a 25.4 mm square overlap, as seen in Figure 2a. Before welding, all surfaces were cleaned with isopropyl alcohol and then the interfacing surfaces were sanded with 80 grit sandpaper using an air-powered die grinder; this preparation happened no more than 24 h before welding.
For each tool material, a minimum of 30 coupons were pulled at a rate of 1 mm/min on an Instron model 4204 tensile tester between 100 and 1000 h after welding. This test yielded two pieces of data that indicate weld strength: ULSS and fracture mode. The nugget pullout fracture mode, which is when the weld nugget pulls out completely of the top coupon (as seen in Figure 2b with the nugget pulled out of the top coupon) signifies that the fused nugget is stronger than the heat-affected zone circumferential to the weld, which is highly desirable.
Microscopy and computed tomography scanning were valuable tools for validating consolidation. A Keyence VHX-7000 was utilized to assess polished cross-sections of the welds and to check for voids; if there were voids, the microscopy revealed their size and location, which was helpful in the process of eliminating them during initial process development. This optical microscopy also verified acceptable surface topography. Additionally, a Quantum GX micro-CT scanner was employed to confirm weld consolidation in three dimensions, rather than just in a single plane.
Further methods were applied to generate insight about weld temperature, including evaluation of the size of the heat-affected zone via microhardness testing and in situ temperature measurement using embedded thermocouples. Micro-indentation hardness testing was performed with the LECO LM 100AT on three welds (one for each tool material). Eighty-two indentations were made along the top coupon approximately 1 mm from the top of the weld. The top coupon was prioritized in these tests because all fractures occurred in the top coupon. The hardness at these points provided data about the size and magnitude of the heat-affected zone (HAZ) with respect to the welds’ particular tool material.
To capture in situ temperature data, a minimum of three additional welds per tool material were performed with embedded thermocouples. In these welds, five K-type thermocouples were embedded into the bottom coupon directly beneath the weld at five locations from the center to the perimeter, as seen in Figure 2b. This method supplied peak temperatures and time at temperature at five locations along the radius of the weld. These welds were only used to validate internal thermal temperature gradients, and not used for evaluating lap-shear tensile results.
A further issue that this team addressed is related to a gap in the literature on the friction properties of MP159. To address this, this team used a Paltro Unitest-500 tribometer with a pin-on-disk method to measure the coefficient of friction (CoF) of MP159 against two materials: AA2029 (as it relates to these welds) and 980 MPa steel (to better compare to friction data in the literature for WC and H13, which was measured against steels [22,23]). The MP159 pins were 32 mm in length and 6 mm in diameter with hemispherical ends. The pins rubbed 9 mm circles for 1000 cycles at 1.5 Hz at three force points: 100 N, 150 N, and 200 N. The tests occurred at room temperature.

3. Results and Discussion

3.1. Weld Programs

Welds in this study were developed with a cycle time of two seconds. Note that faster cycle times are possible in RFSSW [24,25], but they lead to commensurate increases in weld forces. These welds are already producing forces that approach the limits of this machine because of the material choice: AA2029-T8. Thus, a two-second cycle time was established as the target, considering a 15 kN operational force limit for the RFSSW end-effector shown in Figure 1c.
Welding for this study consists of three parts as shown in Figure 3a, with the plunge stage making up the first two parts of the code. For the first second (step time) of the 1.5 s plunge (sum of the step times for the first two steps of welding), the shoulder moves down, and the probe moves up at a rate that is proportional to one another. In the last 0.5 s of the plunge (second step of the weld program), the shoulder plunges down a further millimeter and the probe moves upward a millimeter; because the probe’s movements are measured relative to the shoulder position, this means that the probe is moving neither up nor down with respect to the weld material during this stage. During the plunge, the displaced material from the shoulder plunging into the material fills the shoulder’s inner cavity and pushes against the probe. When the probe slows with respect to the shoulder movement, this allows for the material to fill the shoulder cavity completely and build up pressure on the probe. In the final 0.5 s of the weld, the probe moves down faster than the shoulder moves up, meaning it refills the space quickly and fully. This method of plunging has been effective at preventing void formation in the deepest corners of the weld nugget, as has been further discussed elsewhere [26].
The three tool materials have two differences regarding parameterization (as highlighted in Figure 3a). First, the final step of the weld varies by a tenth of a millimeter or less. These variations ensure flatness, and they come from differences in stiffness and thermal expansion of the tool materials. Second, the WC program has a higher rotational velocity in the first two steps. WC has a low CoF, so, with respect to the two other tool materials, it generates less heat at the same rotational velocity. Therefore, welds made with WC at the lower rotational velocity demonstrated lower lap-shear strength—around 8.5 kN. Researchers and project sponsors determined that a comparison between equal lap-shear strengths was preferable over a comparison between equal parameters, and so the higher rotational velocity for the WC tools was selected for further analysis.

3.2. Material Properties of MP159

As CoF data for MP159 was not available in the literature, pin-on-disk tests were performed with both aluminum and steel at various loading conditions to assess the frictional properties of this tool material. The results of these friction tests are recorded in Figure 4. Values were averaged across 1000 cycles for each of three loads for both AA2029 and 980 MPa steel. Notice that, while CoF values for loads at 100 N were of a higher magnitude than those at 150 N and 200 N, CoF values for the higher loads are within 3%. This suggests that after some initial loading, the CoF magnitude becomes less sensitive to additional loading. Table 3 contains the CoF values for each of the tool materials in this study with respect to steel to better compare to the friction coefficients shown in Figure 4, with CoF values found in the literature for WC and H13, which were also measured against steel.
An important note regarding Table 3: at the time of publication, this team was not able to acquire data about the thermal conductivity of MP159, and such data was also not available in the literature. However, the thermal conductivity of MP159’s sister alloy, MP35N, is recorded in the literature. The chemical makeup of these two alloys is similar enough that this paper will assume that the thermal conductivity of the two are comparable.

3.3. Weld Properties

Evaluation of welds made with each tool material were demonstrated to be void-free, meaning that all three tool materials are capable of making fully consolidated welds. Figure 3 shows examples of void-free welds made of all three tool materials. These unetched, optical cross sections were primarily used for determining if welds were void free. Consolidation was also verified using CT scans, an example of which is seen in Figure 3b. This indicates that each tool material can effectively and robustly join AA2029 to AA2029 in the specified thickness combination. An additional optical cross section is presented in Figure 5, which was polished and subsequently etched with Keller’s reagent for the sake of identifying the size and shape of the various weld microstructures. The HAX, thermos-mechanical affected zone and weld nugget are highlighted in Figure 5 to show the relative size of each zone within a weld cross-section. In order to see the complete size of the HAZ, the right side of the image is the center of the weld nugget and shows half (4.5 mm) of the total diameter of the nugget. As RFSSW is an axially symmetric process, the overall presentation of half the weld with respect to the HAZ can be assumed to be fairly uniform radially in all directions from the center of the weld nugget. Optically, the HAZ is shown to extend more than 6 mm beyond the edge of stir zone for a weld made with H13.
The results from the lap-shear tensile tests of these welds are notated in Figure 6a. All lap-shear tensile tests resulted in nugget-pullout failure mode (as shown in Figure 2b). However, while the WC and H13 ultimate lap-shear strengths are very comparable, that of MP159 is approximately 7% lower, on average. This is consistent, albeit an inverse relationship, with the shoulder compressive peak loads, as seen in Figure 6b. Again, WC and H13 are comparable, but MP159 stands out with approximately 5–7% higher loads. Shoulder compressive loads are experienced during the plunge of the shoulder into the workpiece, while shoulder tensile loads are associated with the shoulder pulling from the material. The opposite is true for probe forces, where tensile loads are experienced during the plunge step when the probe pulls away from the material, and probe compressive forces are experienced as a result of the probe forcing the material back to weld.
In evaluating the differences between shoulder forces during the plunge phase, it is possible that the lower CoF of MP159 contributed to the overall increase in peak shoulder compressive forces. These forces are directly related to heat generation in the weld. While the reduced thermal conductivity of MP159 may aid in retaining heat during this phase of welding, the CoF being less than H13 is likely the reason for increased forces with respect to welds made with H13. Note that while WC has an even lower CoF than MP159, all welds made with the WC tool rotated at a higher RPM than the other two tool materials, which compensated for this difference in available heat generation based on friction.
Figure 6 also enables a comparison of peak tensile and compressive forces for the shoulder and the probe during welding. Note that there are no significant differences between the probe compressive peak forces or the shoulder tensile peak forces from all welds made from all three tool materials. This seems to indicate that the CoF of these tool materials does not play a measurable role when pulling the tool from hot aluminum. However, a notably higher probe tensile peak force is shown for welds made with H13, which may be attributed to H13’s high CoF, as noted in Table 3. The probe tensile forces are generated as a result of the probe moving inside the shoulder, so these forces are directly related to the frictional response between the shoulder and probe interface rather than an interaction with the weld material. There is no evidence that suggests the higher probe tensile load influences weld properties; such an influence would be unlikely, as this peak occurs during the plunge phase of the weld when the probe is not significantly interacting with the material.

3.4. Weld Temperatures

Temperature is a key factor in understanding the weld quality of a RFSSW. With precipitation-hardened alloys, like AA2029, peak temperatures of ~350 °C or above have been shown to have the most negative impact on weld strength. Furthermore, time at or above this temperature only exacerbates this issue [28,29,30]. Thus, temperature data is critical for understanding the effects of tool material on weld strength.
Figure 7 contains in situ temperature data for five thermocouples in a weld made with a WC tool. The weld begins around 180 ms and ends around 2300 ms. Temperature measurement was achieved by using in situ thermocouples according to the layout in Figure 2b. The thermocouples are embedded into the top of the lower sheet, such that when a RFSSW is complete they are part of the weld as shown in Figure 2d. All five thermocouples pass the 350 °C threshold, but the thermocouples closest to the center (TC1 in Figure 7) of the weld reach higher peaks and stay at temperature for more time.
To compare this data more efficiently between the tool materials, Figure 8a shows the peak temperatures of all five thermocouples averaged together for each tool material and Figure 8b shows the total time at temperature of the five thermocouples averaged for each tool material. Again, MP159 stands out with the highest peak in both categories.
As discussed earlier, MP159 tools experience disproportionately higher compressive forces during welding because of the lower friction coefficient. Ironically, the lack of ability to generate heat with friction enables a greater ability to generate heat with deformation, which is why we see the highest peak temperatures with MP159 tools. WC has the second highest peak temperatures, which may be explained by the higher RPM.
This increased heat generation is exacerbated by the low thermal conductivity of MP159 (see Table 3). After producing heat, MP159 cannot effectively conduct it away and the heat dissipates within the weld specimen. A higher peak temperature and more time above 350 °C leads to a reduction of strength in the HAZ circumferential to the weld, which leads to lower tensile strengths in the MP159 welds. Comparatively, WC generates higher peak temperatures than H13, but it does not spend more time at temperature than H13; this can be attributed to the difference in thermal conductivity, which is 2–3 times larger in WC than in H13. This is the key to why WC and H13 tools produce welds with comparable strengths, and MP159 tools produce welds with lower lap-shear tensile strength.
Microhardness graphs were also produced as a means of further understanding the influence of heat on these welds. Figure 9 shows a comparison of the microhardness of welds made with the three tool materials. WC has the highest hardness values and the quickest recovery back to base material hardness. Measured as indicated in Figure 9, the WC HAZ is about 15 mm in diameter, but the HAZ of the other two welds never recover up to base material hardness of ~145 HV within the measure distance of 25 mm. The HAZ for a weld made with an H13 tool may be evaluated from the optical cross-section shown in Figure 5, where evaluation shows the HAZ to be approximately 30 mm in diameter. WC’s smaller HAZ can be explained by WC’s high thermal conductivity having a quenching effect on the weld. Furthermore, MP159’s HAZ is the softest, particularly at the edge of the shoulder (as outlined), which is where all the fractures occurred. Therefore, the heat generation, and subsequent inability to wick heat into the tool, in MP159 welds results in the largest HAZ in this study, both in terms of width and depth.
A further question arises upon comparison of Figure 9 and Figure 6a: why does WC exhibit the highest microhardness but not the highest lap-shear tensile strengths? One possible explanation is regarding the depth of the notch left behind by the toolset, called the tamp. Figure 10 illustrates a measurement taken of a selection of welds and shows that WC welds have the deepest tamp. This corresponds to a top coupon that is effectively 3–6% thinner than that of welds with the other tool materials. Although a direct link between the microhardness results may imply that WC welds should exhibit the strongest lap-shear tensile results, this reduction in the thickness of the top coupon may be compromising tensile strength. Removing the need for tamping could potentially enhance WC’s tensile results to align more directly with the microhardness results.
The tamp exists in RFSSW because material is lost during welding, either by adhering to the tool or extruding as flash. This material loss is limited to what can fit in the tolerance gaps between the clamp and the shoulder (nominally 0.185 mm) and between the shoulder and the probe (nominally 0.1 mm). This gap can widen as the tools wear and lead to a commensurate increase in flash, particularly in the configuration with a WC shoulder and an H13 clamp. Material loss during welding increases the likelihood of void formation, and a tamp helps to counteract that. Alternatively, this material loss may be mitigated by adding material prior to welding, as precedented in other research [31].

4. Conclusions

This work has examined the influence of tool material on RFSSW quality in AA2029, with specific evaluation of H13 steel, MP159, and tungsten carbide (WC). All tool materials created welds at 2 s cycle times, producing forces between 8–10 kN. All tool materials produced welds with lap-shear tensile strengths ranging from 9 to 11 kN. Specific details on differences in parameterization and heat generation were discussed herein.
Based on the evaluation herein, the two main tool properties that affect weld quality are coefficient of friction and thermal conductivity of the tool material. In this study, the influence of material properties of the tools demonstrated an influence on the ability to generate and transfer heat within the overall process. A lower CoF of the tool material did not necessarily correlate with heat generation, as MP159 tools demonstrated higher peak temperatures than H13 tool even while maintaining a lower CoF. An increase in thermal conductivity of tool materials directly correlated with an increased time above critical temperatures that ultimately impacted the size or magnitude of the HAZ in RFSSW. Parametrization also influences the degree to which these material properties affect weld properties, as evidenced by the comparison in heat generation between H13 and WC tools.
Specific conclusions that can now be drawn include:
  • All three materials, H13, WC, and MP159, are suitable for creating fully consolidated refill friction stir spot welds.
  • MP159 tools generate more heat than either WC or H13 tools and insulate the welds with a lower thermal conductivity. Combined these thermal effects lead to weaker lap-shear tensile strengths in welds produced with MP159.
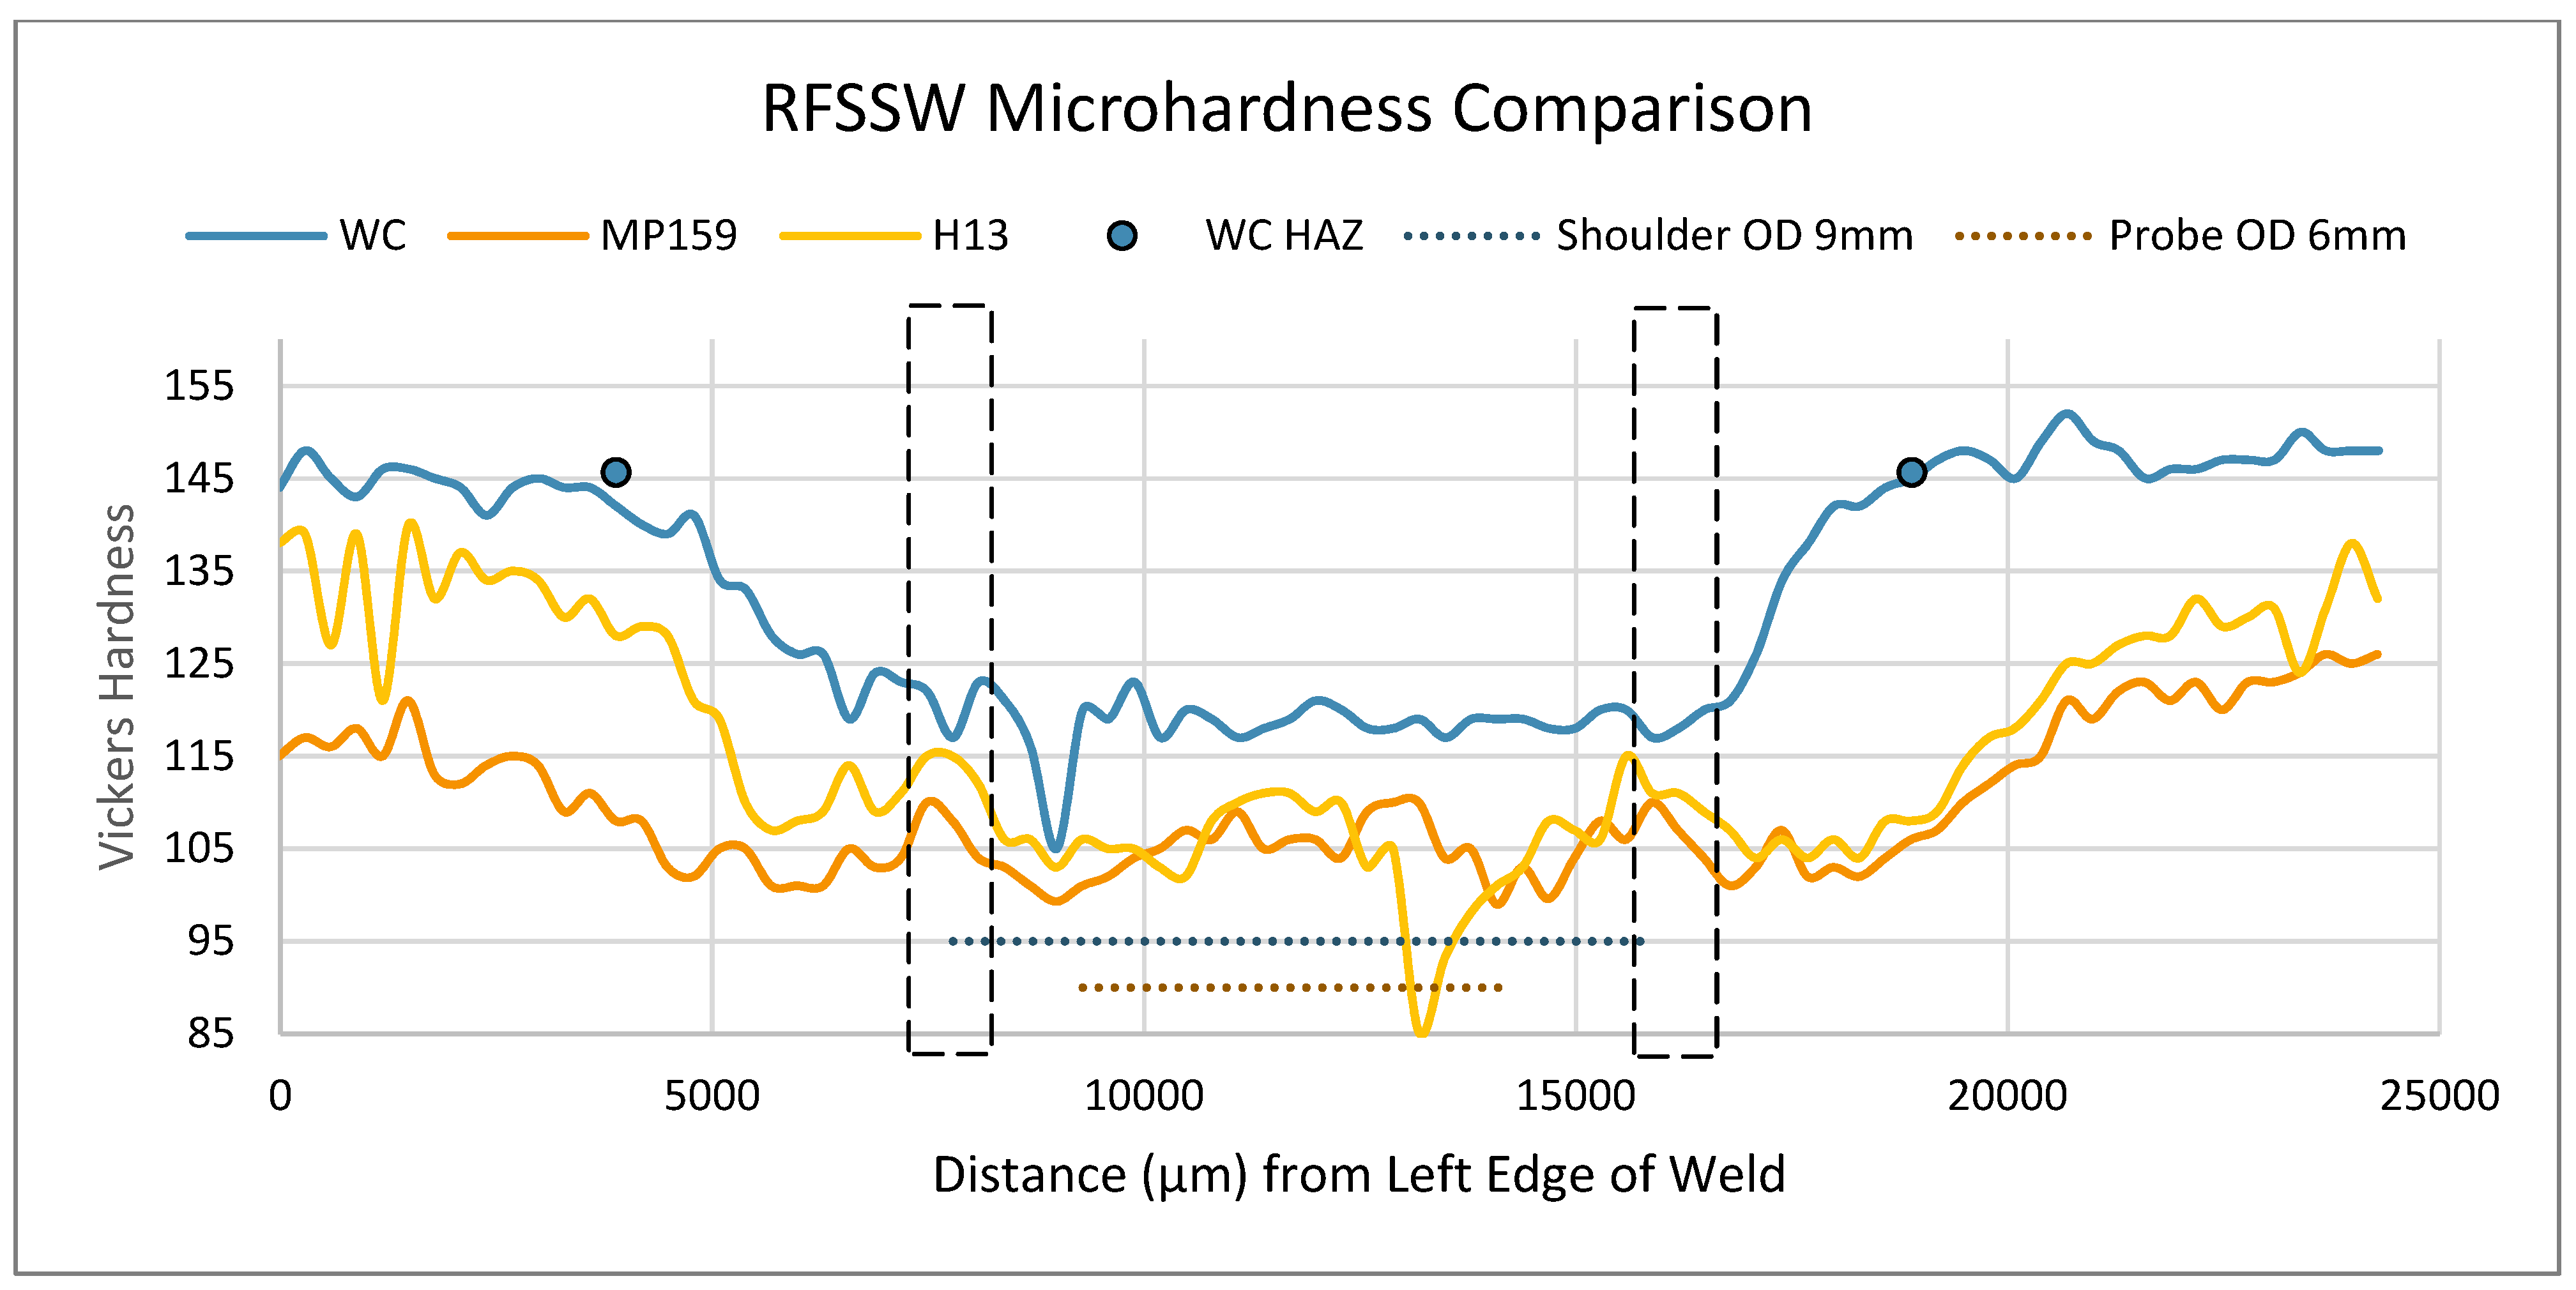
  • WC’s relatively high thermal conductivity results in welds having the smallest HAZ, with the fastest recovery to base material strength and the overall highest HAZ minimum microhardness value, with respect to MP159 and H13.
  • Lap-shear tensile strengths of RFSSW may be compromised by tamping as the effective thickness of the top sheet is reduced.
Researchers will look next to defining the performance of a WC toolset across its lifetime; this work is ongoing at the time of publication. Other work that this study will stimulate may include studies of lifetime performance of H13 and MP159 in 2xxx aluminum, as well as investigations into the relationship between various coatings and weld properties. Furthermore, analysis of dynamic testing for these tool materials and others will also be of interest for future researchers.

Author Contributions

Conceptualization, R.B. and Y.H.; methodology, R.B., Y.H., P.B., T.S., J.B., J.C. and H.M.; software, Y.H. and J.B.; validation, R.B., P.B. and T.S.; formal analysis, R.B.; investigation, R.B. and T.S.; resources, J.B., J.C. and H.M.; data curation, R.B. and Y.H.; writing—original draft preparation, R.B.; writing—review and editing, R.B., P.B. and Y.H.; visualization, R.B. and P.B.; supervision, Y.H.; project administration, Y.H.; funding acquisition, Y.H. All authors have read and agreed to the published version of the manuscript.

Funding

This research was funded by the NSF IUCRC—Center for Friction Stir Processing under account R0602623 through Brigham Young University Friction Stir Research Lab.

Data Availability Statement

Data is contained within the article.

Conflicts of Interest

The authors declare no conflicts of interest. The funders had no role in the design of the study; in the collection, analyses, or interpretation of data; in the writing of the manuscript; or in the decision to publish the results.

References

  1. Doshi, S.; Gohil, A.; Mehta, N.; Vaghasiya, S.R. Challenges in Fusion Welding of Al alloy for Body in White. Mater. Today Proc. 2018, 5, 6370–6375. [Google Scholar] [CrossRef]
  2. Mallick, P.K. 8—Joining for lightweight vehicles. In Materials, Design and Manufacturing for Lightweight Vehicles; Mallick, P.K., Ed.; Woodhead Publishing: Sawston, UK, 2010; pp. 275–308. [Google Scholar]
  3. Christoph, S.; dos Santos, J. Method and Device for Joining at Least Two Adjoining Work Pieces by Friction Welding. U.S. Patent 6,722,556B2, 20 April 2004. [Google Scholar]
  4. Lacki, P.; Więckowski, W.; Luty, G.; Wieczorek, P.; Motyka, M. Evaluation of Usefulness of AlCrN Coatings for Increased Life of Tools Used in Friction Stir Welding (FSW) of Sheet Aluminum Alloy. Materials 2020, 13, 4124. [Google Scholar] [CrossRef] [PubMed]
  5. Montag, T.; Wulfsberg, J.-P.; Hameister, H.; Marschner, R. Influence of Tool Wear on Quality Criteria for Refill Friction Stir Spot Welding (RFSSW) Process. Procedia CIRP 2014, 24, 108–113. [Google Scholar] [CrossRef]
  6. De Carvalho, W.S.; Vioreanu, M.C.; Lutz, M.R.A.; Cipriano, G.P.; Amancio-Filho, S.T. The Influence of Tool Wear on the Mechanical Performance of AA6061-T6 Refill Friction Stir Spot Welds. Materials 2021, 14, 7252. [Google Scholar] [CrossRef] [PubMed]
  7. Larsen, B.; Hunt, J.; Hovanski, Y. Investigating steel tool life in the RFSSW process. J. Manuf. Process. 2020, 58, 637–645. [Google Scholar] [CrossRef]
  8. Kolnes, M.; Kübarsepp, J.; Sergejev, F.; Kolnes, M.; Tarraste, M.; Viljus, M. Performance of Ceramic-Metal Composites as Potential Tool Materials for Friction Stir Welding of Aluminium, Copper and Stainless Steel. Materials 2020, 13, 1994. [Google Scholar] [CrossRef] [PubMed]
  9. Almoussawi, M.; Smith, A.J. Thermo-Mechanical Effect on Poly Crystalline Boron Nitride Tool Life During Friction Stir Welding (Dwell Period). Met. Mater. Int. 2018, 24, 560–575. [Google Scholar] [CrossRef]
  10. Choi, D.H.; Lee, C.Y.; Ahn, B.W.; Choi, J.H.; Yeon, Y.M.; Song, K.; Park, H.S.; Kim, Y.J.; Yoo, C.D.; Jung, S.B. Frictional wear evaluation of WC–Co alloy tool in friction stir spot welding of low carbon steel plates. Int. J. Refract. Met. Hard Mater. 2009, 27, 931–936. [Google Scholar] [CrossRef]
  11. Mishra, R.; Mahoney, M.W. Friction Stir Welding and Processing; Springer: Cham, Switzerland, 2007. [Google Scholar]
  12. Collier, C.T. Tool Material Degradation due to Friction Stir Welding of Aluminum Alloys. Master’s Thesis, University of South Carolina, Columbia, SC, USA, 2015. [Google Scholar]
  13. De Castro, C.C.; Shen, J.; Plaine, A.H.; Suhuddin, U.F.H.; De Alcantara, N.G.; Dos Santos, J.F.; Klusemann, B. Tool wear mechanisms and effects on refill friction stir spot welding of AA2198-T8 sheets. J. Mater. Res. Technol. 2022, 20, 857–866. [Google Scholar] [CrossRef]
  14. Lauterbach, D.; Keil, D.; Harms, A.; Schulze, M.; Dilger, K. Influence of Tool Wear on Weld Quality in Refill Friction Stir Spot Welding of Aluminium. In 2nd International Conference on Advanced Joining Processes (AJP 2021); Springer International Publishing: Cham, Switzerland, 2022; pp. 57–69. [Google Scholar]
  15. Lauterbach, D.; Keil, D.; Harms, A.; Leupold, C.; Dilger, K. Tool wear behaviour and the influence of wear-resistant coatings during refill friction stir spot welding of aluminium alloys. Weld. World 2021, 65, 243–250. [Google Scholar] [CrossRef]
  16. Zhang, Y.N.; Cao, X.; Larose, S.; Wanjara, P. Review of tools for friction stir welding and processing. Can. Metall. Q. 2012, 51, 250–261. [Google Scholar] [CrossRef]
  17. MatWeb Material Property Database. Available online: https://www..matweb.com/index.aspx (accessed on 15 November 2023).
  18. AZoMaterials. Tungsten Carbide—An Overview. Available online: https://www.azom.com/properties.aspx?ArticleID=1203 (accessed on 15 November 2023).
  19. Materials, A. Alloy MP159 (AMS 5841). Available online: https://www.aircraftmaterials.com/data/nickel/mp159.html (accessed on 15 November 2023).
  20. Cobalt MP159. Available online: https://www.techsteel.net/alloy/cobalt/mp159 (accessed on 15 November 2023).
  21. Steels, V. H13 Steel. Available online: https://www.viratsteels.com/h13.html (accessed on 15 November 2023).
  22. Hua, H.; Zhou, Y.; Li, X.; Zhang, Q.; Cui, X.; Wang, S. Variation of wear behavior of H13 steel sliding against different-hardness counterfaces. Proc. Inst. Mech. Eng. Part. J. J. Eng. Tribol. 2015, 229, 763–770. [Google Scholar] [CrossRef]
  23. Vilhena, L.; Domingues, B.; Fernandes, C.; Senos, A.; Ramalho, A. Mechanical and Tribological Characterization of WC-Co and WC-AISI 304 Composites by a Newly Developed Equipment. Materials 2022, 15, 1187. [Google Scholar] [CrossRef] [PubMed]
  24. Larsen, B.; Hovanski, Y. Reducing Cycle Times of Refill Friction Stir Spot Welding in Automotive Aluminum Alloys; SAE Technical Paper; SAE International: Warrendale, PA, USA, 2020. [Google Scholar]
  25. Berger, E. RFSSW Behavior Prediction Using a Numerical Model. Master’s Thesis, Brigham Young University, Provo, UT, USA, 2023. [Google Scholar]
  26. Berger, E.; Miles, M.; Curtis, A.; Blackhurst, P.; Hovanski, Y. 2D Axisymmetric Modeling of Refill Friction Stir Spot Welding and Experimental Validation. J. Manuf. Mater. Process. 2022, 6, 89. [Google Scholar] [CrossRef]
  27. Chen, K.; Xiao, W.; Li, Z.; Wu, J.; Hong, K.; Ruan, X. Effect of Graphene and Carbon Nanotubes on the Thermal Conductivity of WC–Co Cemented Carbide. Metals 2019, 9, 377. [Google Scholar] [CrossRef]
  28. Upadhyay, P.; Reynolds, A.P. Effects of thermal boundary conditions in friction stir welded AA7050-T7 sheets. Mater. Sci. Eng. A 2010, 527, 1537–1543. [Google Scholar] [CrossRef]
  29. Upadhyay, P.; Reynolds, A.P. Effects of forge axis force and backing plate thermal diffusivity on FSW of AA6056. Mater. Sci. Eng. A 2012, 558, 394–402. [Google Scholar] [CrossRef]
  30. Reynolds, A.P.; Tang, W.; Khandkar, Z.; Khan, J.A.; Lindner, K. Relationships between weld parameters, hardness distribution and temperature history in alloy 7050 friction stir welds. Sci. Technol. Weld. Join. 2005, 10, 190–199. [Google Scholar] [CrossRef]
  31. Berger, E.; Miles, M.; Blackhurst, P.; Belnap, R.; Hovanski, Y. 2D Axisymmetric Modeling of RFSSW Repair and Experimental Validation. In Proceedings of the Friction Stir Welding and Processing XII, San Diego, CA, USA, 19–23 March 2023; Springer: Cham, Switzerland, 2023; pp. 127–137. [Google Scholar]
Figure 1. (a) Schematic of the RFSSW toolset, with a blue probe, red shoulder, and grey clamp, and RFSSW process: Phase A depicts clamping, B is plunging, and C is refilling. (b) example of a Bond RFSSW toolset: from left to right is the probe, the shoulder, and the clamp; (c) bond RFSSW machine.
Jmmp 08 00088 g001
Figure 2. (a) Geometry of a single-spot coupon; (b) diagram of placement of the thermocouples from the center of the weld to the circumference, labeled 1–5; (c) nugget pullout failure mode; (d) embedded thermocouples after welding.
Jmmp 08 00088 g002
Figure 3. (a) Weld programs for WC, MP159, and H13 with boxes indicating the differences among them; (b) example of a CT scan of a weld sample; (ce) void-free cross-sections of welds made with WC, MP159, and H13, respectively.
Jmmp 08 00088 g003
Figure 4. Coefficient of friction of MP159 on AA2029 and 980 MPa steel at three loads.
Jmmp 08 00088 g004
Figure 5. An optical cross-section of ½ of a RFSSW weld made with an H13 tool with the stir zone outlined in blue, the thermo-mechanical affected zone in yellow, and the heat affected zone in red.
Jmmp 08 00088 g005
Figure 6. (a) Peak load capacities of welds made with WC, MP159, and H13 tools; (b) average weld forces for each tool material.
Jmmp 08 00088 g006
Figure 7. In situ temperature data of RFSSW with WC tool.
Jmmp 08 00088 g007
Figure 8. (a) Average peak temperature of RFSSWs with each tool material; (b) average time above 350 °C for RFSSWs with each tool material.
Jmmp 08 00088 g008
Figure 9. Comparison of microhardness of RFSSWs made with various tool materials. The dashed box indicates the outer circumference of the shoulder, where all fractures occurred.
Jmmp 08 00088 g009
Figure 10. (a) Diagram of the tamping depth measured; the red is the measurement from the top of the BM to the weld face and the blue is the thickness of the top sheet. (b) Comparison of the red depth as a percentage of the blue depth.
Jmmp 08 00088 g010
Table 1. Chemical composition of AA2029.
CuMgAgMnZrSiFeTiAl
3.2–4.0%0.8–1.1%0.3–0.5%0.2–0.4%0.08–0.15%0.12%
max
0.15%
max
0.15%
max
Balance
Table 2. Select material properties of tool materials.
Density
(g/cm3)
Hardness
(Vickers)
Tensile Strength
(MPa)
Compressive Strength
(MPa)
Linear CTE
(µm/m-°C)
WC13.5–15.7 [17]1300–2200 [17]350 [17]3347–6833 [18]5.2–7.3 [17]
MP1598.3 [17]220–410 [19]850–1590 [20]14.5 [17]
H137.8 [17]300–600 [17]1990 [17]2550 [21]11–12.4 [17]
Table 3. Additional tool material properties, with * indicating values for MP35N.
Thermal Conductivity (W/mK)Coefficient of Friction
WC56–88 [18,27]0.353–0.368 [23]
MP159
*MP35N
*6.5–15 [17]0.472–0.527
H1324.3–33.2 [17,21]0.553–1.156 [22]
Disclaimer/Publisher’s Note: The statements, opinions and data contained in all publications are solely those of the individual author(s) and contributor(s) and not of MDPI and/or the editor(s). MDPI and/or the editor(s) disclaim responsibility for any injury to people or property resulting from any ideas, methods, instructions or products referred to in the content.

