

Monitoring Change and Recovery of an Embayed Beach in Response to Typhoon Storms Using UAV LiDAR
by
Qiujia Lei
1,
Xinkai Wang
1,2,
Yifei Liu
1,2,
Junli Guo
1,2,
Tinglu Cai
1,2 and
Xiaoming Xia
1,2,* 1
Second Institute of Oceanography, Ministry of Natural Resources of China, Hangzhou 310012, China
2
Key Laboratory of Ocean Space Resource Management Technology, Ministry of Natural Resources of China, Hangzhou 310012, China
*
Author to whom correspondence should be addressed.
Drones 2024, 8(5), 172; https://0-doi-org.brum.beds.ac.uk/10.3390/drones8050172
Submission received: 10 March 2024
/
Revised: 20 April 2024
/
Accepted: 25 April 2024
/
Published: 27 April 2024
(This article belongs to the Special Issue Aerial and Drone LiDAR Data for Geomorphological Mapping, Landform Extraction and Landscape Evolution)
Abstract
:The monitoring of beach topographical changes and recovery processes under typhoon storm influence has primarily relied on traditional techniques that lack high spatial resolution. Therefore, we used an unmanned aerial vehicle light detection and ranging (UAV LiDAR) system to obtain the four time periods of topographic data from Tantou Beach, a sandy beach in Xiangshan County, Zhejiang Province, China, to explore beach topography and geomorphology in response to typhoon events. The UAV LiDAR data in four survey periods showed an overall vertical accuracy of approximately 5 cm. Based on the evaluated four time periods of the UAV LiDAR data, we created four corresponding DEMs for the beach. We calculated the DEM of difference (Dod), which showed that the erosion and siltation on Tantou Beach over different temporal scales had a significant alongshore zonal feature with a broad change range. The tidal level significantly impacted beach erosion and siltation changes. However, the storm surge did not affect the beach area above the spring high-tide level. After storms, siltation occurred above the spring high-tide zone. This study reveals the advantage of UAV LiDAR in monitoring beach changes and provides novel insights into the impacts of typhoon storms on coastal topographic and geomorphological change and recovery processes.
1. Introduction
Sandy beaches are a vital constituent of global beaches, with highly varied temporal and spatial dynamics [1], providing high social, economic, and ecological values [2,3,4] and playing a vital role in protecting the hinterland from wave impacts during storms [5,6]. Global climate changes, rising sea levels, and human activity have exacerbated sandy beach erosion [7]. Vousdoukas et al. predicted that approximately half of the global sandy beaches may potentially disappear by 2100 [8]. Storm events caused by typhoons are essential drivers of beach erosion and cause rapid changes in beach morphology through strong winds, waves, and storm surges [9,10,11]. Therefore, monitoring and assessing the erosion status of sandy beaches and their responses to storms is essential [5,12,13]. Obtaining reliable data can facilitate science-based decision-making for the protection, use, and sustainable development of sandy beaches.
The monitoring of beach changes has relied on elevation measurement techniques. Previous studies have predominantly used, among others, theodolites, levelling instruments, total stations, and RTK-GPS to monitor topography changes before and after typhoons [14,15,16]. However, these traditional methods use single-point measurements [17,18] and require measurement personnel to manually measure elevation data using handheld devices, backpack-mounted devices, or tripods [19]. The process is limited by tidal fluctuations, restricting fieldwork time and equipment availability [20]. These traditional methods are characterized by low efficiency, and either low cost with low accuracy or high accuracy with high cost. When using traditional methods to analyse beach topography changes, multiple discrete points along the same transect are often connected to form profiles to better understand the changes from a one-dimensional perspective [21,22]. However, it is difficult to determine the profile topography changes in unmeasured areas.
Alternatively, all discrete points can be interpolated to generate a digital elevation model (DEM) for two-dimensional analysis. In this context, unmeasured areas lack elevation data, while the elevation interpolation results may have inaccuracies. In the late 1970s, LiDAR was first used to determine the height of target points on the ground, but it was limited by low-efficiency airborne GPS and low-precision inertial measurement units (IMU) for application [23]. In the 1980s and 1990s, LiDAR technology was improved and popularised [24,25,26,27], enabling the rapid collection of three-dimensional terrain data with high spatial density and facilitating the analysis of spatial differences [28]. With the miniaturisation of airborne LiDAR and the development of unmanned aerial vehicle (UAV) technology [29], UAV LiDAR technology has been applied to coastal terrain and geomorphology observations with high data resolution, high operational efficiency, and low cost [17]. Le Mauff et al. found the ability of UAV LiDAR in detecting the shoreline mobility and geomorphic change by monitoring three beach and dune systems located in the northeastern part of the Bay of Biscay in France over 5 years [30]. Using UAV LiDAR and two image-based systems to evaluate the changing topography of beaches, the results from Shaw et al. showed a lower height offset of the LiDAR system in comparison to the two image-based systems; however, all the systems were able to quantify the change to the beaches in area and volume [31]. Processed LiDAR data can also be used to generate high-quality digital elevation models (DEMs) [32], providing high-resolution terrain datasets suitable for analysing beach morphology changes [33,34]. White and Wang used high-resolution DEM data derived from UAV LIDAR data to analyse the morphologic changes that occurred to the oceanfront beaches on barrier islands and demonstrated that UAV LIDAR was useful in examining the response of barrier islands to the level of tropical activity [35]. Further, elevation change maps covering the entire study area can be obtained using raster cell math [36], which can effectively capture subtle and low-gradient elevation differences [37]. In addition, the structure from motion-multi-view stereo, a new photogrammetric technique based on UAV-derived imagery, can be used to reconstruct beach topography [38,39] and monitor coastal change [31]. Grohmann et al. obtained reliable results for 3D modelling and continuous monitoring of coastal dunes using the structure from motion-multi-view stereo [40].
Embayed beaches are the most common type of sandy beach in China, most of which are eroding [41,42,43]. In this study, the study area was located on the coast of Zhejiang Province in central China, adjacent to the East China Sea, where typhoon storm events are frequent in summer and winter. Although some scholars have previously investigated the topographic changes of typical embayed beaches in this region [44,45,46], most have used traditional methods for measurements, which lack high spatial resolution for beach topography observations and analysis. Therefore, this study focused on a typical sandy beach in Xiangshan County, Zhejiang Province, China, and used a UAV LiDAR system to monitor its topographic and geomorphological changes. Using elevation data measured with traditional RTK-GPS equipment as the reference, we evaluated the accuracy of the UAV LiDAR data. Based on the evaluated multiperiod UAV LiDAR data, our study created multiperiod DEMs of the beach and calculated the DEM of difference (Dod). Combining the Dod and tidal level and wind data, we revealed the spatial difference and its possible reasons for the beach topography and geomorphology in response to the typhoon events, providing novel insights into the impacts of typhoon storms on coast topographic and geomorphological change and recovery processes.
2. Study Area and Storm Events
2.1. Study Area
The east coast of Xiangshan County, Zhejiang Province, China, is in the subtropical monsoon climate zone, and has concentrated embayed sandy beaches. Northerly winds prevail in winter, while southerly winds prevail in the summer. The mean annual wind speed is 5.6 m/s. The mean annual wave height is 0.4 m, with the main wave direction coming from the east. The area has a tidal regime of regular semidiurnal tides, with a mean tidal range of approximately 3.08 m [47]. Tantou Beach is a typical embayed sandy beach facing the east located in a semi-closed bay to the east of Tantoushan Island (Figure 1). The beach is bounded by two headlands to the south and north. The beach length and width are approximately 1500 m and 200 m, respectively.
In the middle of the beach, a tie bar with an aeolian dune has developed behind the backshore. A wide, muddy flat is also located west of the tie bar. For 10 years, the coast of the tie bar has been continuously eroding and retreating. Both sides of the tie bar comprise seawalls constructed in 2019 by the local government to prevent shoreline retreat (Figure 2). This has artificially separated the aeolian dune area of the tie bar from the beach. Tantoushan Island has been developed into a scenic tourist area, and Tantou Beach is one of the main recreational and leisure destinations for summer visitors.
2.2. Storm Events
According to long-term data, typhoons influence the East China Sea annually from July to September [48]. In 2022, the typhoons Aere, Songda, Trases, Hinnamnor, and Muifa passed through the East China Sea (Figure 3a). Their characteristics were collected from the typhoon website of the National Meteorological Center of China (http://typhoon.nmc.cn/, accessed on 1 February 2023. Table 1). In this study, typhoons Hinnamnor and Muifa significantly impacted the study area (Figure 3b). Typhoon Hinnamnor formed on 28 August 2022, entered the East China Sea on 4 September 2022 after becoming a super typhoon, and turned northeast when it was in the adjacent area of the coastal waters of Zhejiang Province on 5 September 2022. The closest distance between the centre of Hinnamnor and the study area was 276 km, with a central pressure of 930 hPa and a maximum wind speed of 55 m/s. During Hinnamnor, the maximum measured wave height at the Zhujiajian and Dachen wave buoy stations were 1.4 and 1.3 m, respectively. Conversely, typhoon Muifa formed on 8 September 2022, entered the East China Sea on 13 September 2022 after becoming a severe typhoon, and made landfall at Zhoushan Islands on 14 September 2022. The closest distance between the centre of Muifa and the study area was 55 km, with a central pressure of 945 hPa and a maximum wind speed of 48 m/s. During Muifa, the maximum measured wave height at the Zhujiajian wave buoy station was 4.7 m, and 3.2 m at the Dachen wave buoy station.
3. Materials and Methods
3.1. Data Collection
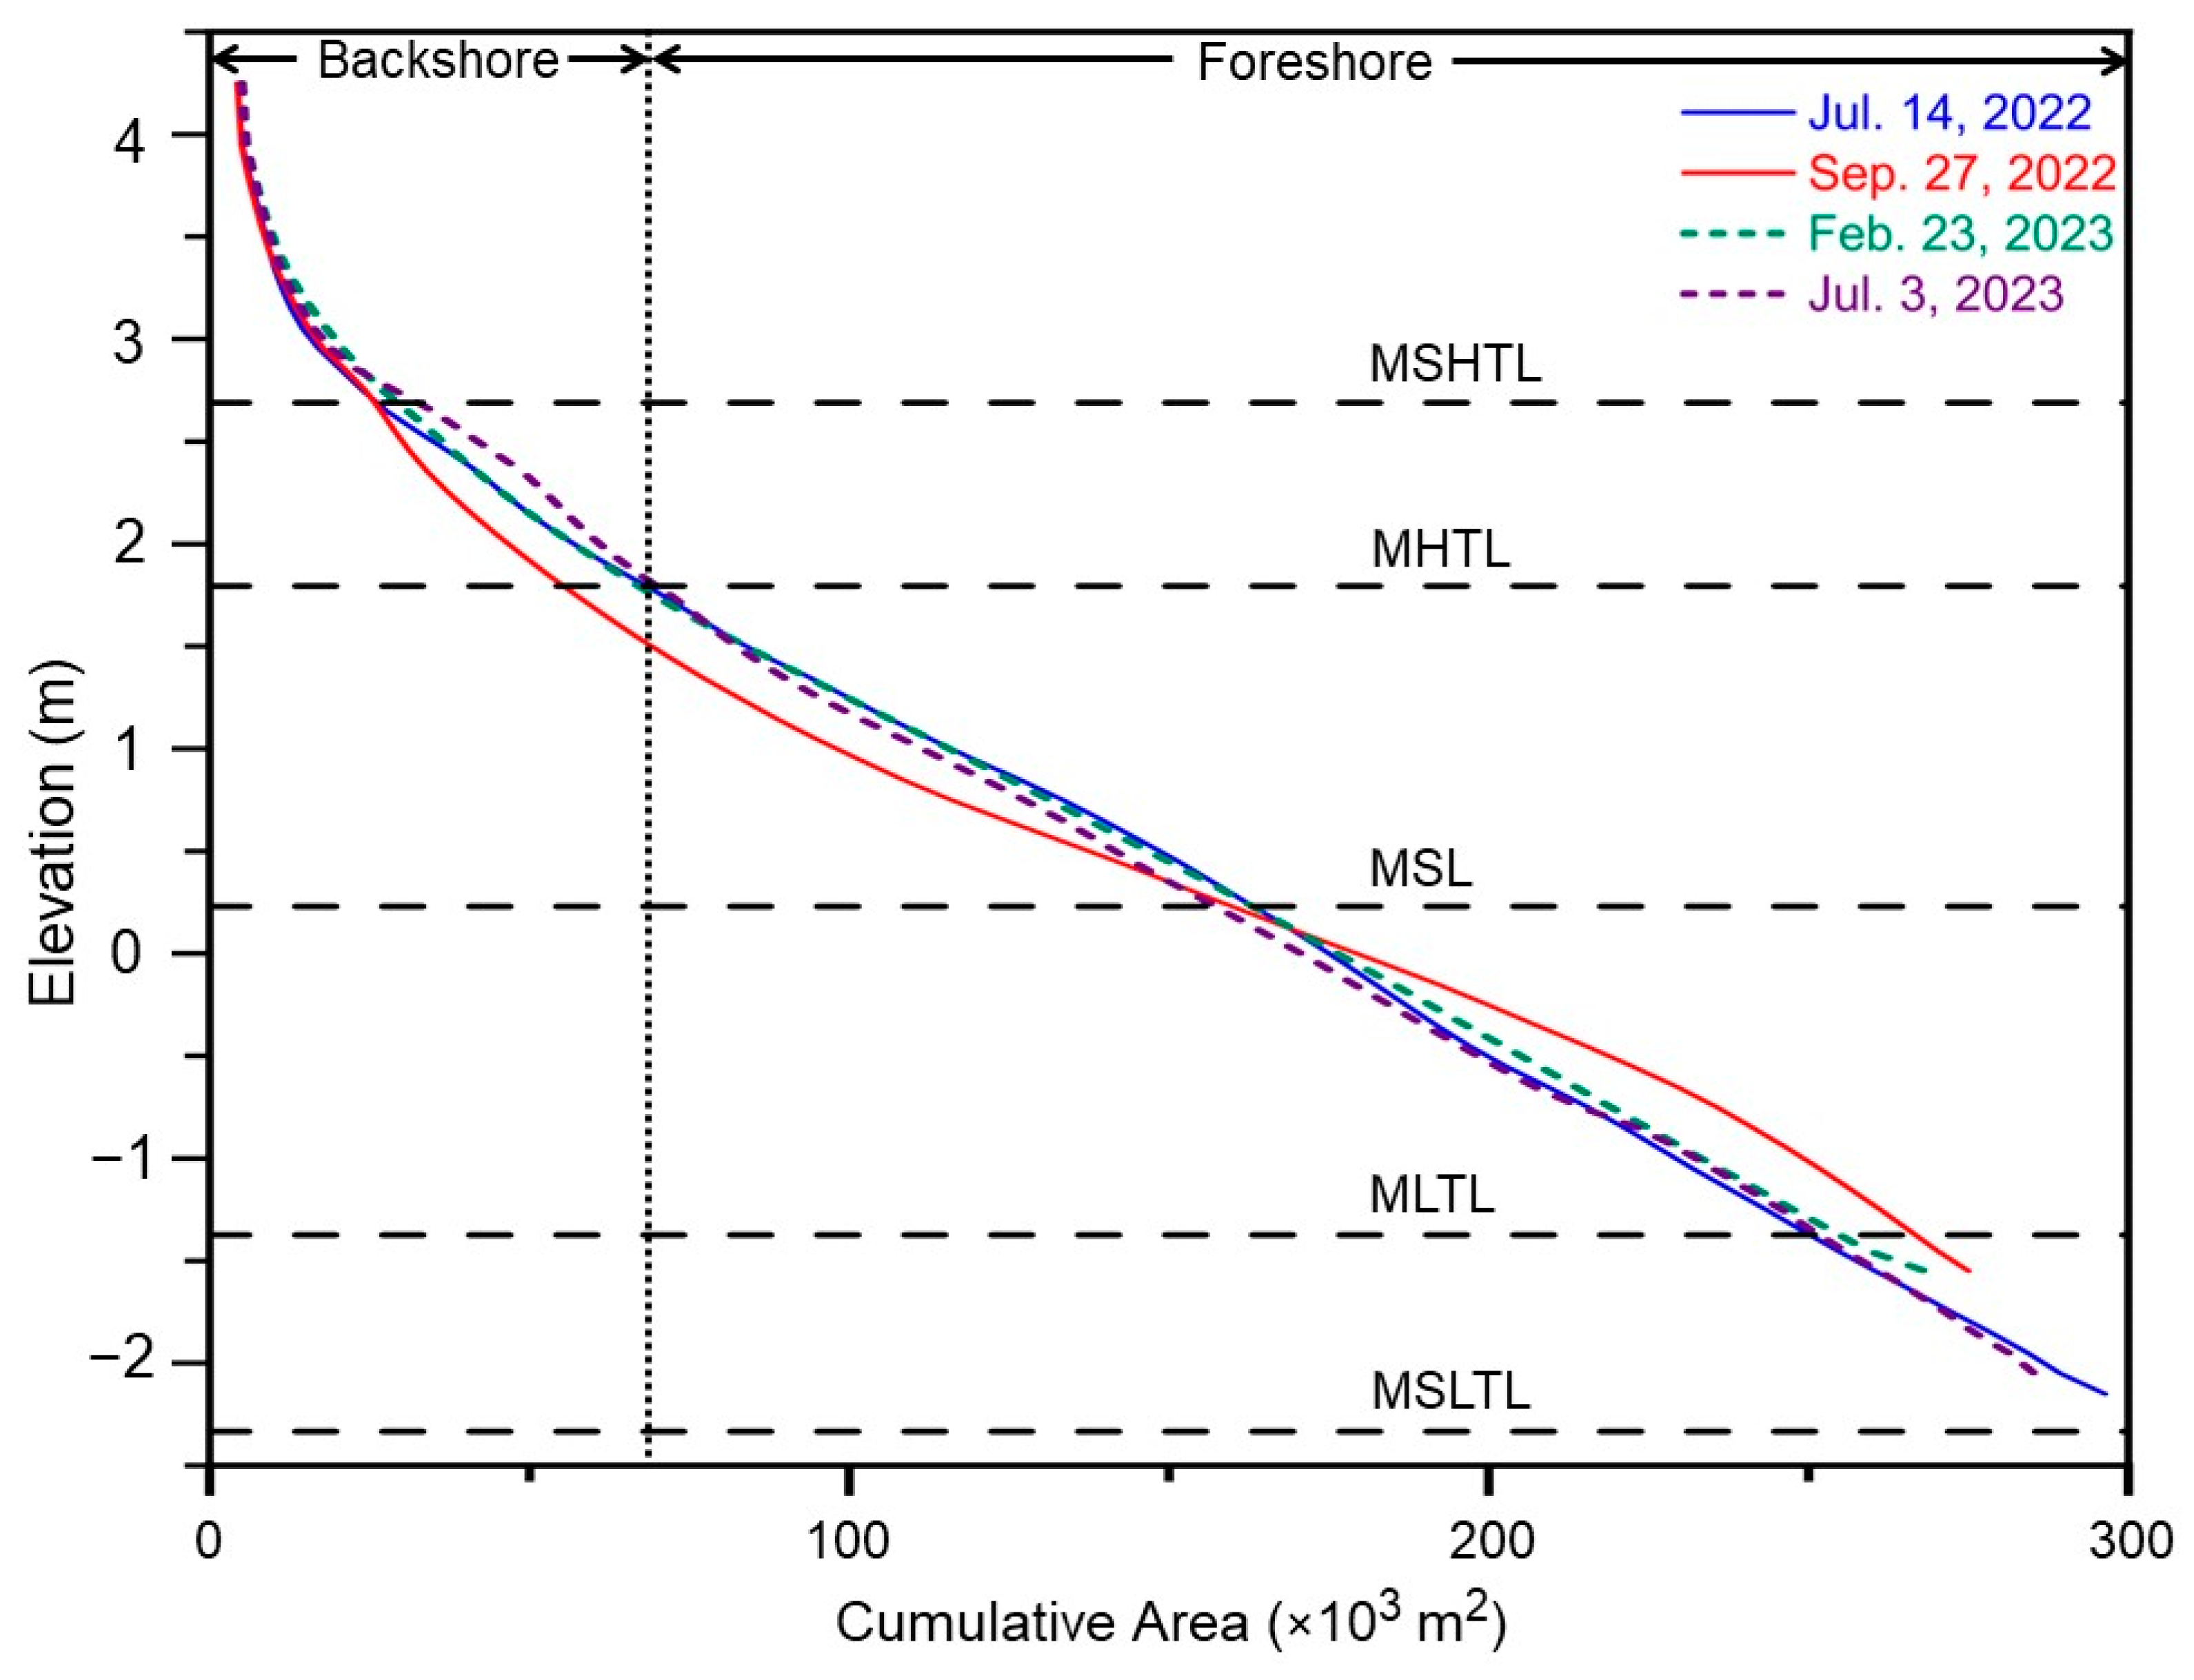
The Shipu Marine Station is a long-term observation station near the study area. The observed data included the meteorological and marine hydrological parameters. In this study, we collected the wind speed, wind direction, and tidal level (including astronomical tide level and measured tide level data) during normal periods and typhoon seasons, which were simultaneously observed in a year by the Shipu Marine Station for statistical analysis (Figure 1a). The surge levels were calculated using the measured tide level minus the astronomical tide level. The tidal data from the Shipu Marine Station showed that the mean sea level (MSL), mean high-tide level (MHTL), mean low-tide level (MLTL), mean spring high-tide level (MSHTL), and mean spring low-tide level (MSLTL) in the study area were 0.23 m, 0.79 m, −1.37 m, 2.69 m, and −2.33 m, respectively. All the tidal levels are based on the National Elevation Datum 1985, China.
3.2. UAV LiDAR and Field Survey
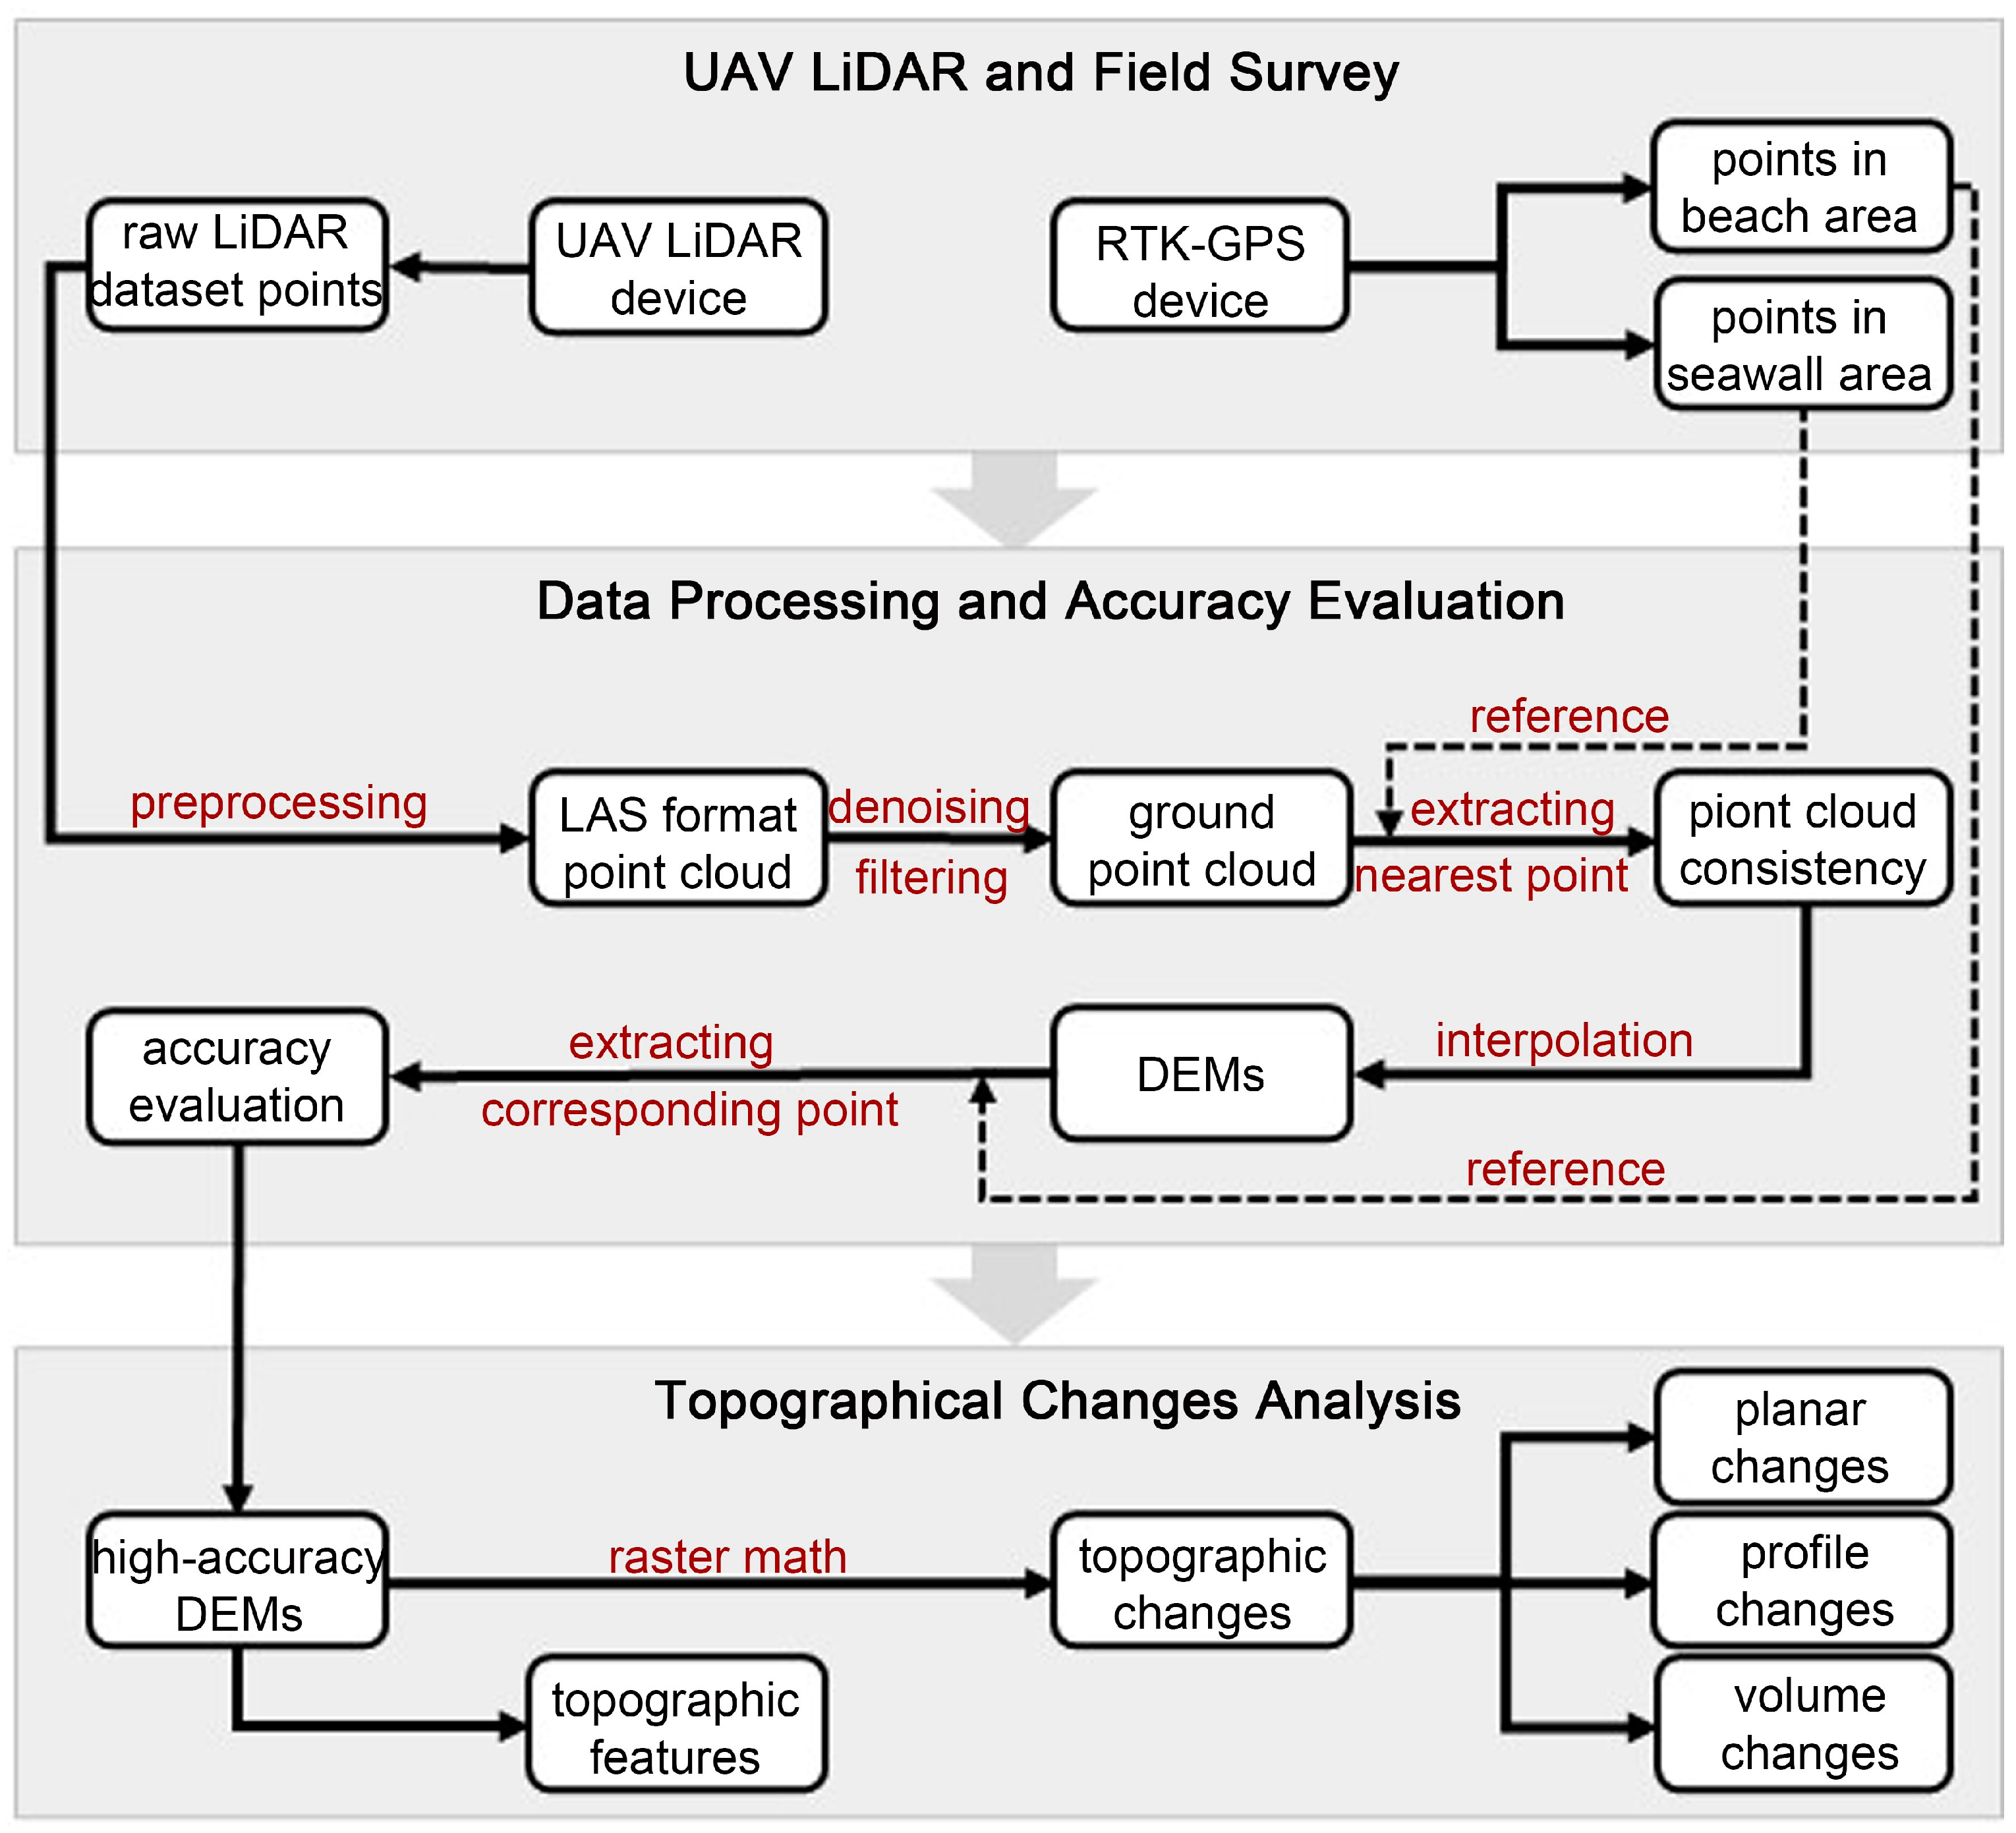
In this study, the beach topographic data collection and processing methods are illustrated in Figure 4. Four field measurements using UAV LiDAR during the spring low-tide level on 14 July 2022 (pre-storm), 27 September 2022 (post-storm), 23 February 2023, and 3 July 2023 (recovery period) were conducted to obtain the beach topographic data. In the LiDAR survey, the UAV DJI M300 (Dajiang Innovation Matrice 300, Dajiang Innovation Technology Co., Ltd., Shenzhen, China), equipped with a GPS-RTK receiver for the position, was used as a platform for mounting the LiDAR scanner DJI Zenmuse L1 (Dajiang Innovation Zenmuse L1, Dajiang Innovation Technology Co., Ltd., Shenzhen, China). The LiDAR scanner combines an RGB sensor and the IMU system in a stabilised 3-axis gimbal, which provides true colour photograph images and LiDAR data of the study area topography (Table 2). It has been demonstrated that the accuracy of this UAV LiDAR scanner system is greater than the manufacturer-declared values [49].
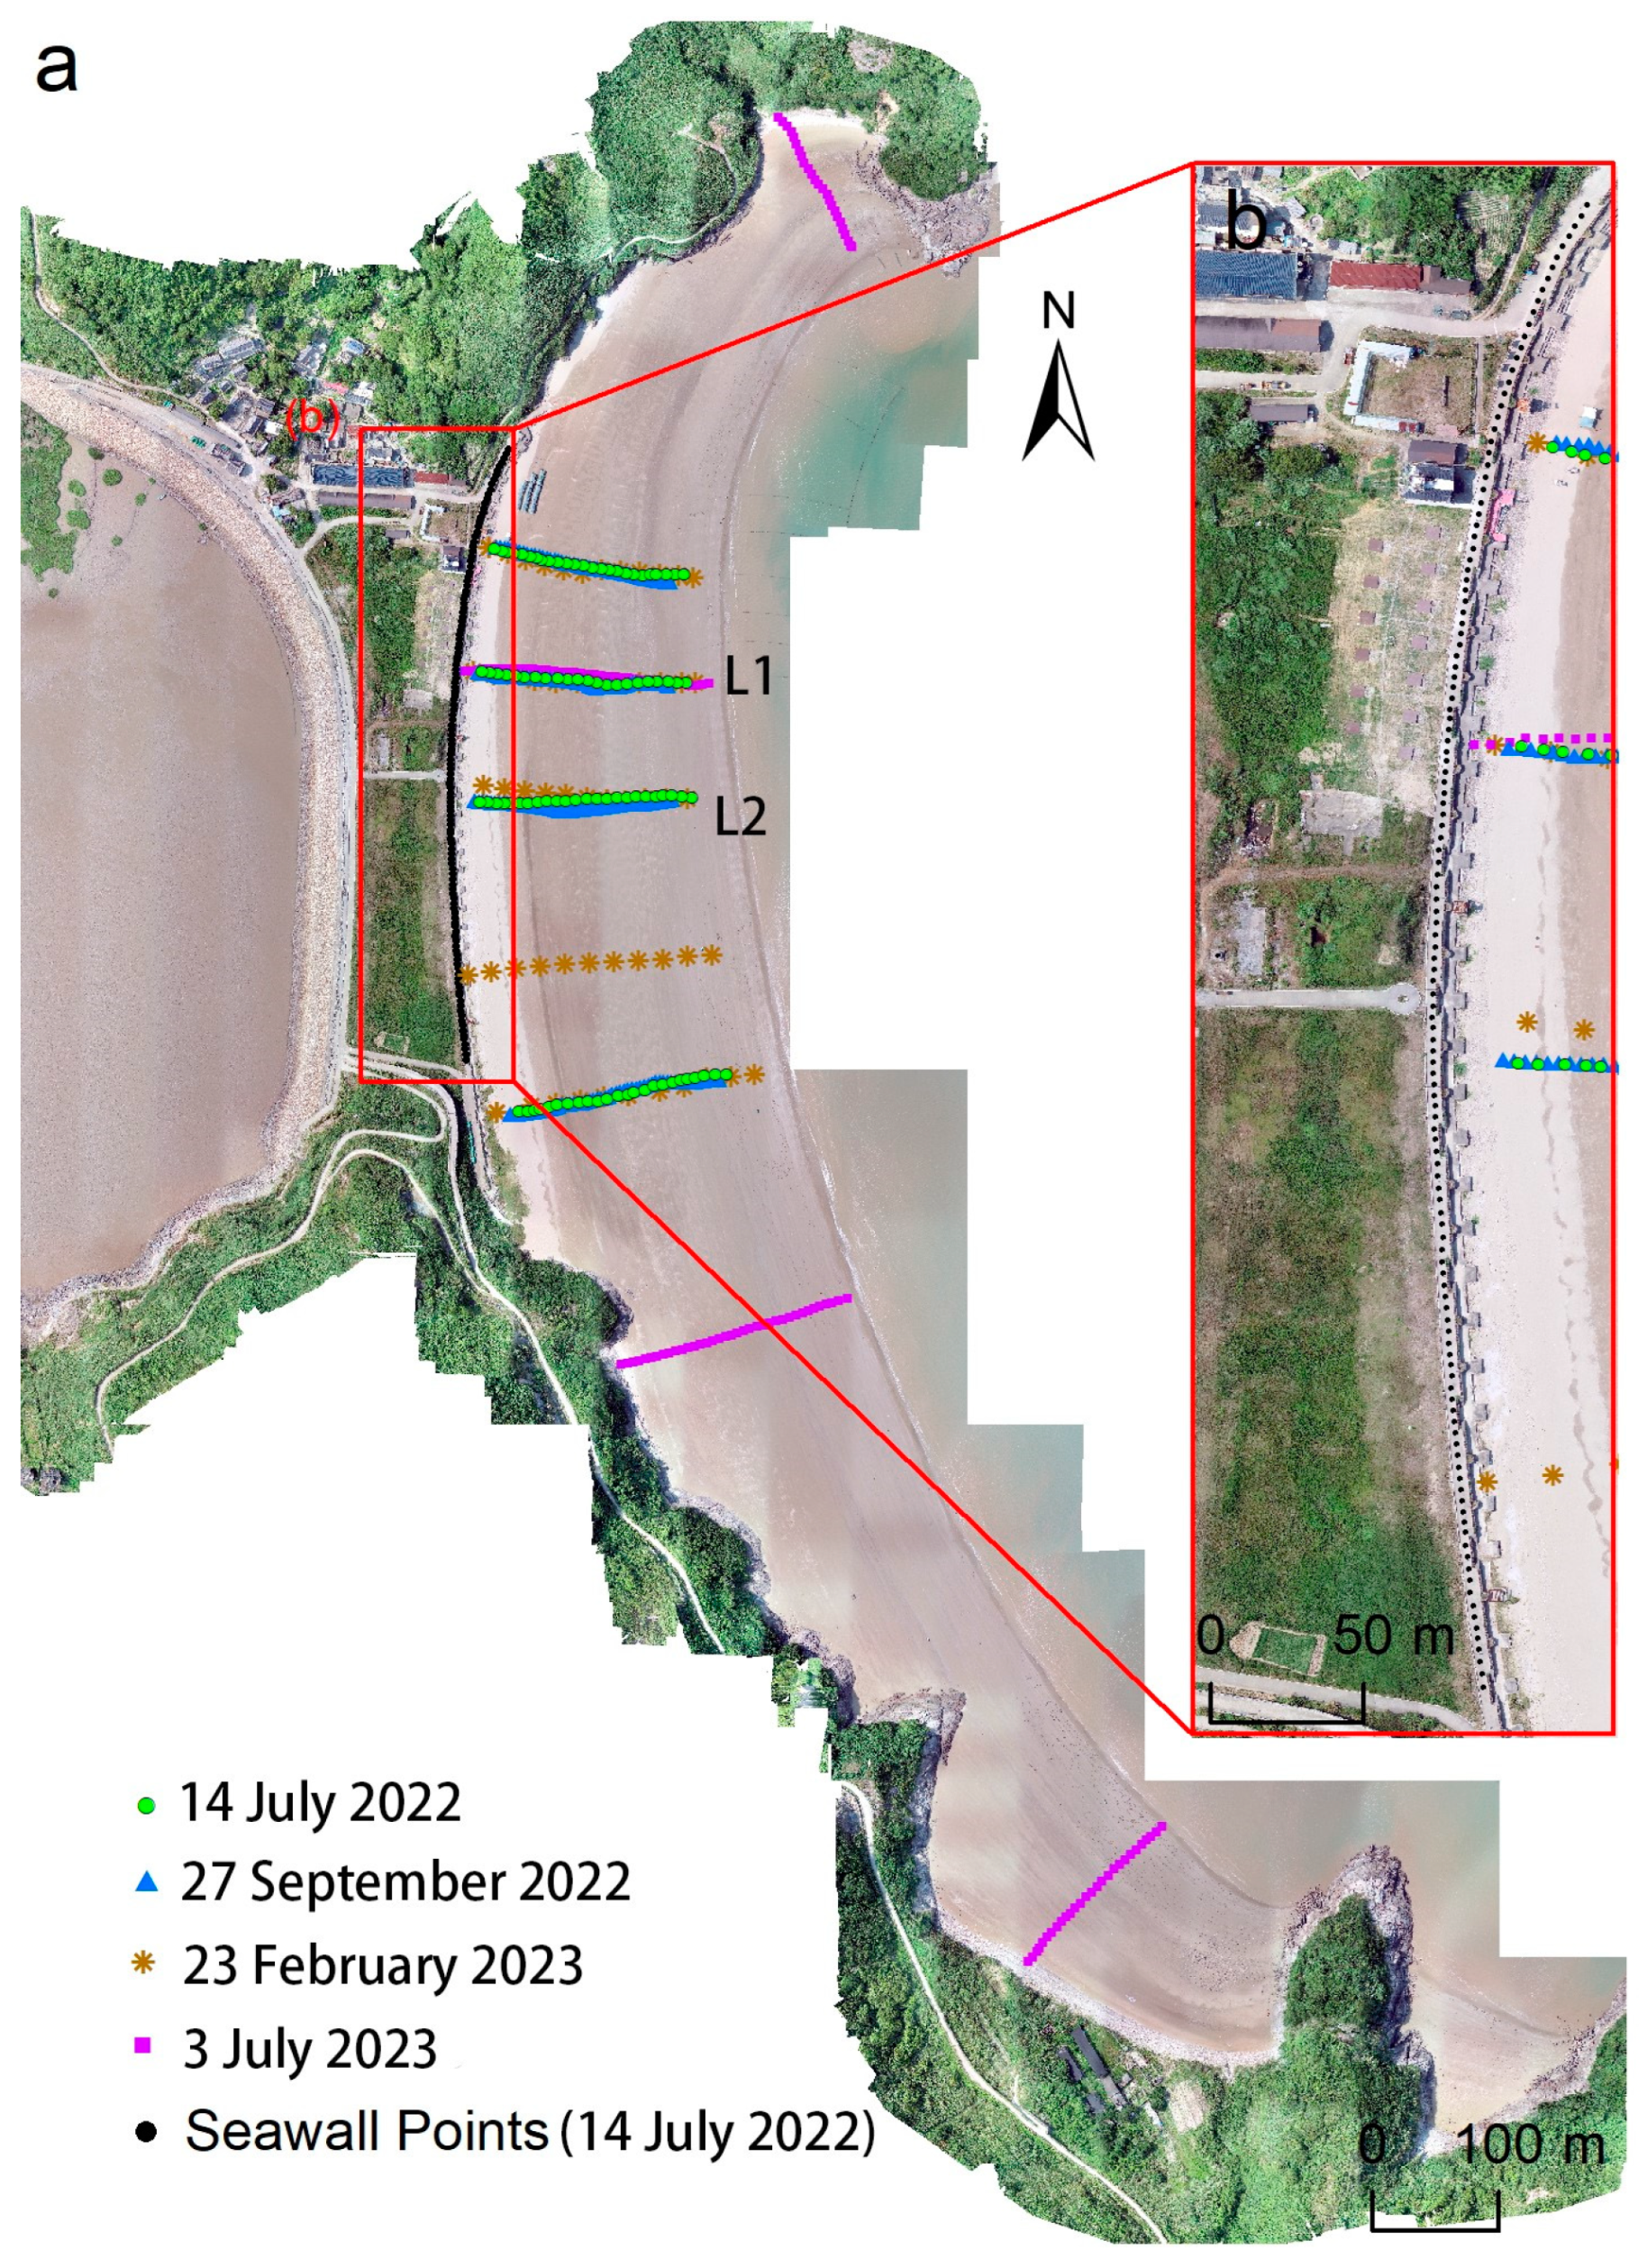
Comparing the GPS-RTK system and the total station device in beach-profile measure, Lee et al. (2013) found the GPS-RTK system has a vertical accuracy of approximately 2 cm, which is a little better than the total station device (approximately 3–6 cm) [50]. Previous studies have shown that the high position accuracy (approximately within 1 cm) of RTK connecting to CORS (continuously operating reference stations, providing real-time position using the multiple station network RTK technique by satellite) in measurement [51,52,53]. The RTK-GPS measurement was a good method to examine the error of other survey methods [28]. Thus, it is feasible to take the RTK data as reference values to estimate the accuracy of the beach elevation. To evaluate the accuracy of the LiDAR data, we set observation profiles and feature control points on the beach face and the seawall area, respectively, and used the RTK-GPS device iRTK10 (iRTK10, HI TARGET, Guangzhou, China) to obtain the geographic location of the observation points and the elevation of topographic reference points from the beach and seawall area synchronously. The UAV GPS-RTK position system and the RTK field survey device are connected to CORS with a horizontal deviation of 8 mm and a vertical deviation of 15 mm, respectively. Due to the difference in the beach area exposure over the sea level in each period, the observation profiles were not all of the same length. Overall, the lengths of all the profiles were approximately from 100 m to 250 m. The RTK points were also obtained for the four time periods. During each field measurement, UAV and RTK were simultaneously conducted. Figure 5 shows the distribution of all the RTK points from our four surveys. The number of RTK points and profiles acquired during each survey is summarised in Table 3. Overall, there are a large number of RTK points covering the entire study area from south to north and at different elevations.
3.3. Data Processing and Accuracy Evaluation
The raw LiDAR dataset points obtained from the UAV LiDAR system were high-density three-dimensional points, also known as point clouds, that store spatial geoinformation of target surface features. The raw point cloud collected by the LiDAR scanner DJI Zenmuse L1 was pre-processed to the general LAS format [54] using the manufacturer-supplied software DJI Terra (Figure 4). The LAS format stores information, including the planar coordinates (X, Y), vertical coordinate (Z), and the LiDAR reflection intensity. We then separated the ground points from other category points by denoising and filtering (cloth simulation filter algorithm, CSF) [55] in the Cloud Compare 3D point cloud and mesh-processing software (version 2.13). Many studies using the CSF method to separate ground points showed that the CSF method was fitting for most topography conditions [56,57,58,59]. The CSF extracts ground points from discrete return LiDAR point clouds and produces results with accuracies comparable to most state-of-the-art filtering algorithms [54,60]. The average point density after the filter of the LiDAR data sets in four measure periods is 135 pt/m2, 161 pt/m2, 185 pt/m2, and 201 pt/m2, respectively. We then selected the point clouds for stable concrete seawalls in the study area from the four survey periods and extracted them manually. After that, we searched for the nearest LiDAR point from each survey period and matched it to each RTK survey point. These LiDAR data in the four survey periods referred to the same RTK survey data from the stable concrete seawall area obtained on 14 July 2022 (Figure 5a). We then calculated the elevation differences (the difference in Z values) between each RTK survey point and its nearest LiDAR point and analysed the consistency of the LiDAR data among the four survey periods.
The point clouds that passed the evaluation were used to create four DEMs of the beach area using ESRI ArcGIS software (version 10.8) with the LAS Dataset to Raster tool [61] with a spatial resolution of 0.5 × 0.5 m. Inverse distance weighted (IDW) is an appropriate interpolation method to generate beach DEM [62], and it was used to create DEMs in this study. To evaluate the accuracy of the DEMs, we selected RTK survey points in the beach area as a reference from their corresponding period (Figure 5b). For each RTK reference point, we then extracted the corresponding points from the DEMs in each period to compare their elevation differences. The coordinate system was WGS84. The elevation datum was also converted into the National Elevation Datum 1985, China.
Additionally, we extracted two validation profiles (Figure 5, profile L1 and profile L2), evaluated the elevation changes accuracy, and conducted a meta-analysis of uncertainty in elevation distribution. The elevation change period of the points and profiles evaluated was from 14 July to 27 September 2022. The beach elevation change reference values for each profile were obtained by subtracting the previous RTK data on 14 July 2022 from the later RTK data. Similarly, the beach elevation changes in the same profiles detected via LiDAR between 14 July and 27 September 2022 were also obtained. To assess the accuracy of the beach elevation changes, the beach elevation change errors were calculated by subtracting the elevation changes of the RTK data from those of the LiDAR data. The RTK-GPS connecting to CORS in measurement has high position accuracy [51,52,53] and vertical accuracy [50]. Thus, the two validation profiles are enough to estimate the accuracy of the beach elevation changes.
3.4. Beach Topographical and Geomorphological Change Analysis
Based on the created DEMs and aerial photograph images of the beach area in four survey data, we analysed the beach topographical and geomorphological features in different periods. We used ESRI ArcGIS software (version 10.8) with the Raster Calculator tool to obtain the Dod, which was calculated using a later DEM minus the previous DEM. This represented the vertical distance between the two DEMs to provide insights into the planar erosion and siltation changes in the beach topography during different periods. The positive values represent siltation, while the negative values represent erosion. For exploring more detailed areas of erosion and siltation change, we used an interval of 0.2 m in elevation to divide erosion and siltation change zones and then calculated their area. We also selected six typical cross-shore profiles and plotted their elevation change curves from shore to sea to analyse the elevation change features. Taking the first DEM as a reference, we used an elevation interval of 0.5 m to divide each DEM into several topographic zones from shore to sea. Combining the Dod with the DEMs, we calculated the volume of each topographical zone to provide three-dimensional insights for analysing the response and recovery of beach topography to typhoon storms.
4. Accuracy Evaluation
4.1. Accuracy Evaluation of the UAV LiDAR Data and DEMs Products
It can be seen from Figure 6 that most elevation differences between the point cloud and the RTK field survey data in the seawall of the study area during the four periods are close to 0, and the RMSEs are 0.03 m, 0.05 m, 0.04 m, and 0.03 m, respectively. This has demonstrated that all the LiDAR datasets of the study area in four survey periods were compatible within 0.05 m. Therefore, all the LiDAR datasets in the study area during the four survey periods were consistent.
According to Figure 7, there is a strong linear correlation and a high level of consistency (R > 0.8, R2 was close to 1, p < 0.01) between the DEMs generated by point cloud and the RTK field survey data in the beach face of the study area during the four periods. The RMSEs ≤ 0.05 m (the RMSEs in four survey periods are respectively 0.04 m, 0.04 m, 0.05 m, and 0.04 m) suggested that the overall accuracy of the DEMs was within 0.05 m. These results indicate that the UAV LiDAR data and the generated DEMs in this study have a high level of credibility and accuracy that is at the same level as the RTK field survey data. The UAV LiDAR system was wide-ranging, continuous, and convenient, which can effectively replace the RTK device for studying beach topographic changes.
As shown in Figure 8, we analysed the spatial distribution of the beach elevation errors by the relationship between the beach elevation errors (axis Y) and the beach elevation (axis X, elevation values acquired by RTK). It was obvious that the beach elevation errors did not show a regular change with the increase or decrease of the beach elevation. Therefore, the spatial distribution of the beach elevation errors in different elevation regions is random. That is, the uncertainty of the beach elevation errors for high/low elevation areas is random.
4.2. Accuracy Evaluation of the Elevation Changes
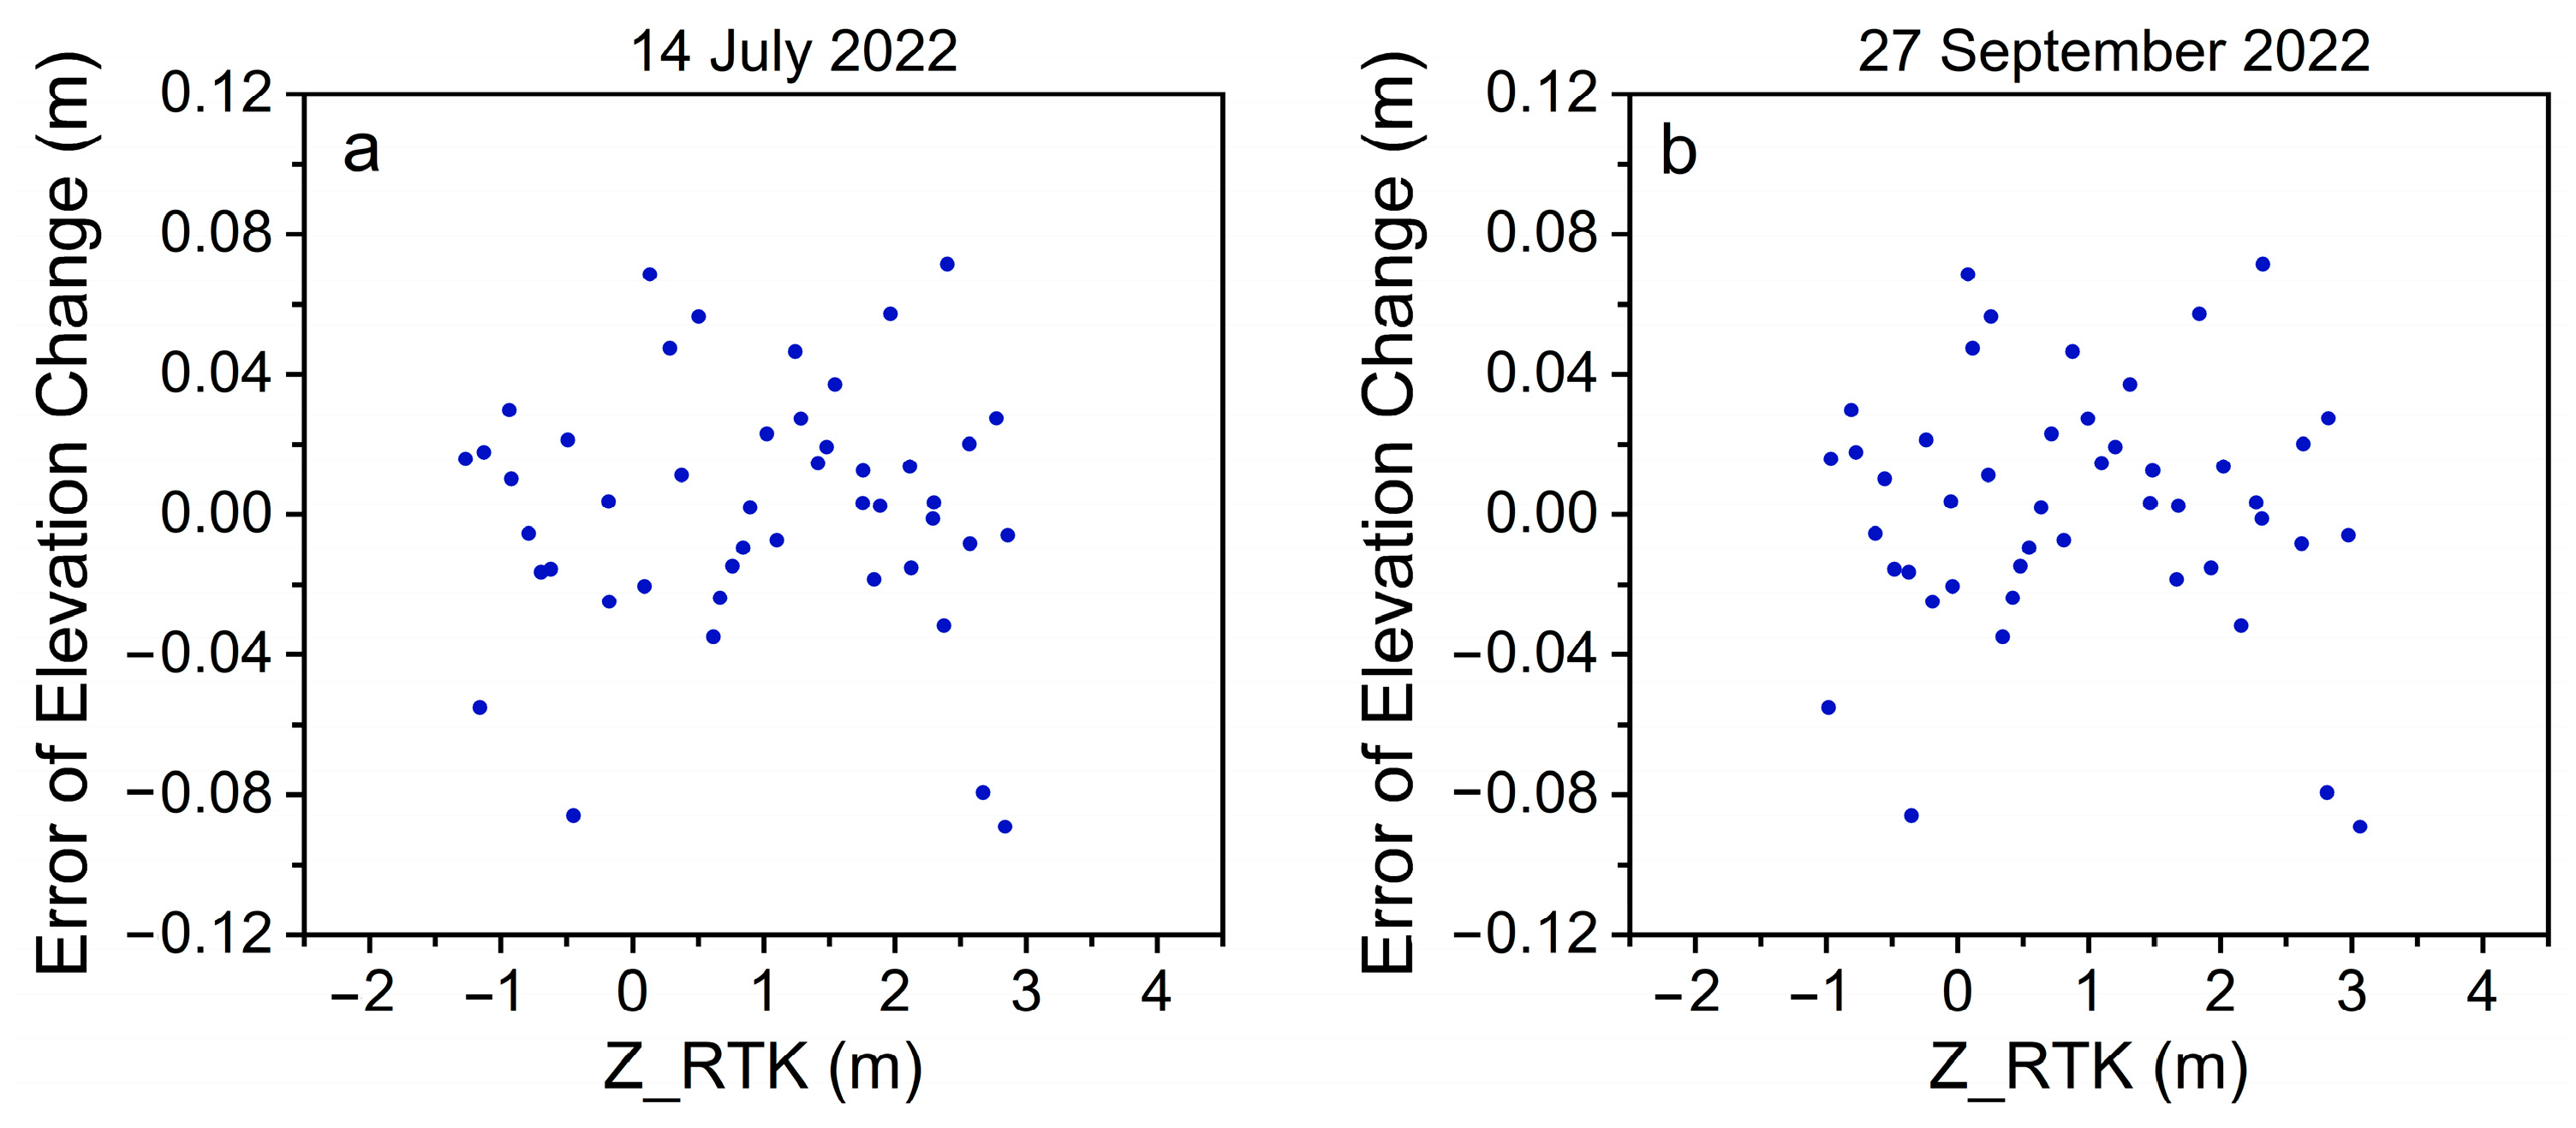
For profile L1, the elevation changes of RTK between the two measurements were consistent with those of LiDAR, with an R2 value of 0.981 (Figure 9a). Between the same two measurements, the elevation changes of the RTK data and LiDAR data on the profile L2 were also consistent, with an R2 value of 0.955 (Figure 9b). The elevation change errors of profile L1 ranged from −0.09 to 0.07 m (mean value: −0.004 m), while those of profile L2 ranged from −0.09 to 0.07 m (mean value: 0.008 m) (Table 4). These results show that no large systematic offset existed between the elevation changes of RTK and LiDAR. The average RMSE of the elevation changes in L1 and L2 was 0.035 m, demonstrating that the accuracy of the elevation changes by LiDAR is reliable. To explore the spatial nature of the beach elevation change errors, we analysed the relationship between the beach elevation (axis X, elevation values acquired by RTK) and the beach elevation change errors (axis Y) (Figure 10). The beach elevation change errors did not exhibit regular trends with increased or decreased beach elevation. Therefore, the beach elevation change errors were not impacted by the beach elevation, showing that the uncertainty for high/low elevation areas is random.
5. Results
5.1. Beach Topographical and Geomorphological Features
Combined with fieldwork, we analysed the topography and geomorphology of Tantou Beach using UAV photograph images and DEM products from four survey periods (Figure 11). The beach had a gentle terrain with inconspicuously developed berms. The elevation of the beach face over the sea level was between −2.5 and 4.5 m. On the southern and northern ends of the beach, gravel beach ridges developed on the upper backshore. The centre of the beach is a tie bar with seawall construction on its eastern and western sides. The eastern seawall was next to the beach, with the cobble revetment at its toe (Figure 2b). In July 2023, the cobble zone was covered by sand with little vegetation (Figure 2c).
Given the tide level changes, the exposed area above the sea level of the beach in each measurement differed (Figure 11). As listed in Table 5, the exposed areas of the beach in four periods were 296.37 × 10³, 275.02 × 10³, 268.22 × 10³, and 285.32 × 10³ m2. According to the relationship between the elevation and the cumulative area from the four survey periods (Figure 12), the topographical changes of the beach had a significant alongshore zonal feature. The beach above the MSHTL had a steep slope and showed little change before and after the storms. Below the MSHTL, the beach slope was relatively gentle and changed significantly before and after storms. After storms, the slope of the beach area from the MSL to the MSHTL showed a steep back and gentle fore due to erosion. Meanwhile, the beach slope area below the MSL showed the opposite trend. However, both gradually recovered to the pre-storm morphology after autumn and winter.
5.2. Beach Morphodynamic Changes
5.2.1. Planar Changes
Spatially, the erosion and siltation changes of the beach occurred across different periods, showing a significant alongshore zonal feature (Figure 13).
During storms, the upper backshore showed slight siltation of less than 0.2 m, while the lower backshore and the upper foreshore were strongly eroded with a maximum of 0.8 m. The upper foreshore had strong siltation with a maximum of more than 0.8 m (Figure 13a). Meanwhile, the southern side of the prominent nose headland on the northern beach was eroded more than 0.5 m. Heading into the autumn and winter after storms, the beach rapidly adjusted and indicated contrasting features. (Figure 13b). The topography had slight erosion and siltation during the following spring and summer and gradually became stable (Figure 13c). Regarding the annual scale, the beach had a cross-shore erosion and siltation adjustment that balanced near the MSL. A significant alongshore adjustment was observed, showing erosion in the north and siltation in the south (Figure 13d).
Considering the four change periods, the beach erosion and siltation changed in a wide range. Most areas changed within less than 0.5 m; however, there was more than a 0.5 m change near the headland and the nose headland on the northern beach.
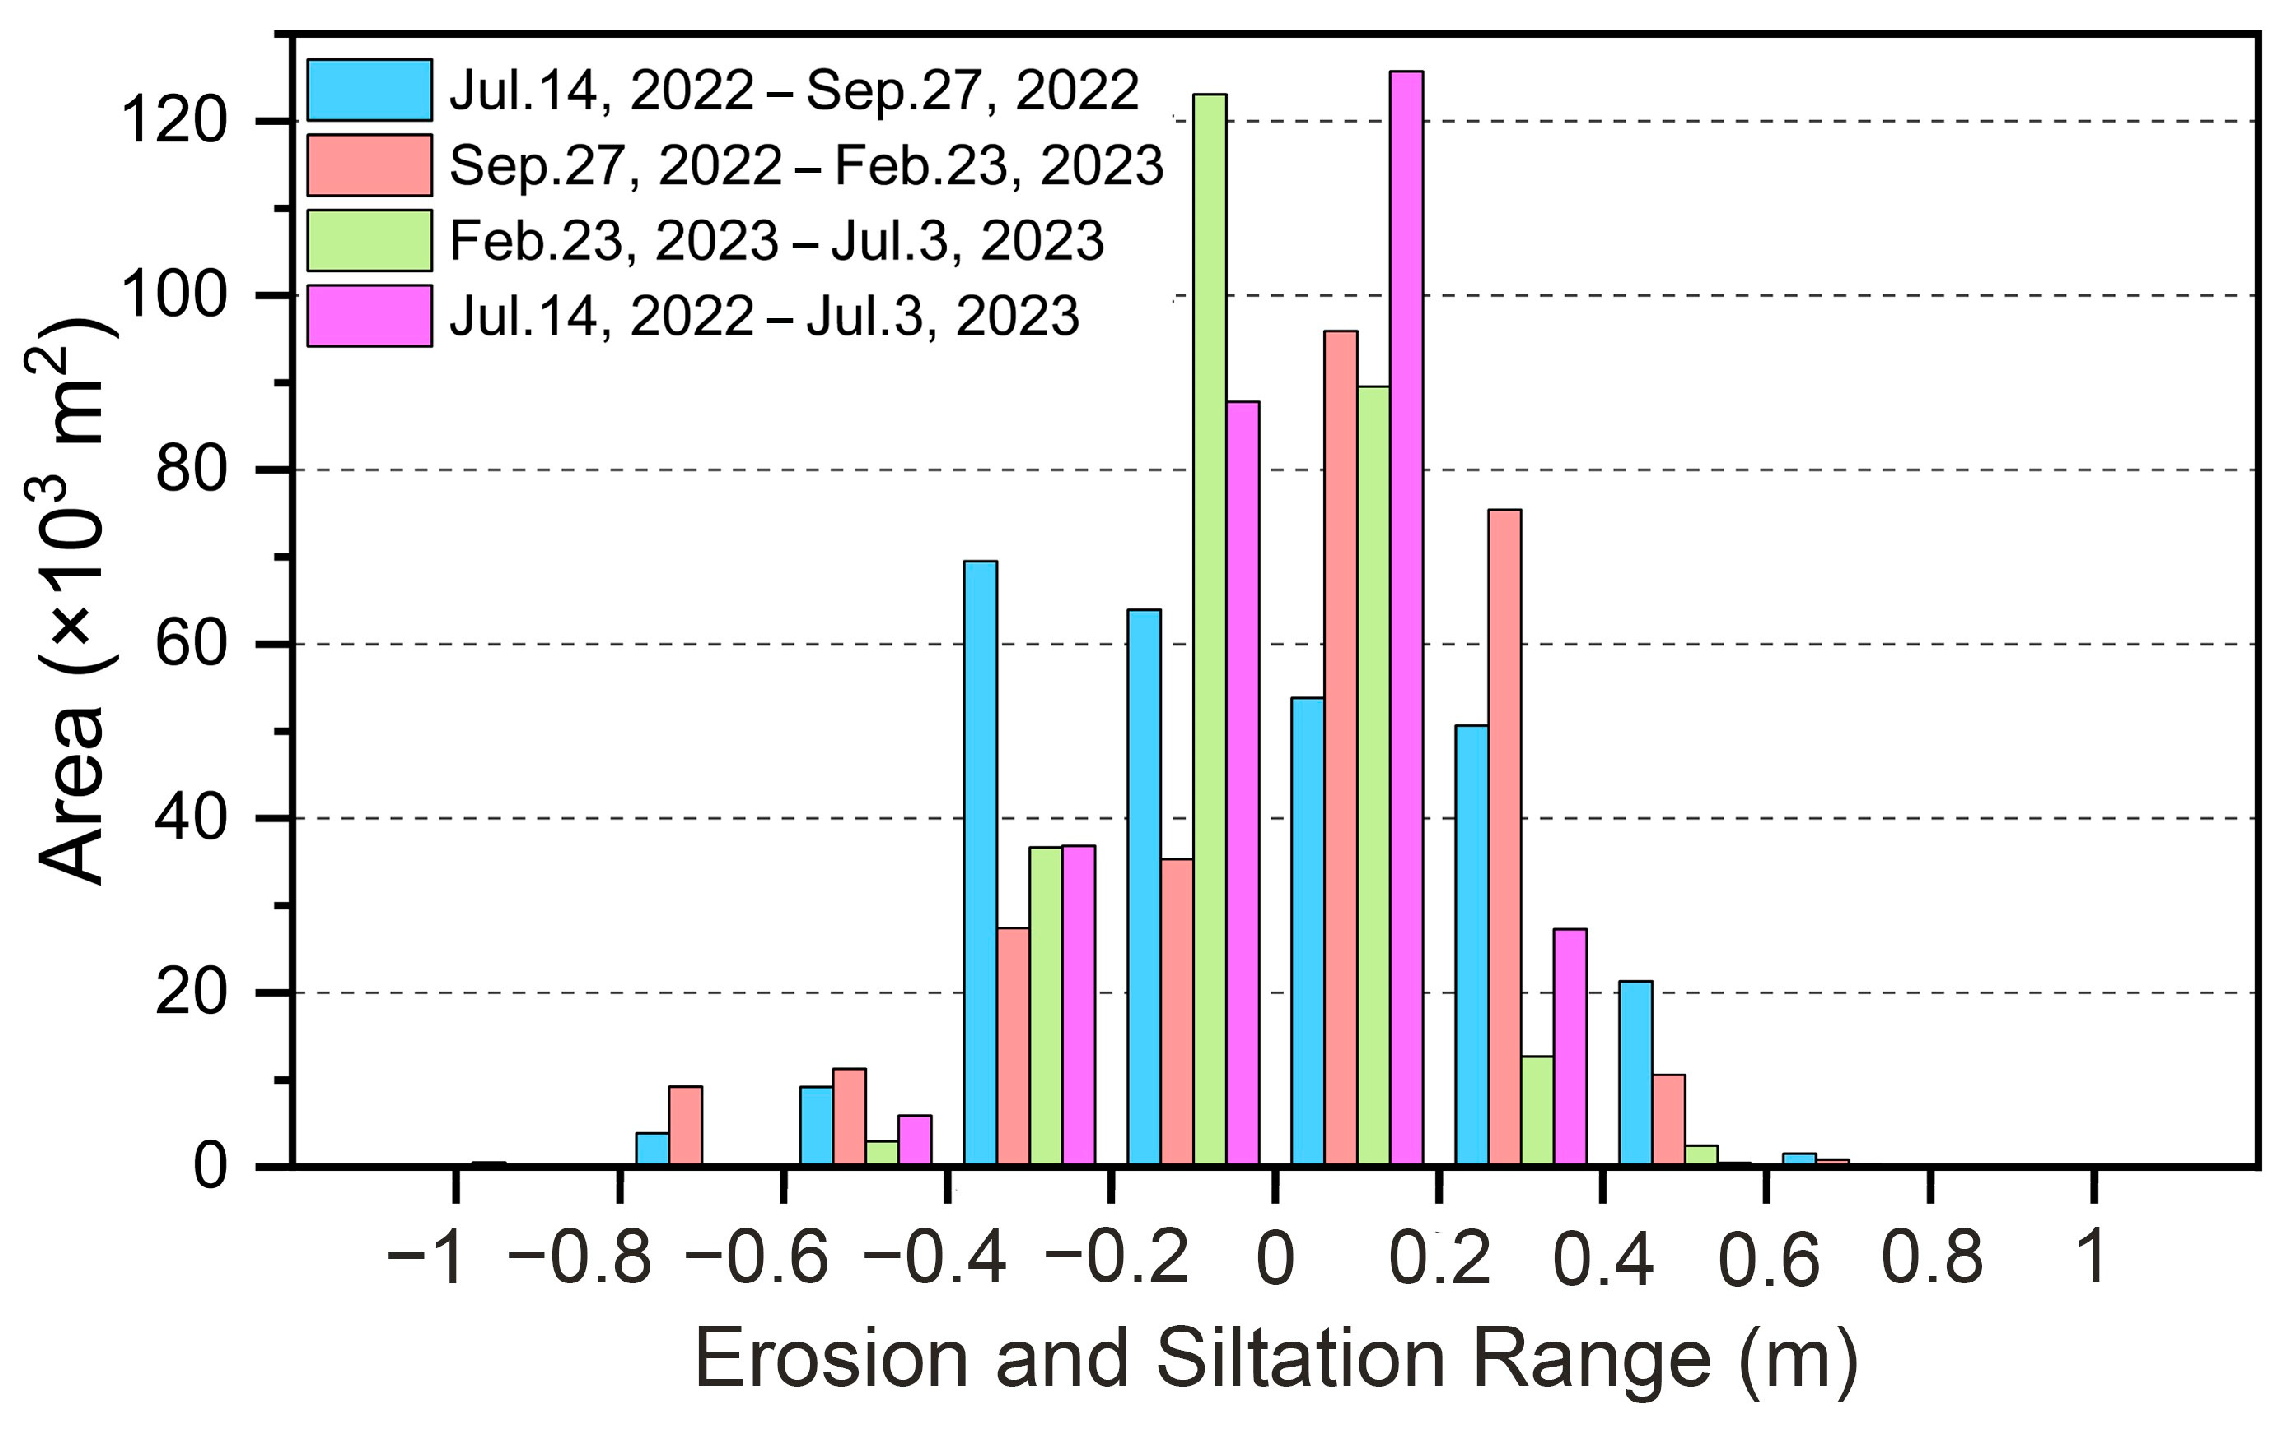
According to the statistics for the erosion and siltation ranges in each change period (Table 6), the change ranges for each period differed. However, they were less than 0.4 m in most areas over the last year (Figure 14). From 14 July 2022 to 27 September 2022, the range of the beach was relatively wide, and the area of the range of more than 0.4 m was up to 36.60 × 10³ m2. Similar to the change ranges during the storms, the area with more than a 0.4 m range was 32.51 × 10³ m2 from 27 September 2022 to 23 February 2023. From 23 February 2023 to 3 July 2023, the beach experienced slight erosion and slight siltation, and most areas changed less than 0.4 m.
5.2.2. Profile Changes
The elevation change curves showed that the initial morphology and slope of the six profiles were related to the distance from them to the northern or southern headland (Figure 15; 6 profiles are shown in Figure 13a). TB1 had a similar initial slope to TB6, TB2 had similarities with TB5, and TB3 had similarities with TB4. In particular, TB1 and TB6 were located in the northern and southern bays of the beach, respectively, where the beach face was narrow, and the slope was steep. Gravel beach ridges developed on their upper backshore. The locations of TB2 and TB5 were near prominent nose headlands, where the MSHTL could reach the bedrock directly. Their beach face was narrow, and the slope was steep. The upper backshore of the central profiles (TB3 and TB4) was connected to the cobble revetment and seawall. There were relatively wider beach faces and gentler slopes. Overall, each profile took the MSL as an erosion and siltation balance boundary, showing that the upper was erosion and the lower was siltation, or the upper was siltation and the lower was erosion.
Based on the topographical changes of the beach over the last year, we found that the erosion and siltation ranges of the profiles were strongly related to their locations and elevations. The northern and southern profiles showed wider erosion and siltation change ranges, while the central profiles showed relatively little change. The gravel beach ridges in the upper backshore of profiles TB1 and TB6 were nearly unchanged. During storms, the lower backshore to foreshore had erosion on the upper beach and siltation on the lower beach, with a change range maximum of 0.8 m. After the storm, the lower backshore to foreshore experienced siltation on the upper beach and erosion on the lower beach. One year later, it recovered to its initial profile morphology, with a profile of nearly entirely siltation. For TB2 and TB5, the bedrock was above MSHTL. From the influence of rocky headlands, the beach faces of TB2 and TB5 had strong hydrodynamic forces. During storms, erosion occurred on the upper beach, while siltation occurred on the lower beach, with a maximum change range of more than 0.8 m. However, the post-storm adjustments differed between TB2 and TB5. TB2 recovered to its initial profile morphology after autumn and winter, but experienced erosion throughout the entire profile in the spring and summer. Meanwhile, TB5 experienced siltation along the entire profile in autumn and winter. In spring and summer, siltation occurred on the upper beach, while erosion occurred on the lower beach. One year later, it recovered to its initial profile morphology, approximately.
The beach face was wider at TB3 and TB4. Above MSHTL, the upper backshore developed, and siltation mainly occurred, while below, the beach experienced erosion alternated with siltation, and their change ranges were no more than 0.5 m.
5.2.3. Volume Changes
The erosion and siltation changes in different parts of the profiles were strongly related to their initial elevation (Figure 16).
During storms, the upper backshore mainly had a small siltation (approximately 0.8 × 10³ m3; Figure 16a). The lower backshore and foreshore had MSL as a balance boundary, while the above mainly eroded (a maximum of approximately 8.7 × 10³ m3 occurred near the location that the MHTL reached). The area below mainly had siltation (a maximum of approximately 9.9 × 10³ m3 occurred near the location that the MLTL reached). In the post-storm autumn and winter, the beach profile rapidly adjusted to the opposite direction. The MSL was a balance boundary, and the above mainly had siltation (a maximum of approximately 8.7 × 10³ m3 occurred near the location that the MHTL reached). In comparison, the below mainly had erosion (a maximum of approximately −8.2 × 10³ m3 occurred near the location where the MLTL reached) (Figure 16b). The erosion and siltation ranges changed significantly during the following spring and summer, while the volume ranged between −2.4 × 10³ m3 and 3.4 × 10³ m3. Siltation mainly occurred on the backshore, and erosion predominantly occurred on the foreshore (Figure 16c). Analysing the erosion and siltation volume throughout the year, we found that the upper backshore had erosion and siltation (mainly a small amount of net siltation of approximately 1.6 × 10³ m3). From the lower backshore to the foreshore, erosion alternated with siltation. Until near the MSLTL, the net erosion and siltation volume approached 0, indicating that the beach had almost recovered its initial morphology (Figure 16d).
6. Discussion
6.1. Advancement of UAV LiDAR to Beach Survey
Dynamic beach-change monitoring needs high-resolution and repeatable topographical measurements. RTK-GPS, optical satellite image, terrestrial laser scanner, aerial photogrammetry, the structure from motion-multi-view stereo, and UAV LiDAR are the general methods for beach-change monitoring [63,64]. The traditional RTK has heavy workloads, which can only acquire partial topographic data but not the whole beach, requiring a major amount of time and surveyors to implement measurements [65]. Optical satellite images and terrestrial laser scanners are limited by clouds [66,67] and field of view (FOV) [68,69], respectively. The repeatability of measurement results by aerial photogrammetry depends on the budget [70]. The structure from motion-multi-view stereo can save time and the number of surveyors to measure but is more sensitive to environmental factors (e.g., surface characteristics and lighting conditions) [71]. Further, optical satellite images, terrestrial laser scanners, and aerial photogrammetry are all costly to apply. Compared with other techniques, UAV LiDAR has a clear advantage in terms of no limitation from clouds, FOV, and lighting conditions. It can acquire high-resolution data, large and uniform ground coverage, and higher point density [72,73]. The UAV LiDAR also does not need to touch beach area directly and can save time, reduce workloads, and improve the efficiency and safety factor of surveyors [74]. In addition, the development of consumer drones [75] makes the cost of UAV LiDAR applied to monitor beach changes lower.
6.2. Impacts of Typhoon Storms on the Beach
Previous studies have shown that typhoon wave conditions dominate beach responses [76,77,78]. Therefore, this study examined the impacts of other potential factors on beach morphological changes after storms. The different dynamics and landform features in different beach sections [79,80] resulted in varying morphology and changed processes influencing the beach profiles following storms [14,34]. Liu et al. found an alongshore zonal erosion and siltation feature of Dongsha Beach during storms [81]. Profiles in different sections of the beach all exhibited inshore sediment transport, and sediments accumulated on the lower beach, making the slope gentler. The northern and southern profiles had strong siltation near the headlands while experiencing erosion. Peng et al. found that the headlands had a specific blocking effect when typhoons passed the beach in parallel [82]. Tong et al. found that profiles sheltered by the headlands had less erosion [44]. Pardo-Pascual et al. observed that the area sheltered by the beach headland developed accumulation landforms more easily [83]. These results are consistent with the siltation near the northern and southern headlands of Tantou Beach (Figure 13a).
Tides are an essential factor for the impacts of typhoon storms on beach topography. During storms, different tides could affect the coast impacts of storms [84]. The various combinations of typhoon storms with high and low-tide levels or spring and neap tides may have different effects on beach morphological changes [46]. When storms cause erosion on Atlantic beaches, sediment moves offshore, decreasing the beach slope and accumulating to bars (Figure 17a). The bars cause waves to break offshore, which provides buffering for beaches and weakened erosion. However, seawalls are common in the backshore of most beaches in Zhejiang Province, resulting in different responses to storms.
Guo [85] and Shi et al. [46] found that the post-storm Dongsha Beach in Zhejiang Province took MSL as an erosion and siltation balance boundary, with erosion occurring on the upper beach and siltation on the lower beach (Figure 17b). Meanwhile, there was little change above the MSHTL. Liu et al. found that under storm conditions, Dongsha Beach had erosion on the upper beach and siltation on the lower beach, with incredibly substantial erosion along the seawall [34]. The post-storm Huangcheng Beach showed erosion on the upper beach and siltation on the lower beach [44]. In this study, the post-storm Tantou Beach had erosion on the upper and lower beaches. Meanwhile, there was also siltation above the high-tide zone (Figure 17c).
During typhoons Hinnamnor and Muifa, the storm surge at Tantou Beach was shown using the difference between the measured astronomical tide level at the Shipu Marine Station (Figure 18). The storm surge was divided into two periods. The first began from approximately 4 to 7 September 2022, with a maximum surge value of 0.64 m. It occurred on 5 September 2022, when the study area was affected by the force-7 wind circle of Hinnamnor, which was classified as a super typhoon. During this period, the main wind direction in the study area was NE, with a mean wind speed of 6.5 m/s. It later changed to N, with a mean wind speed of 8.2 m/s. The second period started from 13 to 15 September 2022, with a maximum surge value of 0.68 m. It occurred on 14 September 2022, when the study area was affected by the force-10 wind circle of Typhoon Muifa, classified as a severe typhoon. During this period, the main wind direction in the study area was NE, with a mean wind speed of 7.4 m/s. It later changed to N, with a mean wind speed of 11.8 m/s.
Although the Shipu Marine Station is the nearest to the study area, a substantial distance remains between this station and Tantou Beach (Figure 1a). Therefore, the water level in the study area would be higher than the measured level at Shipu Marine Station when considering only the storm conditions. This indicates that the MSHTL of Tantou Beach was over 2.69 m during storms. Typhoons Hinnamnor and Muifa affected the study area during the moderate tide period (Table 1). Therefore, the storm surge did not reach the area above the MSHTL. The mouth direction of the bay where Tantou Beach is located was nearly perpendicular to the pathways of Hinnamnor and Muifa. Meanwhile, Tantou Beach was located on the left side of the pathways, and the offshore waves had relatively little impact on the beach [86].
Therefore, the surge carried some sediment from the high-tide zone to the area above the MSHTL; however, it was insufficient to remove sediment above the spring high-tide level when it dissipated. It only removed some sediment from the high-tide zone away to the low-tide zone and deposited it. That caused the siltation above the MSHTL in Tantou Beach, besides the erosion on the upper beach and the siltation on the lower beach. In conclusion, the initial profile morphology of the beach and the high- and low-tide levels, or spring and neap tides during storms, substantially impacted the erosion and siltation of the beach.
Figure 17.
Sketch showing profiles changes in different scenarios: (a) the profile of the embayed beach on the coast of the Atlantic influenced by storm [87]; (b) the profile of the embayed beach in Zhejiang Province, China, before and after storms, summarised by Guo [85]; (c) in this study, the profile of the embayed beach in Zhejiang Province, China, before and after storms.

Figure 18.
Time series of meteorological and oceanographic parameters: (a,b) astronomical tide levels and measured tide levels; (c,d) measured wind speed; (e,f) measured wind direction. (g) Wind rose 3–7 September 2022. (h) Wind rose 13–16 September 2022.
Figure 18.
Time series of meteorological and oceanographic parameters: (a,b) astronomical tide levels and measured tide levels; (c,d) measured wind speed; (e,f) measured wind direction. (g) Wind rose 3–7 September 2022. (h) Wind rose 13–16 September 2022.

6.3. Recovery Mechanism after Storms
The recovery of undeveloped beaches after storms comprises four stages: rapid siltation on the foreshore, siltation on the backshore, dune formation, dune expansion and vegetation stabilisation. However, the recovery of developed beaches could only reach the second stage [88].
Solid seawall constructions and buildings occupy the backshore of developed beaches. However, the formation of dunes requires a narrow dry beach, and these concrete constructions hinder the sand transport in forming aeolian dunes. Sand could accumulate there but not stabilise. Therefore, the remaining stages of recovery could not be achieved. After 1 year, the elevation of the recovered beach remained lower than before the storm. In this study, there was a seawall on the backshore of Tantou Beach. After the storms, the foreshore of the beach experienced rapid siltation (Figure 13a). During the recovery period, siltation occurred on the backshore (Figure 13b), consistent with the prior results. Liu et al. found that the erosion and siltation features of Dongsha Beach under calm sea conditions were evident [81]. There was erosion on the lower beach and sediment accumulation on the upper beach and around the seawall, and the thickness values of erosion and siltation were similar. Tantou Beach also had the same feature after the recovery period (Figure 13d). Additionally, the beach exhibited a seasonal adjustment trend during the recovery period. The landforms in different areas showed different seasonal adjustments and erosion and siltation changes. The seasonal adjustment trend of the southern beach was similar to the results from Dongsha Beach by Cheng et al. [89] and Guo et al. [45], which showed gentle slopes in four seasons. Siltation especially occurs in autumn and winter, while erosion occurs in spring and summer. However, in this study, the results obtained for the middle and northern beaches contradicted those of Cheng et al. [89] and Guo et al. [45], possibly due to the variations in beach direction and wave conditions between the two beaches. Therefore, further research with more wave data collected remains warranted.
7. Conclusions
This study used a UAV LiDAR system to collect topographic three-dimensional data from Tantou Beach, a sandy beach in the east of Xiangshan County, on 14 July 2022 (pre-storm period), 27 September 2022 (post-storm period), 23 February 2023, and 3 July 2023 (recovery period). Based on the measured UAV LiDAR data and the obtained DEMs, tidal level, and wind data, we assessed the accuracy of UAV LiDAR, revealed the spatial difference of the beach topography and geomorphology in response to the typhoon events, and discussed the efficiency of UAV LiDAR and the influencing factors of beach storm response. The main conclusions are as follows:
The overall elevation accuracy of LiDAR datasets in four survey periods was approximately within 0.05 m. In spatial measurements, the elevation errors of LiDAR datasets showed an irregular change when the elevation increased or decreased. That is, the attribution of the elevation errors did not rely on the elevation, showing the random uncertainty for high-/low-elevation areas. Compared with other techniques, UAV LiDAR has a clear advantage in terms of high efficiency, convenience, and low cost.
The erosion and siltation on Tantou Beach during different periods exhibited a significant alongshore zonal feature with a wide change range. The change ranges of the profiles in different locations varied significantly. Change ranges in different parts of the common profile were closely related to their initial elevations. Regarding the storm effects, erosion occurred on the upper beach, while the siltation occurred on the lower beach after the storms, with the MSL as the boundary. As for the seasonal pattern, the beach exhibited the opposite erosion and siltation features in autumn and winter, while it experienced slight erosion and siltation (less than 4 × 10³ m3) in the following spring and summer. The beach had a cross-shore erosion and siltation adjustment, which also balanced near the MSL. Meanwhile, there was a significant alongshore adjustment with erosion in the north and siltation in the south. The high-tide level during the storm and the wave climate play an important role in the beach storm response and the seasonal variation, respectively.
This study found the UAV LiDAR system could effectively assess the beach topographical and geomorphological changes of sandy beaches exposed to frequent storms with high spatial resolution. It provides new information for the impacts of typhoon storms on coast topographic and geomorphological change and recovery processes, contributing to the management and protection of sandy beaches more reasonably.
Author Contributions
Research design, X.X.; research implementation, X.X., X.W. and Q.L.; writing and revision of the paper, Q.L., X.X. and X.W.; data collection, Q.L., X.W. and J.G.; field investigation and verification, Q.L., X.W., J.G., Y.L. and T.C. All authors have read and agreed to the published version of the manuscript.
Funding
This research was funded by Zhejiang Provincial Natural Science Foundation of China, grant number LDT23D06025D06, and the Scientific Research Funds of the Second Institute of Oceanography, MNR, grant number JG2315&XRJH2309.
Data Availability Statement
The original contributions presented in the study are included in the article, further inquiries can be directed to the corresponding author.
Acknowledgments
We would like to thank Yining Chen and Zhenpeng Ge for their help in improving the manuscript. We are also sincerely grateful to the editor and the reviewers for their constructive suggestions. Thanks for the help of Minmin Ding in the field investigation. We also thank the Oceanographic Data Center, Chinese Academy of Sciences (CASODC) for the typhoon data service they provided (http://msdc.qdio.ac.cn, accessed on 1 February 2023).
Conflicts of Interest
The authors declare no conflicts of interest.
References
- Hanley, M.E.; Hoggart, S.P.G.; Simmonds, D.J.; Bichot, A.; Colangelo, M.A.; Bozzeda, F.; Heurtefeux, H.; Ondiviela, B.; Ostrowski, R.; Recio, M.; et al. Shifting sands? Coastal protection by sand banks, beaches and dunes. Coast. Eng. 2014, 87, 136–146. [Google Scholar] [CrossRef]
- Defeo, O.; McLachlan, A.; Schoeman, D.S.; Schlacher, T.A.; Dugan, J.; Jones, A.; Lastra, M.; Scapini, F. Threats to sandy beach ecosystems: A review. Estuar. Coast. Shelf Sci. 2009, 81, 1–12. [Google Scholar] [CrossRef]
- Carpi, L.; Bicenio, M.; Mucerino, L.; Ferrari, M. Detached breakwaters, yes or not? A modelling approach to evaluate and plan their removal. Ocean Coast. Manag. 2021, 210, 105668. [Google Scholar] [CrossRef]
- Drius, M.; Jones, L.; Marzialetti, F.; de Francesco, M.C.; Stanisci, A.; Carranza, M.L. Not just a sandy beach. The multi-service value of Mediterranean coastal dunes. Sci. Total Environ. 2019, 668, 1139–1155. [Google Scholar] [CrossRef] [PubMed]
- Robin, N.; Billy, J.; Castelle, B.; Patrick, A.H. Beach-dune Recovery from the Extreme 2013-2014 Storms Erosion at Truc Vert Beach, Southwest France: New Insights from Ground-penetrating Radar. J. Coast. Res. 2020, 95, 588–592. [Google Scholar] [CrossRef]
- Choi, E.C.; Lee, J.S.; Chang, J.I. Willingness to pay for the prevention of beach erosion in Korea: The case of Haeundae beach. Mar. Policy 2021, 132, 104667. [Google Scholar] [CrossRef]
- Williams, A.T.; Rangel-Buitrago, N.; Pranzini, E.; Anfuso, G. The management of coastal erosion. Ocean Coast. Manag. 2018, 156, 4–20. [Google Scholar] [CrossRef]
- Vousdoukas, M.I.; Ranasinghe, R.; Mentaschi, L.; Plomaritis, T.A.; Athanasiou, P.; Luijendijk, A.; Feyen, L. Sandy coastlines under threat of erosion. Nat. Clim. Chang. 2020, 10, 260–263. [Google Scholar] [CrossRef]
- Huang, S.Y.; Yen, J.Y.; Wu, B.L.; Shih, N.W. Field observations of sediment transport across the rocky coast of east Taiwan: Impacts of extreme waves on the coastal morphology by Typhoon Soudelor. Mar. Geol. 2020, 421, 106088. [Google Scholar] [CrossRef]
- Minamidate, K.; Goto, K.; Watanabe, M.; Roeber, V.; Toguchi, K.; Sannoh, M.; Nakashima, Y.; Kan, H. Millennial scale maximum intensities of typhoon and storm wave in the northwestern Pacific Ocean inferred from storm deposited reef boulders. Sci. Rep. 2020, 10, 7218. [Google Scholar] [CrossRef]
- Matsuba, Y.; Shimozono, T.; Tajima, Y. Extreme wave runup at the Seisho Coast during Typhoons Faxai and Hagibis in 2019. Coast. Eng. 2021, 168, 103899. [Google Scholar] [CrossRef]
- Han, M.; Yang, D.Y.; Yu, J.; Kim, J.W. Typhoon Impact on a Pure Gravel Beach as Assessed through Gravel Movement and Topographic Change at Yeocha Beach, South Coast of Korea. J. Coast. Res. Int. Forum Littoral Sci. 2017, 33, 889–906. [Google Scholar] [CrossRef]
- Luijendijk, A.; Hagenaars, G.; Ranasinghe, R.; Baart, F.; Donchyts, G.; Aarninkhof, S. The State of the World’s Beaches. Sci. Rep. 2018, 8, 6641. [Google Scholar] [CrossRef] [PubMed]
- Coco, G.; Senechal, N.; Rejas, A.; Bryan, K.R.; Capo, S.; Parisot, J.P.; Brown, J.A.; MacMahan, J.H.M. Beach response to a sequence of extreme storms. Geomorphology 2014, 204, 493–501. [Google Scholar] [CrossRef]
- González-Villanueva, R.; Costas, S.; Duarte, H.; Pérez-Arluce, M.; Alejo, I. Blowout evolution in a coastal dune: Using GPR, aerial imagery and core records. J. Coast. Res. 2011, 64, 278–282. [Google Scholar]
- Díez, J.; Cohn, N.; Kaminsky, G.M.; Medina, R.; Ruggiero, P. Spatial and Temporal Variability of Dissipative Dry Beach Profiles in the Pacific Northwest, USA. J. Coast. Res. Int. Forum Littoral Sci. 2018, 34, 510–523. [Google Scholar]
- Elsner, P.; Dornbusch, U.; Thomas, I.; Amos, D.; Bovington, J.; Horn, D. Coincident beach surveys using UAS, vehicle mounted and airborne laser scanner: Point cloud inter-comparison and effects of surface type heterogeneity on elevation accuracies. Remote Sens. Environ. 2018, 208, 15–26. [Google Scholar] [CrossRef]
- Hobbs, P.; Gibson, A.; Jones, L.; Pennington, C.; Jenkins, G.; Pearson, S.; Freeborough, K. Monitoring coastal change using terrestrial LiDAR. Geol. Soc. Lond. Spec. Publ. 2010, 345, 117–127. [Google Scholar] [CrossRef]
- Dohner, S.M.; Trembanis, A.C.; Miller, D.C. A tale of three storms: Morphologic response of Broadkill Beach, Delaware, following Superstorm Sandy, Hurricane Joaquin, and Winter Storm Jonas. Shore Beach 2016, 84, 3–9. [Google Scholar]
- Pikelj, K.; Ružić, I.; Ilić, S.; James, M.R.; Kordić, B. Implementing an efficient beach erosion monitoring system for coastal management in Croatia. Ocean Coast. Manag. 2018, 156, 223–238. [Google Scholar] [CrossRef]
- Bi, S.; Zhang, Y.; Bie, J. Monitoring and analysis of beach topographic profiles in the southern Jiaodong Peninsula. Marine Sci. 2015, 39, 71–76. [Google Scholar]
- Zhu, S.B.; Li, Z.Q.; Zhang, Z.Z.; Tong, Z. Morphodynamic states of the straight beach along eastern Leizhou peninsula. Heilongjiang Water Resour. 2015, 1, 24–28. [Google Scholar]
- Sui, L.; Zhang, B. Principle and Trend of Airborne Laser Scanning Remote Sensing. J. Zhengzhou Inst. Surv. Mapp. 2006, 23, 127–129. [Google Scholar]
- Krabill, W.B.; Collins, J.G.; Link, L.E.; Swift, R.N.; Butler, M.L. Airborne laser topographic mapping results. Photogramm. Eng. Remote Sens. 1984, 50, 685–694. [Google Scholar]
- Zhao, H.J.; Shibasaki, R. International Workshop on Urban 3D/Multi-Media Mapping: UM3. J. Jpn. Soc. Photogramm. Remote Sens. 1998, 37, 74–75. [Google Scholar]
- Liu, J.N.; Zhang, X.H. Progress of Airborne Laser Scanning Altimetry. Geomat. Inf. Sci. Wuhan Univ. 2003, 28, 132–137. [Google Scholar]
- Vos, S.; Anders, K.; Kuschnerus, M.; Lindenbergh, R.; Höfle, B.; Aarninkhof, S.; de Vries, S. A high-resolution 4D terrestrial laser scan dataset of the Kijkduin beach-dune system, The Netherlands. Sci. Data 2022, 9, 191. [Google Scholar] [CrossRef] [PubMed]
- Harley, M.D.; Turner, I.L.; Short, A.D.; Ranasinghe, R. Assessment and integration of conventional, RTK-GPS and image-derived beach survey methods for daily to decadal coastal monitoring. Coast. Eng. 2011, 58, 194–205. [Google Scholar] [CrossRef]
- Murfitt, S.L.; Allan, B.M.; Bellgrove, A.; Rattray, A.; Young, M.A.; Ierodiaconou, D. Applications of unmanned aerial vehicles in intertidal reef monitoring. Sci. Rep. 2017, 7, 10259. [Google Scholar] [CrossRef] [PubMed]
- Le Mauff, B.; Juigner, M.; Ba, A.; Robin, M.; Launeau, P.; Fattal, P. Coastal monitoring solutions of the geomorphological response of beach-dune systems using multi-temporal LiDAR datasets (Vendée coast, France). Geomorphology 2018, 304, 121–140. [Google Scholar] [CrossRef]
- Shaw, L.; Helmholz, P.; Belton, D.; Addy, N. Comparison of UAV LiDAR and Imagery for Beach Monitoring. Int. Arch. Photogramm. Remote Sens. Spat. Inf. Sci. 2019, XLII-2/W13, 589–596. [Google Scholar] [CrossRef]
- Sharma, M.; Garg, R.D.; Badenko, V.; Fedotov, A.; Min, L.; Yao, A. Potential of airborne LiDAR data for terrain parameters extraction. Quat. Int. 2021, 575–576, 317–327. [Google Scholar] [CrossRef]
- Bertin, S.; Floc’h, F.; Le Dantec, N.; Jaud, M.; Cancouët, R.; Franzetti, M.; Cuq, V.; Prunier, C.; Ammann, J.; Augereau, E.; et al. A long-term dataset of topography and nearshore bathymetry at the macrotidal pocket beach of Porsmilin, France. Sci. Data 2022, 9, 79. [Google Scholar] [CrossRef] [PubMed]
- Qi, H.S.; Cai, F.; Lei, G.; Cao, H.M.; Shi, F.Y. The response of three main beach types to tropical storms in South China. Mar. Geol. 2010, 275, 244–254. [Google Scholar] [CrossRef]
- White, S.A.; Wang, Y. Utilizing DEMs Derived from LiDAR Data to Analyze Morphologic Change in the North Carolina Coastline. Remote Sens. Environ. 2003, 85, 39–47. [Google Scholar] [CrossRef]
- Turner, I.L.; Harley, M.D.; Drummond, C.D. UAVs for coastal surveying. Coast. Eng. 2016, 114, 19–24. [Google Scholar] [CrossRef]
- Minderhoud, P.S.J.; Coumou, L.; Erkens, G.; Middelkoop, H.; Stouthamer, E. Mekong delta much lower than previously assumed in sea-level rise impact assessments. Nat. Commun. 2019, 10, 3847. [Google Scholar] [CrossRef] [PubMed]
- David, C.G.; Kohl, N.; Casella, E.; Rovere, A.; Ballesteros, P.; Schlurmann, T. Structure-from-Motion on Shallow Reefs and Beaches: Potential and Limitations of Consumer-Grade Drones to Reconstruct Topography and Bathymetr. Coral Reefs 2021, 40, 835–851. [Google Scholar] [CrossRef]
- Ferreira, A.T.S.; Grohmann, C.H.; Ribeiro, M.C.H.; Santos, M.S.T.; Oliveira, R.C.; Siegle, E. Beach Surface Model Construction: A Strategy Approach With Structure-from-Motion Multi-View Stereo. MethodsX 2024, 12, 102694. [Google Scholar] [CrossRef] [PubMed]
- Grohmann, C.H.; Garcia, G.P.B.; Affonso, A.A.; Albuquerque, R.W. Dune Migration and Volume Change from Airborne LiDAR, Terrestrial LiDAR and Structure from Motion-Multi View Stereo. Comput. Geosci. 2020, 143, 104569. [Google Scholar] [CrossRef]
- Xia, D.; Wang, W.; Wu, G.; Cui, J.; Li, F. Coastal Erosion in China. Acta Geogr. Sin. 1993, 48, 468–476. [Google Scholar]
- Chen, J.Y.; Xia, D.X.; Yu, Z.Y.; Cai, F. Brief Introduction of Coastal Erosion in China; Ocean Press: Beijing, China, 2010; pp. 1–405. [Google Scholar]
- Cai, F.; Qi, H.S. Brief Introduction of Chinese Beach Resources; Ocean Press: Beijing, China, 2019; pp. 1–395. [Google Scholar]
- Tong, X.; Shi, L.; Xia, X.; Chen, L.; Jiang, C. Response of sedimentary and geomorphic characteristics to 1211 typhoon on Zhejiang Huangcheng beach. Ocean Eng. 2014, 32, 84–90. [Google Scholar]
- Guo, J.L.; Shi, L.Q.; Tong, X.L.; Zheng, Y.J.; Xu, D.L. The response to tropical storm Nakri and the restoration of Dongsha Beach in Zhujiajian Island, Zhejiang Province. Haiyang Xuebao 2018, 40, 137–147. [Google Scholar]
- Shi, L.Q.; Guo, J.L.; Chen, S.L.; Chang, Y.; Zhang, D.H.; Gong, Z.H. Morphodynamic response of an embayed beach to different typhoon events with varying intensities. Acta Oceanol. Sin. 2023, 42, 51–63. [Google Scholar] [CrossRef]
- Compilation Committee of Gulf Records of China. Gulf Records of China, 5th Volume (Shanghai and the Northern Bays of Zhejiang Province); Ocean Press: Beijing, China, 1992; pp. 1–357. [Google Scholar]
- Lu, X.J.; Dong, C.M.; Li, G. Variations of typhoon frequency and landfall position in East China Sea from 1951 to 2015. Trans. Atmos. Sci. 2018, 41, 433–440. [Google Scholar]
- Urban, R.; Štroner, M.; Línková, L. A New Method for UAV Lidar Precision Testing Used for the Evaluation of an Affordable DJI ZENMUSE L1 Scanner. Remote Sens. 2021, 13, 4811. [Google Scholar]
- Lee, J.M.; Park, J.Y.; Choi, J.Y. Evaluation of Sub-aerial Topographic Surveying Techniques Using Total Station and RTK-GPS for Applications in Macrotidal Sand Beach Environment. J. Coast. Res. 2013, 65, 535–540. [Google Scholar] [CrossRef]
- Fan, Z.P. Research for network RTK real-time positioning based on Beidou CORS. Surv. World 2023, 5, 1–8. [Google Scholar]
- Hou, J.H. Application and Accuracy Analysis of SXCORS Network Based on RTK in Control Survey. Geomat. Spatia Inf. Technol. 2017, 40, 139–144. [Google Scholar]
- Li, X. Research on the application of CORS in surveying and mapping engineering. Geol. Miner. Surv. Mapp. 2020, 3, 116–117. [Google Scholar]
- LAS Committee. Common Lidar Data Exchange Format-LAS Industry Initiative. Available online: http://www.asprs.org/a/society/committees/lidar/lidar_format.html (accessed on 18 July 2023).
- Zhang, W.; Qi, J.; Wan, P.; Wang, H.; Xie, D.; Wang, X.; Yan, G. An Easy-to-Use Airborne LiDAR Data Filtering Method Based on Cloth Simulation. Remote Sens. 2016, 8, 501. [Google Scholar] [CrossRef]
- Sabirova, A.; Rassabin, M.; Fedorenko, R.; Afanasyev, I. Ground Profile Recovery from Aerial 3D LiDAR-based Maps. In Proceedings of the 2019 24th Conference of Open Innovations Association (FRUCT), Moscow, Russia, 8–12 April 2019; pp. 367–374. [Google Scholar]
- Kociuba, W. Different Paths for Developing Terrestrial LiDAR Data for Comparative Analyses of Topographic Surface Changes. Appl. Sci. 2020, 10, 7409. [Google Scholar] [CrossRef]
- Bailey, G.; Li, Y.; McKinney, N.; Yoder, D.; Wright, W.; Herrero, H. Comparison of Ground Point Filtering Algorithms for High-Density Point Clouds Collected by Terrestrial LiDAR. Remote Sens. 2022, 14, 4776. [Google Scholar] [CrossRef]
- Ye, S.; Yan, F.; Zhang, Q.; Shen, D. Comparing the Accuracies of sUAV-SFM and UAV-LiDAR Point Clouds for Topographic Measurement. Arab. J. Geosci. 2022, 15, 388. [Google Scholar] [CrossRef]
- Pricope, N.G.; Halls, J.N.; Mapes, K.L.; Baxley, J.B.; Wu, J.J. Quantitative Comparison of UAS-Borne LiDAR Systems for High-Resolution Forested Wetland Mapping. Sensors 2020, 20, 4453. [Google Scholar] [CrossRef] [PubMed]
- Lague, D.; Brodu, N.; Leroux, J. Accurate 3D comparison of complex topography with terrestrial laser scanner: Application to the Rangitikei canyon (N-Z). ISPRS J. Photogramm. Remote Sens. 2013, 82, 10–26. [Google Scholar] [CrossRef]
- Ma, D.M.; Tian, Z.W.; Zhu, C.Q.; Wang, Y.Z. A Comprehensive Approach to Evaluate Coastal Dune Evolution in Haiyang, China. Front. Mar. Sci. 2024, 11, 1326317. [Google Scholar] [CrossRef]
- Baily, B.; Nowell, D. Techniques for monitoring coastal change: A review and case study. Ocean Coast. Manag. 1996, 32, 85–95. [Google Scholar] [CrossRef]
- Westoby, M.J.; Lim, M.; Hogg, M.; Pound, M.J.; Dunlop, L.; Woodward, J. Cost-effective erosion monitoring of coastal cliffs. Coast. Eng. 2018, 138, 152–164. [Google Scholar] [CrossRef]
- Turner, I.; Harley, M.; Short, A.; Simmons, J.; Bracs, M.; Phillips, M.; Splinter, K. A multi-decade dataset of monthly beach profile surveys and inshore wave forcing at Narrabeen, Australia. Sci. Data 2016, 3, 160024. [Google Scholar] [CrossRef] [PubMed]
- Brooks, S.M.; Spencer, T. Temporal and spatial variations in recession rates and sediment release from soft rock cliffs, Suffolk coast, UK. Geomorphology 2010, 124, 26–41. [Google Scholar] [CrossRef]
- Pardo-Pascual, J.E.; Almonacid-Caballer, J.; Ruiz, L.A.; Palomar-Vázquez, J. Automatic extraction of shorelines from Landsat TM and ETM+ multi-temporal images with subpixel precision. Remote Sens. Environ. 2012, 123, 1–11. [Google Scholar] [CrossRef]
- Anne-Lise, M.; Joanna, B.; Jim, C. Detecting Seasonal Variations in Embryo Dune Morphology Using a Terrestrial Laser Scanner. J. Coast. Res. 2013, 65, 1313–1318. [Google Scholar]
- Feagin, R.; Williams, A.; Popescu, S.; Stukey, J.; Washington-Allen, R.; Williams, A.; Popescu, S.; Stukey, J. The Use of Terrestrial Laser Scanning (TLS) in Dune Ecosystems: The Lessons Learned. J. Coast. Res. 2014, 30, 111–119. [Google Scholar] [CrossRef]
- Pierre, G. Processes and rate of retreat of the clay and sandstone sea cliffs of the northern Boulonnais (France). Geomorphology 2006, 73, 64–77. [Google Scholar] [CrossRef]
- Kushal, A.; Ponce, J. Modeling 3D Objects from Stereo Views and Recognizing Them in Photographs. In Proceedings of the Computer Vision—ECCV 2006, Graz, Austria, 7–13 May 2006; Springer: Berlin/Heidelberg, Germany, 2006; pp. 563–574. [Google Scholar]
- Lin, Y.C.; Cheng, Y.T.; Zhou, T.; Ravi, R.; Hasheminasab, S.M.; Flatt, J.E.; Troy, C.; Habib, A. Evaluation of UAV LiDAR for Mapping Coastal Environments. Remote Sens. 2019, 11, 2893. [Google Scholar] [CrossRef]
- Pitman, S.J.; Hart, D.E.; Katurji, M.H. Application of UAV techniques to expand beach research possibilities: A case study of coarse clastic beach cusps. Cont. Shelf Res. 2019, 184, 44–53. [Google Scholar] [CrossRef]
- Chen, B.J. The application of UAVs LiDAR in the topography survey of coastal flats. Chin. Sci. Technol. Period. Database (Full-Text Version) Eng. Technol. 2022, 7, 125–128. [Google Scholar]
- Westoby, M.J.; Brasington, J.; Glasser, N.F.; Hambrey, M.J.; Reynolds, J.M. ‘Structure-from-Motion’ photogrammetry: A low-cost, effective tool for geoscience applications. Geomorphology 2012, 179, 300–314. [Google Scholar] [CrossRef]
- Tian, Y.; Yin, P.; Jia, Y.G.; Liu, J.Q.; Zhu, Y.M.; Cao, K.; Chen, X.Y. Response of beach characteristics to typhoon “Yagi”: Evidence from Argus video images and on-site measurement. Marine Geology Quat. Geol. 2020, 40, 201–210. [Google Scholar]
- Dong, W.L.; Shao, J.; Wang, W.Y.; Yao, W.W. Study on the beach erosion induced by super typhoons and beach protection. J. Sediment Res. 2021, 46, 42–47. [Google Scholar]
- Hu, T.H.; Li, Z.Q.; Zhu, S.B.; Chen, R.F.; Li, G.C.; Zeng, C.H.; Zhang, H.L. Dynamic variation characteristics of beach profile along southern coast of Qiongzhou Strait. J. Appl. Oceanogr. 2021, 40, 678–687. [Google Scholar]
- Karunarathna, H.; Pender, D.; Ranasinghe, R. The effects of storm clustering on beach profile variability. Mar. Geol. 2014, 348, 103–112. [Google Scholar] [CrossRef]
- Beuzen, T.; Turner, I.L.; Blenkinsopp, C.E.; Atkinson, A.; Flocard, F.; Baldock, T.E. Physical model study of beach profile evolution by sea level rise in the presence of seawalls. Coast. Eng. 2018, 136, 172–182. [Google Scholar] [CrossRef]
- Liu, X.; Kuang, C.P.; Huang, S.C.; He, L.L.; Han, X.J. Modelling and evaluation of beach morphodynamic behavior: A case study of Dongsha Beach in eastern China. Ocean Coast. Manag. 2023, 240, 106661. [Google Scholar] [CrossRef]
- Peng, J.; Cai, F.; Li, G.Q.; Lei, G.; Huang, Y. Response characteristic to the typhoon of sandy beach on the inshore between capes in Fujian. J. Oceanogr. Taiwan Strait 2008, 27, 87–91. [Google Scholar]
- Pardo-Pascual, J.E.; Almonacid-Caballer, J.; Ruiz, L.A.; Palomar-Vázquez, J.; Rodrigo-Alemany, R. Evaluation of storm impact on sandy beaches of the Gulf of Valencia using Landsat imagery series. Geomorphology 2014, 214, 388–401. [Google Scholar] [CrossRef]
- Anthony, E.J. Storms, shoreface morphodynamics, sand supply, and the accretion and erosion of coastal dune barriers in the southern North Sea. Geomorphology 2013, 199, 8–21. [Google Scholar] [CrossRef]
- Guo, J.L. Research of Embayed Beach Morphodynamics under the Impacts of Storm Events with Different Intensity Scales. Ph.D. Thesis, East China Normal University, Shanghai, China, 2022. [Google Scholar]
- Cai, F.; Su, X.Z.; Xia, D.X. Study on the Difference Between Storm Effects of Beaches on Two Sides of the Tropical Cyclone Track—Taking the Responses of Beaches to No.0307 Typhoon Imbudo as an Example. Adv. Mar. Sci. 2004, 22, 436–445. [Google Scholar]
- Komar, P.D. Beach Processes and Sedimentation, 2nd ed.; Prentice Hall, Inc: Englewood Cliffs, NJ, USA, 1998; pp. 1–544. [Google Scholar]
- Morton, R.; Paine, J.G.; Gibeaut, J. Stages and durations of post-storm beach recovery, southeastern Texas Coast, USA. J. Coast. Res. 1994, 10, 884–908. [Google Scholar]
- Cheng, L.; Shi, L.Q.; Xia, X.M.; Tong, X.L. Sedimentation and Recent Morphological Changes at Dongsha Beach, Zhujiajian Island, Zhejiang Province. Mar. Geol. Quat. Geol. 2014, 34, 37–44. [Google Scholar]
Figure 1.
Map of study area. (a) Location of the study area. (b) Satellite image of Tantou Beach from Google Earth on 13 October 2021.
Figure 1.
Map of study area. (a) Location of the study area. (b) Satellite image of Tantou Beach from Google Earth on 13 October 2021.

Figure 2.
Coastal landforms of Tantou Beach: (a) before constructing seawalls; (b) after constructing seawalls.
Figure 2.
Coastal landforms of Tantou Beach: (a) before constructing seawalls; (b) after constructing seawalls.

Figure 3.
(a) Pathways of all typhoons passing the East China Sea and (b) passing at the time (UTC +8) of typhoon Hinnamnor and typhoon Muifa in 2022.
Figure 3.
(a) Pathways of all typhoons passing the East China Sea and (b) passing at the time (UTC +8) of typhoon Hinnamnor and typhoon Muifa in 2022.

Figure 4.
Flow sketch of data survey, processing, and analysis. The red font represented the methods of data processing and analysis. The black font showed every content of data survey, processing, and analysis. The solid arrows showed the flow order of data survey, processing, and analysis. The dashed arrows represented the nodes of using reference points to evaluate LiDAR data accuracy.

Figure 5.
Positions of the measured RTK points in the study area during each measurement.

Figure 6.
Plot of the related count histogram of the differences between the LiDAR point cloud and RTK-GPS data elevations (m) on the seawall of the study area: (a) data obtained on 14 July 2022; (b) data obtained on 27 September 2022; (c) data obtained on 23 February 2023; (d) data obtained on 3 July 2023.

Figure 7.
Plot of the fit with linear regression parameters between DEM and RTK-GPS elevations (m) in the beach area and related count histogram of differences: (a) data obtained on 14 July 2022; (b) data obtained on 27 September 2022; (c) data obtained on 23 February 2023; (d) data obtained on 3 July 2023.

Figure 8.
The spatial distribution of the beach elevation errors in the beach elevation: (a) data obtained on 14 July 2022; (b) data obtained on 27 September 2022; (c) data obtained on 23 February 2023; (d) data obtained on 3 July 2023.
Figure 8.
The spatial distribution of the beach elevation errors in the beach elevation: (a) data obtained on 14 July 2022; (b) data obtained on 27 September 2022; (c) data obtained on 23 February 2023; (d) data obtained on 3 July 2023.

Figure 9.
Consistency of elevation changes between RTK and LIDAR surveys from 14 July 2022 to 27 September 2022: (a) profile L1; (b) profile L2.
Figure 9.
Consistency of elevation changes between RTK and LIDAR surveys from 14 July 2022 to 27 September 2022: (a) profile L1; (b) profile L2.

Figure 10.
Spatial distribution of the elevation change errors for different elevation areas in the beach: (a) data obtained on 14 July 2022; (b) data obtained on 27 September 2022. It shows that the uncertainty for high/low elevation areas is random.
Figure 10.
Spatial distribution of the elevation change errors for different elevation areas in the beach: (a) data obtained on 14 July 2022; (b) data obtained on 27 September 2022. It shows that the uncertainty for high/low elevation areas is random.

Figure 11.
(a–d) UAV aerial photograph images with a spatial resolution of 0.25 × 0.25 m, a sidelap of 40%, and an overlap of 70%. (e–h) DEM products from Tantou Beach.
Figure 11.
(a–d) UAV aerial photograph images with a spatial resolution of 0.25 × 0.25 m, a sidelap of 40%, and an overlap of 70%. (e–h) DEM products from Tantou Beach.

Figure 12.
The relationship between the elevation and the cumulative area of Tantou Beach was observed using UAV LiDAR.
Figure 12.
The relationship between the elevation and the cumulative area of Tantou Beach was observed using UAV LiDAR.

Figure 13.
Dod showing morphodynamic changes in elevation at Tantou Beach according to raster math: (a) from 14 July 2022 to 27 September 2022; (b) from 27 September 2022 to 23 February 2023; (c) from 23 February 2023 to 3 July 2023; (d) from 14 July 2022 to 3 July 2023. The positive values represent siltation, and the negative values represent erosion. To distinguish the impact of elevation change errors on the real erosion and siltation changes, we divided the colour bar with an unequal interval. When the erosion and siltation changes are within the range of −0.05 m to 0.05 m, the elevation change is not regarded as the real erosion and siltation change; when the erosion and siltation changes exceed the range, the elevation change can be regarded as the real erosion and siltation change. TB: Tantou Beach. TB1: the first profile of Tantou Beach. TB1 to TB6 are 6 typical profiles that were selected.

Figure 14.
Bar graph of the area with different erosion and siltation ranges on Tantou Beach (based on Table 6). The positive values represent siltation, and the negative values represent erosion.
Figure 14.
Bar graph of the area with different erosion and siltation ranges on Tantou Beach (based on Table 6). The positive values represent siltation, and the negative values represent erosion.

Figure 15.
Typical profile changes of Tantou Beach during the year.

Figure 16.
Volume changes of Tantou Beach: (a) from 14 July 2022 to 27 September 2022; (b) from 27 September 2022 to 23 February 2023; (c) from 23 February 2023 to 3 July 2023; (d) from 14 July 2022 to 3 July 2023. The positive values represent siltation, and the negative values represent erosion.
Figure 16.
Volume changes of Tantou Beach: (a) from 14 July 2022 to 27 September 2022; (b) from 27 September 2022 to 23 February 2023; (c) from 23 February 2023 to 3 July 2023; (d) from 14 July 2022 to 3 July 2023. The positive values represent siltation, and the negative values represent erosion.


Table 1.
Information of five typhoons passing the East China Sea and affecting the study area in 2022. Hinnamnor and Muifa had a greater impact on the study area.
Table 1.
Information of five typhoons passing the East China Sea and affecting the study area in 2022. Hinnamnor and Muifa had a greater impact on the study area.
| Typhoon | Affecting Time | Affecting Duration (h) | Classification |
|---|---|---|---|
| Aere | 3 July 2022 17:00–4 July 2022 02:00 | 9 | Tropical Storm |
| Songda | 29 July 2022 23:00–31 July 2022 03:00 | 4 | Tropical Storm |
| Trases | 31 July 2022 19:00–1 August 2022 11:00 | 9 | Tropical Storm |
| Hinnamnor | 4 September 2022 23:00–5 September 2022 17:00 | 18 | Super Typhoon |
| Muifa | 14 September 2022 10:00–15 September 2022 03:00 | 17 | Severe Typhoon |
Table 2.
Information on the LiDAR scanner DJI Zenmuse L1.
| Department | Item | Parameter |
|---|---|---|
| LiDAR Scanning Department | LiDAR Wavelength | 905 nm |
| LiDAR Shooting Degree | 0.03° (Horizontal) 0.28° (Vertical) | |
| Return Wave Count Maximum | 3 | |
| Surveying and Mapping Camera | Sensor Size | 1 inch |
| Effective Pixels | 20,000,000 | |
| Photo Size | 5472 × 3648 | |
| Focal Length | 8.8 mm/24 mm | |
| Aperture | f/2.8–f/11 | |
| Photo Format | JPEG | |
| Assistant Position Camera | Resolution | 1280 × 960 |
| FOV | 95° |
Table 3.
Information on the measurement date, the RTK reference points, and the count of the RTK reference points and profiles.
Table 3.
Information on the measurement date, the RTK reference points, and the count of the RTK reference points and profiles.
| Measure Date | Points on the Seawall | Points on the Beach |
|---|---|---|
| 14 July 2022 | 131 | 95 (four profiles) |
| 27 September 2022 | 131 | 199 (four profiles) |
| 23 February 2023 | 131 | 63 (five profiles) |
| 3 July 2023 | 131 | 128 (four profiles) |
Table 4.
Statistics of elevation change errors between LIDAR and RTK surveys.
| Profile Number | Min Error (m) | Max Error (m) | Mean Error (m) | RMSE (m) |
|---|---|---|---|---|
| L1 1 | −0.09 | 0.07 | −0.004 | 0.03 |
| L2 2 | −0.09 | 0.07 | 0.008 | 0.04 |
| Average | −0.09 | 0.07 | 0.002 | 0.035 |
1 L1 count: 22. 2 L2 count: 24.
Table 5.
The statistically different topographical zoned areas of Tantou Beach observed using UAV LiDAR.
Table 5.
The statistically different topographical zoned areas of Tantou Beach observed using UAV LiDAR.
| Elevation (m) | Area (×103 m2) | |||
|---|---|---|---|---|
| 14 July 2022 | 27 September 2022 | 23 February 2023 | 3 July 2023 | |
| 4.0 ~ 4.5 | 4.32 | 4.36 | 5.10 | 4.99 |
| 3.5 ~ 4.0 | 4.01 | 3.70 | 4.18 | 3.89 |
| 3.0 ~ 3.5 | 6.25 | 7.49 | 9.04 | 7.44 |
| 2.5 ~ 3.0 | 17.84 | 13.43 | 16.32 | 23.26 |
| 2.0 ~ 2.5 | 22.05 | 15.74 | 19.89 | 19.51 |
| 1.5 ~2.0 | 26.54 | 21.90 | 26.37 | 21.08 |
| 1.0 ~ 1.5 | 31.55 | 28.10 | 31.60 | 27.93 |
| 0.5 ~ 1.0 | 33.11 | 38.49 | 31.19 | 30.88 |
| 0 ~ 0.5 | 26.90 | 41.85 | 29.78 | 28.84 |
| −0.5 ~ 0 | 24.34 | 39.99 | 28.72 | 27.60 |
| −1.0 ~ −0.5 | 29.63 | 31.65 | 28.23 | 34.22 |
| −1.5 ~ −1.0 | 28.02 | 23.43 | 28.87 | 25.90 |
| −2.0~ −1.5 | 29.74 | 4.90 | 8.93 | 25.79 |
| −2.5 ~ −2.0 | 12.08 | 3.99 | ||
| Total | 296.37 | 275.02 | 268.22 | 285.32 |
Table 6.
The statistical area of different erosion and siltation ranges for Tantou Beach. To explore more detailed areas of erosion and siltation change, we used an interval of 0.2 m in elevation to divide erosion and siltation change zones and then calculated their area. The positive values represent siltation, and the negative values represent erosion.
| Erosion and Siltation Range (m) | Area (×103 m2) | |||
|---|---|---|---|---|
| 14 July 2022 to 27 September 2022 | 27 September 2022 to 23 February 2023 | 23 February 2023 to 3 July 2023 | 14 July 2022 to 3 July 2023 | |
| more than 1.0 | 0.02 | 0.10 | 0.13 | 0.15 |
| 0.8 ~ 1.0 | 0.02 | 0.14 | 0.10 | 0.09 |
| 0.6 ~ 0.8 | 1.57 | 0.87 | 0.31 | 0.15 |
| 0.4 ~ 0.6 | 21.33 | 10.58 | 2.47 | 0.48 |
| 0.2 ~ 0.4 | 50.65 | 75.41 | 12.69 | 27.29 |
| 0 ~ 0.2 | 53.84 | 95.93 | 89.56 | 125.70 |
| −0.2 ~ 0 | 63.93 | 35.32 | 123.06 | 87.81 |
| −0.4 ~ −0.2 | 69.53 | 27.43 | 36.70 | 36.84 |
| −0.6 ~ −0.4 | 9.20 | 11.26 | 2.97 | 5.90 |
| −0.8 ~ −0.6 | 3.87 | 9.24 | 0.10 | 0.25 |
| −1.0 ~ −0.8 | 0.51 | 0.26 | 0.04 | 0.06 |
| less than −1.0 | 0.08 | 0.06 | 0.04 | 0.07 |
Disclaimer/Publisher’s Note: The statements, opinions and data contained in all publications are solely those of the individual author(s) and contributor(s) and not of MDPI and/or the editor(s). MDPI and/or the editor(s) disclaim responsibility for any injury to people or property resulting from any ideas, methods, instructions or products referred to in the content. |
© 2024 by the authors. Licensee MDPI, Basel, Switzerland. This article is an open access article distributed under the terms and conditions of the Creative Commons Attribution (CC BY) license (https://creativecommons.org/licenses/by/4.0/).
Share and Cite
MDPI and ACS Style
Lei, Q.; Wang, X.; Liu, Y.; Guo, J.; Cai, T.; Xia, X. Monitoring Change and Recovery of an Embayed Beach in Response to Typhoon Storms Using UAV LiDAR. Drones 2024, 8, 172. https://0-doi-org.brum.beds.ac.uk/10.3390/drones8050172
AMA Style
Lei Q, Wang X, Liu Y, Guo J, Cai T, Xia X. Monitoring Change and Recovery of an Embayed Beach in Response to Typhoon Storms Using UAV LiDAR. Drones. 2024; 8(5):172. https://0-doi-org.brum.beds.ac.uk/10.3390/drones8050172
Chicago/Turabian StyleLei, Qiujia, Xinkai Wang, Yifei Liu, Junli Guo, Tinglu Cai, and Xiaoming Xia. 2024. "Monitoring Change and Recovery of an Embayed Beach in Response to Typhoon Storms Using UAV LiDAR" Drones 8, no. 5: 172. https://0-doi-org.brum.beds.ac.uk/10.3390/drones8050172