Article

Investigation into the Failure Characteristics and Mechanism of Rock with Single Elliptical Defects under Ultrasonic Vibrations

by
Zhijun Niu
,
Xufeng Wang
*,
Lei Zhang
,
Jiyao Wang
,
Zechao Chang
,
Chenlong Qian
and
Xuyang Chen
School of Mines, Jiangsu Engineering Laboratory of Mine Earthquake Monitoring and Prevention, China University of Mining and Technology, Xuzhou 221116, China
*
Author to whom correspondence should be addressed.
Submission received: 13 March 2024 / Revised: 29 March 2024 / Accepted: 23 April 2024 / Published: 27 April 2024
(This article belongs to the Special Issue Applications of Fractal Analysis in Underground Engineering)

Abstract

:
In order to investigate the effects of elliptical defects on rock failure under ultrasonic vibrations, ultrasonic vibration tests and PFC2D numerical simulations were conducted on rocks with single elliptical defects. The research results indicated that the fracture fractal dimension, axial strain, and crack depth of specimens with elliptical defects at 45° and 90° were the smallest and largest, respectively. The corresponding strain and fractal dimension showed a positive linear and logarithmic function relationship with time. The maximum crack depth of 46.50 mm was observed on the specimens with an elliptical defect angle of 90°. Specimens with elliptical defects at 0°, 30°, 75°, and 90° exhibited more dense and frequent acoustic emission events than those with elliptical defects at 15°, 45°, and 60°. During the ultrasonic vibration process, the maximum total energy (87.86 kJ) and energy consumption coefficient (0.963) were observed on specimens with elliptical defect angles of 30° and 45°, respectively. The difference in the stress field led to varying degrees of plastic strain energy in the specimens, resulting in different forms of crack propagation and triggering differential acoustic emission events, ultimately leading to specimen failure with different crack shapes and depths. The fractal dimensions of elliptical defect specimens under ultrasonic vibration have a high degree of consistency with the changes in axial strain and failure depth, and the fractal dimension of defect specimens is positively correlated with the degree of failure of defect specimens.

1. Introduction

With the continuous increase in the coal mining scale, easily exploitable resources with shallow burial depths and good geological conditions are gradually depleting [1]. Currently, most coal mining is occurring at greater depths, and coal rock masses in deep environments exist in complex environments with high pressure, high temperature, and high permeability [2], making rock masses more prone to damage and instability [3]. In order to ensure the long-term stability of underground rock mass engineering, more and more tunnels are being arranged in hard rock layers, further increasing the difficulty of rock mass engineering excavation. The construction methods for deep hard rock strata tunnels mainly include mechanized excavation methods and drilling and blasting methods, each facing difficulties such as severe tool wear [4], high equipment failure rates [5], slow drilling speeds [6], low blasting efficiency [7], and a large loss of machinery and materials [8], resulting in a tense situation of mining and replacement. Therefore, in order to improve the excavation speed of deep hard rock strata tunnels and solve the problem of tight mining replacement, developing new and efficient rock-breaking technologies is urgent [9]. Since its discovery in the 1830s, ultrasound has been widely used in fields such as chemical engineering [10], medicine [11], and petroleum [12] due to its advantages of good directionality, strong penetration ability, and energy concentration, providing new ideas and methods for the efficient excavation of hard rocks. In recent years, scholars have conducted extensive research on ultrasonic vibration crushing hard rocks, and the results show that ultrasonic vibration can effectively crush hard rocks [13], indicating the feasibility of this ultrasonic vibration technology in the field of deep hard rock crushing. As a complex natural material, underground rock masses often have varying degrees, scales, and shapes of cracks, pores, and other defects due to their extremely long geological tectonic processes [14], which have a significant impact on the strength and crack propagation of rock masses [15]. The defects present in natural rock masses are complex and cannot be simplified into simple crack-like or pore-like defects. In actual underground rock engineering, elliptical defects are a common type of defect. Scholars have conducted extensive research on the ultrasonic vibration rock-breaking of intact rock samples [16], but no relevant experimental studies have been conducted on defective rocks. In the actual rock-breaking process of underground rock masses, future ultrasonic vibration faces the technical challenge of effectively improving the excavation speed of natural rock masses containing complex defects. Therefore, studying the failure characteristics and mechanisms of rocks with elliptical defects under ultrasonic vibration has significant practical significance for improving the excavation speed of underground complex defect rock masses and solving the problem of tight mining replacement.
(1)
The impact characteristics of ultrasonic vibration on rock drilling, rock failure, and defects on rock failure under conventional loading methods have been studied by many researchers. The impact characteristics of ultrasonic vibration on rock drilling have been studied. Wiercigroch M [17] from the University of Aberdeen first introduced ultrasonic vibration technology into drilling and found that the high-amplitude force generated by ultrasonic vibration was the main reason for improving drilling speed. NASA designed a planetary exploration ultrasonic drilling specimen with high axial force and analyzed the interaction between the sensors, free mass, drill bits, and rocks [18]. Li Siqi et al. [19] clarified the vibration characteristics of rocks under harmonic impact and found that harmonic vibration impact drilling could greatly increase the amplitude of rocks and further improve drilling speed. Fernando P et al. [20] conducted experimental research on the rotational ultrasonic machining of rocks and found that the cutting force of rotational ultrasonic machining was significantly reduced, and the drilling speed was increased by about three times. Wiercigroch M et al. [21] conducted ultrasonic impact drilling research on common underground rocks and found that high-frequency axial vibration significantly improved the drilling speed.
(2)
The process and mechanism of rock failure under ultrasonic vibration have been explored by many researchers. Zhao Dajun et al. [22] revealed the cracking mechanism of rock cracks under ultrasonic vibration, finding that ultrasonic vibration can effectively promote the development of microcracks in granite samples. Zhao Dajun et al. [23] found that fatigue damage caused by ultrasonic vibration and thermal damage caused by temperature increases are the main factors causing granite fracture. Zhou Yu et al. [24], through indoor experiments and numerical simulations, concluded that under ultrasonic vibration, cracks will initiate and propagate when the internal tensile stress exceeds the rock’s strength limit, ultimately leading to rock fragmentation. Zhang Cheng et al. [25] studied the effects of the main loading parameters, such as confining pressure, vibration frequency, and static pressure, on the damage of granite specimens, revealing the mechanism of rock failure under different loading parameters. Wang Jiyao et al. [26] compared the performance of uniaxial compression loading and ultrasonic vibration technology in rock damage and found that ultrasonic vibration technology exhibits higher rock failure ability. Wang Xufeng et al. [27] revealed the failure mechanism of rocks under ultrasonic action, verifying the effectiveness and reliability of ultrasonic rock fragmentation. Zhang Lei et al. [28] discovered that the strain curve of rock samples under ultrasonic vibration excitation can be divided into the compaction stage, elastic deformation stage, and damage stage. Static load can accelerate crack initiation and propagation and improve the utilization rate of rock fragmentation energy. Zhang Lei et al. [29] found that ultrasonic vibration significantly reduces the compressive strength and elastic modulus of red sandstone, resulting in microcrack aggregation occurring at the edge area of the contact surface between the actuator and the rock.
(3)
References related to the impact of defects on rock failure characteristics were found. The studies investigated the failure characteristics of rocks with single [30], multiple [31], and pore-like defects [32]. Elliptical defects are common and complex fracture types found in natural rock masses [33]. Han Zhenyu et al. [34] conducted dynamic uniaxial compression tests on sandstone specimens containing double elliptical inclusions with different inclination angles and found that as the defect inclination angle increased, the influence of the inclusions on the final failure mode became very small. Chen Shaojie et al. [35] established two models of vertical and horizontal crack hole combinations and studied the failure modes, mechanical behaviors, and stress states of elliptical hole crack combination models with different long and short-axis ratios before and after crack generation. Yang Shengqi et al. [36], through indoor experiments and numerical simulations, revealed the strength, deformation, and crack evolution behavior of sandstone containing a single elliptical defect under uniaxial compression. Tao Ming [37] conducted SHPB tests on granite diorite with elliptical defects, revealing its dynamic response and fatigue behavior.
In this study, an ultrasonic vibration device, fractal theory, digital image correlation method, and PFC2D numerical simulation software (5.00) were used to clarify the influence characteristics of the elliptical defect angle on the fractal dimension of specimen cracks, and the relationships between the elliptical angles, strain behaviors, and failure depths of defective specimens were obtained. The acoustic emission, energy evolution, and stress field distribution characteristics of the specimens containing single elliptical defects were analyzed and discussed, and the relationship between the fractal dimension and failure characteristics of the elliptical defect specimens was revealed, which were of great significance for efficient excavation in elliptical defect rock masses.

2. Experimental Program

This section elaborates on the preparation and related parameters of the elliptical defect specimens, introduces the composition and loading principle of ultrasonic vibration devices, and constructs a digital image monitoring system.

2.1. Specimens Preparation

Hard rock from a certain coal mine was selected as the testing specimen. After preparation, the length and height of the rock specimen were 50 mm and 100 mm, respectively. The distance between the center of the elliptical defect and the upper end of the rock specimen was 1/3 of the height. The long axis 2a and short axis 2b of the elliptical defect were 18 mm and 6 mm, respectively. The angle between the long axis of the ellipse and the horizontal line was α. An example of specimens with a single elliptical defect and its loading method are shown in Figure 1. There were a total of 21 defective samples in the experiment, and the center position, major axis, and minor axis of the elliptical defects in all defective samples (SE01–SE21) were the same, with only the included angle α different. Each elliptical defect angle was α, which had three corresponding samples. The elliptical defect angles corresponding to the SE01–SE03, SE04–SE06, SE07–SE09, SE10–SE12, SE13–SE15, SE16–SE18, and SE19–SE21 samples α were 0°, 15°, 30°, 45°, 60°, 75°, and 90°, respectively. The arrangements of the testing programs are displayed in Table 1.

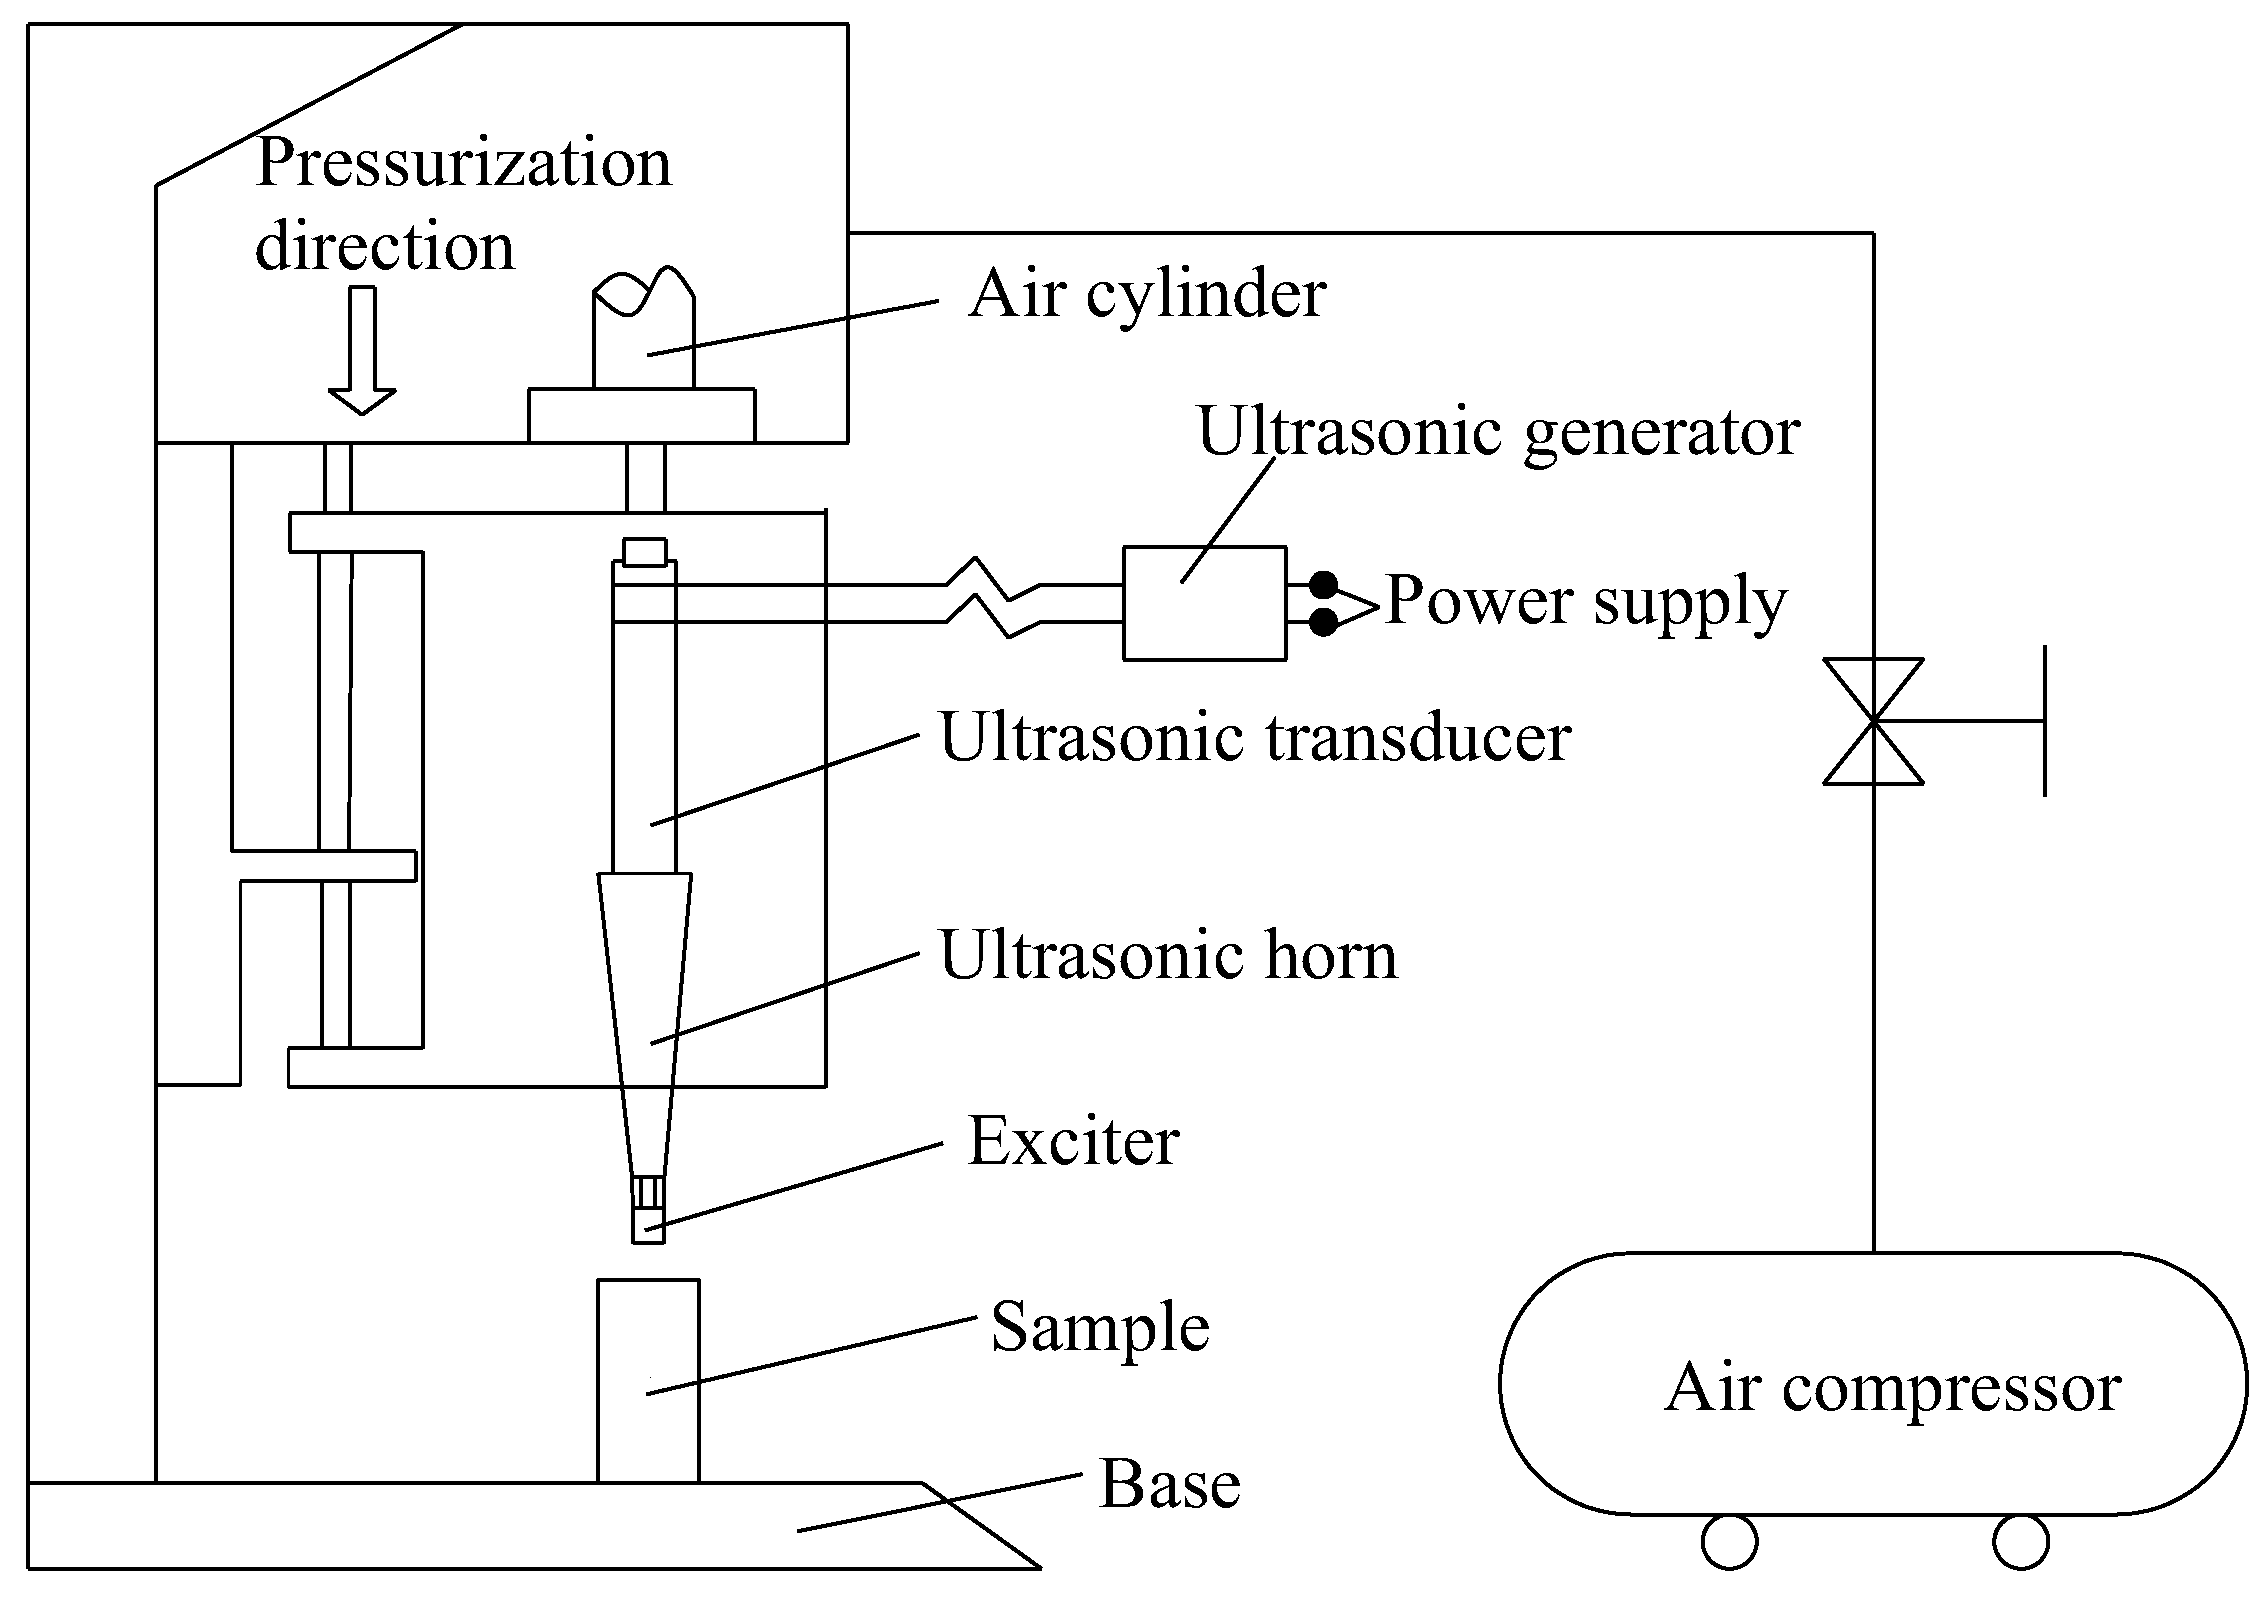
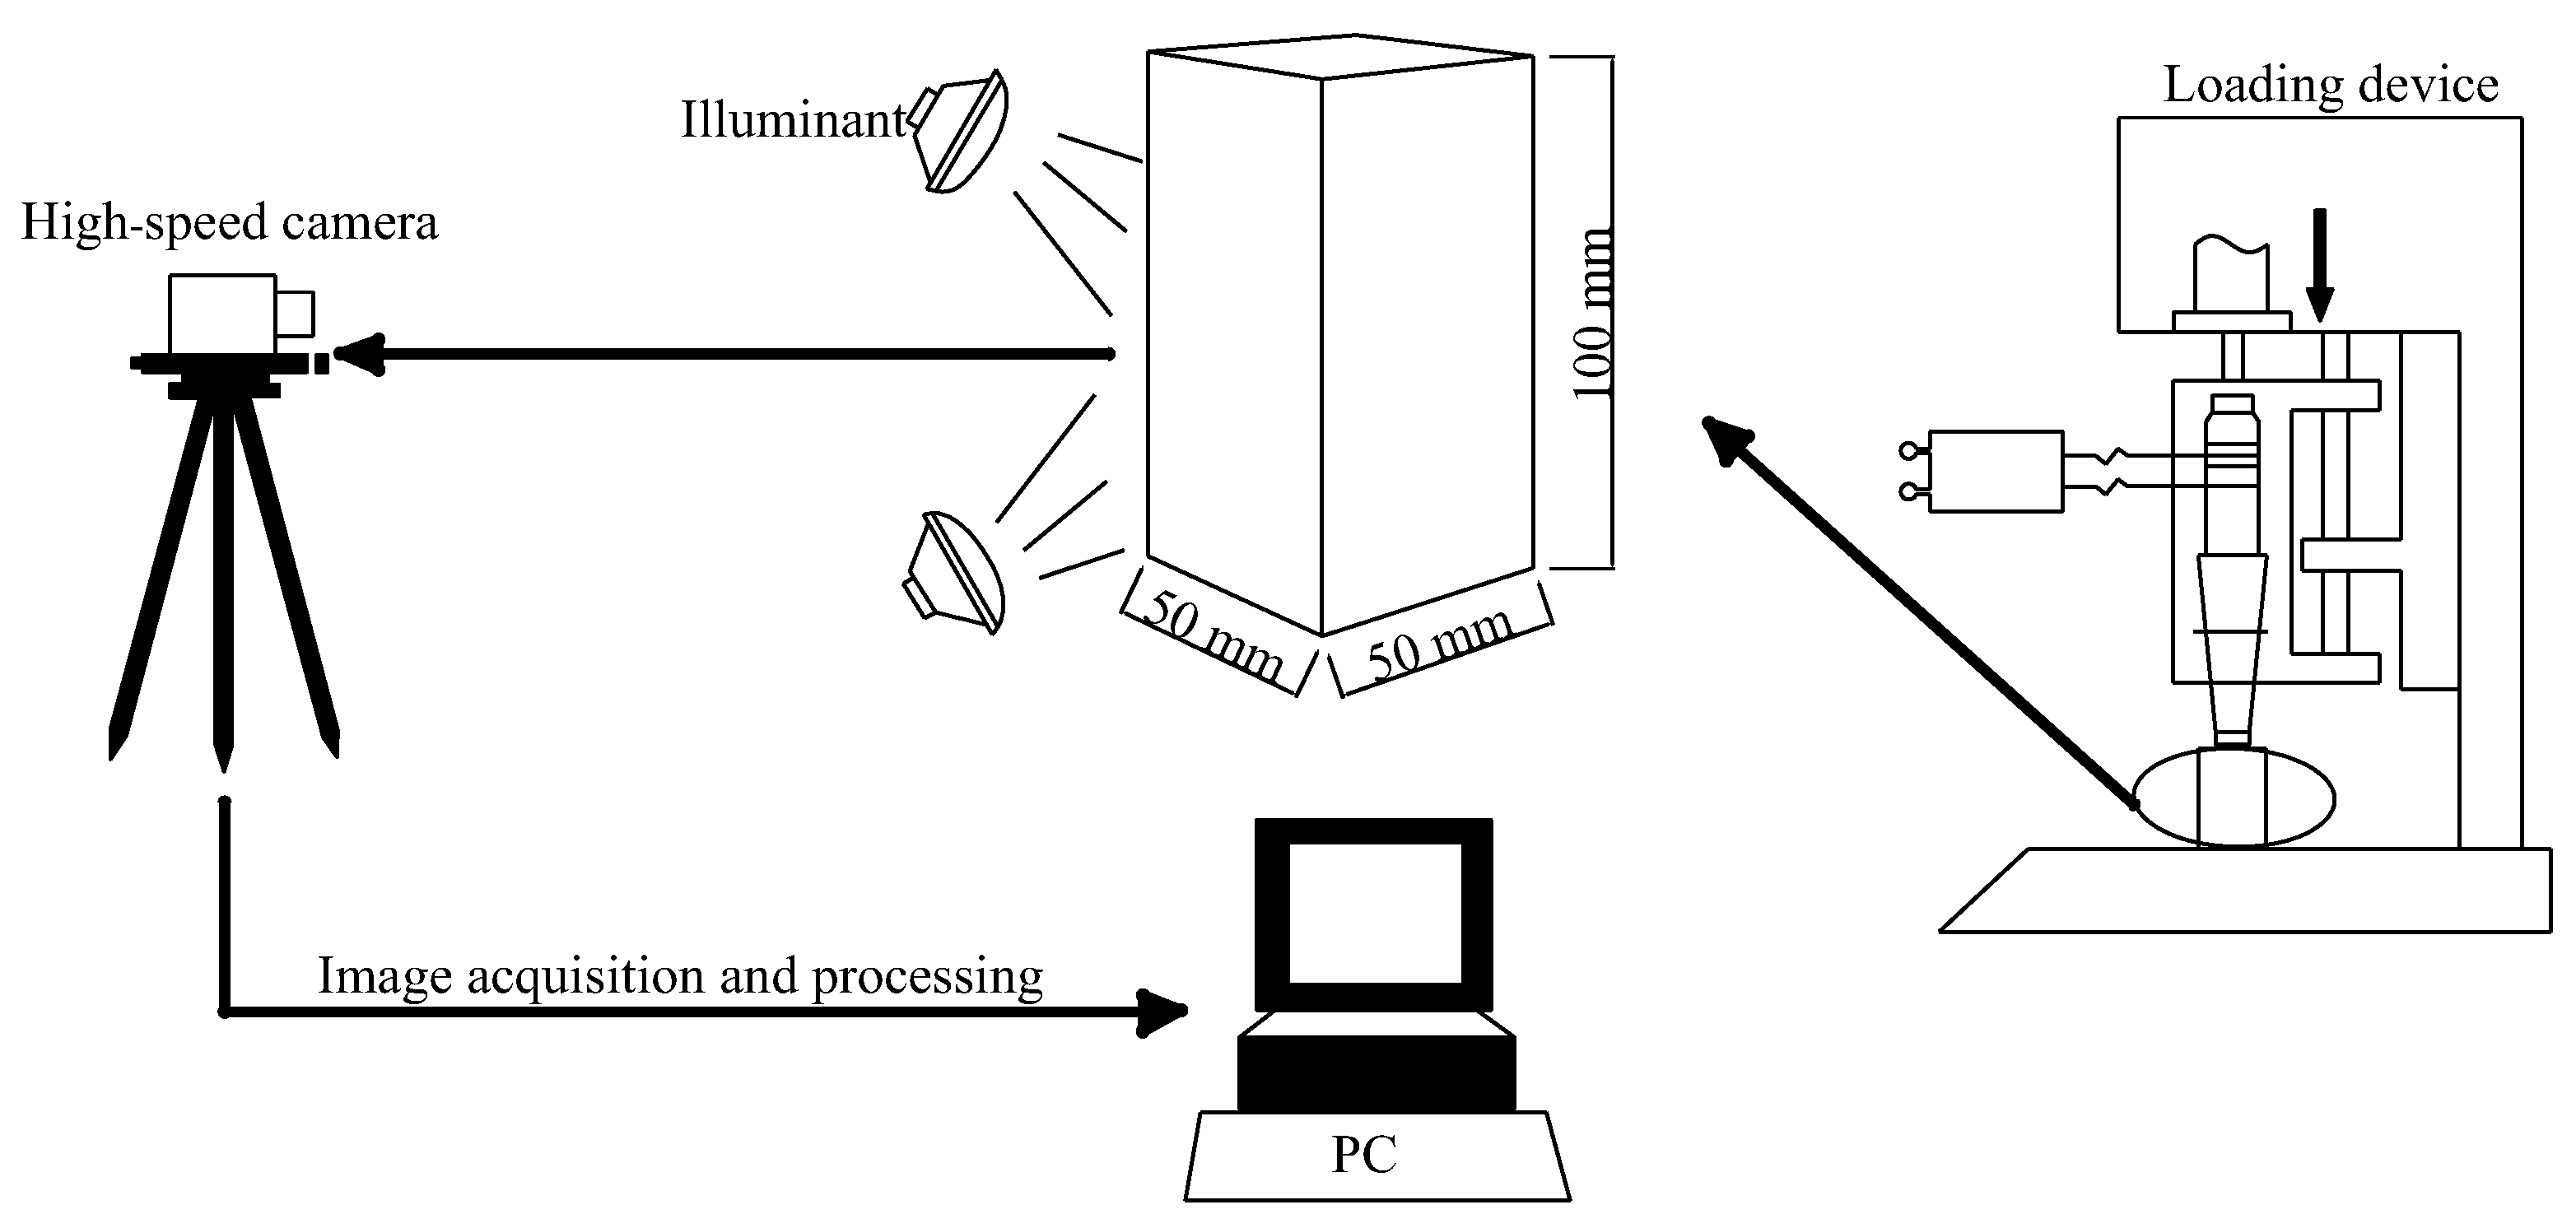
2.2. Sample Testing System

The ultrasonic vibration excitation equipment mainly consisted of an experimental platform and a pressure supply device. The experimental platform included an ultrasonic generator, transducer, amplitude lever, exciter, power supply, pressure cylinder, and base. The pressure supply device was connected to an air compressor. The ultrasonic vibration excitation equipment operated at a frequency of 20 kHz, with a power of 1500 W, and an amplitude of 70 μm. The working principle of the ultrasonic vibration excitation equipment was as follows: after the ultrasonic vibration excitation equipment is powered on, the ultrasonic generator converts the AC power into high-frequency electrical signals, which are processed through a piezoelectric ceramic ultrasonic transducer to convert into mechanical energy. The amplitude lever increases the mechanical vibration, and the air compressor and pressure cylinder provide axial static load force to the equipment. Finally, the exciter acts on the rock sample, causing rock failure. The ultrasonic vibration excitation equipment is shown in Figure 2.
The digital image correlation method was used to monitor the strain characteristics of the specimens with single elliptical defects during the ultrasonic vibration tests. In order to enhance the visibility of the digital image system, the surfaces of the defective specimens were manually polished with 60 mesh, 120 mesh, 240 mesh, 360 mesh, 600 mesh, and 1200 mesh sandpaper in sequence and then cleaned with alcohol cotton pads. White matte paint was evenly sprayed on the surface of the specimens. Once the paint naturally dried, a speckle tool was used to create speckles on the test surface. During the experiment, a stable white light source was used to supplement the illumination of the specimens. The specimen preparation process and the full-field strain platform are shown in Figure 3 and Figure 4, respectively.

3. Test Results and Failure Characteristics

In this section, the digital image correlation (DIC) method was used to monitor the strain evolution characteristics of the elliptical defect samples at different angles under ultrasonic vibration. The fractal characteristics of the cracks and failure depths of the samples were studied, and the axial strain, fractal dimension, and minimum and maximum failure depths of the elliptical defect samples at different angles were determined to be 45° and 90°, respectively.

3.1. Strain Behavior

The digital image correlation (DIC) method was used to monitor the axial strain of samples with different elliptical defects during ultrasonic vibration. Significant differences were observed in the axial strain of samples with different elliptical defect angles. The minimum and maximum axial strains at the moment of crack penetration were obtained, which were 45° and 90° for the elliptical defect samples, respectively.
Deformation control maps were created using the specimen speckle patterns at different times during the test: complete time (11.99 × 10⁶ µs), crack initiation time (29.12 × 10⁶ µs), crack propagation time (37.55 × 10⁶ µs), and crack penetration time (60.20 × 10⁶ µs). To mitigate the impact of speckle shedding caused by specimen damage during ultrasonic vibration on the precision of strain monitoring, a large number of speckles were captured at the moment of crack breakthrough. The strain field distribution characteristics of specimens with different ellipse defect angles at the crack penetration time are shown in Figure 5. It is important to note that the tensile strain is represented as positive, while the compressive strain is negative.
From Figure 5, it is evident that the location and degree of the strain concentration in specimens with different angles of elliptical defects were quite different at the moment of crack penetration. The strain concentration bands of specimens with an angle of elliptical defect at 0° extended from the top of the specimen to the elliptical defect as well as along the two long sides of the specimen. The strain concentration bands with angles of elliptical defects at 30° and 75° were from the top of the specimen to the elliptical defect and the right long side of the specimen, while they were from the top of the specimen to the left long side of the specimen for elliptical defects at 15° and 90°. The strain concentration bands of the specimens with 45° elliptical defects were from the middle of the upper part towards the elliptical defect as well as the right of the upper part, while for 60° elliptical defects, they extended from the left of the upper part to the upper part of the elliptical defect. The experimental results showed that with an increase in the elliptical defect angle, the axial strain of the specimen decreased first, then increased, and then remained constant with a final increase observed. The minimum and maximum axial strains at the crack penetration time were 45° and 90°, and the corresponding strain values were 0.01 and 0.019, respectively.
In order to study the influence of elliptical defect angles on the strain during the failure process, the specimens with elliptical defect angles of 45° and 90° were selected for analysis, and their corresponding axial strain evolution features are shown in Figure 6. From Figure 6a, the axial strain of the specimen with a 45° elliptical defect angle initially concentrated near the upper right corner of the elliptical defect, then produced the strain concentration bands near the middle top of the specimen to the middle upper part of the ellipse. The maximum axial strain increased from 0.0045 to 0.01. As can be seen from Figure 6b, the axial strain of the specimen with an elliptical defect of 90° initially concentrated near the middle left of the elliptical defect, and then the strain concentration bands were produced near the left edge of the top and from the right of the top to the upper edge of the ellipse. The maximum axial strain increased from 0.0075 to 0.019.
The axial strain evolution curves of the specimens with elliptical defect angles at 45° and 90° were obtained by extracting the corresponding strain values at four typical moments in the process of ultrasonic vibration, as shown in Figure 7. As can be seen in Figure 7, with the continuous excitation of ultrasonic vibration, the axial strain of specimens with elliptical defect angles at 45° and 90° increased steadily. Under the two angles, the axial strain of the specimen with an elliptical defect angle had a positive linear relationship with ultrasonic vibration time, and the increasing rate of the axial strain with the 90° elliptical defect was greater than that of the 45° defect. The axial strains of specimens with elliptical defect angles at 45° and 90° were 0.01 and 0.019, respectively. The axial strain of the specimens with 90° elliptical defects was around twice that of the specimens with the 45° defect.

3.2. Fractal Characteristics

Using Matlab software (R2018a) and the FracLab toolbox (the box dimension method), the development characteristics of the cracks in the samples with elliptical defects under ultrasonic vibration were studied. The significant influence of the elliptical defect angle on the fractal dimension of cracks in the defective samples was mastered, and the fractal dimensions of samples with elliptical defect angles of 45° and 90° were found to be the smallest and largest, respectively.
The fractal theory can quantitatively describe the distribution of complex fractures, which is helpful in revealing the fracture development and failure mechanism of rock mass. The box dimension method is one of the most commonly used methods for calculating the fractal dimension of images. Because of its easy empirical estimation and simply programmed calculation, it has been widely used in the field of rock mechanics. Therefore, in order to discern the influencing characteristics of elliptical defects on the fracture development of samples under ultrasonic vibration and improve the failure excavation speed of defective rock masses under ultrasonic vibration, this section uses the box dimension method to calculate the fracture fractal dimension of samples with different elliptical defect angles.
The square boxes with the lengths δ i and δ i + 1 were used to cover the graphs for calculating the fractal dimension, and the total numbers of boxes are Ni and Ni+1, respectively. The theory of the box dimension is shown in Equation (1).
N i + 1 N i = ( δ i + 1 δ i ) D
By constantly changing the length δ i of the square box covered in the image, the corresponding total number of boxes is N ( δ ) . The relationship between the two and the fractal dimension D is shown in Equation (2).
N ( δ ) ~ δ D
Let N ( ε ) be the minimum number of squares covering all fractures, and the square size is ( ε × ε ). The log2N(δ)-log2δ double logarithmic curve of the above relationship is plotted. The fractal dimension D is defined as the negative number of the slope of the curve, and the fractal dimension is shown in Equation (3).
N ( δ ) ~ δ D
The impact of the elliptical defect angle on the fractal dimension of fractures was analyzed using MATLAB software and the FracLab toolbox (box dimension method), with the findings presented in Figure 8. From the figure, it’s evident that the fractal dimension of cracks in specimens varied significantly depending on the elliptical defect angle at the moment of crack penetration. The trend of the fractal dimension exhibited an initial decrease, followed by an increase, then another decrease, and finally a continuous increase. Specifically, the fractal dimension of fractures ranged from 1.20 to 1.30. Notably, the fractal dimension was smallest (1.14) at the elliptical defect angle of 45° and largest (1.30) at 90°. This pattern suggests that the degree of fracture development differed among specimens, with the smallest degree observed at an elliptical defect angle of 45° and the largest at 90°. This variation can be attributed to the structural differences in specimens with different elliptical defect angles, leading to distinct stress field distributions under ultrasonic vibration.
In order to analyze the evolution of the fractal dimension of cracks during ultrasonic vibration, specimens with elliptical defect angles of 45° and 90°, representing the minimum and maximum fractal dimensions, were selected for study. The relevant evolutionary characteristics are depicted in Figure 9. From the figure, it’s evident that the fractal dimension of cracks continuously increased during the evolution process of crack initiation, propagation, and penetration for specimens at elliptical defect angles of 45° and 90°. Specifically, the fractal dimension of the specimens at these angles showed linear and logarithmic correlations with ultrasonic vibration time. The fractal dimension of the cracks increased from 1.07 to 1.14 for the 45° angle specimens and from 1.07 to 1.30 for the 90° angle specimens. This represents a 14.04% increase in the fractal dimension at the elliptical defect angle of 90° compared to that at 45° at the moment of crack penetration.

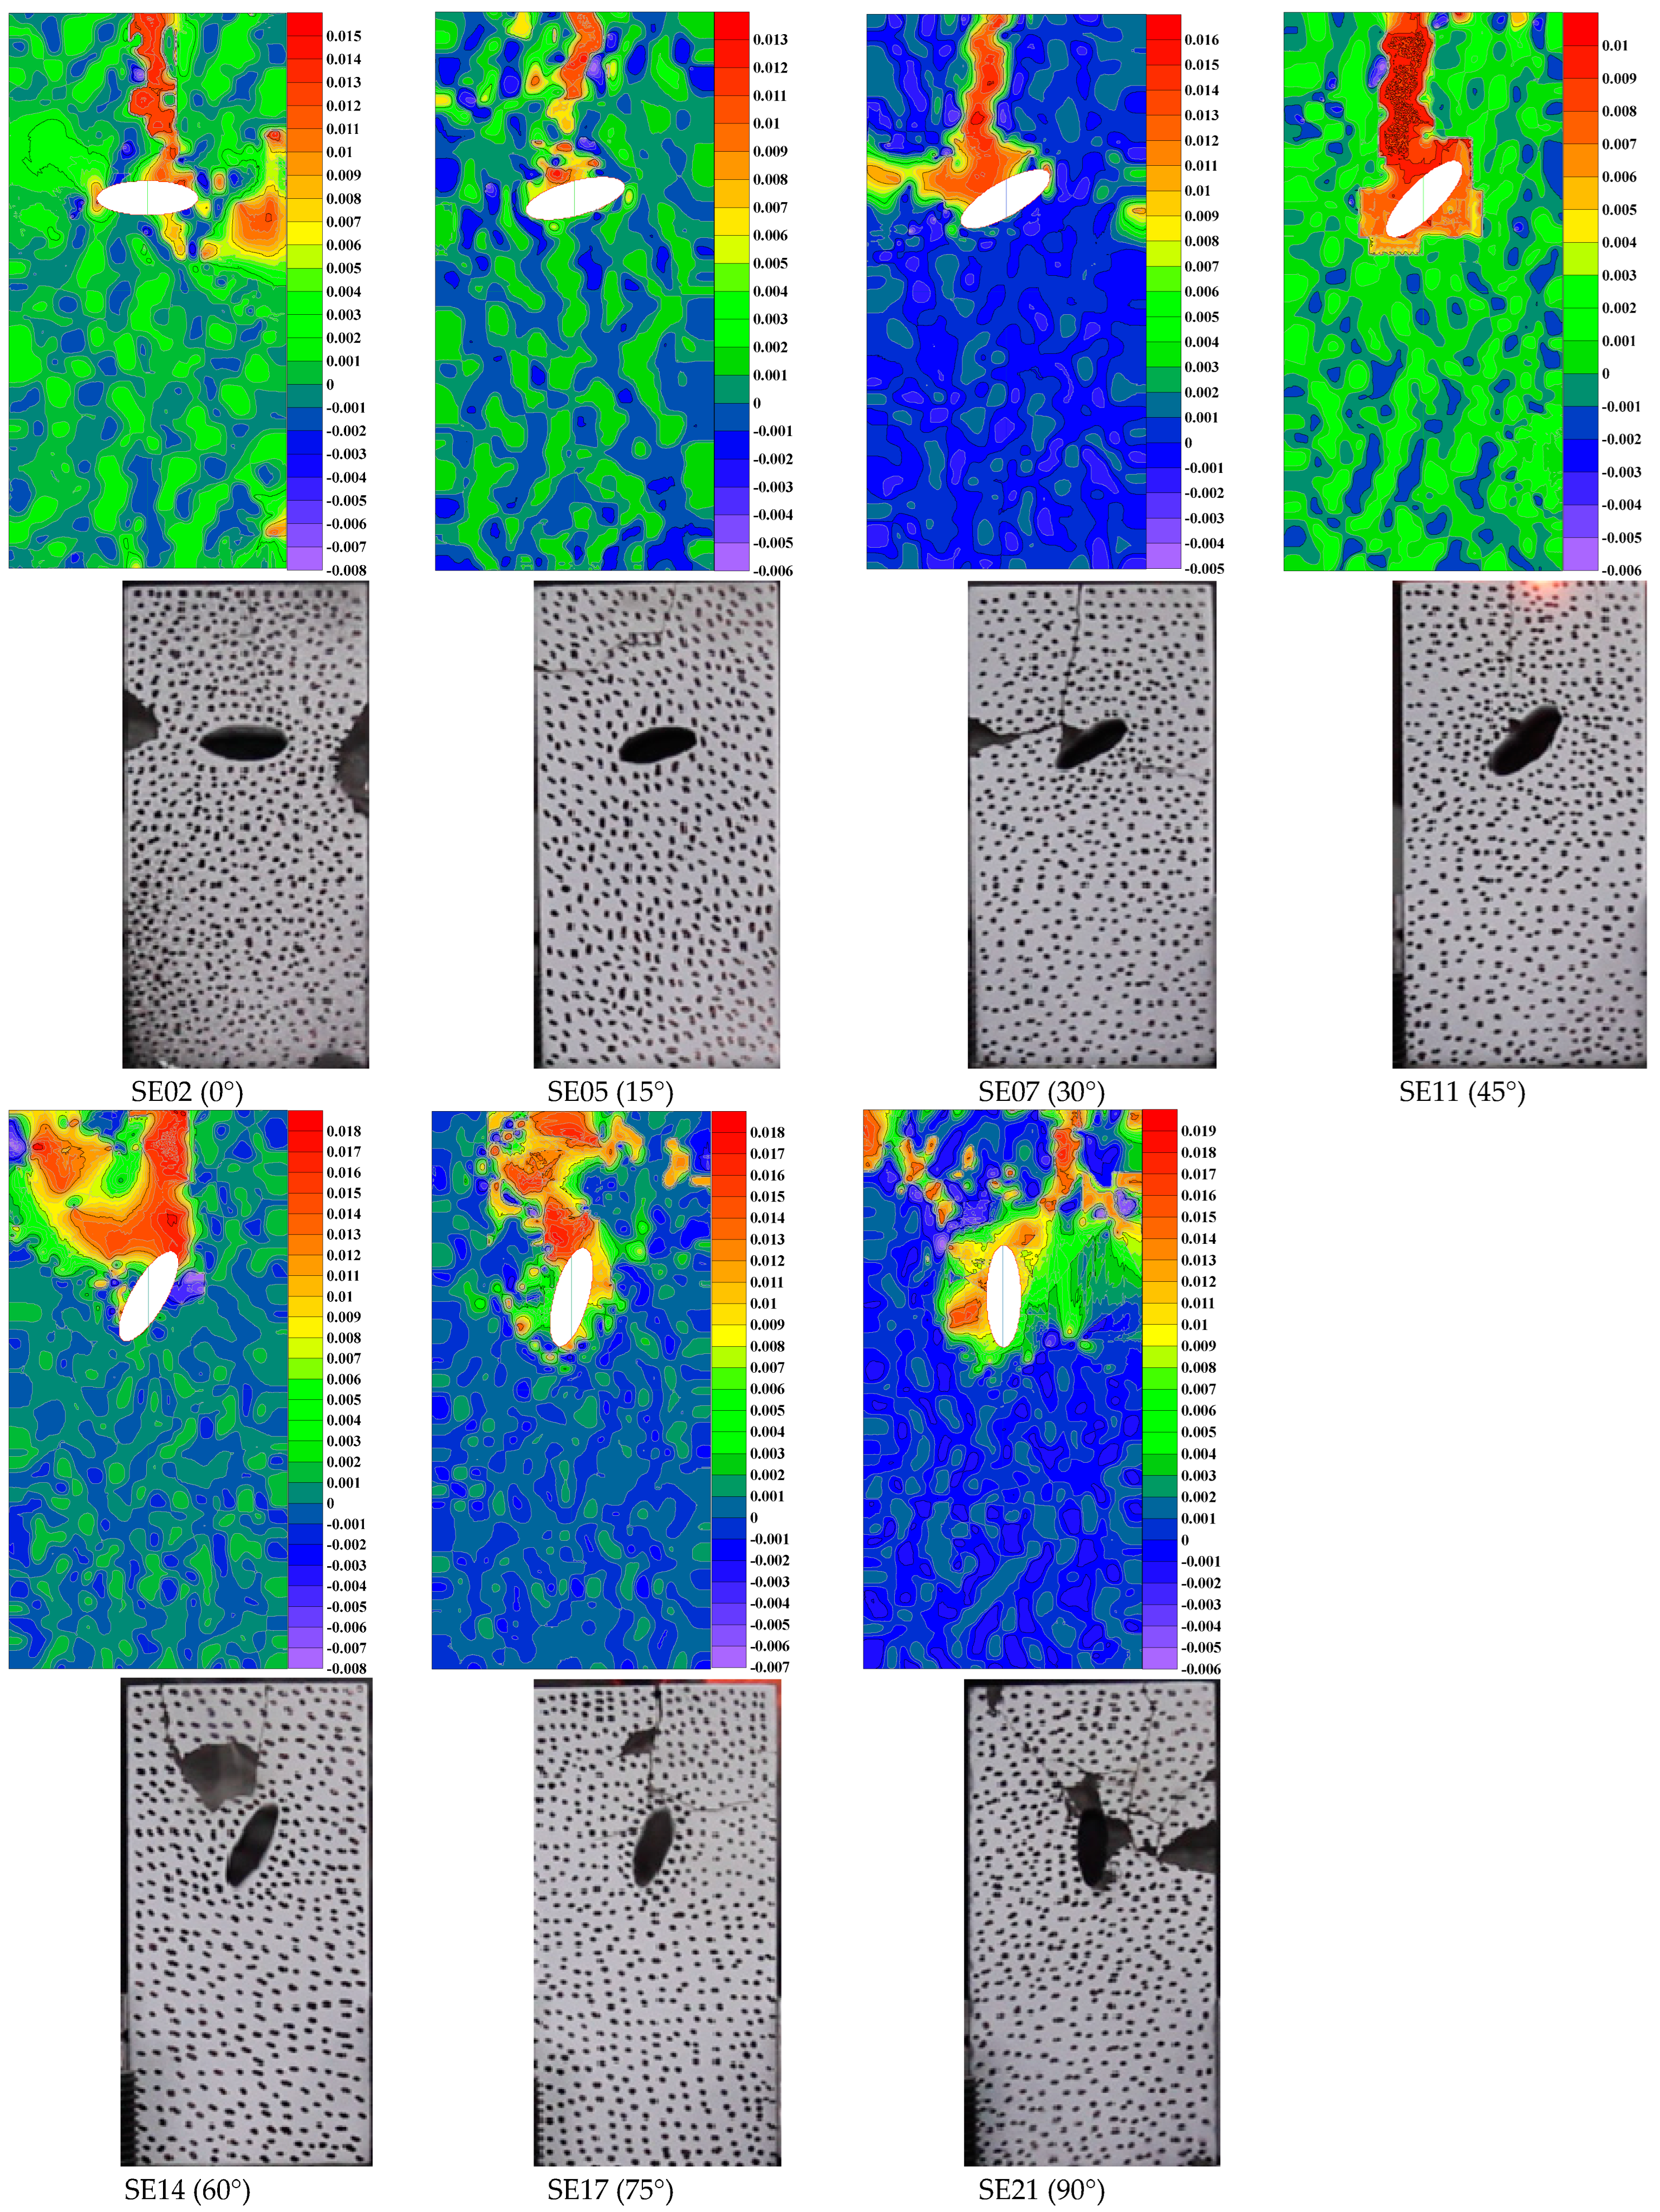
3.3. Failure Characteristics

The failure depths of samples with different elliptical defect angles under ultrasonic vibration were measured using a vernier caliper. It was found that there were significant differences in the failure depths of samples with different elliptical defect angles. The average failure depths of the samples with 45° and 90° elliptical defects were obtained, which were the smallest and largest, respectively.
To analyze the influence of the angle of the elliptical defect on the damage degree of the specimen under ultrasonic vibration, statistical analysis of the specimen’s damage depth was conducted. As depicted in Figure 10, the failure depths of the specimens varied with different elliptical defect angles under ultrasonic vibration. With an increase in the elliptical defect angles, the average failure depth of the specimen showed a trend of first decreasing, then increasing, then decreasing, and finally increasing. The failure depths of the specimens with elliptical defect angles of 45° and 90° were observed to be the smallest and largest, respectively. The average failure depth of the specimen with an elliptical defect angle at 90° was 61.77 mm, which was 32.84% higher than that of 45° at 46.50 mm. The test results demonstrated that the destruction effect of the specimen was most severe and least severe when the elliptical defect angles were at 45° and 90° under ultrasonic vibration.

4. Discussion

In order to further reveal the failure mechanism of specimens with elliptical defects under ultrasonic vibration, the particle flow software (PFC2D) numerical calculation method was used to explore the acoustic emission characteristics, fracture energy evolution, and stress field distribution characteristics of samples with elliptical defects under ultrasonic vibration. The relationship between the fractal dimension of the cracks and the failure characteristics of the samples with elliptical defects under ultrasonic vibration is clarified.

4.1. Numerical Model and Parameter Calibration

This section constructs a numerical calculation model for ultrasonic vibration. By comparing and analyzing the elastic modulus, peak strength, and failure mode of rock samples under indoor experiments and numerical calculations, reasonable parameters related to the samples in the numerical simulation are determined.

4.1.1. Numerical Model and Loading Process

PFC2D was used to build the specimens with a side length of 50 mm and a height of 100 mm. An elliptical defect was generated using fish language at a distance of 1/3 from the top of the specimen, with the long axis being 18 mm and the short axis at 6 mm. A rigid cluster was generated to replace the ultrasonic vibration excitation head for the ultrasonic vibration study. The parallel-bonding model in particle flow software could not only transfer the force between the particles but also the torque. Therefore, the bonding between the rock particles was simulated using the parallel-bonding model. The numerical model is shown in Figure 11.
The loading of the rock specimens was achieved by creating a cluster with cosine velocity at the top of the rock model, replacing the excitation head for the ultrasonic vibration study. The specific application process is shown in Equations (4)–(6).
The displacement load of the ultrasonic vibration is shown in Equation (4).
U = A sin ( ω t )
By taking the derivative of Equation (1), the velocity V applied to the cluster could be obtained, as shown in Equation (5).
V = A ω cos ( ω t )
In the formula, the ultrasonic frequency f is 20,000 Hz, and the amplitude A is 70 μm. The angular velocity ω is equal to 2πf, and t is the time variable of ultrasonic vibration. The Equation (6) is obtained when the relevant parameters are substituted into Equation (5).
V = 2 π A f cos ( 2 π f t ) = 2.8 π cos ( 40,000 π t )

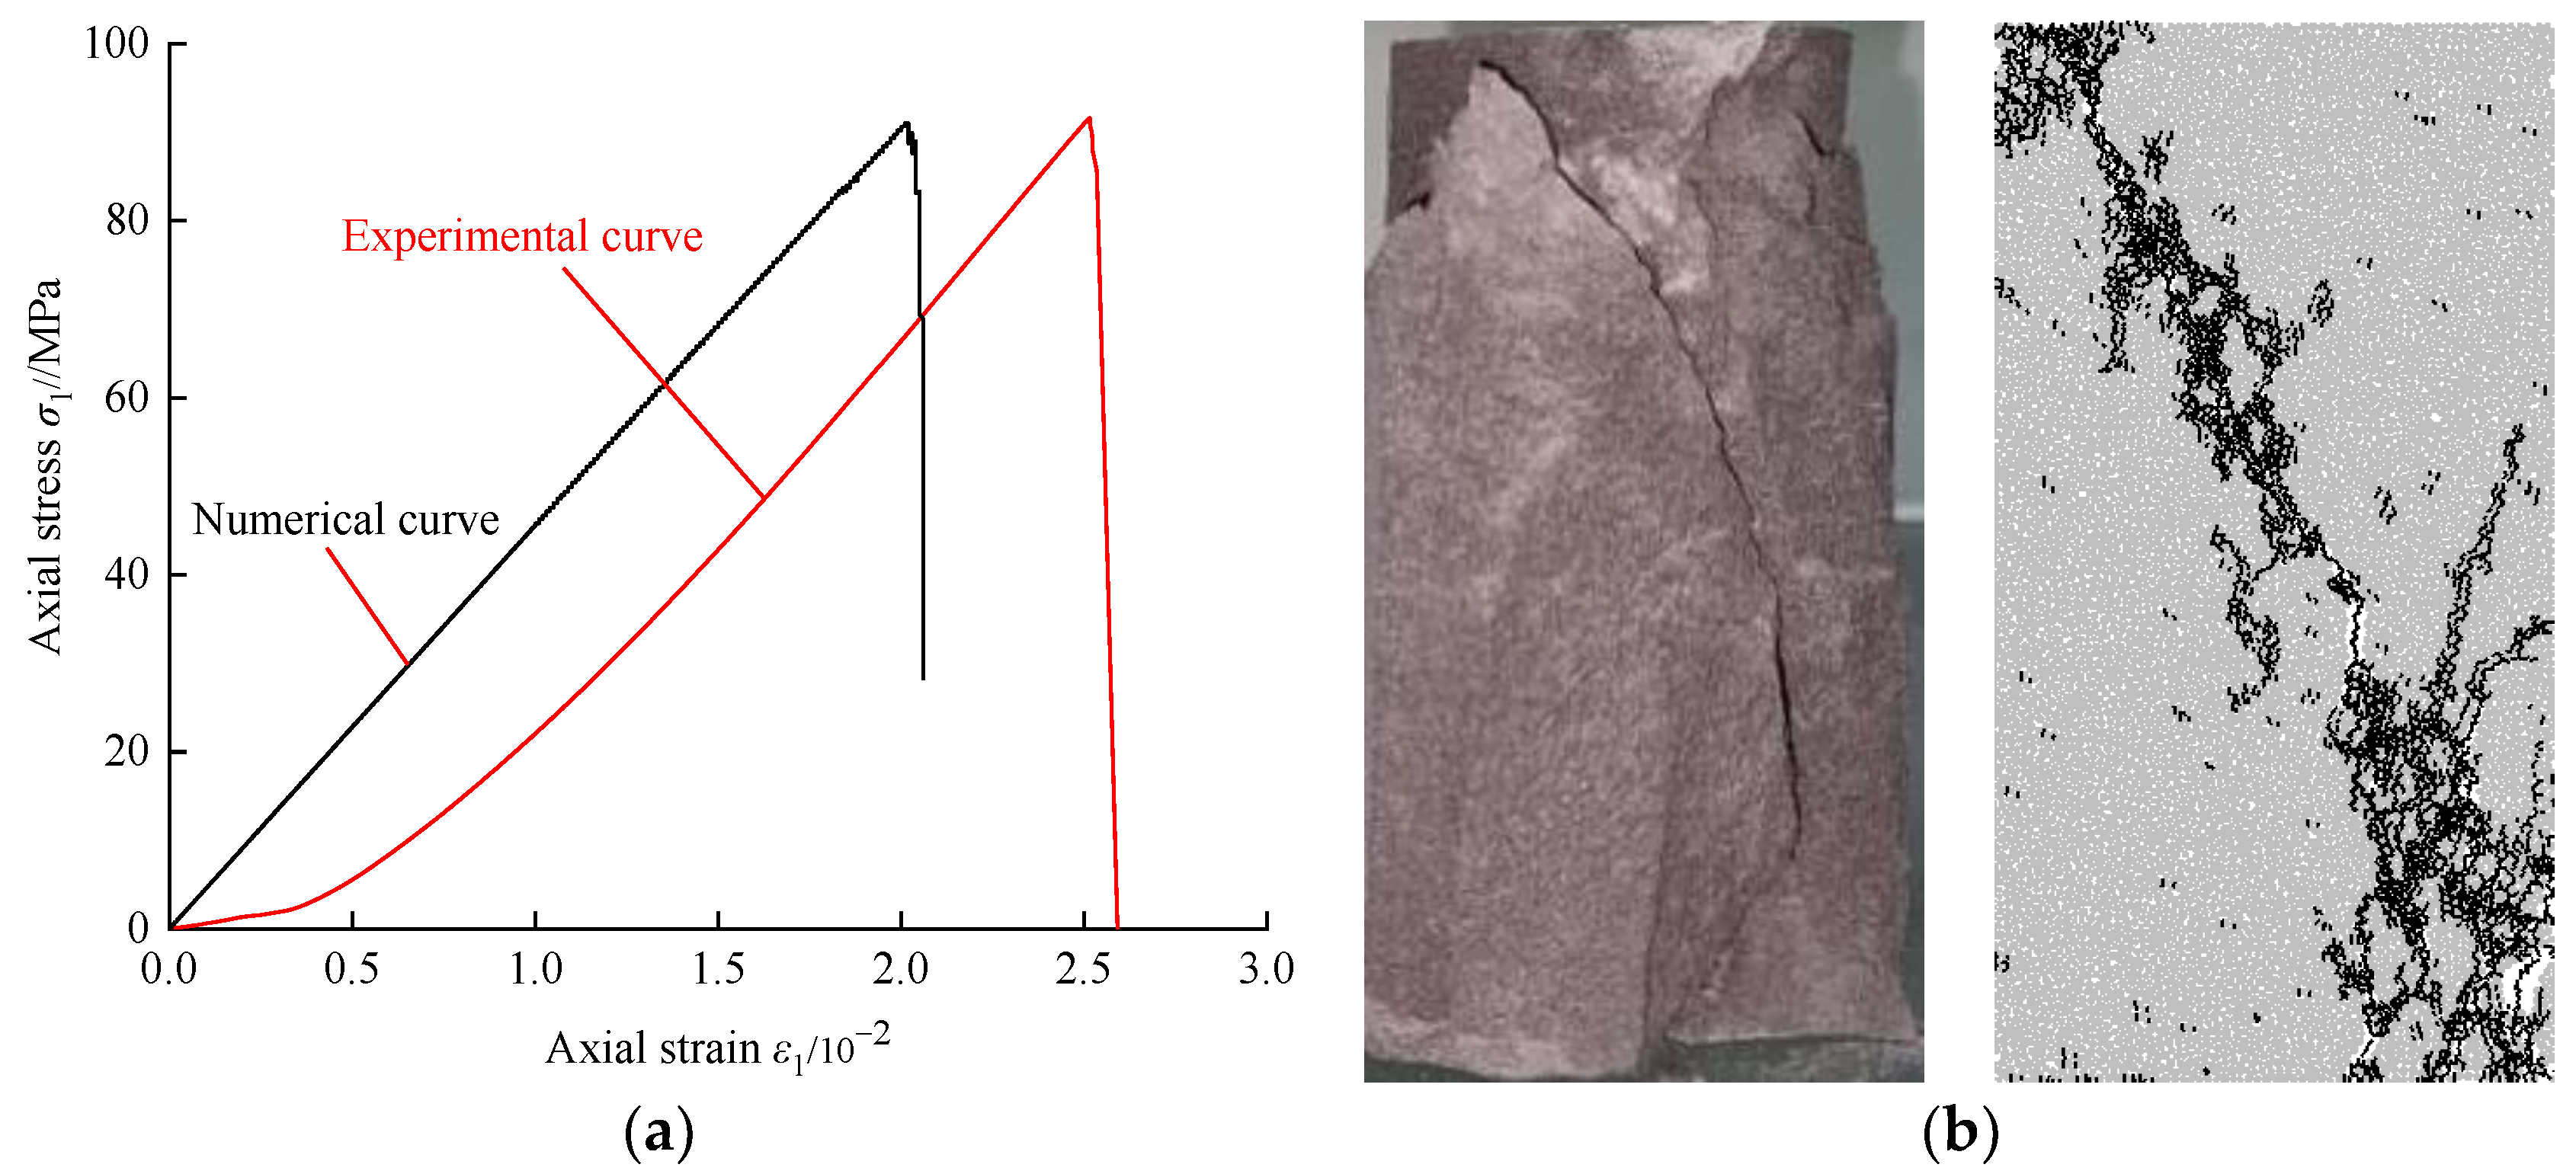
4.1.2. Verification of the Microscopic Parameters

In order to ensure the accuracy and reliability of the numerical calculations, it was necessary to properly calibrate the microscopic parameters before conducting the numerical calculations using PFC2D. By using the “trial and error” method, the simulation-related microscopic parameters were continuously debugged until the simulated calculated values were close to the actual values obtained through laboratory tests. The selected combinations of microscopic parameters are shown in Table 2. A comparative analysis was conducted on the elastic modulus, peak strength, and failure mode of the rock specimens under laboratory experiments and numerical calculations, with the results shown in Figure 12.
From Figure 12a, it is evident that the uniaxial compressive strength of specimens in the laboratory tests and numerical simulations was 91.60 MPa and 91.02 MPa, with a difference of only 0.6%. The elastic modulus value was determined as the second modulus between 30% and 70% of the peak strength of the stress-strain curve. The elastic modulus of the specimens in the laboratory tests and numerical simulations were 45.50 GPa and 45.06 GPa, respectively, exhibiting a difference of only 1.0%. Due to the fact that there were at least three particles in PFC, the contact between the particles was relatively tight, potentially not accurately reflecting the initial stage of pore and crack compaction during the compression process. Therefore, the strain corresponding to the peak intensity of the numerical simulation was 2.06 × 10⁻², which was smaller than the indoor test value of 2.59 × 10⁻². As shown in Figure 12b, the failure mode of the specimen under laboratory uniaxial compression was very similar to that under numerical calculation, which was mainly characterized as shear failure.

4.2. Acoustic Emission Characteristics

In the field of rock engineering, acoustic emission can be used in PFC to calculate the moment tensor by changing the contact force around bond fracture [38], which can reveal the damage characteristics of rocks from a microscopic perspective. Therefore, the fish language in PFC was used to monitor the acoustic emission evolution characteristics of the rocks during ultrasonic vibration. The acoustic emission distributions and sizes of the samples with defects at different elliptical angles showed significant differences, and it was found that the larger the crack increase, the higher the emission frequency.

4.2.1. Acoustic Emission Events

The distribution characteristics of acoustic emission events in specimens with elliptical defects at different angles are shown in Figure 13. It should be noted that the acoustic emission values are consistent with the severity of damage suffered at the location. From Figure 13, it can be seen that there were significant differences in the distribution and size of acoustic emissions among the specimens with defects at different elliptical angles. The distribution characteristics of acoustic emission events were basically consistent with the crack distribution characteristics of the specimens during the ultrasonic vibration tests, further verifying the rationality of the numerical simulation parameters. Specimens with elliptical defect angles at 0°, 30°, 75°, and 90° exhibited more acoustic emission events compared with elliptical defect angles at 15°, 45°, and 60°. Except for the specimens with elliptical defect angles at 45° and 60°, the acoustic emission events of specimens with elliptical defect angles at 0°, 15°, 30°, 75°, and 90° all extended to the edge of the specimens. The difference in the acoustic emission intensity between the specimens with different elliptical angles was not significant. The peak acoustic emission intensities of the specimens with 75° and 45° elliptical defects were the highest and lowest, with values of −7.1311 and −7.7277, respectively. The maximum acoustic emission intensity of the specimens with 75° elliptical defects was 8.4% higher than that of those at 45°.

4.2.2. Relationship between Acoustic Emission and Crack Propagation

The relationship between the acoustic emission events and the number of cracks in the specimens with elliptical defects at different angles is shown in Figure 14. As shown in Figure 14, the acoustic emission events and crack numbers of specimens with elliptical defects at different angles are significantly different. The number of tensile cracks in specimens with elliptical defects at each angle was greater than the number of shear cracks. The total number of cracks was consistent with the fractal dimension of cracks observed in the laboratory tests. The minimum and maximum total number of cracks were observed in specimens with elliptical defect angles at 45° and 90°, corresponding to 380 and 2900 cracks, respectively. The total number of cracks in the 90° elliptical defect specimens increased by 663.16% compared to that at 45°. The frequency and number of acoustic emission events for specimens with elliptical defect angles at 0°, 30°, 75°, and 90° were greater than those with elliptical defect angles 15°, 45°, and 60°. With the continuous excitation of ultrasonic vibration, the number of acoustic emissions for specimens with elliptical defect angles at 0°, 30°, 75°, and 90° showed a continuously increasing trend, and the maximum value remained unchanged during the last excitation period. However, the number of acoustic emission events for specimens with elliptical defect angles at 15°, 45°, and 60° reached its maximum during the middle time period of ultrasonic vibration. With the continuous excitation of ultrasonic vibration, cracks were generated inside the specimen, leading to the continuous occurrence of acoustic emission events. The larger the increase in the crack amplitude, the higher the frequency of acoustic emission.

4.3. Evolution Characteristics of Fracture Energy

The fish language of the PFC2D numerical simulation software was used to monitor the energy evolution characteristics of different elliptical defect samples under ultrasonic vibration, and it was found that the angle of elliptical defect has a significant impact on the energy evolution of defect samples.
PFC software can monitor the changes and transformation characteristics of different energies inside rocks in real time [39] and can explore the damage and failure mechanism of rocks under ultrasonic vibration from an energy perspective. The energy involved in this simulation mainly included total energy (Et), dissipative energy (Ed), elastic strain energy (Ee), kinetic energy (Ek), sliding friction energy (Eslip), plastic deformation energy (Es), parallel-bonding strain energy (Epd), strain energy (Ec), and energy dissipation coefficient (η).
During the deformation and failure process of an elliptical defect specimen under ultrasonic vibration, the work completed by the external load is converted into two parts: one is the accumulated elastic strain energy (Ee) in the specimen and the other is the dissipated energy (Ed) generated from the friction and motion between the mineral particles. The total energy Et [40] is shown in Figure 6.
E t = E e + E d
where Et is the external input energy, Ee is the strain energy, and Ed is the dissipation energy.
The total energy calculation formula is shown in Equation (8).
E t = F ε Δ U ε
where Fε and ∆Uε are the force and displacement increment of the bottom loading plate, respectively, when the specimen strain is ε.
The elastic strain energy includes the particle strain energy Ec and the parallel-bonding strain energy Epd [41], and its expression is shown in Equation (9).
E e = E c + E pd
where
E pd = 1 2 i N pd ( | F ¯ i n | 2 A i k ¯ i n + | F ¯ i s | 2 A i k ¯ i s + | M ¯ i | 2 I i k ¯ i n )
E c = 1 2 i N c ( | F i n | 2 k i n + | F i s | 2 k i s )
In Equations (10) and (11), F ¯ i n , F ¯ i s , and M ¯ i are the normal force, shear force, and the moment in the parallel bond i, respectively; F i n and F i s are the normal force and shear force in the contact i, respectively; Ai and Ii are the area and inertia moment of the bond cross section, respectively; Nc is the number of contacts; and Npd is the number of parallel bonds.
The sliding friction energy refers to the energy consumed by the friction between particles, expressed as Equation (12).
E slip = N [ F i s ( Δ U i s ) s l i p ]
where F i s represents the average tangential force and ( Δ U i s ) s l i p indicates the incremental sliding displacement.
The dissipated energy Ed includes the plastic deformation energy and sliding friction energy, and the expression is shown in Figure 12.
E d = E slip + E s
where Eslip represents the sliding friction energy and Es represents the plastic deformation energy.
The kinetic energy refers to the energy consumed by all the particles in the sample to rotate and move, expressed as Equation (13) [42].
E k = 1 2 N i = 1 m i v i 2
where N represents the number of contacts; m i represents the weight of particles; and v i represents the particle velocity.
The energy dissipation coefficient reflects the degree of energy utilization during the fracture process of the specimen, and the energy dissipation coefficient η is shown in Equation (15).
η = E d E t
where Et represents the total energy and Ed represents the dissipated energy.
The energy variation characteristics of the specimen during the process of acoustic emission generation were analyzed, as shown in Figure 15. According to Figure 15, there were significant differences in the energy evolution characteristics of the specimens with elliptical defects at different angles during ultrasonic vibration. The cumulative largest and smallest total energies were observed in the specimens with elliptical defect angles at 30° and 60°, respectively. The total energy of the specimens with elliptical defect angles at 30° was 87.86 kJ, which was 575.8% higher than those with elliptical defects at 60° at 13 kJ.
With the continuous occurrence of acoustic emission events, the proportion of dissipated energy and plastic deformation energy of specimens with elliptical defects at different angles was greater than that of other energies. This observation indicated that during the continuous generation of acoustic emission events, the total energy of the specimens was mainly converted into plastic deformation energy, with a small amount converted into elastic strain energy and kinetic energy. The energy consumption coefficients of specimens with different elliptical angle defects rapidly increased to the peak values in the early stage of the acoustic emission events. The energy consumption coefficient of the specimens with elliptical defect angles at 45° was 0.963, which was 9.1% greater than that of 45° at 0.883.
As the ultrasonic vibration continued to excite, the fluctuation amplitude of the specimens with elliptical defect angles at 0°, 15°, 30°, and 45° was small after the energy consumption coefficient reached its peak. While for specimens with elliptical defect angles at 60°, 75°, and 90°, the fluctuation amplitude significantly decreased after the energy consumption coefficient reached its peak. The energy utilization efficiency of the elliptical defect specimens at the corresponding angles was relatively stable and high, and the energy utilization efficiency was unstable and low during the acoustic emission generation process. This was because, with the continuous increase in the number of acoustic emission events, the efficiency of the internal contact force transmission in the specimen decreased, and the severity of plastic deformation failure decreased. This phenomenon resulted in small increases in plastic deformation energy and decreases in the energy consumption coefficient, that is, a decrease in the energy utilization efficiency.
According to the calculation results of the numerical simulation, the peak energy consumption coefficient of the 90° and 45° elliptical defect samples was the smallest and largest, which corresponds to the degree of failure of the 90° and 45° elliptical defect samples. Due to the maximum degree of damage of the 90° elliptical defect specimen under ultrasonic vibration, the internal contact force transmission efficiency of the specimen was low, and the specimen could not effectively produce plastic deformation failure. Therefore, the peak energy consumption coefficient was the smallest, indicating the reliability and rationality of the energy data.

4.4. Stress Field Distribution Characteristics

Using PFC2D numerical simulation software, the force chain distribution characteristics of different elliptical defect samples under ultrasonic vibration were extracted. It was found that the angle of the elliptical defect under ultrasonic vibration has a significant impact on the stress field distribution of the defect samples, and the maximum transmission depth was obtained when the stress concentration occurs in the 90° elliptical defect samples.
By analyzing the stress field at the final acoustic emission time, the stress field distribution characteristics of the specimens with different elliptical defect angles are shown in Figure 16. In Figure 16, the blue line segment represents the pressure, and the green line segment represents the tension. The thicker the force chain, the stronger the contact force. There were significant differences in the stress field distribution of the specimens with different elliptical defect angles, among which the degree of pressure concentration was greater than that of tension. The specimens with elliptical defect angles at 0°, 30°, 75°, and 90° generated compressive stress concentrations at the top and long edge of the specimen, while the specimens with elliptical defect angles at 15°, 45°, and 60° generated compressive stress concentrations at the top and near the elliptical defect of the specimen.
The specimens with elliptical defect angles at 0°, 15°, 30°, 45°, 75°, and 90° exhibited tensile stress concentrations on both sides of the top and near the elliptical defect, while the specimens with elliptical defects at 60° exhibited tensile stress concentrations on both sides of the top and near the middle of the two long edges. The transmission depth of the stress concentration varied significantly among the specimens with different elliptical defect angles, with the minimum and maximum depths of compressive stress and tensile stress concentration occurring at 60°, 90°, and 15°, 90°, respectively. The corresponding depths were 27 mm, 47 mm, 41 mm, and 62 mm. Under ultrasonic vibration excitation, the stress field distribution of the specimens with different elliptical defect angles showed significant differences, leading to different forms of crack propagation and different degrees of acoustic emission events.

4.5. Relationship between the Fractal Dimension and Failure Characteristics

Based on the experimental data of samples with single elliptical defects under ultrasonic vibration mentioned above, the fractal dimension, axial strain, and failure depth data of samples with different elliptical defect angles were sorted and analyzed. The relationship between the fractal dimension and failure characteristics of the samples with single elliptical defects was studied, and it was found that the fractal dimension of the samples with elliptical defects showed a high degree of consistency with the changes in the axial strain and failure depth.
The relationship between the fractal dimension and failure characteristics of the samples with single elliptical defects is shown in Figure 17. As shown in Figure 17, with the continuous increase in the elliptical defect angle, the fractal dimension of the defective sample shows a trend of first decreasing, then increasing, then decreasing, and finally continuously increasing. The minimum and maximum fractal dimensions were found in the 45° and 90° elliptical defect angle samples, respectively. As the angle of the elliptical defect increases, the trend of axial strain change in the defective specimen is basically consistent with the fractal dimension of the corresponding angle specimen. The difference is that the axial strain values of the 60° and 75° elliptical defect angle specimens are the same, but the minimum and maximum axial strain are also in the elliptical defect specimens with 45° and 90° angles, respectively. As the angle of the elliptical defect increases, the trend of the depth of failure of the defective specimen is consistent with the fractal dimension of the corresponding angle specimen. The minimum and maximum depths of failure were also at the 45° and 90° angle specimens of the elliptical defect, respectively. The experimental results show that the fractal dimension of the elliptical defect specimens is highly consistent with the changes in the axial strain and failure depth, indicating a positive correlation between the fractal dimension of the defect specimens and the degree of failure under ultrasonic vibration. This further verifies the reliability of the fractal theory in studying the failure of specimens with single elliptical defects under ultrasonic vibration.
The direction of ultrasonic vibration is vertical and downward, and the different angles of elliptical defects can lead to differences in stress in the long and short-axis directions of the elliptical defect specimens, resulting in varying degrees of stress concentration on the elliptical defects. According to the Griffith theory in fracture mechanics, the tensile fracture at the tip of the crack along the long axis caused by the maximum tensile stress is mainly caused by the tensile force perpendicular to the long axis of the crack, and the crack initiation and expansion of the specimen only occur when the energy provided by the loading system is greater than the energy required to form the crack area. Therefore, based on the Griffith theory, the difference in the stress concentrations of specimens with different elliptical defect angles is the underlying reason for the significant differences in the failure characteristics of the specimens with elliptical defect angles under ultrasonic vibration.
According to the uniaxial compression stress-strain curves obtained from the indoor tests and numerical simulations of the complete specimen mentioned above (Figure 12), it can be seen that the uniaxial compressive strength and elastic modulus of the two differ only by 0.6% and 1.0%, and the failure mode of the complete specimen under indoor uniaxial compression and numerical calculations is very close, indicating the rationality of PFC2D numerical simulation. The comparison between the ultrasonic vibration test and PFC2D numerical simulation results shows that the crack distribution characteristics of the samples with different elliptical defect angles (0–90°) (Figure 5) are basically consistent with the acoustic emission event distribution characteristics of the corresponding elliptical defect angle samples in the numerical simulation (Figure 13). This further demonstrates the rationality of the numerical simulation parameters and verifies the reliability of the PFC2D numerical simulation results.
The above research results show that the fractal dimension of cracks, strain behavior of specimens, and failure depth of elliptical defect specimens reach their minimum and maximum values at 45° and 90°, respectively, with corresponding values of 1.14, 0.01, 46.50 mm, and 0.019, 1.30, and 61.77 mm, respectively. The research results indicate that the damage degree of the elliptical defect specimens at 45° and 90° under ultrasonic vibration is the smallest and largest. In the future ultrasonic vibration rock-breaking processes of underground rock engineering, when there are elliptical defects in the rock mass, it is necessary to avoid the direction of the ultrasonic vibration excitation head being at a 45° angle with the long axis of the ellipse, and adjust the direction of the ultrasonic vibration excitation head to be consistent with the long axis of the ellipse as much as possible, so as to improve the rock-breaking efficiency of underground rock engineering, and then reduce the stress environment of the surrounding rock. This has significant practical significance for the efficient excavation of rock engineering and reducing the possibility of the instability and failure of underground rock mass due to high stress.
PFC2D is a two-dimensional simulation software that can study the failure characteristics of specimens with elliptical defects under ultrasonic vibration. However, due to its two-dimensional limitations, it is not possible to more accurately study the crack development in the entire three-dimensional space of the specimen. In the later stage, PFC3D simulation software can be used to conduct more in-depth research on the failure mechanism of specimens with elliptical defects under ultrasonic vibration.

5. Conclusions

This article detailed laboratory experiments and particle flow PFC2D simulations on specimens with single elliptical defects under ultrasonic vibration. The fractal characteristics of cracks in the defect samples were clarified, and the strain behavior and failure characteristics of the defect samples were obtained. The acoustic emission characteristics, fracture energy evolution, and stress field distribution characteristics of the specimens with elliptical defects were studied and discussed. The relationship between the fractal dimension and failure characteristics of elliptical defect specimens was revealed.
(1)
The fracture fractal dimension and axial strain of specimens with different elliptical defect angles showed significant differences. The fractal dimension and strain of specimens with 45° and 90° defects were the smallest (1.14 and 0.01) and the largest (1.30 and 0.019), respectively. The specimens with 45° and 90° defects corresponding to fractal dimension and strain of the specimens showed a positive linear and logarithmic curve and a positive linear relationship with time;
(2)
The failure depths of the specimens with different elliptical defect angles varied greatly, with the smallest and largest being 45° and 90°, respectively. The failure depths of specimens with 90° elliptical defects increased by 32.84% compared to the 45° defect angle. The results suggested the efficiency of rock-breaking, which could be improved by adjusting the angle between the ultrasonic vibration excitation head and the elliptical defect;
(3)
There were significant differences in the acoustic emission characteristics and crack development of specimens with different elliptical defect angles. The peak intensities of acoustic emission in the specimens with elliptical defects at 75° and 45° were the highest (−7.1311) and lowest (−7.7277), respectively. The frequency of acoustic emission events was positively correlated with the increase in cracks, and the number of tensile cracks was greater than that of shear cracks;
(4)
The angle of elliptical defects has a significant impact on the total energy and energy utilization efficiency. The total energy of the specimens with elliptical defects at 30° was 575.8% higher than that at 60°. The energy consumption coefficient of the specimens with elliptical defects at 45° was highest, which was 9.1% higher than that at 90°. The efficiency of the contact force transmission decreased with the increase in the crack number, which resulted in decreases in plastic deformation and energy utilization efficiency;
(5)
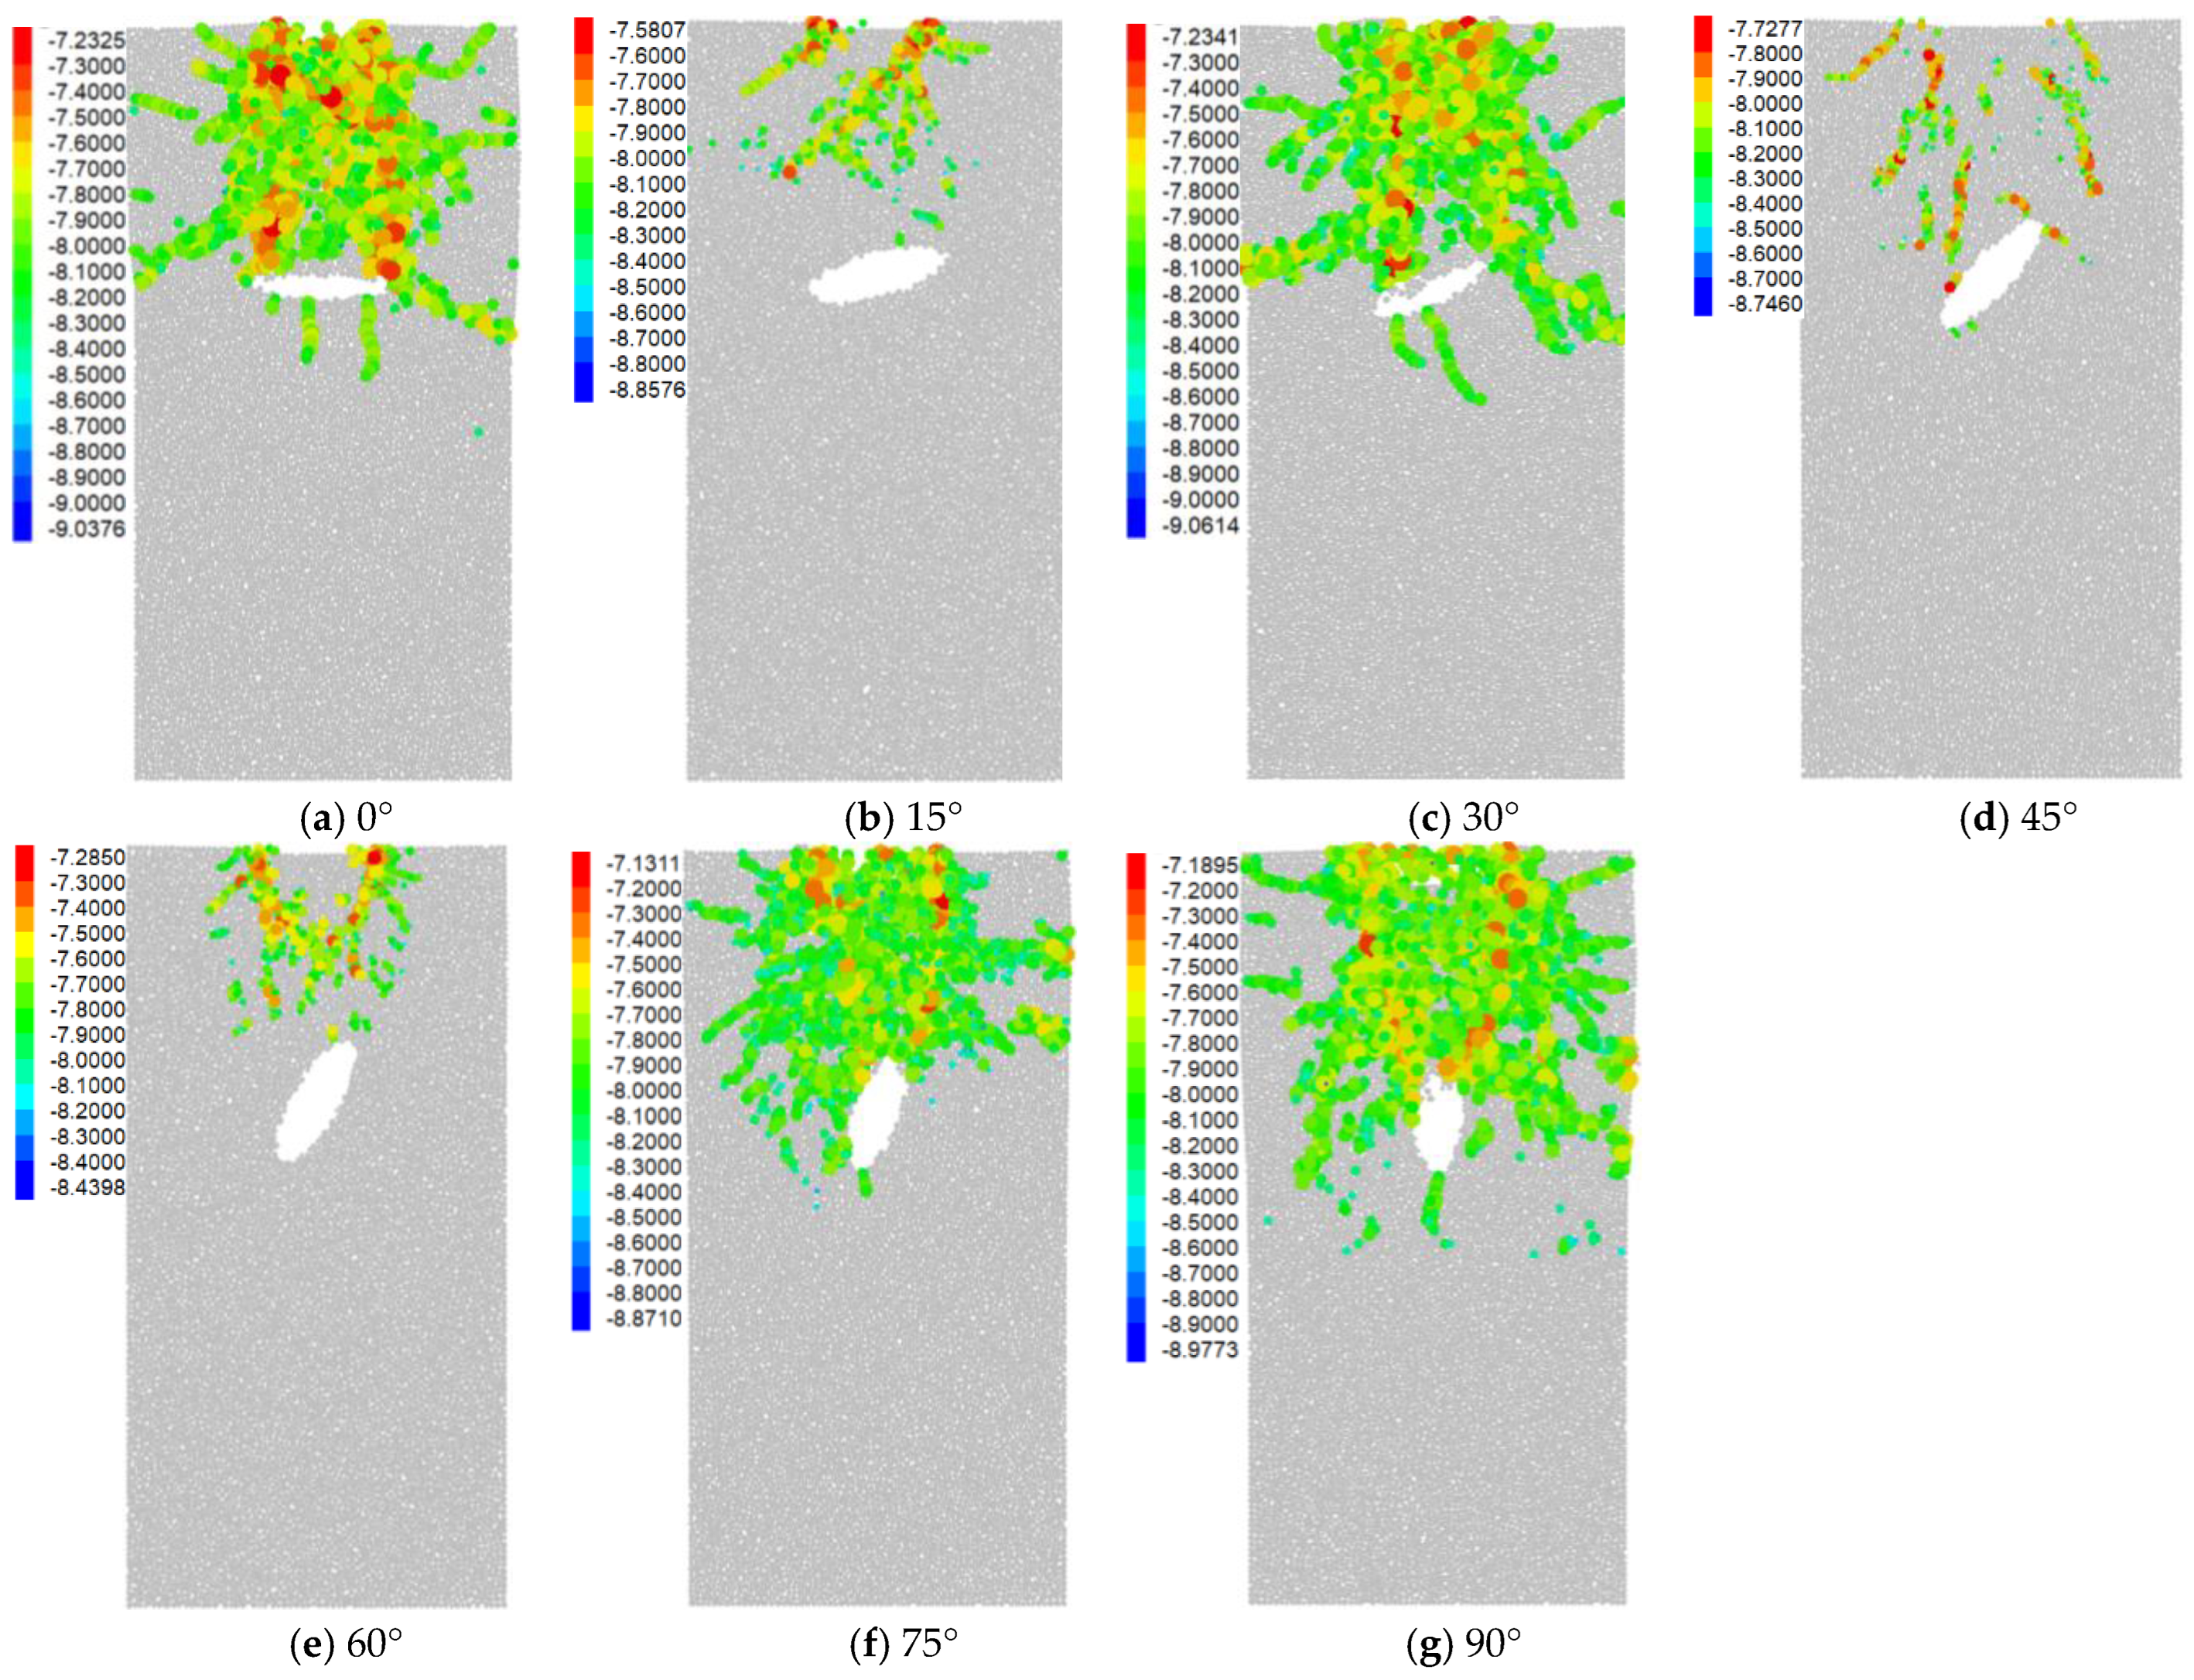
The stress field distributions of specimens with different elliptical defect angles were significantly different, causing different degrees and frequencies of acoustic emission events, ultimately leading to differential failure patterns. The maximum transmission depth at the concentration of compressive stress and tensile stress occurred in the specimens with an elliptical defect angle at 90°, corresponding to depths of 47 mm and 62 mm, respectively.
(6)
The fractal dimension of the elliptical defect specimens is highly consistent with the trend of axial strain and failure depth. As the angle of the elliptical defect increases, the fractal dimension of the defective sample shows a trend of first decreasing, then increasing, then decreasing, and finally continuously increasing. The fractal dimension of the defective sample under ultrasonic vibration is positively correlated with the degree of damage to the defective sample.

Author Contributions

Z.N., Investigation, experiment, software, formal analysis, validation, writing—original draft; X.W., resources, writing—review and editing, supervision, data curation; L.Z., resources, writing—review and editing, supervision, data curation; J.W., resources, writing—review and editing, supervision, data curation; Z.C., resources, writing—review and editing, supervision, data curation; C.Q., investigation, writing—review and editing; X.C., writing—review and editing. All authors have read and agreed to the published version of the manuscript.

Funding

This work was funded by the National Natural Science Foundation of China (52374146, 51874282), the Postgraduate Research & Practice Innovation Program of Jiangsu Province (KYCX22_ 2619), the Graduate Innovation Program of China University of Mining and Technology (2022WLKXJ050), and the Open Project of State Key Laboratory of Coking Coal Resources Green Exploitation (41040220181107).

Data Availability Statement

The data generated and/or analyzed during this study are available from the corresponding author upon reasonable request.

Conflicts of Interest

The authors declare that they have no known competing financial interests or personal relationships that could have appeared to influence the work reported in this paper.

References

  1. Miao, K.J.; Tu, S.H.; Tu, H.S.; Liu, X.; Li, W.L.; Zhao, H.B.; Tang, L.; Ma, J.Y.; Li, Y. Research on Fractal Evolution Characteristics and Safe Mining Technology of Overburden Fissures under Gully Water Body. Fractal Fract. 2022, 6, 486. [Google Scholar] [CrossRef]
  2. Sun, X.M.; Wang, J.; Zhao, W.C.; Ming, J.; Zhang, Y.; Li, Z.H.; Miao, C.Y.; Guo, Z.B.; He, M.C. Instability mechanism of mining roadway passing through fault at different angles in kilometre-deep mine and control measures of roof cutting and NPR cables. J. Mt. Sci. 2024, 21, 236–251. [Google Scholar] [CrossRef]
  3. Wu, C.; Qin, T.; Wang, L.; Liu, Z. Research on Surrounding Rock Control Technology of Dongbaowei Deep Mining Roadway. Adv. Civ. Eng. 2021, 2021, 6660989. [Google Scholar] [CrossRef]
  4. Li, C.Z.; Zhao, D.L.; Cao, C.; Lyu, F.Y.; Zhang, M.J.; Wu, M. The coupling relationship analysis and control of the roadheader’s cutting and supporting structures. J. Braz. Soc. Mech. Sci. Eng. 2022, 44, 437. [Google Scholar] [CrossRef]
  5. Tang, B.; Cheng, H.; Tang, Y.Z.; Zheng, T.L.; Yao, Z.S.; Wang, C.B.; Rong, C.X. Supporting Design Optimization of Tunnel Boring Machines-Excavated Coal Mine Roadways: A Case Study in Zhangji, China. Processes 2020, 8, 46. [Google Scholar] [CrossRef]
  6. Ding, Z.W.; Jia, J.D.; Li, X.F.; Li, J.; Li, Y.L.; Liao, J.L. Experimental study and application of medium-length hole blasting technique in coal-rock roadway. Energy Sci. Eng. 2020, 8, 1554–1566. [Google Scholar] [CrossRef]
  7. Cheng, B.; Wang, H.B.; Zong, Q.; Xu, Y.; Wang, M.X.; Zheng, Q.Q.; Li, C.J. A Study on Cut Blasting with Large Diameter Charges in Hard Rock Roadways. Adv. Civ. Eng. 2020, 2020, 8873412. [Google Scholar] [CrossRef]
  8. Hong, Z.X.; Tao, M.; Cui, X.J.; Wu, C.Q.; Zhao, M.S. Experimental and numerical studies of the blast-induced overbreak and underbreak in underground roadways. Undergr. Space 2023, 8, 61–79. [Google Scholar] [CrossRef]
  9. Zhu, C.; Tao, Z.G.; Yamg, S.; Zhao, S.A. V shaped gully method for controlling rockfall on high-steep slopes in China. Bull. Eng. Geol. Environ. 2019, 78, 2731–2747. [Google Scholar]
  10. Paulusse, J.M.J.; Sijbesma, R.P. Ultrasound in polymer chemistry: Revival of an established technique. J. Polym. Sci. Pol. Chem. 2006, 44, 5445–5453. [Google Scholar] [CrossRef]
  11. Kim, G.; Hwang, Y.I.; Ryu, Y.; Kim, H.J.; Bae, Y.M.; Kim, K.B. Ultrasonic device developed for noninvasive moxibustion therapy. Integr. Med. Res. 2021, 10, 100729. [Google Scholar] [CrossRef]
  12. Wang, Z.J.; Gu, S.M. State-of-the-art on the development of ultrasonic equipment and key problems of ultrasonic oil prudction technique for EOR in China. Renew. Sust. Energy Rev. 2018, 82, 2401–2407. [Google Scholar] [CrossRef]
  13. Zhang, L.; Wang, X.F.; Niu, Z.J. Mesoscopic Damage and Fracture Characteristics of Hard Rock under High-Frequency Ultrasonic Vibration Excitation. Appl. Sci. 2023, 13, 12424. [Google Scholar] [CrossRef]
  14. Yang, S.Q.; Tian, W.L.; Huang, Y.H.; Ranjith, P.G.; Ju, Y. An Experimental and Numerical Study on Cracking Behavior of Brittle Sandstone Containing Two Non-coplanar Fissures Under Uniaxial Compression. Rock Mech. Rock Eng. 2016, 49, 1497–1515. [Google Scholar] [CrossRef]
  15. Yang, S.Q.; Yin, P.F.; Zhang, Y.C.; Chen, M.; Zhou, X.P.; Jing, H.W.; Zhang, Q.Y. Failure behavior and crack evolution mechanism of a non-persistent jointed rock mass containing a circular hole. Int. J. Rock Mech. Min. Sci. 2019, 114, 101–121. [Google Scholar] [CrossRef]
  16. Wang, X.F.; Niu, Z.J.; Zhang, L.; Li, X.Y.; Wang, J.Y.; Chang, Z.C.; Chen, X.Y. Research progress and prospects of ultrasonic vibration in coal rock fracturing. Coal Sci. Technol. 2024, 52, 232–243. [Google Scholar]
  17. Wiercigroch, M.; Neilson, R.D.; Player, M.A. Material removal rate prediction for ultrasonic drilling of hard materials using an impact oscillator approach. Phys. Lett. A 1999, 259, 91–96. [Google Scholar] [CrossRef]
  18. Bao, X.L.; Bar-Cohen, Y.; Chang, Z.S.; Dolgin, B.P.; Sherrit, S.; Pal, D.S.; Du, S.; Pete-rson, T. Modeling and computer simulation of ultrasonic/sonic driller/corer (USDC). IEEE Trans. Ultrason. Ferroelectr. Freq. Control. 2003, 50, 368–379. [Google Scholar]
  19. Li, S.Q.; Yan, T.; Li, W.; Bi, F.Q. Modeling of vibration response of rock by harmonic impact. J. Nat. Gas Sci. Eng. 2015, 23, 90–96. [Google Scholar] [CrossRef]
  20. Fernando, P.; Zhang, M.; Pei, Z.J. Rotary ultrasonic machining of rocks: An experimental investigation. Adv. Mech. Eng. 2018, 10, 1687814018763178. [Google Scholar] [CrossRef]
  21. Wiercigroch, M.; Wojewoda, J.; Krivtsov, A.M. Dynamics of ultrasonic percussive drilling of hard rocks. J. Sound Vibr. 2005, 280, 739–757. [Google Scholar] [CrossRef]
  22. Zhao, D.J.; Zhang, S.L.; Wang, M.Y. Microcrack growth properties of granite under ultrasonic high-frequency excitation. Adv. Civ. Eng. 2019, 2019, 3069029. [Google Scholar] [CrossRef]
  23. Zhao, D.J.; Zhang, S.L.; Zhao, Y.; Wang, M.Y. Experimental study on damage characteristics of granite under ultrasonic vibration load based on infrared thermography. Environ. Earth Sci. 2019, 78, 419. [Google Scholar] [CrossRef]
  24. Zhou, Y.; Zhao, D.J.; Li, B.; Wang, H.Y.; Tang, Q.Q.; Zhang, Z.Z. Fatigue damage mechanism and deformation behaviour of granite under ultrahigh-frequency cyclic loading conditions. Rock Mech. Rock Eng. 2021, 54, 4723–4739. [Google Scholar] [CrossRef]
  25. Zhang, C.; Zhao, D.J.; Zhang, S.L.; Zhou, Y. Individual and combined influences of main loading parameters on granite damage development under ultrasonic vibration. J. Mt. Sci. 2021, 18, 3366–3379. [Google Scholar] [CrossRef]
  26. Wang, J.Y.; Wang, X.F.; Chen, X.Y.; Chen, L.; Yang, Z.B.; Chang, Z.C.; Zhang, L.; Niu, Z.J. Experimental study on failure law and mechanism of red sandstone under ultrasonic vibration excitation. Geofluids 2022, 2022, 3078599. [Google Scholar] [CrossRef]
  27. Wang, X.F.; Wang, X.L.; Wang, J.Y.; Tian, Z.X. Feasibility study and prospects of rock fragmentation using ultrasonic vibration excitation. Appl. Sci. 2020, 10, 5868. [Google Scholar] [CrossRef]
  28. Zhang, L.; Wang, X.F.; Wang, J.Y.; Yang, Z.B. Research on fracture characteristics and energy dissipation of hard rock under the excitation of ultrasonic vibration. Geofluids 2022, 2022, 8351316. [Google Scholar] [CrossRef]
  29. Zhang, L.; Wang, X.F.; Wang, J.Y.; Yang, Z.B. Mechanical characteristics and pore evolution of red sandstone under ultrasonic high-frequency vibration excitation. AIP Adv. 2021, 11, 055202. [Google Scholar] [CrossRef]
  30. Yang, S.Q.; Huang, Y.H. An experimental study on deformation and failure mechanical behavior of granite containing a single fissure under different confining pressures. Environ. Earth Sci. 2017, 76, 364. [Google Scholar] [CrossRef]
  31. Huang, Y.H.; Yang, S.Q.; Tian, W.L.; Wu, S.Y. Experimental and DEM study on failure behavior and stress distribution of flawed sandstone specimens under uniaxial compression. Theor. Appl. Fract. Mech. 2022, 118, 103266. [Google Scholar] [CrossRef]
  32. Haeri, H.; Khaloo, A.; Marji, M.F. Fracture analyses of different pre-holed concrete specimens under compression. Acta Mech. Sin. 2015, 31, 855–870. [Google Scholar] [CrossRef]
  33. Yang, S.Q.; Huang, Y.H.; Tian, W.L.; Zhu, J.B. An experimental investigation on strength, deformation and crack evolution behavior of sandstone containing two oval flaws under uniaxial compression. Eng. Geol. 2017, 217, 35–48. [Google Scholar] [CrossRef]
  34. Han, Z.Y.; Xie, S.J.; Li, D.Y.; Zhu, Q.Q.; Yan, Z.W. Dynamic mechanical behavior of rocks containing double elliptical inclusions at various inclination angles. Theor. Appl. Fract. Mech. 2022, 121, 103544. [Google Scholar] [CrossRef]
  35. Chen, S.J.; Xia, Z.G.; Feng, F. Numerical simulation of strength, deformation, and failure characteristics of rock with fissure hole defect. Adv. Mater. Sci. Eng. 2020, 2020, 7048645. [Google Scholar] [CrossRef]
  36. Yang, S.Q.; Tian, W.L.; Huang, Y.H.; Ma, Z.G.; Fan, L.F.; Wu, Z.J. Experimental and discrete element modeling on cracking behavior of sandstone containing a single oval flaw under uniaxial compression. Eng. Fract. Mech. 2018, 194, 154–174. [Google Scholar] [CrossRef]
  37. Tao, M.; Zhao, H.T.; Momeni, A.; Wang, Y.Q.; Cao, W.Z. Fracture failure analysis of elliptical hole bored granodiorite rocks under impact loads. Theor. Appl. Fract. Mech. 2020, 107, 102516. [Google Scholar] [CrossRef]
  38. Hazzard, J.F.; Young, R.P. Moment tensors and micromechanical models. Tectonophysics 2002, 356, 181–197. [Google Scholar] [CrossRef]
  39. Zhang, Y.B.; Zhao, T.B.; Yin, Y.C.; Tan, Y.L.; Qiu, Y. Numerical research on energy evolution in granite under different confining pressures using otsu’s digital image processing and PFC2D. Symmetry 2019, 11, 131. [Google Scholar] [CrossRef]
  40. Xie, H.P.; Yang, J.U.; Li, L.Y. Criteria for strength and structural failure of rocks based on energy dissipation and energy release principles. Chin. J. Rock Mech. Eng. 2005, 24, 13003–13010. [Google Scholar]
  41. Cundall, P.; Strack, O. Particle Flow Code in 2 Dimensions; Itasca Consulting Group, Inc.: Minneapolis, MN, USA, 1999. [Google Scholar]
  42. Wang, G.L.; Cao, T.C.; Sun, F.; Wen, X.X.; Zhang, L. Study on the meso-energy damage evolution mechanism of single-joint sandstone under uniaxial and biaxial compression. Adv. Mater. Sci. Eng. 2021, 2021, 5245402. [Google Scholar] [CrossRef]
Figure 1. The specimens with a single elliptical defect and loading methods: (a) specimens and (b) loading methods.
Fractalfract 08 00261 g001
Figure 2. The ultrasonic vibration excitation equipment.
Fractalfract 08 00261 g002
Figure 3. The specimen preparation process: (a) sandpaper, (b) polishing, (c) cleaning with alcohol, and (d) matte paint.
Fractalfract 08 00261 g003
Figure 4. Ultrasonic vibration excitation and DIC monitoring system.
Fractalfract 08 00261 g004
Figure 5. The strain field distribution of specimens with different ellipse defect angles at the crack penetration time.
Fractalfract 08 00261 g005
Figure 6. The axial strain of specimens with elliptical defects (a) at an angle of 45° and (b) at an angle of 90°.
Fractalfract 08 00261 g006
Figure 7. The axial strain of specimens with an elliptical defect angle at 45° and 90°.
Fractalfract 08 00261 g007
Figure 8. The fractal dimension of specimen cracks at the crack penetration time.
Fractalfract 08 00261 g008
Figure 9. The fractal dimension evolution of specimens at elliptical defect angle of 45° and 90°.
Fractalfract 08 00261 g009
Figure 10. The damage depths of specimens with different elliptical defect angles.
Fractalfract 08 00261 g010
Figure 11. The numerical model of the specimen with the elliptical defect.
Fractalfract 08 00261 g011
Figure 12. The laboratory experiments and numerical calculations results: (a) stress-strain curve and (b) fracture modes.
Fractalfract 08 00261 g012
Figure 13. The acoustic emission distribution of specimens with different elliptical defect angles.
Fractalfract 08 00261 g013
Figure 14. The relationship between acoustic emission and crack number in specimens with different elliptical defect angles.
Fractalfract 08 00261 g014
Figure 15. The energy evolution of specimens with different elliptical defect angles.
Fractalfract 08 00261 g015
Figure 16. The stress field distribution of specimens with different elliptical defect angles.
Fractalfract 08 00261 g016
Figure 17. The relationship between the fractal dimension and sample failure characteristics.
Fractalfract 08 00261 g017
Table 1. The arrangements of the testing programs.
SpecimenW/mmH/mmT/mm2a/mm2b/mmα
SE0149.9499.7250.321860
SE0250.12100.2049.801860
SE0350.6299.9049.961860
SE0450.1299.8250.6018615
SE0549.8099.7250.4818615
SE0649.92100.2450.4018615
SE0749.7499.6050.6618630
SE0850.40100.1249.7818630
SE0949.9099.7850.5618630
SE1049.78100.0850.0418645
SE1149.7299.7050.2018645
SE1249.90100.0850.4218645
SE1350.0299.8250.6818660
SE1449.92100.0250.2018660
SE1549.94100.2250.2018660
SE1649.6899.7450.5018675
SE1750.02100.0450.5618675
SE1849.84100.1050.1218675
SE1950.08100.3650.1018690
SE2049.7099.6850.2018690
SE2149.9099.7450.3218690
Note: W: width; H: height; T: thickness.
Table 2. The microparameters used in the PFC2D model for the specimens in this research.
MicroparametersUnitValues
Young’s modulus of the particle, Ec (GPa)GPa2.14
Young’s modulus of the parallel bond, E c ¯ (GPa)GPa2.14
Ratio of normal to shear stiffness of the particle, kn/ks-1.20
Ratio of normal to shear stiffness of the parallel bond, k n ¯ / k s ¯ -1.20
Particle friction coefficient (μ)-0.45
Parallel-bond normal strength (σn), mean (MPa)MPa32.30
Parallel-bond shear strength (τn), mean (MPa)MPa48.45
Disclaimer/Publisher’s Note: The statements, opinions and data contained in all publications are solely those of the individual author(s) and contributor(s) and not of MDPI and/or the editor(s). MDPI and/or the editor(s) disclaim responsibility for any injury to people or property resulting from any ideas, methods, instructions or products referred to in the content.

