Review

From Block to City Scale: Greenery’s Contribution to Cooling the Urban Environment

by
Jesús Abelardo Licón-Portillo
1,
Karen Estrella Martínez-Torres
2,
Peter Chung-Alonso
3 and
Eduardo Florencio Herrera Peraza
1,*
1
Centro de Investigación en Materiales Avanzados (CIMAV), Chihuahua 31136, Mexico
2
Facultad de Ingeniería, Arquitectura y Diseño, Universidad Autónoma de Baja California, Ensenada 22860, Mexico
3
Campus Colima, Tecnológico Nacional de México, Colima 28976, Mexico
*
Author to whom correspondence should be addressed.
Submission received: 12 March 2024 / Revised: 11 April 2024 / Accepted: 17 April 2024 / Published: 25 April 2024

Abstract

:
Urban greenery is a strategy to improve the thermal environment in urban areas affected by heat islands and global warming. These phenomena can harm the citizens’ quality of life. Researchers have investigated the thermal benefits of urban vegetation, but only a few have explored its complexities across diverse urban scales. Understanding these variations is critical for precise analysis, customized solutions, efficient resource allocation, and enhancing urban living quality while promoting sustainability and climate resilience. This paper reviews 250 scientific articles about the relationship between greenspace and the urban thermal environment published between 2010 and 2023 through urban scales. It summarizes the parameters and findings of greenery’s contribution to cooling the urban environment. The data reveal that most studies concentrated on the block scale, public open spaces, neighborhoods, parks, grouped vegetation, mixed arrangements, high vegetation, spatial parameters, and the use of air temperature data to report their findings. The cooling-effect evidence shows that the block scale has an average mitigation range of 0.7–2.7 °C, the neighborhood scale of 1.1–2.9 °C, and the city scale of 0.5–2.2 °C. Furthermore, it is critical to define reliable research methods and perform thorough software validation to assess model performance and establish guidelines for urban-landscape design accurately.

1. Introduction

Urbanization refers to expanding and creating urban areas that transform rural populations into urban populations. Urbanization and development can significantly impact the climate and energy exchange in an area, resulting in a phenomenon known as an urban heat island (UHI) [1]. Another relevant aspect of the temperature increase is the study of surface temperature with remote sensing, known as a surface urban heat island (SUHI) [2], also associated with land use and land cover [3]. In recent years, habitability problems like energy consumption [4], thermal comfort [5], and health [6,7] were associated with the UHI phenomenon.
According to the evidence, greenery in urban areas plays a crucial role in regulating microclimates and reducing the UHI [8,9], mainly through its shading and evapotranspiration effects [10]. As shown in the literature, vegetation can reduce air temperature (Ta) from 1 °C [5,11,12,13,14,15] to up to 9.2 °C [16] and 10 °C [17]. In terms of land-surface temperature (LST), the mitigation ranges from 1 °C [18] to 8 °C [19]. These effects are variable but persistent over time; studies conducted by Morakinyo et al. [20] and Wong et al. [21] found noticeable impacts of regulating day and night temperatures by greening. Additionally, Chen et al. [22] observed similar effects on land-surface temperature (LST). The impact of solar energy absorption is observed in the thermal conditions experienced during the day and the release of energy plays a critical role in determining the nocturnal conditions [23]. This phenomenon underscores the significance of solar energy as a determinant of the diurnal and nocturnal thermal conditions. Green areas significantly regulate the thermal environment during the day by providing shade and evaporative cooling. However, at night, the trees in parks can obstruct natural convective heat transfer, resulting in warming. Conversely, outside parks, the horizontal convection of evaporative cooling from the trees in the parks is more dominant than the warming effect [24]. Several researchers have noted that greenery positively affects urban climate [25], identified a link between greenery and urban cooling conditions [26], and demonstrated the effect of green areas in reducing the UHI and its environmental impact.
Further scientific research is necessary to enhance microclimate conditions by selecting the appropriate greenery, plant configuration, and urban morphology conditions [13]. Wong et al. [21] mention that different types of green infrastructure can be used considering the intervention scale and other factors such as urban geometry.
Vegetation’s cooling strategies have been analyzed using different spatial heterogeneity and scales like land use/land cover (LULC) [27] and Local Climate Zones (LCZ) [28]. Remote sensing is a technique used to acquire, monitor, and map spatial data in large areas by distinguishing land cover classification. This approach has extensive applications in numerous fields, including but not limited to environmental monitoring, land-use planning, and resource management, primarily focusing on a city or large scale. Otherwise, ENVI-met is a software application that simulates a microscale model for predicting UHI effects within the urban canopy with acceptable accuracy [29]. Through its non-hydrostatic three-dimensional microclimatic model, it can analyze the impact of greenery at a microscale level, providing a detailed understanding of its effects on urban environments [30,31].
It is essential to consider the heterogeneity of urban systems, as the density and presence of various elements, such as buildings, vegetation, infrastructure, and natural areas, can vary significantly even within short distances. This understanding is crucial for making informed decisions and developing effective policies [32]. According to Schuurman [33], municipal planners use various land-use categories to classify and categorize public and private lands across diverse communities. These disparities complicate data analysis. For this reason, the spatial scale is a fundamental concept in geographical analysis linked to the selection of analysis units used to represent the Area of Interest (AOI) [34]. According to Bartesaghi Koc et al. [35], the spatial scale is essential for identifying the ideal vegetation characteristics that can effectively mitigate the heat-island effect. This review emphasizes the relevance of considering the spatial scale while examining the impacts of greenery on the microclimate.
Since spatial variability exists, it is critical to establish a simplified measurement scale to analyze the effects of vegetation on the microclimate. Oke et al. [36] mention that urban units are the first approximation to measurement design, modeling, and applied schemes in urban climatology and define that the urban block is the smallest unit, and the neighborhood is the largest unit where homogeneity can be found. Studies related to urban territory can be analyzed using a classification based on urban structure. The block is formed by the road network, which usually comprises some adjacent street canyons with similar structures [36]. The neighborhood is characterized by typological, morphological, and socioeconomic homogeneity [37], and the city refers to the entire urban area, which may vary in size and population, depending on the country and its territorial regulation policies, according to the planned or spontaneous urban-growth model [38].
Over the last decade, there has been an interest in greenery’s benefits. Bowler et al. [39], Block et al. [40], Roy et al. [41], Zupancic et al. [42], and Bartesaghi Koc et al. [43] realized narrative and systematic reviews about greenery as a cooling strategy. The limited literature reviews that examine urban-scale mitigation focusing on vegetation parameters are an area of concern. This is mainly due to the constraints of spatial data in comprehending vegetation’s cooling and the fact that only a select number of countries and climates have been thoroughly researched. Additional research is required to comprehensively understand the role of greenery in mitigating the urban-heat-island effect.
This study analyzes available data on greenery as a cooling strategy in urban areas. The objectives include identifying urban scale, cataloging vegetation parameters, synthesizing results, and identifying knowledge gaps. Understanding the cooling effects of greenery in urban areas is critical for effective urban planning. This approach helps to implement practical strategies in diverse urban settings, contributing to effective urban planning and climate-resilience initiatives.

2. Materials and Methods

A systematic literature review was conducted to evaluate the impact of urban vegetation on microclimate conditions based on the urban-scale approach. The review aimed to provide insights into research methodology, strengths, and limitations of previous studies. This paper categorized the studies into three scales: block, neighborhood, and city. These categories were taken from the classification of urban morphological units of Oke et al. [36]. Each scale considers certain elements (Table 1); this allows for discerning and analyzing the diversity of methods used to evaluate the cooling potential of on-ground greenery and tree canopies in urban areas.

Systematic Literature Review

The analysis was conducted using a “systematic quantitative approach” [44], a well-accepted method for literature reviews in environmental and geographic sciences. The objective is to present the outcomes and fundamental components of greenery cooling implemented across urban scales. Two methods were used to carry out the search process, as shown in Figure 1. Firstly, specific keywords such as “urban vegetation”, “cooling effect”, “vegetation”, “urban park”, “urban tree”, “thermal comfort”, and “urban heat island” were entered into search engines such as Scopus and Google Scholar. Secondly, the snowball technique was used to expand the scope of the literature review by identifying additional relevant sources through the references cited in the existing literature. In this case, the papers consulted to identify other relevant documents cited in other reviews were conducted by Bartesaghi Koc et al. [43], Block et al. [40], Bowler et al. [39], Roy et al. [41], and Zupancic et al. [42].
The papers identified in the search results were selected by their relevance according to the following criteria: (i) peer-reviewed journal articles; (ii) publications that quantify the cooling effect of on-ground greenery and tree canopies via air/surface temperature, thermal comfort, or energy use; and (iii) papers that evaluate tree canopies or green spaces. This review excludes (i) papers that only analyze green roofs and vertical greening and (ii) studies conducted before 2010. Two hundred fifty sources were chosen for the present study. The relevant literature was analyzed to extract (i) bibliographic data (e.g., authors, journals, and keywords); (ii) geographic data (e.g., city, country, continent, and Köppen climate); (iii) urban data (e.g., urban scale); and (iv) vegetation data (e.g., vegetation arrangements and vegetation parameters). The analysis involved creating specific classifications for vegetation parameters and experimental variables using data from an extensive database. Three categories were used to categorize parameters: physical, biological, and spatial. Similarly, four categories were used to analyze variables: physical, biological, spatial, and contextual.

3. Results and Discussion

For the literature review, 250 articles were classified into three urban scales: 117 studies were conducted on a block scale, 67 on a neighborhood scale, and 66 on a city scale. A summary of the reviewed papers is presented in Supplementary Table S1.

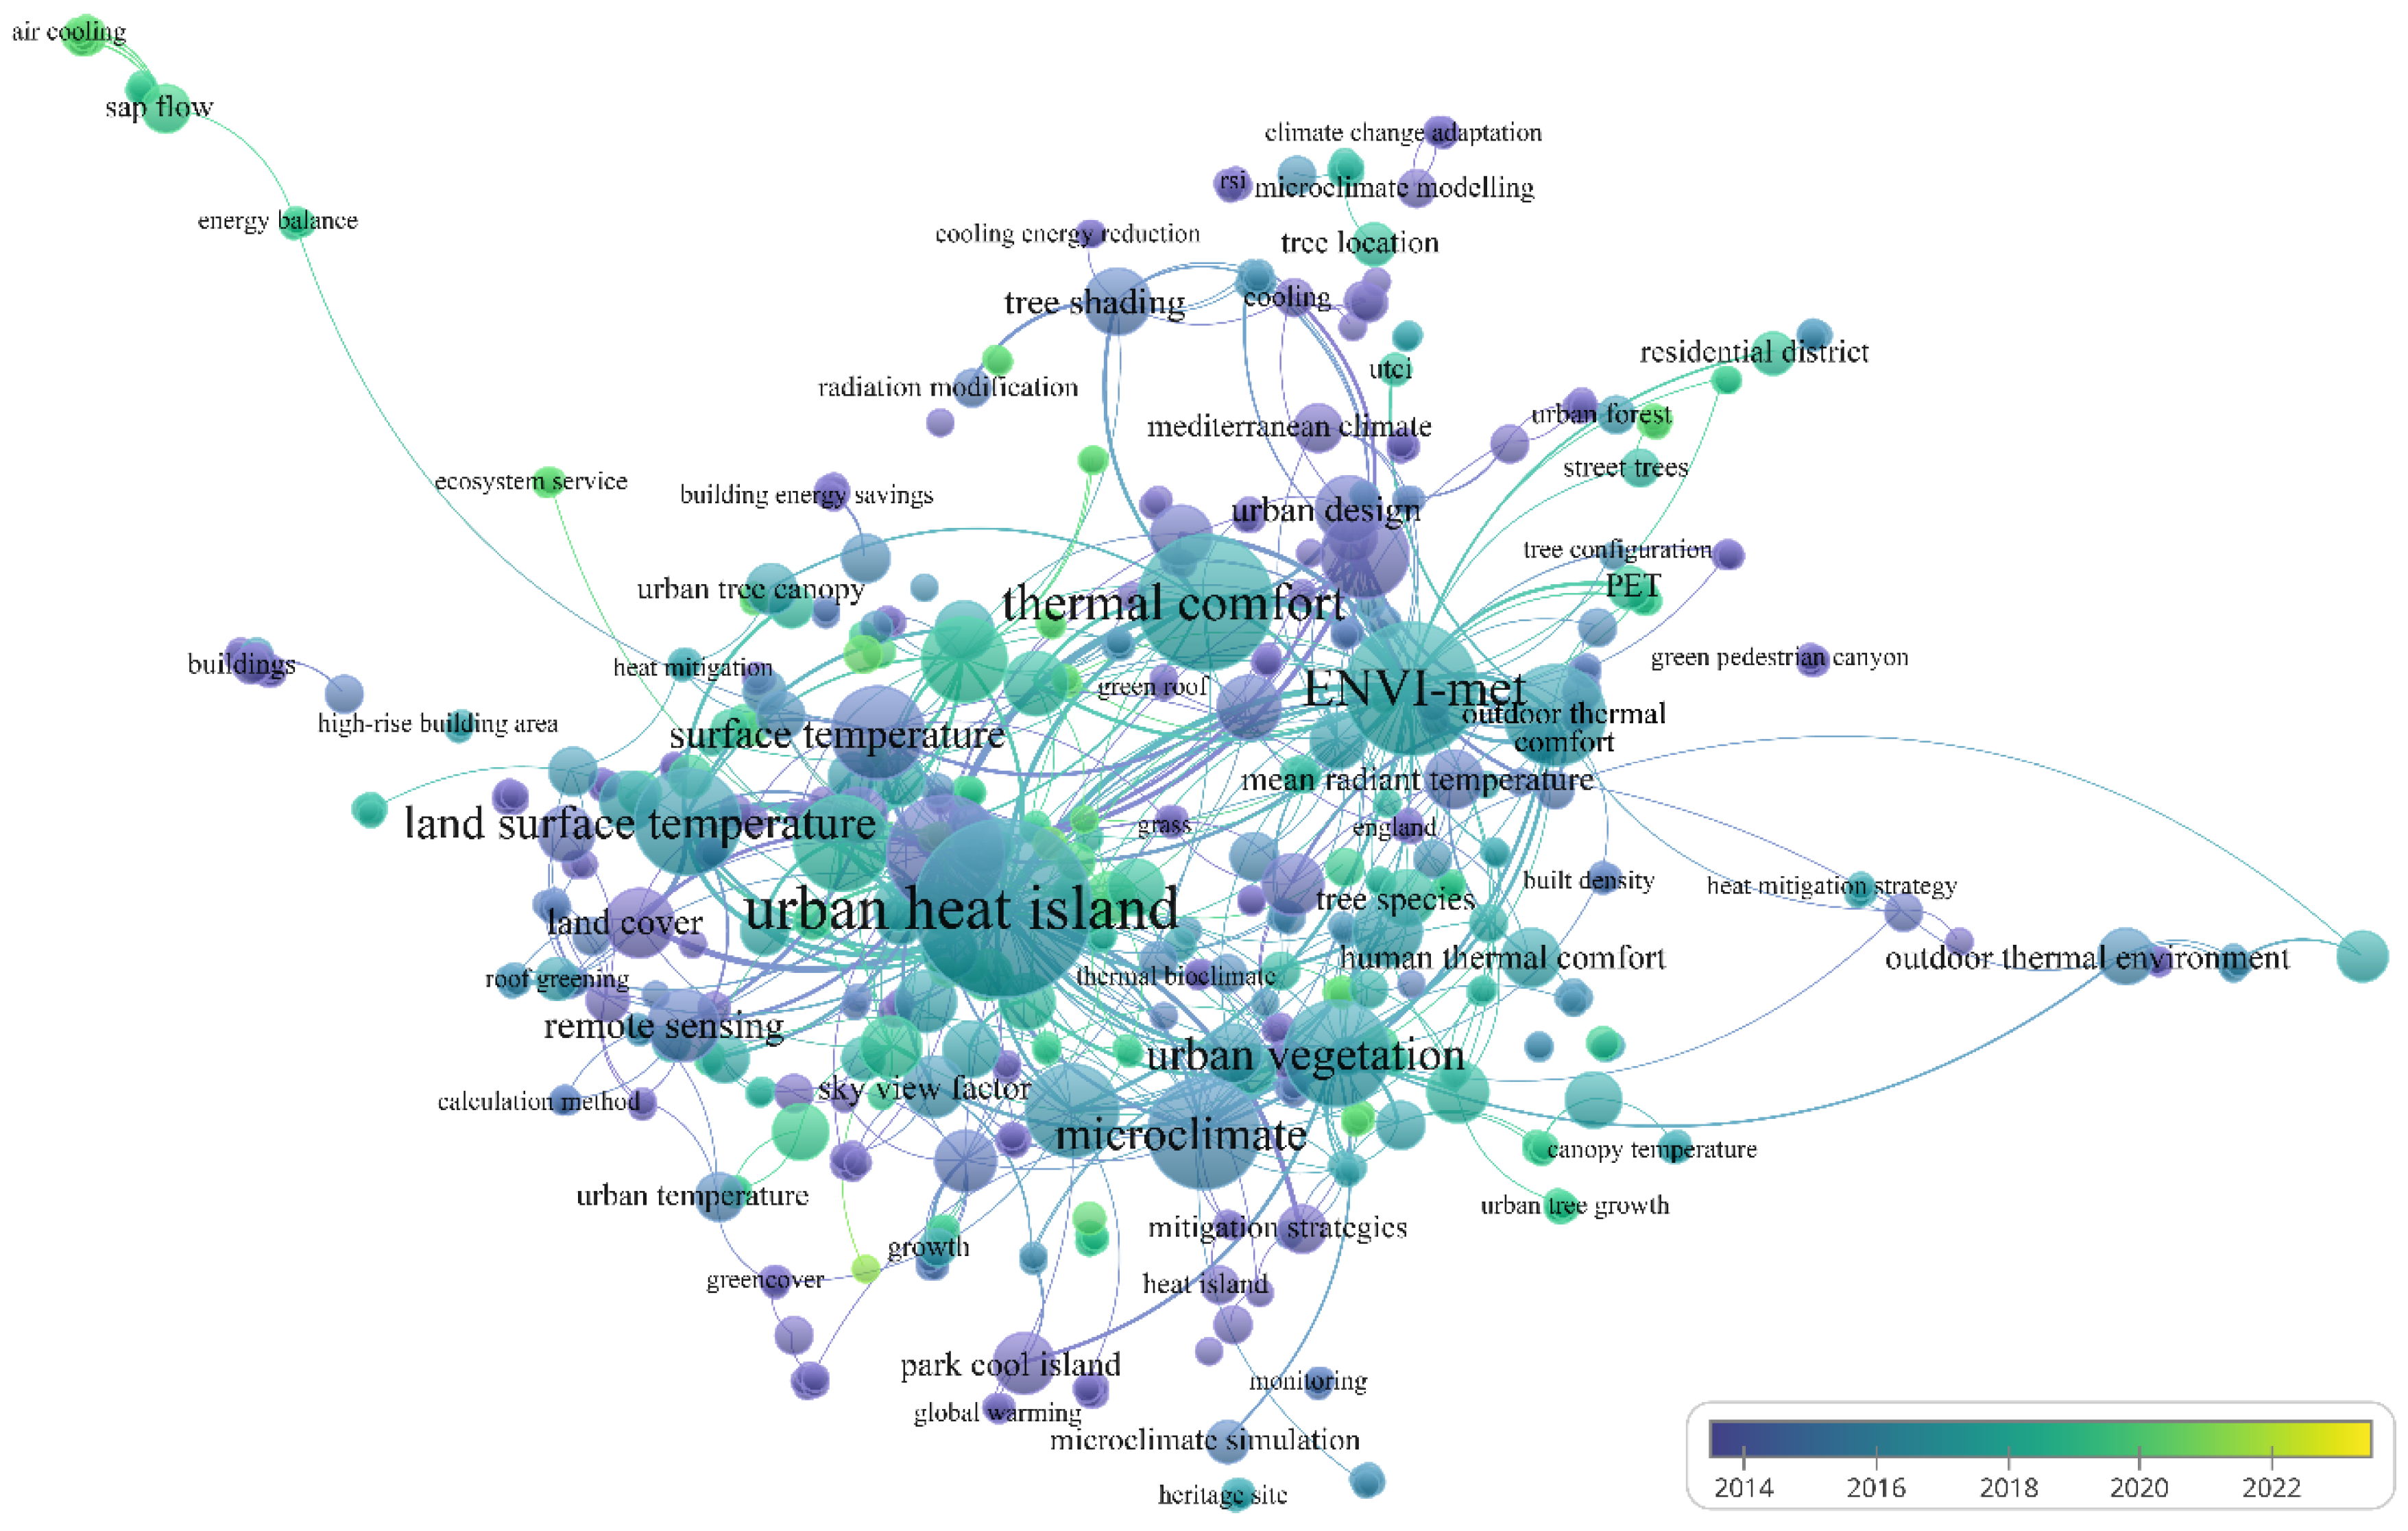
3.1. Bibliometric Trends

The Journal Citation Reports (JCR) provides a standardized classification system for research publications. This study identified four subject categories: Environmental Science, Engineering, Earth and Planetary, and Social Science. The database was used to analyze manuscripts’ key concepts and the network visualization with the VosViewer tool [45]. The concepts with the most occurrences on the topic, their interconnections, and their evolution pattern from 2014 to 2023 are illustrated in Figure 2. The graphic shows the links of six principal keywords used in the literature in 2018: urban heat island, ENVI-met, thermal comfort, urban vegetation, microclimate, and land-surface temperature (LST).

3.2. Geographic and Climate Factors

Research on the cooling effects of vegetation was concentrated in Asia, Europe, and America, with a significant focus on developed nations. The countries leading in research output include China, the USA, Germany, and Australia. The most studied climates are classified as (Cfa) humid subtropical (28.4%), (Cfb) oceanic climate (19.6%), and (Csa) hot summer Mediterranean climate (12%), based on the Köppen–Geiger classification. For more details on the differences in research findings across various urban scales, refer to Table 2.
It is interesting to note that the findings of this review coincide with the countries (United States, China, Japan, Germany, United Kingdom, Italy, and Greece) identified by Zupancic et al. [42], who studied the literature from 2009 to 2014, Bartesaghi Koc et al. [43], from 2009 to 2017, and Bowler et al. [39], from 1991 to 2009). With a few exceptions, China had a relatively modest presence before 2009. However, from 2009 to 2014, the country managed to secure the second position [42]. This indicates a significant improvement in China’s performance and highlights its growing influence in the relevant domain; this country led research in 2017 [43] and maintained its position in 2023. This result highlights the absence of studies in countries classified as Least Developed Countries (LDCs) (the United Nations defines LDCs as countries that have low levels of income and face severe structural impediments to sustainable development (https://www.un.org/development/desa/dpad/wp-content/uploads/sites/45/2018CDPhandbook.pdf, accessed on 1 May 2022). It is crucial to generate studies in developing countries because their socioeconomic and geographic characteristics are related to population growth and vulnerability to climate change.
The most frequent studies regarding climate analysis are found in the Cf (120) and Cs (35) climates. Bartesaghi Koc et al. [43] mention that there is still a large amount of unknown information on semi-arid and desert climates. In this regard, no changes were observed in research conducted in the Af climate (20), which was concentrated on the Asian continent. In the case of arid and semiarid climates, ten studies were found mainly in Phoenix, USA, eight studies were registered in Asia (e.g., Iran and Israel), and five studies were carried out in Africa; this determined that the publication frequency in dry climates has not changed. Few studies were identified in areas with dry climates (classification B), like Abdi et al. [46], that analyzed thermal comfort and simulated different distributions of plant elements to determine the ideal one to improve thermal comfort. In the same way, Colter et al. [47] focused on thermal comfort, analyzing six species of trees and finding that trees that attenuate solar radiation improve thermal comfort. The presence of vegetation can significantly improve the habitability of a particular area by enhancing the air’s capacity to absorb humidity, particularly in dry climates. Unfortunately, the potential benefits of vegetation in such places have not been fully explored or studied. The potential benefits of vegetation in arid environments have not been fully explored due to the scarcity of water resources. Water stress results in the reduction of plant size and leaf-area index (LAI).

3.3. Block-Scale Research

This level of analysis provides an in-depth understanding of microenvironment dynamics, spatial arrangements, very particular variables, and interactions within a localized metropolitan region.
The block-scale study comprehensively examines the features of specific areas. Previous investigations into the cooling effects of green spaces at the block level have analyzed public open spaces (49, 41.9%) and civic areas (38, 32.5%), with a notable emphasis on streets (32, 27.4%) and parks (32, 27.4%). However, less researched space types include service space, visible private space, private open space, external private space, private “public” spaces, and hypothetical spaces; therefore, places like squares, urban forests, front gardens, private gardens, and parking lots have been less analyzed.
This study provides an in-depth analysis of the role of vegetation in public open spaces and civic areas. Well-designed spaces of this type are essential for daily life and play a critical role in promoting healthy urban environments [48] and supporting active lifestyles [49] of all communities, while private spaces typically focus on particular needs. Thus, the wide range of research in these fields may be due to an emphasis on enhancing microclimatic conditions to increase habitability rather than explicitly addressing the urban-heat-island effect.
There is still considerable potential to investigate how vegetation might cool other areas in urban environments, enhancing livability and helping reduce the urban-heat-island effect. In this regard, Asikin et al. [50] and Tsiros and Hoffman [51] declare that private gardens contribute to improving the microclimate and could provide a high cooling effect in residential areas and reduce energy use [52,53,54,55,56,57,58]. Further studies are necessary to investigate the correlation between urban heat islands on streets and parking lots [59,60]. This exploration promises to improve the thermal comfort and overall quality of life in cities.
Studies have mainly focused on the cooling properties of vegetation by analyzing clusters of vegetation elements (90, 76.9%), and, regarding vegetation types, high vegetation is the most studied (65, 55.6%). The investigations have analyzed various distributions of vegetation, with mixed arrangements (48, 41.0%), aligned arrangements (23, 19.7%), and individual plant elements (12, 10.3%) being the most extensively studied. High vegetation has received particular attention (65, 55.6%). Limited research has been conducted on dense, scattered, and clustered arrangements, along with medium and low-level vegetation.
Studies by El-Bardisy et al. [61], Lechner [62], Li and Song [63], Su et al. [64], Wu and Chen [65], Yu et al. [66], Zhang et al. [67], and Zhou et al. [68] mention that the spatial distribution of vegetation has different effects on the microclimate parameters that can improve the thermal environment. Research has shown that analyzing the air temperature of vegetation arrangements reveals that grouped elements tend to perform better, with a temperature difference of 0.6 °C to 0.9 °C compared to individual elements. Furthermore, the cooling effect of plant groups is more extensive in terms of area.
Most studies on vegetation arrangement focus on aligned arrangements because it is easier to distribute vegetation in a way that provides better cooling effects in narrow and linear streets and corridors. Green-space arrangements are challenging to classify, with limited studies categorizing them as scattered, clustered, or dense. Although green spaces naturally exhibit mixed or random arrangements, more research is needed. Future studies can use simulations to evaluate vegetation distribution’s impact on the thermal environment, energy efficiency, and overall comfort.
Regarding vegetation parameters, the main emphasis has been placed on physical characteristics, with particular attention to tree height (48, 41.0%) and leaf-area index (LAI) (41, 35.0%). Spatial parameters, such as the presence or absence of trees and tree cover, have been given secondary importance (71, 60.7%), while biological parameters have been less-frequently considered (30, 25.6%). See Figure 3 for further details.
Researchers are focusing on understanding the factors that affect the cooling capacity of vegetation in parks and streets, since their cooling effect is well established. This study highlights the importance of vegetation parameters in urban areas, mainly focusing on physical types such as tree height and leaf area index (LAI) and considering spatial and biological parameters as secondary. Physical characteristics are essential for measuring the advantages of green infrastructure; Zhang et al. [69] identified a polynomial correlation between Mean Radiant Temperature and tree physical characteristics through linear regression. Huang and Li [56], Krayenhoff et al. [70], Santamouris et al. [13], and Zhang et al. [67] have identified that vegetation’s effectiveness in mitigating the temperature is related to LAI and tree height; this could explain the analysis of these parameters. Breda [71] mentions that the presence of LAI in the plant structure is integral to its role in the ecosystem. Zhang et al. [72] have identified it as a crucial factor in the plants’ cooling capabilities. It is worth mentioning that other research in Iran found that wide canopies and tall trunks might enhance comfort in an arid area [73].
Experimental studies mostly show regular changes in spatial variables (24, 51.1%), with the presence or absence of vegetation being the most common (17, 36.2%). Examples include the studies by Ouyang et al. [74] and Lee et al. [75], that apply different vegetation strategies, such as green roofs, green walls, street trees, and others. Changes in mixed variables (19, 40.4%) are also common in these studies.
The spatial distribution and arrangement of vegetation are critical factors that demand attention in experimental studies. The emphasis on spatial factors underlines the importance of understanding vegetation’s spatial distribution and arrangement of such studies. It is crucial to appreciate the significance of these factors to achieve accurate and reliable results. The presence or absence of vegetation can have effects on environmental processes and habitat suitability; due to the impact of vegetation has already been identified, research should focus on determining the influence of each of the variables that interfere with temperature mitigation, taking into account spatial, physical, and biological issues, and the context itself to have a more holistic or complete vision of the phenomenon.
The vegetation cooling effect is analyzed at different times. The studies mainly focused on single seasons (74, 63.2%) and multiple seasons (30, 25.6%), particularly summer (102, 87.2%) and winter (29, 24.8%). Regarding the time of day, the studies focus on all-day monitoring (65, 55.6%), with very few concentrating on morning, afternoon, or night.
The primary emphasis of these investigations has been on air temperature (49, 41.9%) and comfort index (37, 31.6%) as indicative measures of the cooling impact; only very few studies focus on surface temperature (8, 6.8%) at this scale. According to the research, green areas can decrease air temperatures by an average of 0.7–2.7 °C. Park vegetation typically reduces temperatures by 0.81–2.68 °C, while in streets, it falls between 0.41–2.15 °C. Regarding surface temperatures, green spaces in city blocks have a cooling effect ranging from 0.75 to 6.76 °C in parks and 3.0 to 6.0 °C in streets.
By reducing air temperatures, vegetation significantly improves thermal comfort, air quality, energy savings, and overall livability in cities. The average capacity to reduce air temperature of 0.7–2.7 °C was obtained from 22 studies, which is mainly consistent with Balany et al. [76], Oke [77], and Saaroni et al. [78], but also differs from Bowler et al. [39], Lai et al. [79], Zupancic et al. [42], Shashua-Bar and Hoffman [80], and Wong et al. [21]. The variation in temperature reduction across different types of urban spaces highlights the importance of context-specific urban planning and green infrastructure design.

3.4. Neighborhood-Scale Research

To understand urban areas, it is vital to comprehend the neighborhood scale, which refers to a group of urban blocks that comprise a distinct area. Analyzing this scale provides insight into the social, economic, and cultural dynamics of a particular urban setting.
Research conducted at the neighborhood scale explores the unique characteristics, dynamics, and issues of a specific area. The research has primarily focused on civic (41, 61.2%) and open public spaces (32, 47.8%) as key areas of interest for mitigating temperature through green areas on a neighborhood scale. Places like neighborhoods are important areas (47, 70.1%) to explore temperature mitigation in residential areas that impact the local microclimate; less researched space types include service space, apparent private space, private open space, external private space, private “public” spaces, and hypothetical space; therefore, places like streets, parks, square, urban forests, front gardens, private gardens, buildings, and parking lots are less analyzed.
Previous research has focused on investigating vegetation’s cooling effects by studying vegetation clusters (61, 91.0%), specifically on mixed-vegetation types (42, 62.7%). Neighborhood studies often focus on mixed-vegetation arrangements (38, 56.7%), indicating the diverse and intricate characteristics of urban green spaces at this scale; aligned, single, dense, scattered, and clustered arrangements have a deficient presence, as do medium and low vegetation.
The researchers analyze green areas at this scale as a unified entity. While studying individual elements, their differences decrease, so examining their interaction remains a critical factor of interest. As the observation scale expands, the degree of detail reduces. The spatial parameters (59, 88.1%), particularly the green cover (20, 29.85%), have been identified as crucial factors that positively impact temperature reduction at this scale. These findings are presented in Figure 3.
In experimental studies, researchers have altered spatial factors (19, 48.7%). It is important to comprehend the influence of vegetation’s spatial configuration on temperature reduction. At this scale, mixed variables have been altered (15, 38.5%), while physical, contextual, and biological variables are sporadically analyzed, as demonstrated in Figure 4.
Saito et al. [81] found that increasing green cover can enhance thermal conditions. Alchapar et al. [82] discovered that in Mendoza, Argentina, and Campinas, Brazil, this enhancement could reach 2.0 °C and 5.0 °C presently. Emmanuel and Loconsole [83] stated that raising green cover by 20% above current levels might reduce a significant portion of the anticipated urban-heat-island effect in Glasgow, UK, by 2050. These findings show the positive impact of increasing green cover on urban thermal conditions and mitigating the urban-heat-island effect at this scale.
Regarding the vegetation cooling-effect analysis period, the studies primarily examined a single season (44, 65.7%), predominantly the summer season (58, 86.6%). Regarding the time of day, most studies monitored the entire day (31, 46.3%), with only a few studies specifically targeting morning, afternoon, or night periods.
The main emphasis of these investigations has been on air temperature (35, 52.2%) and comfort index (16, 23.9%) as representative indices of the cooling impact. The findings suggest that green areas substantially reduce temperatures at the neighborhood level, with an observed average range of 1.1 to 2.9 °C.
Neighborhood and block-based methods produce comparable outcomes, indicating that methodology minimally influences results. The cooling effect of green spaces on air temperature is reliable and measurable, allowing researchers to investigate at both levels. Consistent outcomes enable conclusions to be applied to similar situations. This could help in developing urban policies and guidelines for landscape design.
The cooling impact of vegetation differs depending on the specific characteristics of each community. The average cooling effect in parks varies between 1.4 and 3.7 °C; in streets, it ranges from 0.3 to 1.0 °C, and on sets of urban blocks, from 1.03 to 2.7 °C. Furthermore, studies have demonstrated that green areas substantially impact reducing surface temperatures on streets, resulting in temperature reductions ranging from 2 to 5 °C. The surface temperature in urban blocks can be reduced by an average range of 1.75 to 2.9 °C, emphasizing the significant cooling advantages of greenery in neighborhood environments.

3.5. City Scale Research

Researchers at the city scale aim to understand interconnected urban systems, their dynamics, trends, and difficulties. The city scale comprehensively analyzes an entire city, including its various neighborhoods, districts, and urban regions. Numerous studies have aimed at reducing the temperature of cities by implementing green areas in public open spaces (20, 30.3%). Among the various types of settings analyzed, most research was conducted in urban areas (36, 54.5%) and parks (23, 34.8%). However, more research must be conducted in other areas, such as neighborhoods, squares, and urban forests. The cooling properties of vegetation have been analyzed in clusters (64, 100%), with a specific focus on mixed distributions (56, 84.8%).
Urban areas are typically studied using satellite measurements to assess the impact of parks on the surrounding environment. Recent research by Das et al. [84] in India found that parks cool nearby areas. The findings revealed that the mixed-vegetation type (56, 84.8%) was the most dominant among the identified varieties. Regarding the vegetation-parameter type, the spatial one (61, 92.4%) at the city level is the most analyzed, with land cover (35, 53.0%) being the principal parameter analyzed; there is a deficiency of studies on physical parameters (12, 18.2%) (Figure 3).
As previously stated, the level of detail decreases when the scale increases. In this case, the vegetation can only be examined as a group, and the researcher cannot observe the individual components of green areas for their analysis. The focus is on analyzing its spatial distribution through one of the vital urban variables used for this purpose, land cover, as mentioned by Kowe et al. [85]. Satellite data have been valuable in studying the effects of land-cover patterns on land-surface temperature (LST) due to their capacity to identify specific thermal characteristics on the Earth’s surface.
However, limited experimental studies have been conducted at the urban level (Figure 4). Some of them are simulations by Žuvela-Aloise et al. [86] that evaluate the impact of incorporating green areas in Vienna. Similarly, Brown et al. [87] used climate simulations to study the effects of microclimatic modifications on air temperature, radiation, and thermal comfort. However, prior research has primarily concentrated on surface temperature (49, 74.2%) as the most indicative measure of the cooling impact, followed by air temperature with a shallow presence (12, 18.2%).
Satellite remote sensors capture surface-temperature data. This research provides valuable insights into the impact of urbanization on the environment, human health, and energy consumption. Li et al. [88] conducted a large-scale longitudinal study on mitigating surface temperature in green areas using remote sensing over 20 years. Their findings indicate a positive impact of green areas. Implementing the remote sensing approach facilitates the execution of longitudinal studies, which is not feasible with minor scales such as neighborhoods or blocks due to the access to monitoring for extended periods; carrying out this type of research at smaller scales represents a significant challenge.
The vegetation’s cooling-effect analysis primarily concentrated on a specific period, especially a single season. Most of the studies were conducted in the summer (60.6%), with a minority in the spring, autumn, and winter. These results show a more significant cooling trend in summer. According to Cohen et al. [89], the largest cooling impact occurs during the summer and winter daytime hours. While Hamada and Ohta [90] and Zhang et al. [91] find a high-temperature difference between urban and green areas in the summer and a low difference in the winter, it is recommended to carry out studies in each of the seasons (e.g., spring, autumn, and winter) or longitudinal studies to understand the changes in the effects of the vegetation on the thermal microclimate in each season. Additionally, it was observed that 22.0% of the studies were monitored all day; however, in some cases, the mitigation reports did not specify the monitoring time. Nevertheless, reporting this data can facilitate the meta-analysis.
These research findings indicate that green areas at the city scale play a substantial role in reducing air temperatures, with an observed average range of 0.5 to 2.2 °C (Figure 5). The results indicate that typical temperature reduction provided by vegetation in parks varies between 0.5 and 2.5 °C, whereas in urban areas, it ranges from 1.1 to 2.4 °C.
The analysis indicates a correlation between measurements at the city scale and averages obtained at the block and neighborhood level. These findings support the validity of existing methodologies for analyzing the impact of vegetation on air temperature. They therefore suggest that research methods can be matched with caution, implying adequate comparability between approaches used at different scales of analysis to assess the thermal mitigation effects provided by greenery.
Examining surface temperature, the average range of reduction in parks is significantly higher, varying from 1.85 to 7.3 °C. Within urban blocks, the average temperature range is typically between 2.55 and 3.14 °C, although in cities, the range is typically between 2.65 and 3.9 °C.

4. Conclusions

Urban vegetation offers effective cooling, UHI mitigation, and enhanced city comfort. This research identifies trends and gaps in cooling strategies at various urban scales, emphasizing research methods and vegetation variables. The findings contribute to the evolving field of knowledge by tracking research progress since 2010 and exploring vegetation’s cooling effects. This study analyzes vegetation’s thermal contribution across three urban scales: block, neighborhood, and city. The main results were the following:
  • Green spaces, notably parks, are crucial in mitigating urban-heat-island effects and enhancing microclimates across block, neighborhood, and city scales;
  • The cooling effect of vegetation significantly impacts air and surface temperatures, with variations influenced by spatial distribution and site attributes;
  • Maintaining methodological consistency in research is essential for effective urban planning and landscape design, facilitating the optimization of cooling benefits derived from green infrastructure;
  • Overall, the research emphasizes the vital role of vegetation in improving urban living standards, promoting sustainability, and enhancing resilience against climate change.
The objective of this research was to present significant findings from studies conducted at varying scales, such as block, neighborhood, and city, to clarify the impact of vegetation on cooling effects and surface temperatures. By examining distinct site types, vegetation parameters, and cooling effects across these scales, we have gained valuable insights into the efficacy of green infrastructure in urban environments.
Block-Scale Findings:
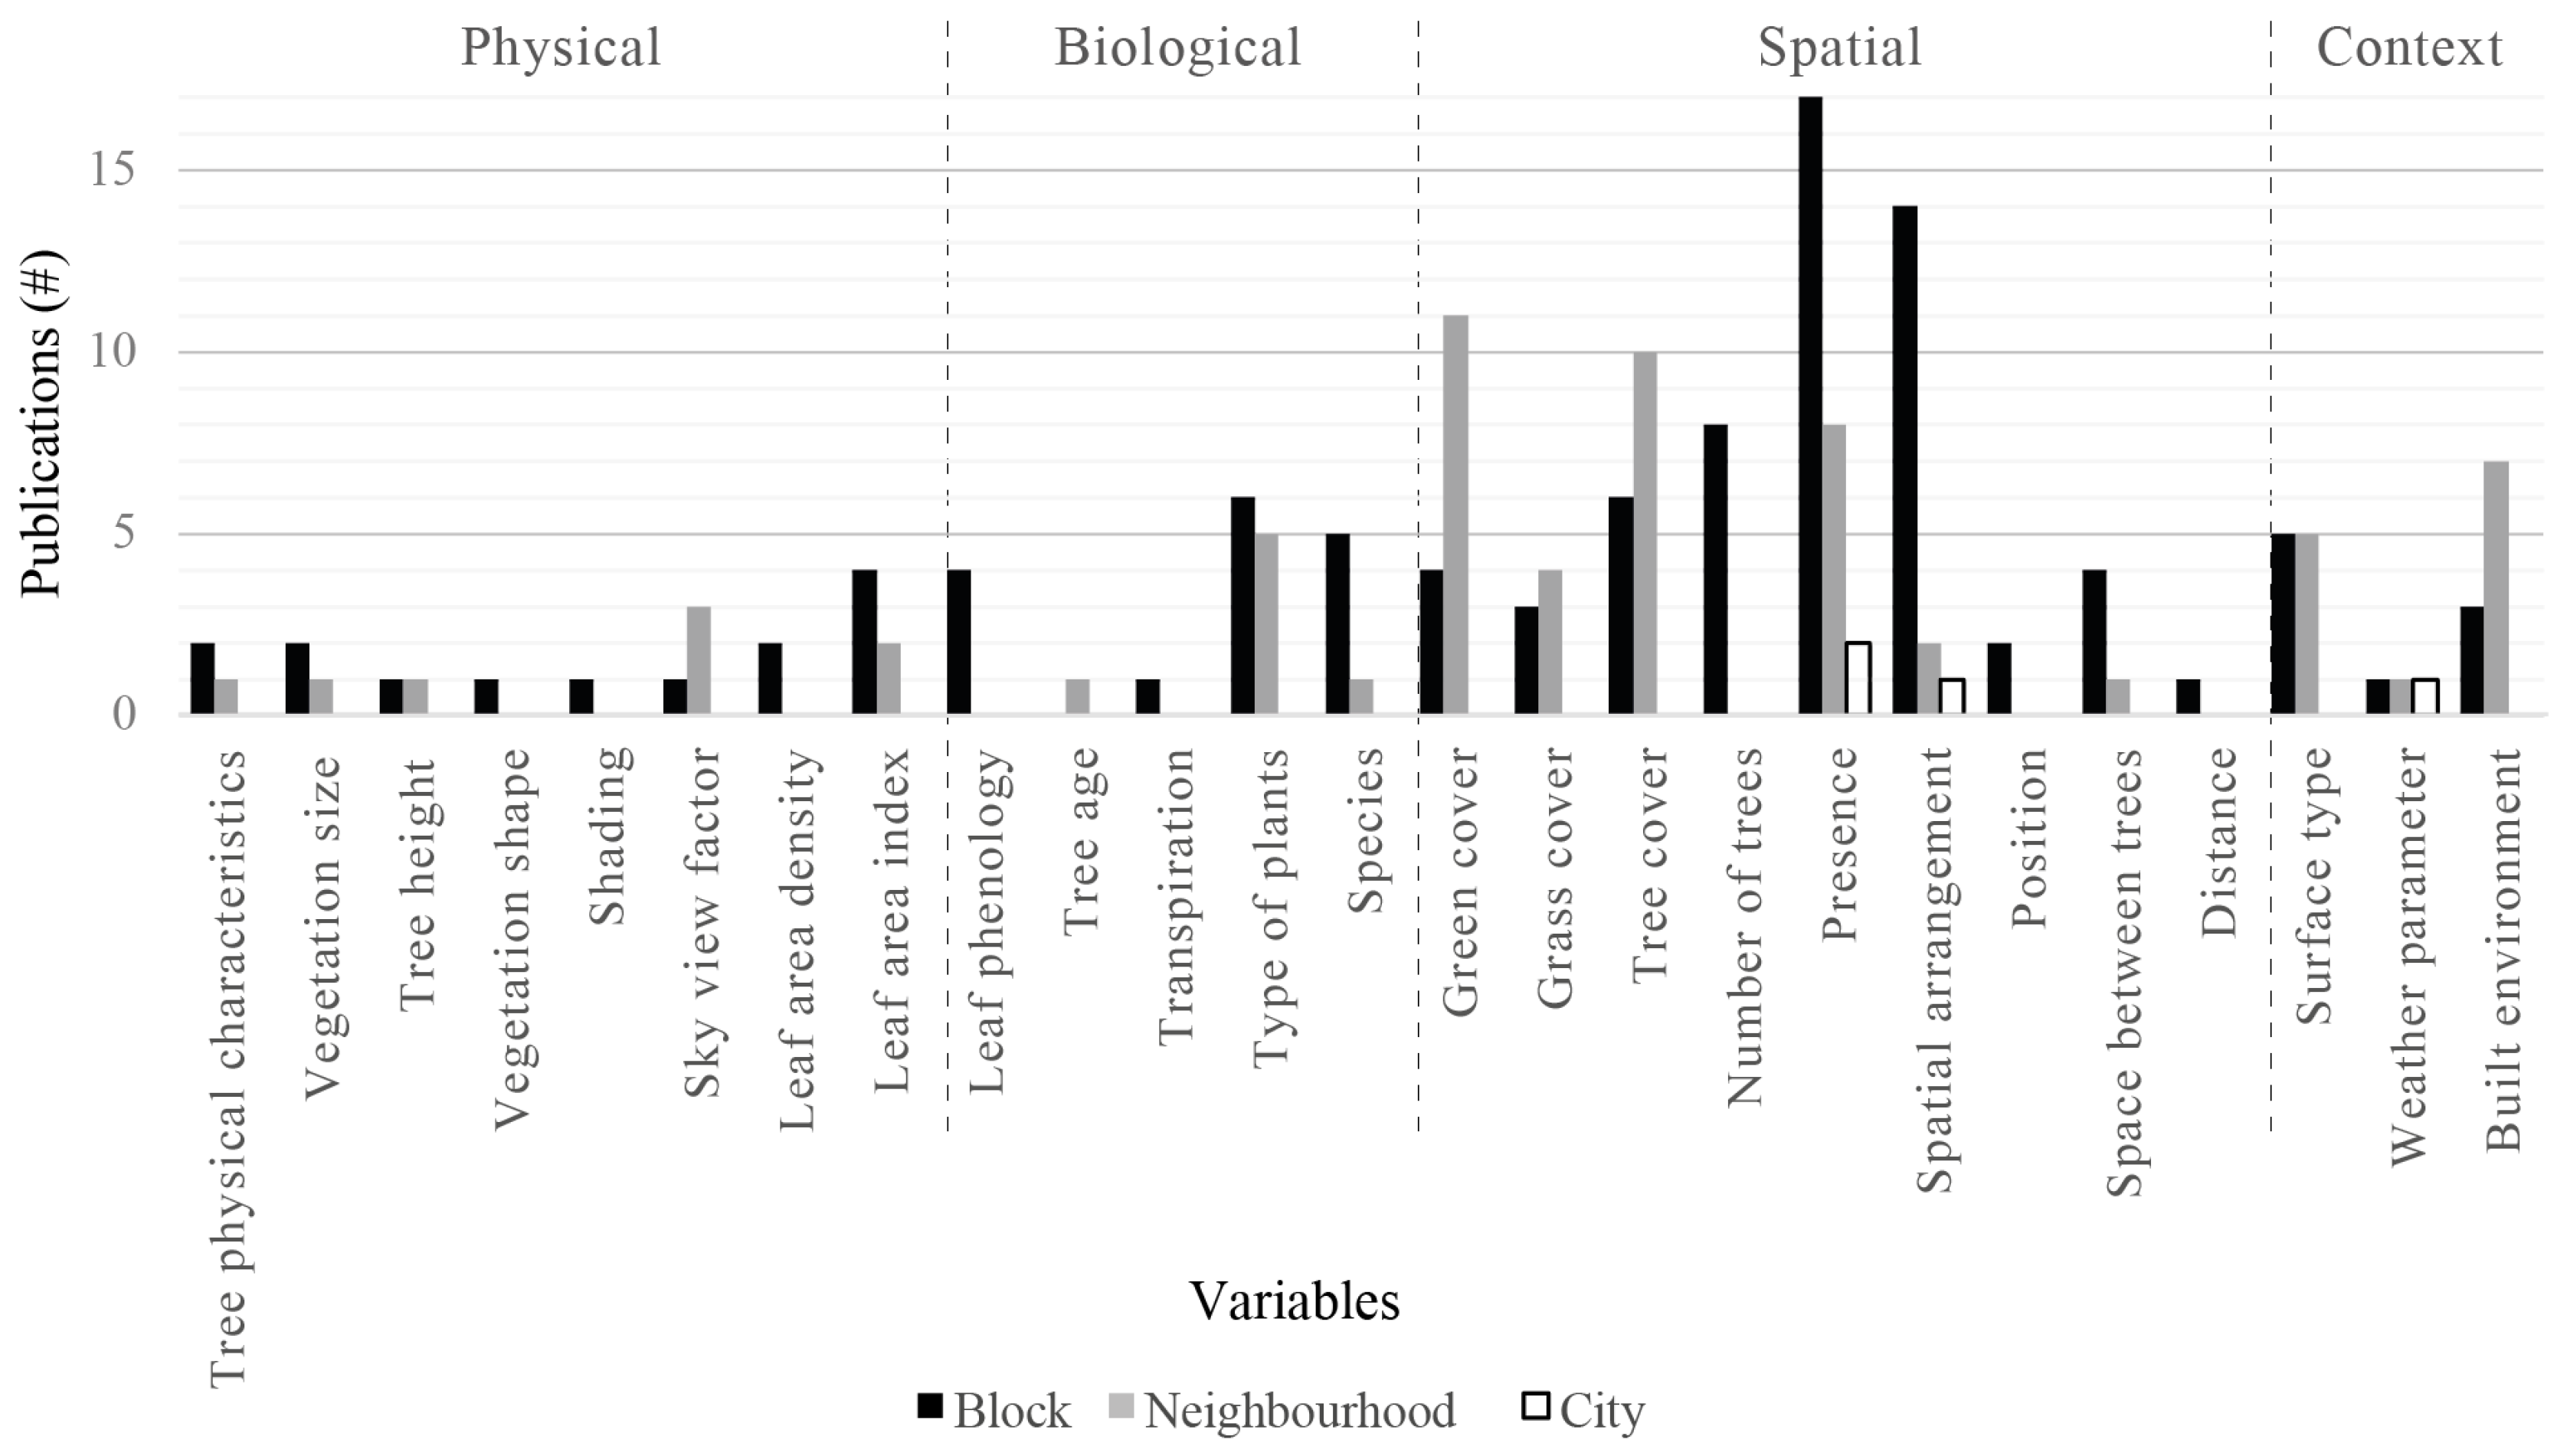
  • Predominant site type: public open spaces, particularly parks;
  • Most studies focused on grouped vegetation with mixed or aligned distribution;
  • Key physical vegetation parameters: tree height and leaf area index (LAI);
  • The cooling effect was assessed primarily through air temperature, with an average reduction of 0.7 to 2.7 °C. The cooling effect in parks ranged from 0.81 to 2.68 °C, and in streets from 0.41 to 2.15 °C;
  • Surface temperatures in parks ranged from 0.75 to 6.76 °C, and in streets from 3.0 to 6.0 °C.
Neighborhood-Scale Findings:
  • Predominant site type: open public spaces, mainly sets of blocks;
  • Most studies focused on mixed vegetation with mixed and aligned distribution;
  • The presence/absence parameter was primary for the spatial vegetation factor;
  • The cooling effect was assessed primarily through air temperature, with reductions ranging from 1.09 to 2.89 °C. The cooling effect in streets ranged from 0.3 to 1 °C and in sets of blocks from 1.0 to 2.7 °C;
  • Surface temperatures on streets ranged from 2.0 to 5.0 °C and in sets of blocks from 1.75 to 2.9 °C.
City-Scale Findings:
  • Predominant site type: open public spaces;
  • Most research examined mixed vegetation with mixed distributions;
  • Land cover was the key spatial vegetation parameter;
  • The cooling effect was assessed primarily through surface temperature, with average reductions between 0.48 and 2.17 °C. The cooling effect in parks ranged from 0.5 to 2.85 °C, and in cities from 1.1 to 2.4 °C;
  • Surface temperatures varied from 1.85 to 7.3 °C in parks, 2.55 to 3.14 °C in sets of blocks, and 2.65 to 3.9 °C in the city.
Analyzing green spaces at different scales can be complex, but maintaining methodological consistency is crucial for informed urban planning and landscape design. This approach optimizes the cooling benefits of green infrastructure and is important for future research and customized methods. Greenery affects microclimates and mitigates urban heat islands and climate change, improving living conditions.
This review has limitations due to differences in the methods used to collect data, the spatial scales analyzed, the statistical analyses performed, and the incomplete data reported in the literature. These limitations call for cautious interpretation and highlight areas for future research to address gaps in understanding urban microclimate dynamics.
Future research is recommended to prioritize developing countries in hot and arid climates. Studying the cooling effects of greenery in different countries and climates is important for understanding its effectiveness in diverse environmental contexts. Researchers can develop customized strategies to mitigate urban-heat-island effects and improve urban microclimates worldwide by analyzing these effects across different regions. Future studies should focus on urban areas such as streets, parking lots, and residential gardens. It is advisable to use experimental methods and simulation tools to examine the relationship between vegetation and space type. It is suggested that microscale monitoring networks be established to collect longitudinal data, and standardizing research methods are highly recommended. For meta-analyses, it is essential to include reported data such as research location, morphological characteristics of urban space, building typology, and vegetation parameters.

Supplementary Materials

The following supporting information can be downloaded at https://0-www-mdpi-com.brum.beds.ac.uk/article/10.3390/urbansci8020041/s1; see Table S1. Summary database of block scale. Table S2. Summary database of neighborhood scale. Table S3. Summary database of city scale.

Author Contributions

Conceptualization, J.A.L.-P. and K.E.M.-T.; methodology, J.A.L.-P. and E.F.H.P.; formal analysis, J.A.L.-P.; investigation, J.A.L.-P. and K.E.M.-T.; data curation, J.A.L.-P., K.E.M.-T. and P.C.-A.; writing—original draft preparation, J.A.L.-P., K.E.M.-T. and P.C.-A.; writing—review and editing, J.A.L.-P. and K.E.M.-T.; visualization, J.A.L.-P. and K.E.M.-T.; supervision, E.F.H.P.; project administration, J.A.L.-P. and E.F.H.P. All authors have read and agreed to the published version of the manuscript.

Funding

This research received no external funding.

Data Availability Statement

Data are contained within the article and Supplementary Materials.

Acknowledgments

This work was published with the support of the Institute of Innovation and Competence (Instituto de Innovación y Competitividad) of the Secretariat of Innovation and Economic Development (Secretaría de Innovación y Desarrollo Económico) of the State of Chihuahua.

Conflicts of Interest

The author declare no conflicts of interest.

References

  1. Zheng, S.; Guldmann, J.M.; Liu, Z.; Zhao, L.; Wang, J.; Pan, X. Modeling of Shade Creation and Radiation Modification by Four Tree Species in Hot and Humid Areas: Case Study of Guangzhou, China. Urban For. Urban Green. 2020, 47, 126545. [Google Scholar] [CrossRef]
  2. Saha, M.; Al Kafy, A.; Bakshi, A.; Al Faisal, A.; Almulhim, A.I.; Rahaman, Z.A.; Al Rakib, A.; Fattah, M.A.; Akter, K.S.; Rahman, M.T.; et al. Modelling Microscale Impacts Assessment of Urban Expansion on Seasonal Surface Urban Heat Island Intensity Using Neural Network Algorithms; Elsevier B.V.: Amsterdam, The Netherlands, 2022; Volume 275, ISBN 5136043200512. [Google Scholar]
  3. Stewart, I.D.; Krayenhoff, E.S.; Voogt, J.A.; Lachapelle, J.A.; Allen, M.A.; Broadbent, A.M. Time Evolution of the Surface Urban Heat Island. Earth’s Futur. 2021, 9, e2021EF002178. [Google Scholar] [CrossRef]
  4. Akbari, H.; Pomerantz, M.; Taha, H. Cool Surfaces and Shade Trees to Reduce Energy Use and Improve Air Quality in Urban Areas. Sol. Energy 2001, 70, 295–310. [Google Scholar] [CrossRef]
  5. Noro, M.; Lazzarin, R. Urban Heat Island in Padua, Italy: Simulation Analysis and Mitigation Strategies. Urban Clim. 2015, 14, 187–196. [Google Scholar] [CrossRef]
  6. Wallemacq, P. Economic Losses, Poverty & Disasters 1998–2017; Centre for Research on the Epidemiology of Disasters CRED: Louvain-la-Neuve, Belgium, 2018. [Google Scholar]
  7. World Health Organization. Quantitative Risk Assessment of the Effects of Climate Change on Selected Causes of Death, 2030s and 2050s; WHO Press: Geneva, Switzerland, 2014; ISBN 9789241507691. [Google Scholar]
  8. Al-Gretawee, H.; Rayburg, S.; Neave, M. The Cooling Effect of a Medium Sized Park on an Urban Environment. Int. J. Geomate 2016, 11, 2541–2546. [Google Scholar] [CrossRef]
  9. Shashua-Bar, L.; Pearlmutter, D.; Erell, E. The Cooling Efficiency of Urban Landscape Strategies in a Hot Dry Climate. Landsc. Urban Plan. 2009, 92, 179–186. [Google Scholar] [CrossRef]
  10. Wang, Y.; Akbari, H. The Effects of Street Tree Planting on Urban Heat Island Mitigation in Montreal. Sustain. Cities Soc. 2016, 27, 122–128. [Google Scholar] [CrossRef]
  11. Amani-Beni, M.; Zhang, B.; di Xie, G.; Xu, J. Impact of Urban Park’s Tree, Grass and Waterbody on Microclimate in Hot Summer Days: A Case Study of Olympic Park in Beijing, China. Urban For. Urban Green. 2018, 32, 1–6. [Google Scholar] [CrossRef]
  12. Chatzinikolaou, E.; Chalkias, C.; Dimopoulou, E. Urban Microclimate Improvement Using ENVI-MET Climate Model. Int. Arch. Photogramm. Remote Sens. Spat. Inf. Sci. 2018, 42, 69–76. [Google Scholar] [CrossRef]
  13. Santamouris, M.; Ban-Weiss, G.; Osmond, P.; Paolini, R.; Synnefa, A.; Cartalis, C.; Muscio, A.; Zinzi, M.; Morakinyo, T.E.; Ng, E.; et al. Progress in Urban Greenery Mitigation Science—Assessment Methodologies Advanced Technologies and Impact on Cities. J. Civ. Eng. Manag. 2018, 24, 638–671. [Google Scholar] [CrossRef]
  14. Shahidan, M. Potential of Individual and Cluster Tree Cooling Effect Performances through Tree Canopy Density Model Evaluation in Improving Urban Microclimate. Curr. World Environ. 2015, 10, 398–413. [Google Scholar] [CrossRef]
  15. Souch, C.A.; Souch, C. The Effect of Trees on Summertime below Canopy Urban Climates: A Case Study Bloomington, Indiana. J. Arboric. 1993, 19, 303–312. [Google Scholar] [CrossRef]
  16. Rashid, Z.A.; Al Junid, S.A.M.; Thani, S.K.S.O. Trees’ Cooling Effect on Surrounding Air Temperature Monitoring System: Implementation and Observation. Int. J. Simul. Syst. Sci. Technol. 2014, 15, 70–77. [Google Scholar] [CrossRef]
  17. Bencheikh, H.; Rchid, A. The Effects of Green Spaces (Palme Trees) on the Microclimate in Arides Zones, Case Study: Ghardaia, Algeria. Energy Procedia 2012, 18, 10–20. [Google Scholar] [CrossRef]
  18. Xie, Q.; Wu, Y.; Zhou, Z.; Wang, Z. Remote Sensing Study of the Impact of Vegetation on Thermal Environment in Different Contexts. IOP Conf. Ser. Earth Environ. Sci. 2018, 121, 022009. [Google Scholar] [CrossRef]
  19. Bartesaghi-Koc, C.; Osmond, P.; Peters, A. Quantifying the Seasonal Cooling Capacity of ‘Green Infrastructure Types’ (GITs): An Approach to Assess and Mitigate Surface Urban Heat Island in Sydney, Australia. Landsc. Urban Plan. 2020, 203, 103893. [Google Scholar] [CrossRef]
  20. Morakinyo, T.E.; Ouyang, W.; Lau, K.K.L.; Ren, C.; Ng, E. Right Tree, Right Place (Urban Canyon): Tree Species Selection Approach for Optimum Urban Heat Mitigation—Development and Evaluation. Sci. Total Environ. 2020, 719, 137461. [Google Scholar] [CrossRef] [PubMed]
  21. Wong, N.H.; Tan, C.L.; Kolokotsa, D.D.; Takebayashi, H. Greenery as a Mitigation and Adaptation Strategy to Urban Heat. Nat. Rev. Earth Environ. 2021, 2, 166–181. [Google Scholar] [CrossRef]
  22. Chen, J.; Jin, S.; Du, P. Roles of Horizontal and Vertical Tree Canopy Structure in Mitigating Daytime and Nighttime Urban Heat Island Effects. Int. J. Appl. Earth Obs. Geoinf. 2020, 89, 102060. [Google Scholar] [CrossRef]
  23. Konarska, J.; Holmer, B.; Lindberg, F.; Thorsson, S. Influence of Vegetation and Building Geometry on the Spatial Variations of Air Temperature and Cooling Rates in a High-Latitude City. Int. J. Climatol. 2016, 36, 2379–2395. [Google Scholar] [CrossRef]
  24. Chang, C.R.; Li, M.H. Effects of Urban Parks on the Local Urban Thermal Environment. Urban For. Urban Green. 2014, 13, 672–681. [Google Scholar] [CrossRef]
  25. Jung, A.; Kardeván, P.; Tokei, L. Detection of Urban Effect on Vegetation in a Less Built-up Hungarian City by Hyperspectral Remote Sensing. Phys. Chem. Earth 2005, 30, 255–259. [Google Scholar] [CrossRef]
  26. Duncan, J.M.A.; Boruff, B.; Saunders, A.; Sun, Q.; Hurley, J.; Amati, M. Turning down the Heat: An Enhanced Understanding of the Relationship between Urban Vegetation and Surface Temperature at the City Scale. Sci. Total Environ. 2019, 656, 118–128. [Google Scholar] [CrossRef] [PubMed]
  27. LaGro, J. Land-Use Classification. In Encyclopedia of Soils in the Environment; Elsevier Ltd.: New York, NY, USA, 2005; pp. 321–327. ISBN 978-0-12-348530-4. [Google Scholar]
  28. Stewart, I.D.; Oke, T.R. Local Climate Zones for Urban Temperature Studies. Bull. Am. Meteorol. Soc. 2012, 93, 1879–1900. [Google Scholar] [CrossRef]
  29. Stavrakakis, G.M.; Al Katsaprakakis, D.; Damasiotis, M. Basic Principles, Most Common Computational Tools, and Capabilities for Building Energy and Urban Microclimate Simulations. Energies 2021, 14, 6707. [Google Scholar] [CrossRef]
  30. Bruse, D.; Bruse, M. Decoding Urban Nature Envi-Met. Available online: https://www.envi-met.com/wp-content/uploads/2021/08/ENVI-met-brochure.pdf (accessed on 10 May 2022).
  31. Rui, L.; Buccolieri, R.; Gao, Z.; Gatto, E.; Ding, W. Study of the Effect of Green Quantity and Structure on Thermal Comfort and Air Quality in an Urban-like Residential District by ENVI-Met Modelling. Build. Simul. 2019, 12, 183–194. [Google Scholar] [CrossRef]
  32. Cadenasso, M.L.; Pickett, S.T.A.; Schwarz, K. Spatial Heterogeneity in Urban Ecosystems: Reconceptualizing Land Cover and a Framework for Classification. Front. Ecol. Environ. 2007, 5, 80–88. [Google Scholar] [CrossRef]
  33. Schuurman, N. Spatial Ontologies. Int. Encycl. Hum. Geogr. 2009, 377–383. [Google Scholar]
  34. Labib, S.M.; Lindley, S.; Huck, J.J. Spatial Dimensions of the Influence of Urban Green-Blue Spaces on Human Health: A Systematic Review. Environ. Res. 2020, 180, 108869. [Google Scholar] [CrossRef] [PubMed]
  35. Bartesaghi Koc, C.; Osmond, P.; Peters, A. Towards a Comprehensive Green Infrastructure Typology: A Systematic Review of Approaches, Methods and Typologies. Urban Ecosyst. 2017, 20, 15–35. [Google Scholar] [CrossRef]
  36. Oke, T.R.; Mills, G.; Christen, A.; Voogt, J.A. Urban Climates; Cambridge University Press: Cambridge, UK, 2017; ISBN 978-1-107-42953-6. [Google Scholar]
  37. Lynch, K. The Image of the City; MIT Press: Cambridge, MA, USA, 1960; Volume 11, ISBN 0262120046. [Google Scholar]
  38. Bazant, S.J. Expansión Urbana Incontrolada y Paradigmas de La Planeación Urbana. Espac. Abierto 2010, 19, 475–503. [Google Scholar]
  39. Bowler, D.E.; Buyung-Ali, L.; Knight, T.M.; Pullin, A.S. Urban Greening to Cool Towns and Cities: A Systematic Review of the Empirical Evidence. Landsc. Urban Plan. 2010, 97, 147–155. [Google Scholar] [CrossRef]
  40. Block, A.H.; Livesley, S.J.; Williams, N.S.G. Responding to the Urban Heat Island: A Review of the Potential of Green Infrastructure; Victoria Centre for Climate Change Adaptation Research: Melbourne, Australia, 2012; ISBN 978-0-7340-4813-4. [Google Scholar]
  41. Roy, S.; Byrne, J.; Pickering, C. A Systematic Quantitative Review of Urban Tree Benefits, Costs, and Assessment Methods across Cities in Different Climatic Zones. Urban For. Urban Green. 2012, 11, 351–363. [Google Scholar] [CrossRef]
  42. Zupancic, T.; Westmacott, C.; Bulthuis, M. The Impact of Green Space on Heat and Air Pollution in Urban Communities: A Meta-Narrative Systematic Review; David Suzuki Foundation: Vancouver, BC, Canada, 2015. [Google Scholar]
  43. Bartesaghi Koc, C.; Osmond, P.; Peters, A. Evaluating the Cooling Effects of Green Infrastructure: A Systematic Review of Methods, Indicators and Data Sources. Sol. Energy 2018, 166, 486–508. [Google Scholar] [CrossRef]
  44. Pickering, C.; Byrne, J. The Benefits of Publishing Systematic Quantitative Literature Reviews for PhD Candidates and Other Early-Career Researchers. High. Educ. Res. Dev. 2014, 33, 534–548. [Google Scholar] [CrossRef]
  45. van Eck, N.J.; Waltman, L. Citation-Based Clustering of Publications Using CitNetExplorer and VOSviewer. Scientometrics 2017, 111, 1053–1070. [Google Scholar] [CrossRef]
  46. Abdi, B.; Hami, A.; Zarehaghi, D. Impact of Small-Scale Tree Planting Patterns on Outdoor Cooling and Thermal Comfort. Sustain. Cities Soc. 2020, 56, 102085. [Google Scholar] [CrossRef]
  47. Colter, K.R.; Middel, A.C.; Martin, C.A. Effects of Natural and Artificial Shade on Human Thermal Comfort in Residential Neighborhood Parks of Phoenix, Arizona, USA. Urban For. Urban Green. 2019, 44, 126429. [Google Scholar] [CrossRef]
  48. Han, S.; Song, D.; Xu, L.; Ye, Y.; Yan, S.; Shi, F.; Zhang, Y.; Liu, X.; Du, H. Behaviour in Public Open Spaces: A Systematic Review of Studies with Quantitative Research Methods. Build. Environ. 2022, 223, 109444. [Google Scholar] [CrossRef]
  49. Motomura, M.; Koohsari, M.J.; Lin, C.Y.; Ishii, K.; Shibata, A.; Nakaya, T.; Kaczynski, A.T.; Veitch, J.; Oka, K. Associations of Public Open Space Attributes with Active and Sedentary Behaviors in Dense Urban Areas: A Systematic Review of Observational Studies. Health Place 2022, 75, 102816. [Google Scholar] [CrossRef]
  50. Asikin, D.; Nugroho, A.M.; Hasyim, A.W. An Evaluation Building Passive Cooling Achieved through Modification of Herbal Garden Configuration. In Proceedings of the 1st ICETIA 2014, Surakarta, Indonesia, 4 December 2014; pp. 9–13. [Google Scholar]
  51. Tsiros, I.X.; Hoffman, M.E. Thermal and Comfort Conditions in a Semi-Closed Rear Wooded Garden and Its Adjacent Semi-Open Spaces in a Mediterranean Climate (Athens) during Summer. Archit. Sci. Rev. 2014, 57, 63–82. [Google Scholar] [CrossRef]
  52. Akbari, H.; Taha, H. The Impact of Trees and White Surfaces on Residential Heating and Cooling Energy Use in Four Canadian Cities. Energy 1992, 17, 141–149. [Google Scholar] [CrossRef]
  53. Carver, A.D.; Unger, D.R.; Parks, C.L. Modeling Energy Savings from Urban Shade Trees: An Assessment of the CITYgreen® Energy Conservation Module. Environ. Manag. 2004, 34, 650–655. [Google Scholar] [CrossRef] [PubMed]
  54. Donovan, G.H.; Butry, D.T. The Value of Shade: Estimating the Effect of Urban Trees on Summertime Electricity Use. Energy Build. 2009, 41, 662–668. [Google Scholar] [CrossRef]
  55. Gómez-Muñoz, V.M.; Porta-Gándara, M.A.; Fernández, J.L. Effect of Tree Shades in Urban Planning in Hot-Arid Climatic Regions. Landsc. Urban Plan. 2010, 94, 149–157. [Google Scholar] [CrossRef]
  56. Huang, K.T.; Li, Y.J. Impact of Street Canyon Typology on Building’s Peak Cooling Energy Demand: A Parametric Analysis Using Orthogonal Experiment. Energy Build. 2017, 154, 448–464. [Google Scholar] [CrossRef]
  57. Kong, F.; Yan, W.; Zheng, G.; Yin, H.; Cavan, G.; Zhan, W.; Zhang, N.; Cheng, L. Retrieval of Three-Dimensional Tree Canopy and Shade Using Terrestrial Laser Scanning (TLS) Data to Analyze the Cooling Effect of Vegetation. Agric. For. Meteorol. 2016, 217, 22–34. [Google Scholar] [CrossRef]
  58. Taha, H.; Akbari, H.; Rosenfeld, A. Heat Island and Oasis Effects of Vegetative Canopies: Micro-Meteorological Field-Measurements. Theor. Appl. Climatol. 1991, 44, 123–138. [Google Scholar] [CrossRef]
  59. Onishi, A.; Cao, X.; Ito, T.; Shi, F.; Imura, H. Evaluating the Potential for Urban Heat-Island Mitigation by Greening Parking Lots. Urban For. Urban Green. 2010, 9, 323–332. [Google Scholar] [CrossRef]
  60. Scott, K.I.; Simpson, J.R.; McPherson, E.G. Effetcs of Tree Cover on Parking Lot Microclimate and Vehicle Emissions. J. Arboric. 1999, 25, 129–142. [Google Scholar]
  61. El-Bardisy, W.M.; Fahmy, M.; El-Gohary, G.F. Climatic Sensitive Landscape Design: Towards a Better Microclimate through Plantation in Public Schools, Cairo, Egypt. Procedia Soc. Behav. Sci. 2016, 216, 206–216. [Google Scholar] [CrossRef]
  62. Lechner, N. Sustainable Cities Are Solar-Responsive Cities. In Low Carbon Cities: Transforming Urban Systems; Lehmann, S., Ed.; Routledge: London, UK, 2014; p. 484. ISBN 978-0415729833. [Google Scholar]
  63. Li, Y.; Song, Y. Optimization of Vegetation Arrangement to Improve Microclimate and Thermal Comfort in an Urban Park. Int. Rev. Spat. Plan. Sustain. Dev. 2019, 7, 18–30. [Google Scholar] [CrossRef] [PubMed]
  64. Su, W.; Zhang, Y.; Yang, Y.; Ye, G. Examining the Impact of Greenspace Patterns on Land Surface Temperature by Coupling LiDAR Data with a CFD Model. Sustainability 2014, 6, 6799–6814. [Google Scholar] [CrossRef]
  65. Wu, Z.; Chen, L. Optimizing the Spatial Arrangement of Trees in Residential Neighborhoods for Better Cooling Effects: Integrating Modeling with in-Situ Measurements. Landsc. Urban Plan. 2017, 167, 463–472. [Google Scholar] [CrossRef]
  66. Yu, Z.W.; Guo, Q.H.; Sun, R.H. Impacts of Urban Cooling Effect Based on Landscape Scale: A Review. Chin. J. Appl. Ecol. 2015, 26, 636–642. [Google Scholar]
  67. Zhang, L.; Zhan, Q.; Lan, Y. Effects of the Tree Distribution and Species on Outdoor Environment Conditions in a Hot Summer and Cold Winter Zone: A Case Study in Wuhan Residential Quarters. Build. Environ. 2018, 130, 27–39. [Google Scholar] [CrossRef]
  68. Zhou, W.; Huang, G.; Cadenasso, M.L. Does Spatial Configuration Matter? Understanding the Effects of Land Cover Pattern on Land Surface Temperature in Urban Landscapes. Landsc. Urban Plan. 2011, 102, 54–63. [Google Scholar] [CrossRef]
  69. Zhang, J.; Gou, Z.; Zhang, F.; Yu, R. The Tree Cooling Pond Effect and Its Influential Factors: A Pilot Study in Gold Coast, Australia. Nat.-Based Solut. 2023, 3, 100058. [Google Scholar] [CrossRef]
  70. Krayenhoff, E.S.; Jiang, T.; Christen, A.; Martilli, A.; Oke, T.R.; Bailey, B.N.; Nazarian, N.; Voogt, J.A.; Giometto, M.G.; Stastny, A.; et al. A Multi-Layer Urban Canopy Meteorological Model with Trees (BEP-Tree): Street Tree Impacts on Pedestrian-Level Climate. Urban Clim. 2020, 32, 100590. [Google Scholar] [CrossRef]
  71. Bréda, N.J.J. Leaf Area Index. Encycl. Ecol. 2008, 3, 2148–2154. [Google Scholar] [CrossRef]
  72. Zhang, J.; Gou, Z.; Cheng, B.; Khoshbakht, M. A Study of Physical Factors Influencing Park Cooling Intensities and Their Effects in Different Time of the Day. J. Therm. Biol. 2022, 109, 103336. [Google Scholar] [CrossRef]
  73. Gachkar, D.; Taghvaei, S.H.; Norouzian-Maleki, S. Outdoor Thermal Comfort Enhancement Using Various Vegetation Species and Materials (Case Study: Delgosha Garden, Iran). Sustain. Cities Soc. 2021, 75, 103309. [Google Scholar] [CrossRef]
  74. Ouyang, W.; Morakinyo, T.E.; Lee, Y.; Tan, Z.; Ren, C.; Ng, E. How to Quantify the Cooling Effects of Green Infrastructure Strategies from a Spatio-Temporal Perspective: Experience from a Parametric Study. Landsc. Urban Plan. 2023, 237, 104808. [Google Scholar] [CrossRef]
  75. Lee, H.; Lim, H.; Park, S. Quantitative Assessment of Green Coverage Changes under the Human-Biometeorological Perspective: A Simulation Case Study in Jeju, Republic of Korea. Sustain. Cities Soc. 2023, 97, 104734. [Google Scholar] [CrossRef]
  76. Balany, F.; Ng, A.W.M.; Muttil, N.; Muthukumaran, S.; Wong, M.S. Green Infrastructure as an Urban Heat Island Mitigation Strategy—A Review. Water 2020, 12, 3577. [Google Scholar] [CrossRef]
  77. Oke, T.R. Street Design and Urban Canopy Layer Climate. Energy Build. 1988, 11, 103–113. [Google Scholar] [CrossRef]
  78. Saaroni, H.; Amorim, J.H.; Hiemstra, J.A.; Pearlmutter, D. Urban Green Infrastructure as a Tool for Urban Heat Mitigation: Survey of Research Methodologies and Findings across Different Climatic Regions. Urban Clim. 2018, 24, 94–110. [Google Scholar] [CrossRef]
  79. Lai, D.; Liu, W.; Gan, T.; Liu, K.; Chen, Q. A Review of Mitigating Strategies to Improve the Thermal Environment and Thermal Comfort in Urban Outdoor Spaces. Sci. Total Environ. 2019, 661, 337–353. [Google Scholar] [CrossRef]
  80. Shashua-Bar, L.; Hoffman, M.E. Vegetation as a Climatic Component in the Design of an Urban Street. Energy Build. 2000, 31, 221–235. [Google Scholar] [CrossRef]
  81. Saito, K.; Said, I.; Shinozaki, M. Evidence-Based Neighborhood Greening and Concomitant Improvement of Urban Heat Environment in the Context of a World Heritage Site—Malacca, Malaysia. Comput. Environ. Urban Syst. 2017, 64, 356–372. [Google Scholar] [CrossRef]
  82. Alchapar, N.L.; Pezzuto, C.C.; Correa, E.N. Parámetros Urbanos Morfo-Materiales y Su Correlación Con Las Temperaturas de Aire En Verano. Ambient. Construído 2018, 18, 199–213. [Google Scholar] [CrossRef]
  83. Emmanuel, R.; Loconsole, A. Green Infrastructure as an Adaptation Approach to Tackling Urban Overheating in the Glasgow Clyde Valley Region, UK. Landsc. Urban Plan. 2015, 138, 71–86. [Google Scholar] [CrossRef]
  84. Das, M.; Das, A.; Momin, S. Quantifying the Cooling Effect of Urban Green Space: A Case from Urban Parks in a Tropical Mega Metropolitan Area (India). Sustain. Cities Soc. 2022, 87, 104062. [Google Scholar] [CrossRef]
  85. Kowe, P.; Dube, T.; Mushore, T.D.; Ncube, A.; Nyenda, T.; Mutowo, G.; Chinembiri, T.S.; Traore, M.; Kizilirmak, G. Impacts of the Spatial Configuration of Built-up Areas and Urban Vegetation on Land Surface Temperature Using Spectral and Local Spatial Autocorrelation Indices. Remote Sens. Lett. 2022, 13, 1222–1235. [Google Scholar] [CrossRef]
  86. Žuvela-Aloise, M.; Koch, R.; Buchholz, S.; Früh, B. Modelling the Potential of Green and Blue Infrastructure to Reduce Urban Heat Load in the City of Vienna. Clim. Chang. 2016, 135, 425–438. [Google Scholar] [CrossRef]
  87. Brown, R.D.; Vanos, J.; Kenny, N.; Lenzholzer, S. Designing Urban Parks That Ameliorate the Effects of Climate Change. Landsc. Urban Plan. 2015, 138, 118–131. [Google Scholar] [CrossRef]
  88. Li, C.; Lu, L.; Fu, Z.; Sun, R.; Pan, L.; Han, L.; Guo, H.; Li, Q. Diverse Cooling Effects of Green Space on Urban Heat Island in Tropical Megacities. Front. Environ. Sci. 2022, 10. [Google Scholar] [CrossRef]
  89. Cohen, P.; Potchter, O.; Matzarakis, A. Daily and Seasonal Climatic Conditions of Green Urban Open Spaces in the Mediterranean Climate and Their Impact on Human Comfort. Build. Environ. 2012, 51, 285–295. [Google Scholar] [CrossRef]
  90. Hamada, S.; Ohta, T. Seasonal Variations in the Cooling Effect of Urban Green Areas on Surrounding Urban Areas. Urban For. Urban Green. 2010, 9, 15–24. [Google Scholar] [CrossRef]
  91. Zhang, Z.; Lv, Y.; Pan, H. Cooling and Humidifying Effect of Plant Communities in Subtropical Urban Parks. Urban For. Urban Green. 2013, 12, 323–329. [Google Scholar] [CrossRef]
  92. Herath, H.M.P.I.K.; Halwatura, R.U.; Jayasinghe, G.Y. Evaluation of Green Infrastructure Effects on Tropical Sri Lankan Urban Context as an Urban Heat Island Adaptation Strategy. Urban For. Urban Green. 2018, 29, 212–222. [Google Scholar] [CrossRef]
  93. Vailshery, L.S.; Jaganmohan, M.; Nagendra, H. Effect of Street Trees on Microclimate and Air Pollution in a Tropical City. Urban For. Urban Green. 2013, 12, 408–415. [Google Scholar] [CrossRef]
  94. Salas Esparza, M.G.; Herrera Sosa, L.C. La Vegetación Como Sistema de Control Para Las Islas de Calor Urbano En Ciudad Juárez, Chihuahua. Rev. Hábitat Sustentable 2017, 7, 14–23. [Google Scholar] [CrossRef]
  95. Stocco, S.; Correa, E. Alternativas de Diseno Para Mejorar El Desempeno Ambiental de Plazas Urbanas En Mendoza (Argentina). Evaluacion Mediante Simulacion Con ENVI-Met 3.1. Inf. Construcción 2018, 70, e253. [Google Scholar]
  96. de Abreu-Harbich, L.V.; Labaki, L.C.; Matzarakis, A. Effect of Tree Planting Design and Tree Species on Human Thermal Comfort in the Tropics. Landsc. Urban Plan. 2015, 138, 99–109. [Google Scholar] [CrossRef]
  97. Rana, G.; Ferrara, R.M. Air Cooling by Tree Transpiration: A Case Study of Olea Europaea, Citrus Sinensis and Pinus Pinea in Mediterranean Town. Urban Clim. 2019, 29, 100507. [Google Scholar] [CrossRef]
  98. Chen, T.; Yang, H.; Chen, G.; Lam, C.K.C.; Hang, J.; Wang, X.; Liu, Y.; Ling, H. Integrated Impacts of Tree Planting and Aspect Ratios on Thermal Environment in Street Canyons by Scaled Outdoor Experiments. Sci. Total Environ. 2021, 764, 142920. [Google Scholar] [CrossRef]
  99. Fu, J.; Wang, Y.; Zhou, D.; Cao, S.-J. Impact of Urban Park Design on Microclimate in Cold Regions Using Newly Developped Prediction Method. Sustain. Cities Soc. 2022, 80, 103781. [Google Scholar] [CrossRef]
  100. Wang, H.; Cai, Y.; Deng, W.; Li, C.; Dong, Y.; Zhou, L.; Sun, J.; Li, C.; Song, B.; Zhang, F.; et al. The Effects of Tree Canopy Structure and Tree Coverage Ratios on Urban Air Temperature Based on ENVI-Met. Forests 2023, 14, 80. [Google Scholar] [CrossRef]
  101. Coutts, A.M.; White, E.C.; Tapper, N.J.; Beringer, J.; Livesley, S.J. Temperature and Human Thermal Comfort Effects of Street Trees across Three Contrasting Street Canyon Environments. Theor. Appl. Climatol. 2016, 124, 55–68. [Google Scholar] [CrossRef]
  102. Gromke, C.; Blocken, B.; Janssen, W.; Merema, B.; van Hooff, T.; Timmermans, H. CFD Analysis of Transpirational Cooling by Vegetation: Case Study for Specific Meteorological Conditions during a Heat Wave in Arnhem, Netherlands. Build. Environ. 2015, 83, 11–26. [Google Scholar] [CrossRef]
  103. Rahman, M.A.; Moser, A.; Rötzer, T.; Pauleit, S. Within Canopy Temperature Differences and Cooling Ability of Tilia Cordata Trees Grown in Urban Conditions. Build. Environ. 2017, 114, 118–128. [Google Scholar] [CrossRef]
  104. Bochenek, A.D.; Klemm, K. Effectiveness of Tree Pattern in Street Canyons on Thermal Conditions and Human Comfort. Assessment of an Urban Renewal Project in Historical District in Lodz (Poland). Atmosphere 2021, 12, 751. [Google Scholar] [CrossRef]
  105. Shashua-Bar, L.; Potchter, O.; Bitan, A.; Boltansky, D.; Yaakov, Y. Microclimate Modelling of Street Tree Species Effects within the Varied Urban Morphology in the Mediterranean City of Tel Aviv, Israel. Int. J. Climatol. 2010, 30, 44–57. [Google Scholar] [CrossRef]
  106. Cheung, P.K.; Jim, C.Y. Differential Cooling Effects of Landscape Parameters in Humid-Subtropical Urban Parks. Landsc. Urban Plan. 2019, 192, 103651. [Google Scholar] [CrossRef]
  107. Gillner, S.; Vogt, J.; Tharang, A.; Dettmann, S.; Roloff, A. Role of Street Trees in Mitigating Effects of Heat and Drought at Highly Sealed Urban Sites. Landsc. Urban Plan. 2015, 143, 33–42. [Google Scholar] [CrossRef]
  108. Irmak, M.A.; Yilmaz, S.; Mutlu, E.; Yilmaz, H. Assessment of the Effects of Different Tree Species on Urban Microclimate. Environ. Sci. Pollut. Res. 2018, 25, 15802–15822. [Google Scholar] [CrossRef] [PubMed]
  109. Li, Y.; Fan, S.; Li, K.; Zhang, Y.; Kong, L.; Xie, Y.; Dong, L. Large Urban Parks Summertime Cool and Wet Island Intensity and Its Influencing Factors in Beijing, China. Urban For. Urban Green. 2021, 65, 127375. [Google Scholar] [CrossRef]
  110. Yan, H.; Wang, X.; Hao, P.; Dong, L. Study on the Microclimatic Characteristics and Human Comfort of Park Plant Communities in Summer. Procedia Environ. Sci. 2012, 13, 755–765. [Google Scholar] [CrossRef]
  111. Srivanit, M.; Hokao, K. Simulation of Cooling Effectiveness of Trees to Improve Outdoor Thermal Environment on Different Climate-Sensitive Urban Forms during A Summer of Bangkok. BUILT 2019, 13, 19–28. [Google Scholar]
  112. Colunga, M.L.; Cambrón-Sandoval, V.H.; Suzán-Azpiri, H.; Guevara-Escobar, A.; Luna-Soria, H. The Role of Urban Vegetation in Temperature and Heat Island Effects in Querétaro City, Mexico. Atmósfera 2015, 28, 205–218. [Google Scholar] [CrossRef]
  113. Alchapar, N.L.; Pezzuto, C.C.; Correa, E.N.; Chebel Labaki, L. The Impact of Different Cooling Strategies on Urban Air Temperatures: The Cases of Campinas, Brazil and Mendoza, Argentina. Theor. Appl. Climatol. 2017, 130, 35–50. [Google Scholar] [CrossRef]
  114. Duarte, D.H.S.; Shinzato, P.; Gusson, C. dos S.; Alves, C.A. The Impact of Vegetation on Urban Microclimate to Counterbalance Built Density in a Subtropical Changing Climate. Urban Clim. 2015, 14, 224–239. [Google Scholar] [CrossRef]
  115. Ellis, K.N.; Hathaway, J.M.; Reyes Mason, L.; Howe, D.A.; Epps, T.H.; Brown, V.M. Summer Temperature Variability across Four Urban Neighborhoods in Knoxville, Tennessee, USA. Theor. Appl. Climatol. 2015, 127, 701–710. [Google Scholar] [CrossRef]
  116. Vaz Monteiro, M.; Doick, K.J.; Handley, P.; Peace, A. The Impact of Greenspace Size on the Extent of Local Nocturnal Air Temperature Cooling in London. Urban For. Urban Green. 2016, 16, 160–169. [Google Scholar] [CrossRef]
  117. Lee, H.; Mayer, H.; Chen, L. Contribution of Trees and Grasslands to the Mitigation of Human Heat Stress in a Residential District of Freiburg, Southwest Germany. Landsc. Urban Plan. 2016, 148, 37–50. [Google Scholar] [CrossRef]
  118. Peron, F.; De Maria, M.M.; Spinazzè, F.; Mazzali, U. An Analysis of the Urban Heat Island of Venice Mainland. Sustain. Cities Soc. 2015, 19, 300–309. [Google Scholar] [CrossRef]
  119. Oliveira, S.; Andrade, H.; Vaz, T. The Cooling Effect of Green Spaces as a Contribution to the Mitigation of Urban Heat: A Case Study in Lisbon. Build. Environ. 2011, 46, 2186–2194. [Google Scholar] [CrossRef]
  120. Skoulika, F.; Santamouris, M.; Kolokotsa, D.; Boemi, N. On the Thermal Characteristics and the Mitigation Potential of a Medium Size Urban Park in Athens, Greece. Landsc. Urban Plan. 2014, 123, 73–86. [Google Scholar] [CrossRef]
  121. Sodoudi, S.; Shahmohamadi, P.; Vollack, K.; Cubasch, U.; Che-Ani, A.I. Mitigating the Urban Heat Island Effect in Megacity Tehran. Adv. Meteorol. 2014, 2014, 547974. [Google Scholar] [CrossRef]
  122. Makido, Y.; Hellman, D.; Shandas, V. Nature-Based Designs to Mitigate Urban Heat: The Efficacy of Green Infrastructure Treatments in Portland, Oregon. Atmosphere 2019, 10, 282. [Google Scholar] [CrossRef]
  123. Ng, E.; Chen, L.; Wang, Y.; Yuan, C. A Study on the Cooling Effects of Greening in a High-Density City: An Experience from Hong Kong. Build. Environ. 2012, 47, 256–271. [Google Scholar] [CrossRef]
  124. Tan, Z.; Lau, K.K.L.; Ng, E. Urban Tree Design Approaches for Mitigating Daytime Urban Heat Island Effects in a High-Density Urban Environment. Energy Build. 2016, 114, 265–274. [Google Scholar] [CrossRef]
  125. Lin, W.; Yu, T.; Chang, X.; Wu, W.; Zhang, Y. Calculating Cooling Extents of Green Parks Using Remote Sensing: Method and Test. Landsc. Urban Plan. 2015, 134, 66–75. [Google Scholar] [CrossRef]
  126. Yan, H.; Fan, S.; Guo, C.; Wu, F.; Zhang, N.; Dong, L. Assessing the Effects of Landscape Design Parameters on Intra-Urban Air Temperature Variability: The Case of Beijing, China. Build. Environ. 2014, 76, 44–53. [Google Scholar] [CrossRef]
  127. Trihamdani, A.R.; Lee, H.S.; Kubota, T.; Phuong, T.T.T. Configuration of Green Spaces for Urban Heat Island Mitigation and Future Building Energy Conservation in Hanoi Master Plan 2030. Buildings 2015, 5, 933–947. [Google Scholar] [CrossRef]
  128. Jaganmohan, M.; Knapp, S.; Buchmann, C.M.; Schwarz, N. The Bigger, the Better? The Influence of Urban Green Space Design on Cooling Effects for Residential Areas. J. Environ. Qual. 2016, 45, 134–145. [Google Scholar] [CrossRef]
  129. Leuzinger, S.; Vogt, R.; Körner, C. Tree Surface Temperature in an Urban Environment. Agric. For. Meteorol. 2010, 150, 56–62. [Google Scholar] [CrossRef]
Figure 1. Review process.
Urbansci 08 00041 g001
Figure 2. Keywords reported in the literature.
Urbansci 08 00041 g002
Figure 3. Presence of vegetation parameters in publications from 2010 to 2023.
Urbansci 08 00041 g003
Figure 4. Presence of experimental vegetation variables in publications 2010–2023.
Urbansci 08 00041 g004
Figure 5. Urban-greenery cooling potential reported from 2010 to 2023. Analysis based on 52 articles [10,11,12,20,65,72,74,82,86,91,92,93,94,95,96,97,98,99,100,101,102,103,104,105,106,107,108,109,110,111,112,113,114,115,116,117,118,119,120,121,122,123,124,125,126,127,128,129].
Urbansci 08 00041 g005
Table 1. Urban-scale classification.
ScaleElements
BlockLand lots and public urban space
NeighborhoodSet of urban blocks
CityCities and metropolitan areas
Table 2. Most studied climates and locations on urban scales.
Urban ScaleKöppen–Geiger’s ClimatePublications (%)Country
BlockCfa31 (26.5%)China (Nanjing, Shanghai, and Guangzhou), Japan (Osaka, Ishikawa, Nagoya, and Saitama), and Italy (Rome, Bari, and Bolzano)
Cfb21 (17.9%)Germany (Mainz, Berlin, and Munich), Netherlands (Arnhem, Utrecht, and Assen), UK (Manchester)
Csa16 (13.7%)Greece (Athens), Iran (Tehran and Urmia), Israel (Tel Aviv), and Italy (Rome)
Af7 (6%)Malaysia (Putrajaya and Shah Alam) and Singapore (Singapore)
BWh6 (5.1%)USA (Phoenix and Tempe), and Egypt (Cairo and El-Sherouk)
NeighborhoodCfa18 (26.9%)China (Shanghai, Guangzhou, and Nanjing), Japan (Nagoya and Saga), and Brazil (São Paulo, Campinas)
Cfb13 (19.4%)UK (London and Glasgow), Germany (Berlin, Oberhausen, and Freiburg), and Italy (Milan)
Cwa8 (11.9%)China (Hong Kong and Tsuen Wan)
Csa7 (10.4%)Greece (Athens and Chania), and Iran (Tehran)
CityCfa22 (33.3%)China (Nanjing, Shanghai, and Shenzhen), USA (Baltimore, Atlanta, Tampa), and Australia (Sydney and Gold Coast)
Cfb15 (22.7%)UK (Edinburgh, London, and Wrexham), Denmark (Copenhagen, Aarhus, and Odense), and Germany (Munich and Leipzig)
Af9 (13.6%)Singapore (Singapore), Malaysia (Kuala Lumpur), and Indonesia (Jakarta)
Source: compiled by author. Abbreviations: climate zone: Af (tropical rainforest climate); BWh (hot desert climate); Csa (hot summer mediterranean climate); Cfa (humid subtropical climate); Cfb (oceanic climate); and Cwa (monsoon-influenced humid subtropical climate).
Disclaimer/Publisher’s Note: The statements, opinions and data contained in all publications are solely those of the individual author(s) and contributor(s) and not of MDPI and/or the editor(s). MDPI and/or the editor(s) disclaim responsibility for any injury to people or property resulting from any ideas, methods, instructions or products referred to in the content.

