
Ethane-CO2 Mixture Adsorption in Silicalite: Influence of Tortuosity and Connectivity of Pores on Selectivity


School of Earth Sciences, The Ohio State University, 275 Mendenhall Laboratory, 125 South Oval Mall, Columbus, OH 43210, USA
*
Author to whom correspondence should be addressed.
C 2023, 9(4), 116; https://0-doi-org.brum.beds.ac.uk/10.3390/c9040116
Submission received: 10 October 2023
/
Revised: 27 November 2023
/
Accepted: 30 November 2023
/
Published: 4 December 2023
(This article belongs to the Section Carbon Cycle, Capture and Storage)
Abstract
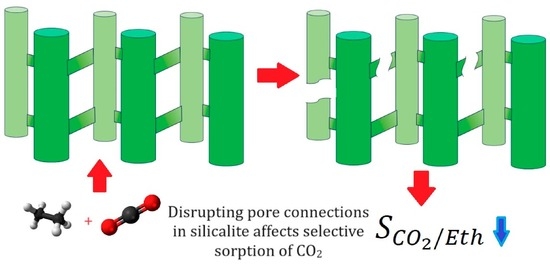
:Selective adsorption using nanoporous materials is an efficient strategy for separating gas mixtures. In a nanoporous material, pores can exist in different shapes and can have different degrees of inter-connectivity. In recent studies, both pore connectivity and tortuosity have been found to affect the adsorption and dynamical properties of ethane and CO2 in silicalite differently. Here, using Monte Carlo simulations, we investigate if these two attributes can affect the selective adsorption of one component from a mixture of ethane and CO2 in silicalite. For this, the adsorption of an equimolar mixture of ethane and CO2 is simulated in 12 models of silicalite—SnZm (n, m = 0, 1, 2, 3 or 4; with n and m denoting, respectively, the fraction (out of 4) of straight and zigzag channels of silicalite that are available for adsorption)—differing in degrees of pore connectivity and tortuosity. The adsorption selectivity in this system is found to exhibit a reversal with the adsorption dominated by ethane at low pressures (below ~1 atm) and by CO2 at higher pressures (above ~10 atm). Pore connectivity is found to suppress the selective adsorption of CO2 at higher pressures and also shifts the selectivity reversal to higher pressures. The selectivity reversal results from a competition between the polarizability-affected adsorption at lower pressures and efficient packing at higher pressures. The efficient packing of CO2 is a compounded effect resulting from the larger effective pore volume available for CO2 due to its stronger interaction with the pore surface and smaller molecular volume. CO2 molecules show a preference to adsorb in non-tortuous pores, and this preference is found to be stronger in the presence of ethane. The effects of pore connectivity and tortuosity elucidated here should be applicable to a wide range of natural and engineered nanoporous materials, and this knowledge could be used to identify materials with better capability for separating and storing CO2 based on their pore attributes.
1. Introduction
The separation of individual components from gas mixtures is an important industrial process that is required to obtain high-purity gas for various uses [1]. Several methods are used for this, and they have their own advantages and limits. One important method for separating gas mixture components is selective adsorption in nanoporous materials [2,3]. This method relies on the difference in the adsorption of individual components by the nanoporous adsorbent. In the case of a binary mixture composed of constituents with significantly different molecular sizes, the separation can occur via molecular sieving, where the component with a smaller molecular size easily passes through a membrane of nanoporous material, while the component with a larger size is blocked by pores smaller than the kinetic diameter of this component [4]. In the case of mixtures with constituents of similar molecular sizes, this strategy does not work, and the gas–adsorbent interactions become important [5]. In some cases, the adsorbent may selectively adsorb one component because of relatively stronger gas–adsorbent interactions while rejecting the remaining components.
In addition to the gas–adsorbent interactions, the geometry and connectivity of the pores in the adsorbent might also facilitate discrimination between the gas components. For example, in a recent study on the adsorption of pure ethane and CO2 in silicalite, it was found that while ethane is equally likely to be adsorbed in straight or tortuous (sinusoidal or zig-zag) channels of silicalite, CO2 exhibits a preference for adsorption in the straight channels over the tortuous channels [6]. Further, this study also showed that reducing the degree of inter-connectivity of pores by selectively blocking them results in an enhanced adsorption for both ethane as well as CO2. These attributes of the pore network were also found to affect the dynamical properties of the adsorbates [7].
CO2 and ethane are industrially and environmentally important carbon-bearing gases. While CO2 is well known as a greenhouse gas [8], ethane also has an indirect global warming potential [9]. For this reason, these gases have gained the attention of the scientific research community, and efforts have been undertaken to explore ways to capture, store and sequester CO2 in particular [10,11]. Further, CO2 and ethane are representative molecules with similar sizes but different electrostatic properties. In addition, both of these gases have very similar critical temperatures [12]. CO2 is a quadrupolar molecule, whereas ethane is non-polar [13]. This results in a significant difference between the way these two molecules interact with the adsorbent [13], leading to significantly different behaviors under confinement by the adsorbent [14,15,16,17]. CO2, with its stronger interactions with the adsorbent due to its quadrupolar moment, can replace a non-polar molecule from the pore surface, thereby making it diffuse faster in the presence of CO2 [18,19,20]. Previously, a strong dependence of structural and dynamical behaviors of relatively larger molecules confined in silicalite on their polarity has been reported [21]. These observations lead to the following question: how can the polarity of constituent gases in a binary mixture affect their separability using selective adsorption by a nanoporous adsorbent? Further, having observed that the pore tortuosity and connectivity in silicalite have significant influences on the adsorption of CO2 and ethane, the following question can be asked: how do these attributes of silicalite affect its performance in separating a mixture of these two gases via selective adsorption?
To address the two questions listed above, we carried out and report here grand canonical Monte Carlo (GCMC) simulation studies on the adsorption of an equimolar mixture of ethane and CO2 in 12 silicalite models with different degrees of pore connectivity and tortuosity. Our focus in this work is on the roles of pore tortuosity and connectivity in the selective adsorption of CO2 from an equimolar mixture with a non-polar species. Ethane is selected to represent a non-polar species because it exhibits a similar molecular size and similar thermodynamic attributes as CO2. We targeted a study of mixtures of CO2 and ethane to amplify the effects of polarity while suppressing the effects of other attributes. The mixture composition and thermodynamic conditions for the study were selected based in part on convenience, but also in such a way as to generate results that are applicable to other polar-non-polar systems of interest. We find that the adsorption is dominated by ethane at lower pressures and dominated by CO2 at higher pressures, resulting in a reversal in selectivity. Both the pore connectivity as well as pore tortuosity affect the selective adsorption as well as the reversal pressure. The simulation method, models and the force fields used in this work are detailed in Section 2. The results are reported in Section 3 and are discussed in a larger perspective in Section 4. We finally provide a concise summary and main conclusions in Section 5.
2. Materials and Methods
2.1. Adsorbent Models
A simulation cell made up of 2 × 2 × 3 unit cells of silicalite was prepared with the visualization software VESTA, version 3.5.7 [22] using the atomic coordinates provided by Koningsveld et al. [23]. This simulation cell, without any modification, is an ideal silicalite crystal and has a total of 12 straight channel-like pores with a width of ~0.5 nm running along the Cartesian Y-direction, intersecting with 12 tortuous channels of the same dimensions running in a zig-zag fashion in the X-Y plane, at 48 intersections. Following previous works [6,7], this ideal crystal is termed S4Z4. The degree of pore connectivity was systematically varied by selectively blocking some straight and/or zig-zag channels by inserting immobile methane molecules. Selectively leaving a fraction (out of 4) of n straight and m zig-zag channels unblocked resulted in modified SnZm models. Varying n and m between integral values of 0 and 4, while excluding the case n = m = 0 (S0Z0 will mean all channels of the adsorbent being blocked, so that no pore space is left), resulted in a total of 12 model adsorbents with different degrees of pore connectivity and tortuosity in terms of different numbers of open zig-zag or tortuous channels available for adsorption. By selectively blocking all straight/zig-zag channels, a difference in the adsorption behavior of straight (SnZ0; n > 0) or zig-zag or tortuous (S0Zm; m > 0) channels could be studied. Details about the making of the 12 adsorbent models can be found in previous reports [6,7]. Here, we enlist the properties of these models in Table 1, and a schematic illustrating their structure and connectivity is shown in Figure 1. Different models are organized in groups. Models where a larger number of straight (or zig-zag) channels are available for adsorption are termed as S-majority (or Z-majority) models. They are highlighted with blue (or red) text in Table 1. Models S4Z4 and S2Z2 do not belong to either of these classes as they have equal numbers of straight and zig-zag channels. Models SnZm n + m = 4 are models that have only half of the total pore volume in S4Z4 available for adsorption. These models are termed half-volume models and are highlighted with a yellow background in the table. In particular, S2Z2 is a model with equal number of straight and zig-zag channels blocked and is marked in green. Atomic coordinates of all the models in the form of input files for the simulation are available as the associated Supplementary Materials.
2.2. Force Fields
Similar to previous works, we used a combination of TraPPE (Transferable Potentials for Phase Equilibria force field) [24,25] and ClayFF [26] force fields to represent the adsorbate and the adsorbent, respectively. The blocker methane and the adsorbate ethane were represented in the united atom formalism, TraPPE-UA (TraPPE-United atom) [24], while the CO2 molecules were represented by a rigid three-point potential, TraPPE [25]. The interactions between the blocker methane and the adsorbates as well as those between the silicalite framework and the adsorbates were obtained by using the Lorentz–Berthelot mixing rules [27].
2.3. Simulations
GCMC simulations were carried out using DL_Monte [28]. During the simulation, the adsorbate molecules could be inserted/deleted or rotated with probabilities of 0.5, 0.25 and 0.25, while all of the silicalite atoms, as well as the blocker methane molecules, were kept rigid. Four million Monte Carlo steps were used to simulate the adsorption at a given condition. Out of these, the first 2 million steps were discarded, while the remaining 2 million steps were used to calculate averages. This ensured the calculation of quantities in a well-equilibrated system. We note that this number of steps is larger than that used for simulating single-species adsorption reported earlier [6]. Each simulation maintained a system temperature of 308 K, which is consistent with the previous reports. Note that this temperature is above the critical temperature of both fluids [12]. The other variable controlling the adsorption amounts in the simulation was the partial pressure of the two adsorbate gases. For simplicity, we carried out the simulations at 11 different partial pressure values ranging between 0.05 and 100 atm. For each simulation, the partial pressure of both the adsorbate gases was kept equal. This translates to an equimolar composition. A total of 132 GCMC simulations were thus carried out on the mixture adsorption. The results from these simulations are reported here in combination with the results from the single component adsorption reported earlier [6], for a direct comparison.
3. Results
3.1. Adsorption Isotherms
Figure 2 shows the adsorption amounts of the adsorbates at different temperatures in three representative models: S4Z4, S4Z0 and S0Z4. In addition to the mixture adsorption, data for single-species adsorption in a pure state, as reported earlier, are also included as open symbols. Also shown is the total number of molecules adsorbed in the case of mixture adsorption. As in the case of single-species adsorption, more CO2 is adsorbed at higher pressures compared to ethane, which is adsorbed predominantly at lower pressures. Further, the number of adsorbed molecules of a species is considerably lower in the case of mixture except at the lowest partial pressures. This is because of a competition for the available adsorption sites by the other species in the mixture. Another key observation is that the isotherms can be divided into two regimes—at lower pressures, ethane adsorption is dominant in both its pure state as well as in the mixture, whereas at higher pressures, the adsorption amounts of CO2 are higher in both its pure state as well as in the mixture. The cross-over from ethane-dominant adsorption to CO2-dominant adsorption (or selectivity reversal) occurs at a lower partial pressure in the S4Z0 system that consists of only straight channels with zero tortuosity. The adsorption amounts of the two species in the other nine models are shown in Figure A1 in Appendix A.
3.2. Adsorption Selectivity and Its Reversal
To investigate the adsorption selectivity of the silicalite models, we calculated the selectivity of CO2 over ethane () as
where xi represents the adsorbed phase molar fractions of CO2 (i = CO2) and ethane (i = Eth), and yi represents the corresponding bulk phase molar fractions. The selectivities calculated using Equation (1) are shown in Figure 3 for different models as a function of the partial pressure. Clearly, the selectivity for CO2 at high pressures is better in the models that are dominated by straight channels compared to those dominated by tortuous channels.
To clarify the effects of pore connectivity and tortuosity further, we plot the selectivity data at two representative partial pressures for all models in Figure 4. The effects of both pore connectivity (Figure 4a) as well as tortuosity (as exhibited in terms of percentage of open tortuous or zig-zag channels available for adsorption in Figure 4c) are stronger at higher pressures. While increasing the pore connectivity suppresses the selective adsorption of CO2 over ethane (smaller values) in S-majority models, the effect in the Z-majority models is not so clear. The dependence of selectivity on the fraction of straight channels available for adsorption exhibits no systematic variation (Figure 4b). However, increasing the number of tortuous channels that are available for adsorption shows a clear trend of reduction in the selectivity for both S-majority systems and half-volume systems.
The results given in Figure 4 indicate that adsorption in silicalite can be divided into two regions—ethane-dominated adsorption at low pressures (selectivity lower than 1), and CO2-dominated adsorption at higher pressures, at ≥10 atm (selectivity higher than 1), as also noted for the data in Figure 3. The pressures at which there is a cross-over from ethane-dominated to CO2-dominated adsorption (Pcross) can be determined from the plots of selectivity. To determine this, we select data points separated immediately in pressures that lie on either side of the = 1 line and interpolate the intersection of the line passing through these points and the = 1 line. The variation of Pcross determined in this way as a function of the number of pore connections and the percentage of straight or tortuous channels that are available for adsorption is shown in Figure 5. As in the case of selectivity, the variation of Pcross shows a more pronounced systematic variation in the S-majority models, where it increases when the pore connectivity or tortuosity is increased. The effects of varying the fraction of straight channels available for adsorption on Pcross is relatively less systematic and less pronounced.
3.3. Comparison of Adsorption as Single Species and in Mixture
The effect of the presence of one species on the adsorption of the other can be seen by comparing the adsorbed amounts in case of single-species (pure) and mixture adsorption. For this comparison, we calculate the ratio (Npi/Nmi; i = CO2 or ethane) of the adsorption amounts of a species in the pure state (i) with that in the case of a mixture () at a given set of environmental conditions. The variation of this ratio for two representative pressures in the ethane-dominated regime as well as the CO2-dominated regime are shown in Figure 6 as a function of the pore connectivity and the fraction of tortuous channels available for adsorption in S-majority models. Here, again, no systematic variation could be found in the ratio with the fraction of straight channels available for adsorption in the Z-majority or half-volume models. These data are therefore not shown. Although the uncertainty in the lower pressure data is large, a clear trend beyond uncertainty can be seen in these ratios as a function of pore connectivity for both species. Both species lose adsorption amounts in the presence of the other species because of competitive adsorption. However, the presence of the other species on the adsorption amounts becomes less effective on CO2 at higher pressures, while for ethane, it is enhanced at higher pressures. Furthermore, these effects become stronger on CO2 as more pores are interconnected, while it becomes weaker for ethane. We note that since the Z-majority and half-volume data do not show any systematic variations, the variation in the pore connectivity here is identical with the variation in the pore tortuosity.
4. Discussion
Ethane and CO2 are important fluids that have similar molecular sizes but differ considerably in their electrostatic properties [29]. Ethane has a significantly smaller quadrupole moment of (0.65 × 10⁻²⁶ esu cm2) compared to CO2 (4.3 × 10⁻²⁶ esu cm2), whereas it has a higher polarizability (44.3 × 10⁻²⁵ cm3) versus CO2 (29.1 × 10⁻²⁵ cm3) [29,30]. This difference in the polarizability of the two molecules has been cited as the reason for the higher adsorption of ethane compared to CO2 at lower pressures in siliceous zeolites [30]. At higher pressures, the more efficient packing of CO2 compared to ethane is responsible for higher CO2 adsorption. This pressure dependence and reversal of selectivity is well documented for the pure adsorption of the two gases in silicalite [31,32]. Here, we also observe this reversal in the case of CO2–ethane mixture adsorption.
In Figure 7 and Figure 8, we show the projection, respectively, on the X-Y and X-Z planes of distribution of the center of mass of the fluid molecules in the simulation cell of the S4Z4 model, from 400 different configurations subject to the ensemble constraints of a temperature of 308 K and two partial pressures—0.1 atm and 10 atm. The left most panels in both figures show the distribution of ethane molecules, while the central panels show the distribution of CO2 molecules. For ease of comparison, the distribution of both molecules is shown to be superimposed in the right panels. Further, the distributions are shown at two partial pressure settings of 0.1 atm (ethane-dominated adsorption regime; top panels) and 10 atm (CO2-dominated adsorption regime; bottom panels), respectively. The distributions trace the pore structure of the zeolite, with straight channels visible as straight horizontal bands, and zig-zag channels visible as vertical bands in the X-Y plane. The tortuosity of the zag-zag channels is clearly visible in the X-Z plane that shows only these channels, while the straight channels, perpendicular to this plane, are visible only as points of intersection. The distribution of ethane exhibits narrower bands compared to those of CO2, as seen in the comparison panels on the right. This suggests that while ethane prefers to occupy the pore centers, CO2 molecules are distributed close to the pore surfaces. Further, in the case of CO2 distributions, the intersections exhibit a remarkable bulging, which is absent in the case of ethane. The intersections of the straight and zig-zag pores in silicalite are ellipsoidal in shape and are wider than the widths of either channel. The bulging is exclusively seen in the distribution of CO2 as these molecules are adsorbed strongly on the pore surface. This means that the effective pore volume available for CO2 in silicalite channels is larger compared to that for ethane, as the former can be adsorbed much closer to the pore surface. Pham and Lobo [30] cite the smaller molecular volume of CO2 (37.4 cm3/mol) compared to ethane (55 cm3/mol) as the reason for the better molecular packing of CO2. This efficient packing leads to higher adsorption amounts of CO2 at higher pressures. Figure 7 and Figure 8 show that in addition to a smaller molecular volume, a larger pore space is available for CO2 due to adsorption closer to the pore surface, which provides an enhanced effect for efficient packing. Another interesting feature is observed when the distributions are compared at different partial pressures. At lower pressures, both molecules exhibit a sparse but homogenous distribution occupying the entire pore space available. At high pressures, however, there is a tendency of clustering, which results in disjointed regions of high occupancies separated by regions that are not occupied by any molecule. This is probably a result of fluid–fluid interactions dominating the fluid–silicalite interactions at higher pressures.
In this study, we find that in the adsorption mixture, the pressure at which the selectivity is reversed (Pcross) exhibits a clear dependence on the pore connectivity when the majority of straight channels are available for adsorption. Conversely, the variation is less pronounced when more tortuous channels are available for adsorption. In other words, this translates to a systematic variation as a function of tortuosity. Both the selectivity and the reversal pressure outcome are found to vary systematically as functions of the pore network tortuosity. The reason for this systematic variation is the preference shown by CO2 to occupy straight channels over tortuous channels. As we suggested in a previous publication [6], the reason for this preference is that because CO2 is adsorbed closer to the pore surface, any deviation from a straight geometry will have a stronger effect on CO2 compared to ethane. On the other hand, as ethane is adsorbed in the central regions of the pore away from the surface, it is not influenced by the undulations in the surface of tortuous pores and remains unaffected by the tortuosity. The tendency for pure CO2 molecules to preferentially adsorb in the straight channels becomes stronger in the mixture. In the mixture, in the presence of ethane, CO2 can adsorb even more in the straight channels, while ethane molecules occupy the tortuous channels. This is evident from Figure 6, which shows a progressive increase in the ratio of the pure vs. mixture adsorption of CO2 in models with larger tortuosity. This is complemented by the corresponding ratio for ethane reducing in models with higher tortuosity, suggesting that ethane molecules are preferentially adsorbed by the tortuous channels in the presence of CO2 compared to a pure state.
While the effects of pore connectivity and tortuosity on the selective adsorption of CO2 over ethane are elucidated here for an artificially controlled or engineered system of varied connectivity and tortuosity, we believe that these effects should prevail in more realistic nanoporous materials found in nature. For example, shale rock can have a wide range of pore connectivity that has important implications for the development of shale oil recovery [33,34]. Also, nanoporous materials may exhibit different degrees of pore tortuosity [35,36]. The effects elucidated here should be applicable for selective adsorption from a mixture of CO2 and non-polar species by such naturally occurring nanoporous materials. This should, in turn, help in the effective separation of CO2, thereby aiding the efforts towards the capture, utilization and storage of CO2.
5. Conclusions
We studied the effects of pore connectivity and tortuosity on the adsorption of a binary mixture of CO2 and ethane. For this, the adsorption of an equimolar mixture of ethane and CO2 is simulated in 12 models of silicalite—SnZm (n, m = 0, 1, 2, 3 or 4; with n and m denoting, respectively, the fraction (out of 4) of straight and zigzag channels of silicalite that are available for adsorption)—differing in degrees of pore connectivity and tortuosity. The simulated pressure range can be divided into two regimes—at lower pressures (below ~1 atm), the adsorption is ethane-dominated, and at higher pressures (above ~10 atm), CO2 dominates the adsorption. The adsorption selectivity as well as the pressure at which the selectivity reverses show a systematic change with respect to pore connectivity as well as tortuosity. Pore connectivity and tortuosity suppress the selectivity of CO2 adsorption at higher pressures and shifts the reversal cross-over pressure upwards, letting ethane dominate the adsorption to higher pressures. The selectivity reversal is a result of a competition between the effects of molecular polarizability on the adsorption and efficient packing due to the smaller molecular volume of CO2, as reported in the literature. Our simulations show that in addition to the smaller molecular volume of CO2, a larger effective pore volume is available for CO2 because of its closer interaction with the pore surface, which contributes to the packing efficiency. In the mixture, CO2 tends to strongly prefer adsorption in straight channels, leaving the tortuous channels available for adsorption by ethane. The effects of pore connectivity and tortuosity elucidated here in the artificially modified silicalite should be applicable for a wider range of naturally found porous materials with a variation in the degree of pore connectivity and tortuosity. How these effects change with a change in the mixture composition and other environmental conditions will be investigated in another study planned to be carried out in the future. An understanding of these effects can help identify nanoporous materials with a better capability for separating and storing CO2.
Supplementary Materials
The following supporting information can be downloaded at https://0-www-mdpi-com.brum.beds.ac.uk/article/10.3390/c9040116/s1, Atomic coordinates of all the 12 models of silicalite and one molecule each of CO2 and ethane in the form of input CONFIG files for DL_Monte. These files bear the name of the model they represent (SnZm).
Author Contributions
Conceptualization, methodology, validation, formal analysis, investigation, visualization, project administration and data curation, S.G.; writing—original draft preparation, S.G.; writing—review and editing, S.G. and D.C.; funding acquisition, D.C. All authors have read and agreed to the published version of the manuscript.
Funding
This research was funded by the U.S. Department of Basic Energy; Office of Science; Office of Basic Energy Sciences; Division of Chemical Sciences, Geosciences and Biosciences; Geosciences Program, grant number DESC0006878.
Data Availability Statement
All data related to this study are available in this article.
Acknowledgments
We would like to acknowledge STFC’s Daresbury Laboratory for providing the package DL-Monte, which was used in this work. The figures in this manuscript were made using the freely available plotting software Gnuplot version 5.2. [37] (Figure 2, Figure 3, Figure 4, Figure 5, Figure 6, Figure 7 and Figure 8).
Conflicts of Interest
The authors declare no conflict of interest. The funders had no role in the design of the study; in the collection, analyses, or interpretation of data; in the writing of the manuscript; or in the decision to publish the results.
Appendix A
Figure A1.
Number of adsorbate molecules adsorbed in the simulation cell of different models as indicated. Corresonding plots for the three models representative of an ideal silicalite crystal (S4Z4), a silicalite with all tortuous pores blocked and all straight channels available for adsorption (S4Z0); and a silicalite with only tortuous pores available for adsorption (S0Z4) are shown in Figure 2. As in Figure 2, solid symbols here represent data for mixture adsorption while open symbols show the case of single-species adsorption reported earlier [6].

References
- Kerry, F.G. Industrial Gas Handbook: Gas Separation and Purification; CRC Press: Boca Raton, FL, USA, 2007. [Google Scholar]
- Ruthven, D.M. Principles of Adsorption and Adsorption Processes; John Wiley & Sons: Hoboken, NJ, USA, 1984. [Google Scholar]
- Yang, R.T. Gas Separation by Adsorption Processes; World Scientific: Singapore, 1997; Volume 1. [Google Scholar]
- Ruthven, D.M. Molecular sieve separations. Chem. Ing. Tech. 2011, 83, 44–52. [Google Scholar] [CrossRef]
- Wang, H.; Luo, D.; Velasco, E.; Yu, L.; Li, J. Separation of alkane and alkene mixtures by metal–organic frameworks. J. Mater. Chem. A 2021, 9, 20874–20896. [Google Scholar] [CrossRef]
- Gautam, S.; Cole, D.R. Effects of Pore Connectivity on the Sorption of Fluids in Nanoporous Material: Ethane and CO2 Sorption in Silicalite. ChemEngineering 2021, 5, 55. [Google Scholar] [CrossRef]
- Gautam, S.; Cole, D.R. Effects of pore connectivity and tortuosity on the dynamics of fluids confined in sub-nanometer pores. Phys. Chem. Chem. Phys. 2022, 24, 11836–11847. [Google Scholar] [CrossRef] [PubMed]
- Anderson, T.R.; Hawkins, E.; Jones, P.D. CO2, the greenhouse effect and global warming: From the pioneering work of Arrhenius and Callendar to today’s Earth System Models. Endeavour 2016, 40, 178–187. [Google Scholar] [CrossRef] [PubMed]
- Hodnebrog, Ø.; Dalsøren, S.B.; Myhre, G. Lifetimes, direct and indirect radiative forcing, and global warming potentials of ethane (C2H6), propane (C3H8), and butane (C4H10). Atmos. Sci. Lett. 2018, 19, e804. [Google Scholar] [CrossRef]
- Lackner, K.S. A guide to CO2 sequestration. Science 2003, 300, 1677–1678. [Google Scholar] [CrossRef] [PubMed]
- Modak, A.; Jana, S. Advances in porous adsorbents for CO2 capture and storage. In Carbon Dioxide Chemistry, Capture and Oil Recovery; IntechOpen: London, UK, 2018; pp. 165–183. [Google Scholar]
- Lemmon, E.W. Thermophysical properties of fluid systems. In NIST Chemistry WebBook; National Institute of Standards and Technology: Gaithersburg, MD, USA, 2010. [Google Scholar]
- He, Y.; Seaton, N.A. Experimental and computer simulation studies of the adsorption of ethane, carbon dioxide, and their binary mixtures in MCM-41. Langmuir 2003, 19, 10132–10138. [Google Scholar] [CrossRef]
- Gautam, S.; Liu, T.; Cole, D. Sorption, structure and dynamics of CO2 and ethane in silicalite at high pressure: A combined Monte Carlo and molecular dynamics simulation study. Molecules 2018, 24, 99. [Google Scholar] [CrossRef]
- Aguilar-Armenta, G.; Romero-Pérez, Á. Adsorption of C2H4, C2H6 and CO2 on cation-exchanged clinoptilolite. Adsorpt. Sci. Technol. 2009, 27, 523–536. [Google Scholar] [CrossRef]
- Gautam, S.; Cole, D.R. Effects of inter-crystalline space on the adsorption of ethane and CO2 in silicalite: Implications for enhanced adsorption. Phys. Chem. Chem. Phys. 2020, 22, 13951–13957. [Google Scholar] [CrossRef]
- Anson, A.; Lin, C.C.; Kuznicki, S.M.; Sawada, J.A. Adsorption of carbon dioxide, ethane, and methane on titanosilicate type molecular sieves. Chem. Eng. Sci. 2009, 64, 3683–3687. [Google Scholar] [CrossRef]
- Chathoth, S.M.; He, L.; Mamontov, E.; Melnichenko, Y.B. Effect of carbon dioxide and nitrogen on the diffusivity of methane confined in nano-porous carbon aerogel. Microporous Mesoporous Mater. 2012, 148, 101–106. [Google Scholar] [CrossRef]
- Salles, F.; Jobic, H.; Devic, T.; Guillerm, V.; Serre, C.; Koza, M.M.; Ferey, G.; Maurin, G. Diffusion of binary CO2/CH4 mixtures in the MIL-47 (V) and MIL-53 (Cr) metal–organic framework type solids: A combination of neutron scattering measurements and molecular dynamics simulations. J. Phys. Chem. C 2013, 117, 11275–11284. [Google Scholar] [CrossRef]
- Elola, M.D.; Rodriguez, J. Preferential adsorption in ethane/carbon dioxide fluid mixtures confined within silica nanopores. J. Phys. Chem. C 2019, 123, 30937–30948. [Google Scholar] [CrossRef]
- Dhiman, I.; Bhowmik, D.; Shrestha, U.R.; Cole, D.R.; Gautam, S. Effect of molecular shape on rotation under severe confinement. Chem. Eng. Sci. 2018, 180, 33–41. [Google Scholar] [CrossRef]
- Momma, K.; Izumi, F. VESTA 3 for three-dimensional visualization of crystal, volumetric and morphology data. J. Appl. Crystallogr. 2011, 44, 1272–1276. [Google Scholar] [CrossRef]
- Van Koningsveld, H.; Van Bekkum, H.; Jansen, J.C. On the location and disorder of the tetrapropylammonium (TPA) ion in zeolite ZSM-5 with improved framework accuracy. Acta Crystallogr. Sect. B Struct. Sci. 1987, 43, 127–132. [Google Scholar] [CrossRef]
- Martin, M.G.; Siepmann, J.I. Transferable potentials for phase equilibria. 1. United-atom description of n-alkanes. J. Phys. Chem. B 1998, 102, 2569–2577. [Google Scholar] [CrossRef]
- Potoff, J.J.; Siepmann, J.I. Vapor–liquid equilibria of mixtures containing alkanes, carbon dioxide, and nitrogen. AIChE J. 2001, 47, 1676–1682. [Google Scholar] [CrossRef]
- Cygan, R.T.; Liang, J.J.; Kalinichev, A.G. Molecular models of hydroxide, oxyhydroxide, and clay phases and the development of a general force field. J. Phys. Chem. B 2004, 108, 1255–1266. [Google Scholar] [CrossRef]
- Allen, M.P.; Tildesley, D.J. Computer Simulation of Liquids; Oxford University Press: Oxford, UK, 2017. [Google Scholar]
- Purton, J.A.; Crabtree, J.C.; Parker, S.C. DL_MONTE: A general purpose program for parallel Monte Carlo simulation. Mol. Simul. 2013, 39, 1240–1252. [Google Scholar] [CrossRef]
- Li, J.R.; Kuppler, R.J.; Zhou, H.C. Selective gas adsorption and separation in metal–organic frameworks. Chem. Soc. Rev. 2009, 38, 1477–1504. [Google Scholar] [CrossRef]
- Pham, T.D.; Lobo, R.F. Adsorption equilibria of CO2 and small hydrocarbons in AEI-, CHA-, STT-, and RRO-type siliceous zeolites. Microporous Mesoporous Mater. 2016, 236, 100–108. [Google Scholar] [CrossRef]
- Sun, M.S.; Shah, D.B.; Xu, H.H.; Talu, O. Adsorption Equilibria of C1 to C4 Alkanes, CO2, and SF6 on Silicalite. J. Phys. Chem. B 1998, 102, 1466–1473. [Google Scholar] [CrossRef]
- Choudhary, V.R.; Mayadevi, S. Adsorption of methane, ethane, ethylene, and carbon dioxide on silicalite-l. Zeolites 1996, 17, 501–507. [Google Scholar] [CrossRef]
- Wang, X.; Wang, M.; Li, Y.; Zhang, J.; Li, M.; Li, Z.; Guo, Z.; Li, J. Shale pore connectivity and influencing factors based on spontaneous imbibition combined with a nuclear magnetic resonance experiment. Mar. Pet. Geol. 2021, 132, 105239. [Google Scholar] [CrossRef]
- Chandra, D.; Vishal, V.; Bahadur, J.; Sen, D. A novel approach to identify accessible and inaccessible pores in gas shales using combined low-pressure sorption and SAXS/SANS analysis. Int. J. Coal Geol. 2020, 228, 103556. [Google Scholar] [CrossRef]
- Ghanbarian, B.; Hunt, A.G.; Ewing, R.P.; Sahimi, M. Tortuosity in porous media: A critical review. Soil Sci. Soc. Am. J. 2013, 77, 1461–1477. [Google Scholar] [CrossRef]
- Fu, J.; Thomas, H.R.; Li, C. Tortuosity of porous media: Image analysis and physical simulation. Earth-Sci. Rev. 2021, 212, 103439. [Google Scholar] [CrossRef]
- Williams, T.; Kelley, C.; Lang, R.; Kotz, D.; Campbell, J. Gnuplot 4.6. 6: An Interactive Plotting Program. 2014. Available online: http://gnuplot.info (accessed on 4 October 2023).
Figure 1.
Schematic illustration of the pore structure in four representative structures as labeled. Only channels available for adsorption are shown. Straight channels running along the Y-direction are shown in blue, while the zig-zag channels running in the X-Z plane are shown in red. In (a) S4Z4, all channels are available for adsorption. In (b) S2Z2, only half of the straight and zig-zag channels are available. The blocked channels are represented by an absence of the corresponding schematic blocks. In (c) S4Z0, only straight channels are available, while in (d) S0Z4, only zig-zag channels are available.

Figure 2.
Number of adsorbate molecules adsorbed in the simulation cell of (a) S4Z4, (b) S4Z0 and (c) S0Z4 models. The three models are, respectively, representative of an ideal silicalite crystal, a silicalite with all tortuous pore-blocked and all straight channels available for adsorption, and a silicalite with only tortuous pores available for adsorption. Solid symbols represent data for mixture adsorption, while open symbols show the case of single-species adsorption reported earlier [6].

Figure 3.
Selectivity of CO2 over ethane adsorption in silicalite models with different degrees of pore connectivity. (a) S-majority models where all straight channels are available for adsorption. (b) Half-volume models where half of all channels are available for adsorption, and (c) Z-majority models where all zigzag channels are available for adsorption.

Figure 4.
Selectivity of CO2 over ethane adsorption at two representative partial pressures as indicated, as a function of (a) number of pore connections, and percentage of (b) straight and (c) tortuous channels available for adsorption.
Figure 4.
Selectivity of CO2 over ethane adsorption at two representative partial pressures as indicated, as a function of (a) number of pore connections, and percentage of (b) straight and (c) tortuous channels available for adsorption.

Figure 5.
Cross-over pressure Pcross as a function of (a) number of pore connections and percentage of open (b) straight and (c) tortuous channels available for adsorption.
Figure 5.
Cross-over pressure Pcross as a function of (a) number of pore connections and percentage of open (b) straight and (c) tortuous channels available for adsorption.

Figure 6.
Ratio of the adsorbed amounts in the pure state to that in the mixture for (a) CO2 and (b) ethane as functions of pore connectivity (bottom X-axis) and pore tortuosity (top X-axis).
Figure 6.
Ratio of the adsorbed amounts in the pure state to that in the mixture for (a) CO2 and (b) ethane as functions of pore connectivity (bottom X-axis) and pore tortuosity (top X-axis).

Figure 7.
Distributions of the center of mass of ethane (red) and CO2 (black) adsorbed as a mixture in S4Z4 projected on the X-Y plane in a 4 nm wide square region. The left and central panels show the individual distributions, while the right panel shows the two distributions superimposed for ease of comparison. The top three panels (a–c) show the distributions at 0.1 atm partial pressure, while the bottom panels (d–f) show the distributions at 10 atm partial pressure.

Figure 8.
Distributions of the center of mass of ethane (red) and CO2 (black) adsorbed as a mixture in S4Z4 projected on the X-Z plane in a 4 nm wide square region. The left and central panels show the individual distributions, while the right panel shows the two distributions superimposed for ease of comparison. The top three panels (a–c) show the distributions at 0.1 atm partial pressure, while the bottom panels (d–f) show the distributions at 10 atm partial pressure.


Table 1.
Models of silicalite with different degrees of pore connectivity and tortuosity simulated in this study and the corresponding fractions of open straight or zig-zag channels available for adsorption and the number of interconnections between the pores. As described in the text, S-majority (or Z-majority) models are highlighted in blue (or red) text, while the models with half of the pore volume in S4Z4 that are available for adsorption are highlighted in yellow. In particular S2Z2 has equal number of straight and zig-zag channels blocked and is marked in green.
| System Name | Open Straight Channels (% of Total) | Open Sinusoidal Channels (% of Total) | Number of Pore Connections |
|---|---|---|---|
| S4Z4 | 100 | 100 | 48 |
| S4Z3 | 100 | 75 | 36 |
| S4Z2 | 100 | 50 | 24 |
| S4Z1 | 100 | 25 | 12 |
| S4Z0 | 100 | 0 | 0 |
| S3Z1 | 75 | 25 | 9 |
| S2Z2 | 50 | 50 | 12 |
| S1Z3 | 25 | 75 | 9 |
| S0Z4 | 0 | 100 | 0 |
| S1Z4 | 25 | 100 | 12 |
| S2Z4 | 50 | 100 | 24 |
| S3Z4 | 75 | 100 | 36 |
Disclaimer/Publisher’s Note: The statements, opinions and data contained in all publications are solely those of the individual author(s) and contributor(s) and not of MDPI and/or the editor(s). MDPI and/or the editor(s) disclaim responsibility for any injury to people or property resulting from any ideas, methods, instructions or products referred to in the content. |
© 2023 by the authors. Licensee MDPI, Basel, Switzerland. This article is an open access article distributed under the terms and conditions of the Creative Commons Attribution (CC BY) license (https://creativecommons.org/licenses/by/4.0/).
Share and Cite
MDPI and ACS Style
Gautam, S.; Cole, D. Ethane-CO2 Mixture Adsorption in Silicalite: Influence of Tortuosity and Connectivity of Pores on Selectivity. C 2023, 9, 116. https://0-doi-org.brum.beds.ac.uk/10.3390/c9040116
AMA Style
Gautam S, Cole D. Ethane-CO2 Mixture Adsorption in Silicalite: Influence of Tortuosity and Connectivity of Pores on Selectivity. C. 2023; 9(4):116. https://0-doi-org.brum.beds.ac.uk/10.3390/c9040116
Chicago/Turabian StyleGautam, Siddharth, and David Cole. 2023. "Ethane-CO2 Mixture Adsorption in Silicalite: Influence of Tortuosity and Connectivity of Pores on Selectivity" C 9, no. 4: 116. https://0-doi-org.brum.beds.ac.uk/10.3390/c9040116
Note that from the first issue of 2016, this journal uses article numbers instead of page numbers. See further details here.