Article

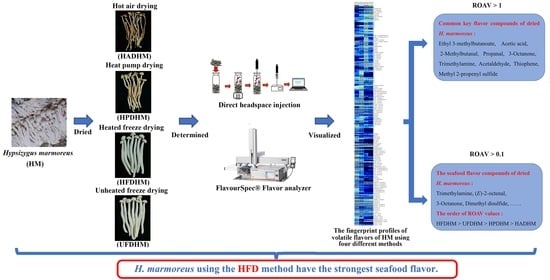
GC-IMS-Based Volatile Characteristic Analysis of Hypsizygus marmoreus Dried by Different Methods

1
Institute of Food Science and Technology, Fujian Academy of Agricultural Sciences, Fuzhou 350003, China
2
National R & D Center for Edible Fungi Processing, Fuzhou 350003, China
3
Key Laboratory of Subtropical Characteristic Fruits, Vegetables and Edible Fungi Processing (Co-Construction by Ministry and Province), Ministry of Agriculture and Rural Affairs, Fuzhou 350000, China
4
College of Life Sciences, Fujian Agriculture and Forestry University, Fuzhou 350002, China
5
College of Food Science, Fujian Agriculture and Forestry University, Fuzhou 350002, China
*
Author to whom correspondence should be addressed.
These authors contributed equally to this work.
Submission received: 3 April 2024 / Revised: 19 April 2024 / Accepted: 22 April 2024 / Published: 25 April 2024
(This article belongs to the Section Food Analytical Methods)

Abstract

:
Gas chromatography–ion mobility spectroscopy (GC-IMS) was used to analyze the volatile components in dried Hypsizygus marmoreus of different drying methods, including hot air drying (HAD), heat pump drying (HPD), heated freeze-drying (HFD), and unheated freeze-drying (UFD). A total of 116 signal peaks corresponding to 96 volatile compounds were identified, including 25 esters, 24 aldehydes, 23 alcohols, 13 ketones, 10 heterocyclic compounds, 8 carboxylic acids, 7 terpenes, 3 sulfur-containing compounds, 2 nitrogen-containing compounds, and 1 aromatic hydrocarbon. The total content of volatile compounds in H. marmoreus dried by the four methods, from highest to lowest, was as follows: HAD, HPD, HFD, and UFD. The main volatile compounds included carboxylic acids, alcohols, esters, and aldehydes. Comparing the peak intensities of volatile compounds in dried H. marmoreus using different drying methods, it was found that the synthesis of esters, aldehydes, and terpenes increased under hot drying methods such as HAD and HPD, while the synthesis of compounds containing sulfur and nitrogen increased under freeze-drying methods such as HFD and UFD. Nine common key characteristic flavor compounds of dried H. marmoreus were screened using relative odor activity values (ROAV > 1), including ethyl 3-methylbutanoate, acetic acid, 2-methylbutanal, propanal, methyl 2-propenyl sulfate, trimethylamine, 3-octanone, acetaldehide, and thiophene. In the odor description of volatile compounds with ROAV > 0.1, it was found that important flavor components such as trimethylamine, 3-octanone, (E)-2-octenal, and dimethyl disulfide are related to the aroma of seafood. Their ROAV order is HFD > UFD > HPD > HAD, indicating that H. marmoreus using the HFD method have the strongest seafood flavor. The research findings provide theoretical guidance for selecting drying methods and refining the processing of H. marmoreus.

Graphical Abstract

1. Introduction

Hypsizygus marmoreus (Peck) H. E. Bigelow has a high content of protein, dietary fiber, B vitamins, and minerals, while also exhibiting anti-tumor and antioxidant activities, making it a mushroom that combines both edible and medicinal values [1,2]. H. marmoreus is one of the most popular edible fungi in East Asia, and China is the largest producer of cultivated edible fungi [3]. According to statistics from the China Edible Fungi Association, the total production of H. marmoreus in China reached 526,300 tons and 546,200 tons in 2021 and 2022, respectively, with year-on-year growth rates of 26.43% and 3.78%, demonstrating significant market potential [4]. The white Hypsizygus marmoreus is a strain of H. marmoreus that has a taste similar to seafood. Hence it is also known as “seafood mushroom” [5]. Freshly harvested H. marmoreus have a high water content, high enzyme activity, and strong respiratory activity, making them susceptible to microbial invasion and rot, resulting in a shelf life of only 3~4 days after harvest [6]. Drying is a widely used method for the long-term preservation of edible mushrooms, and multiple studies have shown that drying significantly alters volatile compounds, thus affecting the flavor [7,8]. Based on the characteristic flavors of dried edible fungi, developing processed products such as dried soup premixes and flavorings is an essential direction for enhancing the product value of H. marmoreus and other edible fungi [9].
Currently, flavor research on dried edible fungi has been extensively conducted on common edible fungi such as Lentinus edodes, Ganoderma lucidum, and Agaricus bisporus. L. edodes subjected to microwave vacuum drying could better retain flavor-active amino acids, while the content of volatile compounds was significantly increased [10]. The drying process of G. lucidum increases the content of aldehydes, esters, and olefins while reducing the content of alcohols and ketones [11]. A. bisporus, when freeze-dried, have a reduced content of octenol compounds present compared to those in the fresh mushrooms and generate heat-sensitive alkanes and heterocyclic compounds, which were then degraded during microwave vacuum drying [12]. Different drying methods involved different temperatures and required times, which directly influence the complex reactions related to the production of volatile compounds, such as the Maillard reaction, Strecker degradation, and enzyme-catalyzed reactions [6]. The types and quantities of volatile compounds expressed vary, resulting in differences in flavor profiles. The research system for the post-drying flavor characteristics of edible fungi is quite mature. However, studies on post-drying H. marmoreus mainly focus on quality characteristics [13] and non-volatile flavor components [14], with relatively limited research on the impact of drying methods on volatile flavor components.
Gas chromatography–ion mobility spectrometry (GC-IMS) combines the high separation efficiency of gas chromatography with the high sensitivity of ion mobility spectrometry [15]. Its advantages include low detection limits, operation at atmospheric pressure, no need for sample enrichment or concentration, and low cost [16,17]. It has been widely used in the characterization and differentiation of volatile compounds [18,19]. This technique has been employed to identify and analyze the characteristic volatile compounds of three dried L. edodes [20]. Additionally, it has been used to establish characteristic volatile fingerprints for both fresh and dried Tricholoma matsutake [21], demonstrating its applicability in flavor research of edible fungi. In this study, four common drying methods were used to dehydrate H. marmoreus, and the characteristics and differences of volatile compounds after drying were analyzed using GC-IMS. The results help elucidate the mechanisms behind the differences in volatile components and provide references for the development of processed products using H. marmoreus.

2. Materials and Methods

2.1. Materials and Equipment

The fresh H. marmoreus used for experimental processing were grown for 120 days under normal conditions and met the commercial requirements. They were purchased from Gutian County, Ningde City, Fujian Province, China. In the laboratory, after removing the bottom substrate of the fresh H. marmoreus, individuals with uniform size of fruiting bodies were selected. Their average moisture content was measured using a moisture analyzer (Ohaus Instruments Ltd., Shanghai, China) and found to be 88.20 ± 1.45%. Four portions of H. marmoreus weighing 1000 g were dried uniformly with four different drying methods until the moisture content was below 12%. The procedures for the four drying methods are detailed as follows:
Hot air drying (HAD): The drying temperature of the constant temperature blast drying oven was set to 60 °C with an airflow rate of 8 m·s−1. After the temperature had stabilized, the samples were laid flat and placed inside, and the drying process lasted for approximately 8 h.
Heat pump drying (HPD): The drying temperature of the heat pump dryer was set to 60 °C with a circulating airflow rate of 2800 m3·h−1. After the temperature had stabilized, the samples were laid flat and placed inside for a drying duration of approximately 8 h.
Heated freeze-drying (HFD): The samples were spread out on a material tray and pre-frozen at −40 °C for 12 h before being placed in the freeze dryer. The temperature gradient of the freeze dryer was set to −30 °C for 2 h, 30 °C for 8 h, and then stabilized at 60 °C, with a total drying time of approximately 36 h.
Unheated freeze-drying (UFD): The samples were spread out on a material tray and pre-frozen at −40 °C for 12 h before being placed in the freeze-dryer. The temperature of the freeze-dryer was set to 0 °C, and the drying time was approximately 36 h.
The process diagram for drying H. marmoreus using four different methods is illustrated in Figure 1. In the previous study, a comprehensive comparison of the physical properties and nutritional quality of H. marmoreus dried by the four methods was conducted. The results revealed that all four drying methods were suitable for the industrial production of H. marmoreus. UFDHM had the highest content of polysaccharides and polyphenols, HPDHM had the highest total flavonoid content, and the physical characteristics (color, texture, and tissue structure) of the two freeze-dried methods were relatively better [22].

2.2. GC-IMS Analysis

The dried H. marmoreus (1.0 g) from different drying treatments were placed into glass headspace vials at 60 °C. The vials were incubated at a speed of 500 rpm for 20 min, and then 500 μL of gas was injected into the injector (85 °C, no split mode). The FlavourSpec® flavor analysis instrument (GAS, Dortmund, Germany) was used for GC-IMS measurement, and the retention indices (RI) of each compound were calculated using normal ketones C4~C9 (purchased from China National Pharmaceutical Group Chemical Reagent Co., Ltd., Beijing, China) as external references. Each drying type was sampled three times for the experiment. The instrument procedures and analysis conditions can be found in Tables S1 and S2.

2.3. Statistical Analysis

The data analysis was performed using the FlavourSpec® system. The VOCal processing software (0.4.03) was used to view the analysis plots, and substance identification was conducted through the NIST database (2020) and IMS database. The spectra differences between samples were directly compared using the Reporter plugin. The fingerprint spectra were compared using the Gallery Plot plugin. Sample clustering analysis was conducted using the Simca software (14.1). The Euclidean distance between each pair of samples was calculated using the Fingerprint Similarity Analysis plugin for Euclidean distance analysis. The relative content of compounds was analyzed for variance and significance (p < 0.05) using SPSS software (21.0).

3. Results and Discussion

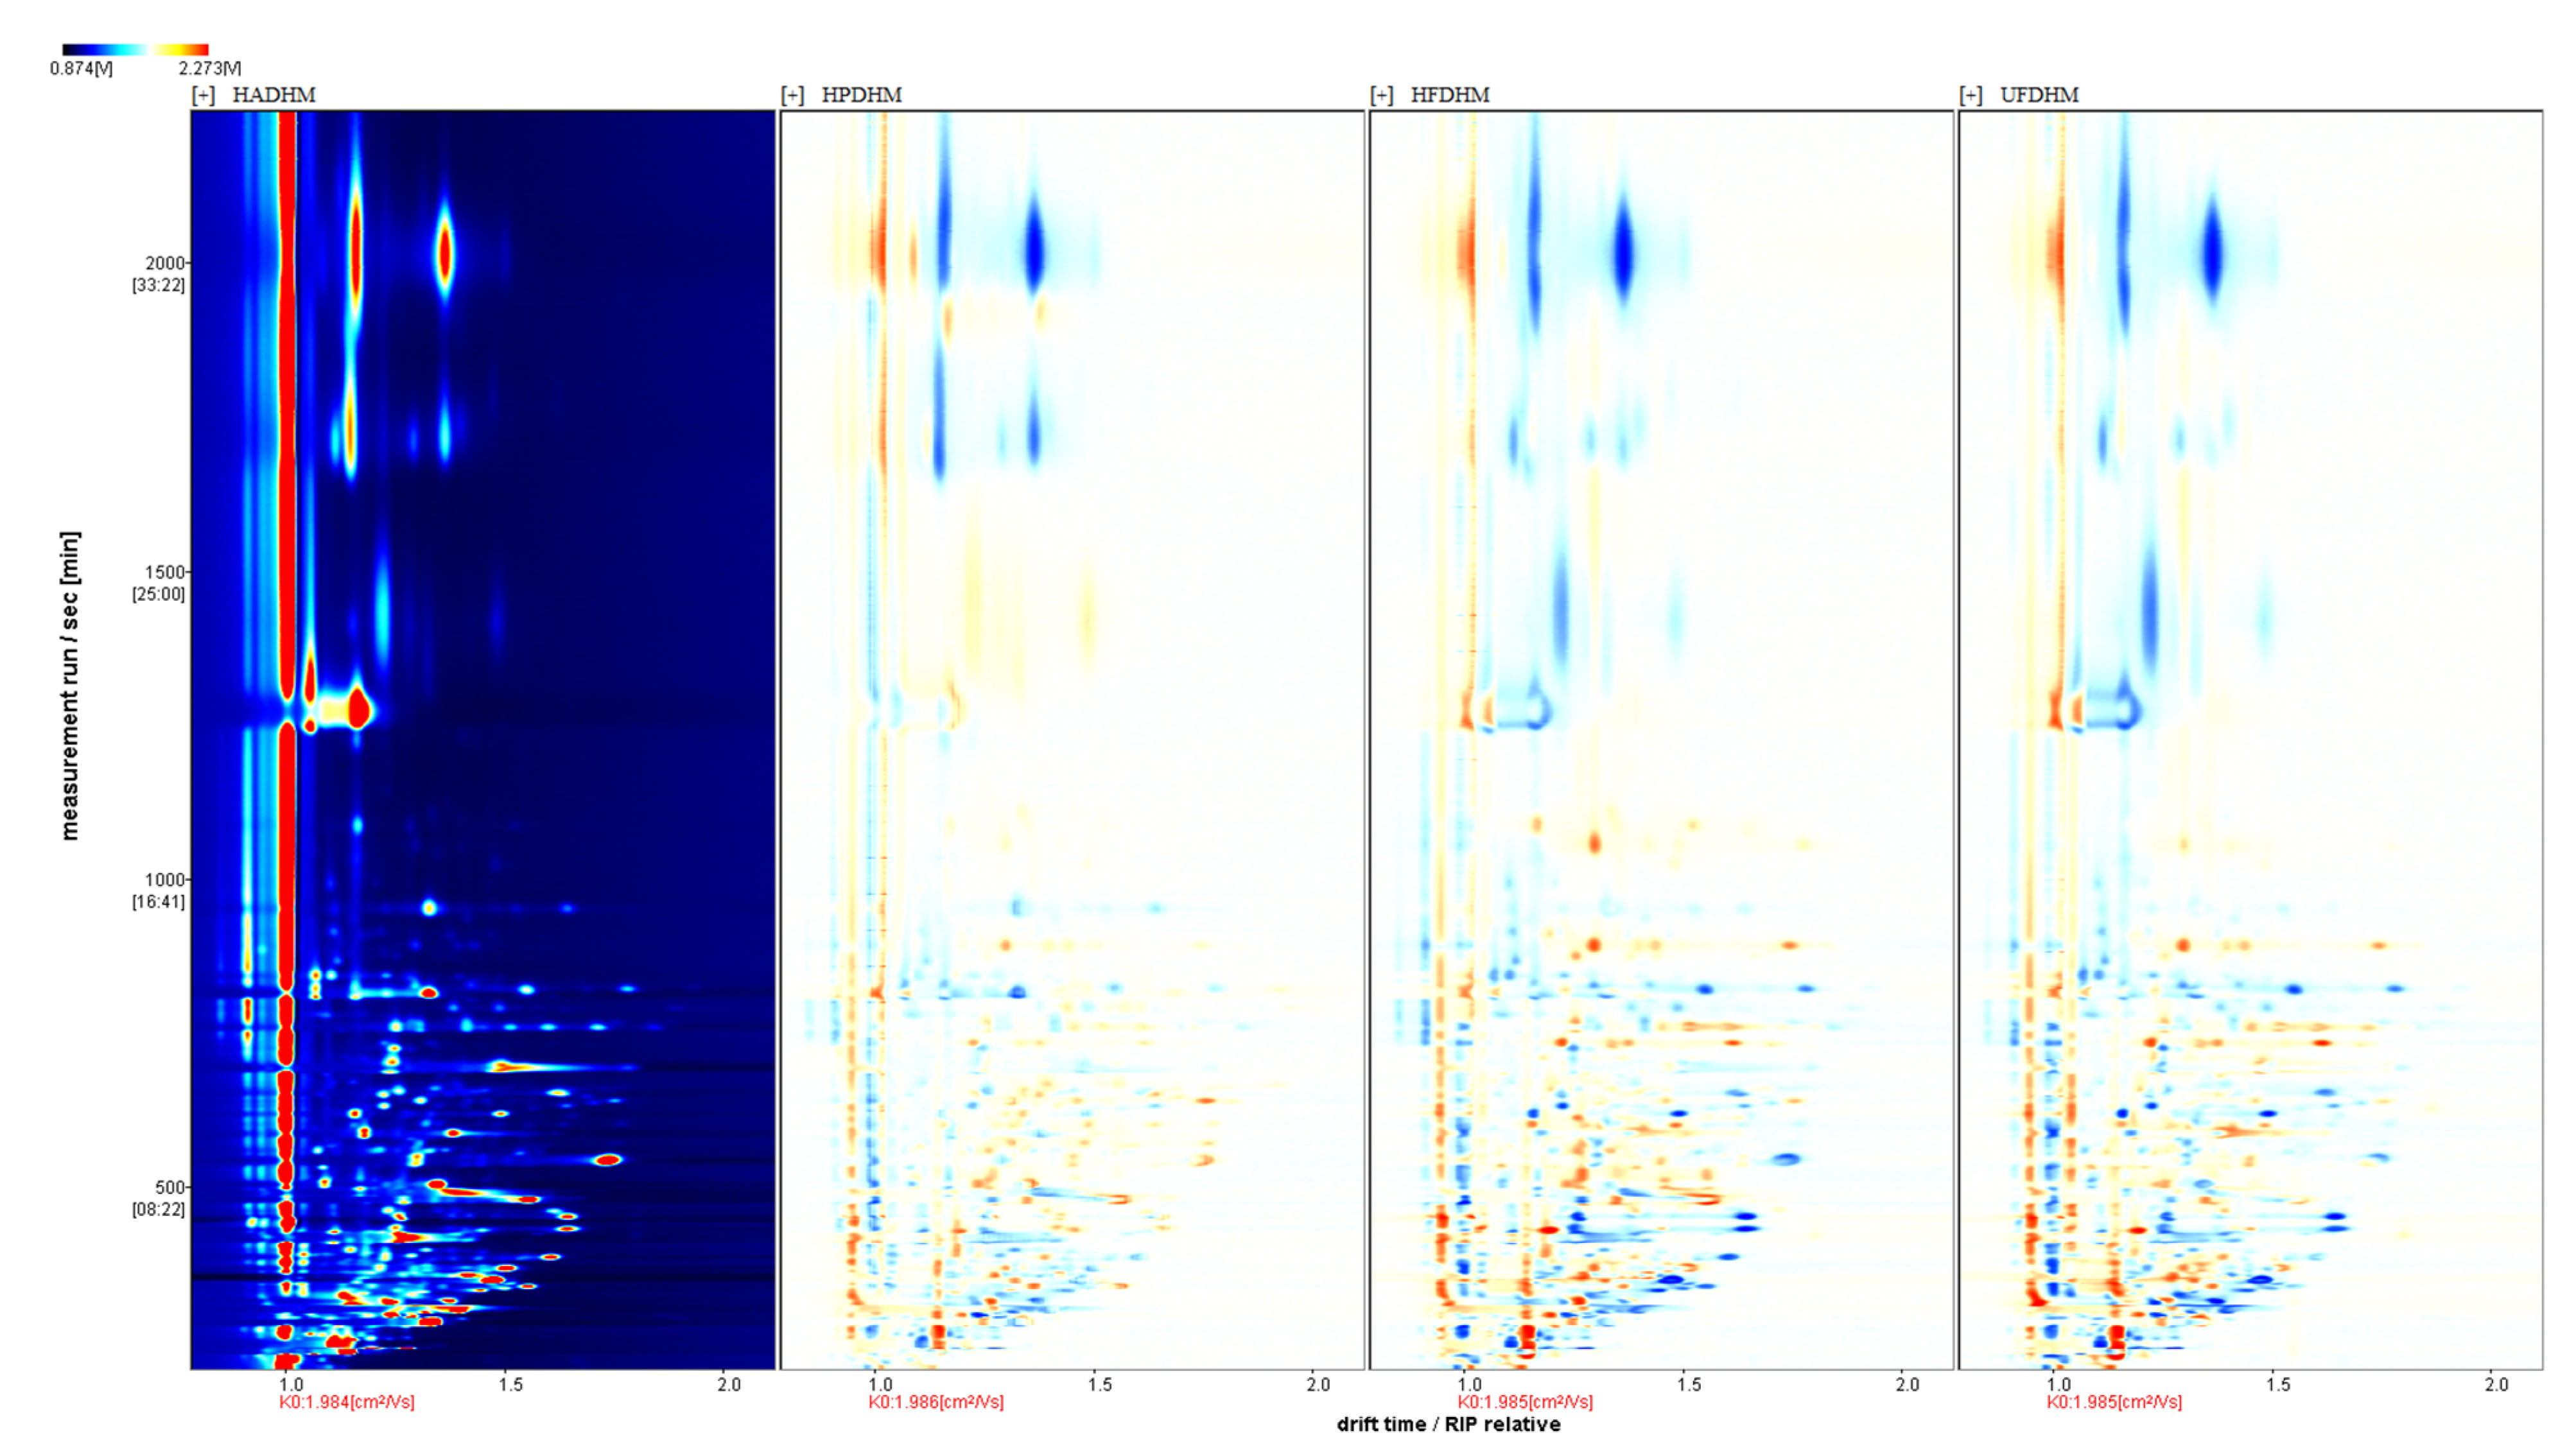
3.1. Differences in Volatile Compounds of H. marmoreus Dried by Different Methods

To compare the differences in the volatile flavor compounds of H. marmoreus dried using different methods, the Reporter plugin was used to generate 3D GC-IMS spectra of H. marmoreus dried by four different methods (Figure 2). From Figure 2, it can be observed that the peak positions of each drying group are roughly the same, indicating that the volatile components of H. marmoreus dried by different methods are similar in terms of types. However, there are differences in peak intensities among the groups. Additionally, the ion peak intensities in the highlighted region of Figure 2 are significantly higher than those in the other treatment groups, suggesting that the volatile components corresponding to this region may be specific to the HAD.
To analyze the differences in the volatile components among the treatment groups more intuitively, the 3D GC-IMS spectra were projected into a top-down 2D plot (Figure 3). In Figure 3, most of the ion peaks are located within the retention time range of 0 to 1000 s and the migration time range of 1.0 to 1.5 ms. Additionally, the hot-air-dried group exhibits high concentrations of volatile substances near a retention time of 2000 s and a migration time range of 1.0 to 1.4 ms. This highlighted region in the 2D plot corresponds to the characteristic peak area of the hot-air-dried group in the 3D spectra.
By creating differential spectra from the GC-IMS plots, the differences in the volatile flavor compounds of H. marmoreus dried by different methods were visually compared. The GC-IMS plot of HAD was selected as the reference, and the signals from the other drying methods were subtracted to obtain the differential spectra (Figure 4). In Figure 4, most volatile compounds in the HAD reference group had higher concentrations than the other drying groups, indicating that H. marmoreus had the highest relative content of volatile compounds under HAD. Additionally, there was a significant difference between HAD and two freeze-drying methods, while the difference between HAD and HPD was relatively small.

3.2. Qualitative Analysis of Volatile Compounds in H. marmoreus Dried by Different Methods

A total of 140 signal peaks were detected in H. marmoreus dried by four different methods. Based on the retention time and migration time matching with substances in the IMS database, the qualitative analysis resulted in 116 signal peaks corresponding to 96 volatile compounds.
Among the 96 qualitatively identified compounds, they can be classified into different categories. There are 25 esters (including hexyl acetate, pentyl acetate, isoamyl acetate, butyl acetate, ethyl 3-methylbutanoate, and methyl 2-methylbutanoate in both monomeric and dimeric forms), 24 aldehydes (including 2-methyl-2-pentenal, (Z)-2-pentenal, and hexanal in both monomeric and dimeric forms), 23 alcohols (including (E)-2-hexenol, 1-hexanol, 1-pentanol, 3-methyl-1-butanol, 1-butanol, 1-propanol, and 2-butanol in both monomeric and dimeric forms), 13 ketones (including 1-hydroxy-2-propanone, 3-hydroxy-2-butanone, and 2-heptanone in both monomeric and dimeric forms), 10 heterocyclic compounds, 8 carboxylic acids (including butanoic acid, 2-methylpropanoic acid, propionic acid, and acetic acid in both monomeric and dimeric forms), 7 terpenes (including myrcene in both monomeric and dimeric forms), 3 sulfur compounds, 2 nitrogen compounds, and 1 aromatic hydrocarbon.
The categories and peak intensities of volatile compounds in each group were analyzed, and the total peak intensities and percentage contents of each compound category were obtained, as detailed in Tables S3 and S4. Among the four drying methods, HAD had the highest total content of volatile compounds, followed by HPD, HFD, and UFD with the lowest content. Based on the relative content of volatile compounds under different drying methods (Figure 5), it can be observed that the volatile substances in H. marmoreus under the four drying methods are mainly carboxylic acids, alcohols, esters, and aldehydes, with their total peak intensities accounting for an over 80% relative proportion. The relative proportions of these four classes of volatile components from largest to smallest are carboxylic acids > alcohols > esters > aldehydes.

3.3. The Fingerprints of Volatile Compounds of H. marmoreus Dried by Different Methods

The differences in the volatile components of H. marmoreus dried by different drying methods were observed through GC-IMS two-dimensional spectrograms. Due to the difficulty in analyzing closely spaced signal peaks on the spectrograms, the Gallery Plot plugin generated fingerprint spectra of volatile flavor components under four drying methods (Figure 6). By visually and quantitatively comparing the complete volatile component information in the fingerprint spectra, it was observed that the three random replicates of different treated samples exhibited consistency. The peak intensities of all compounds were analyzed for differences under different drying methods, as shown in Table 1.
Carboxylic acids were the predominant volatile compounds in the H. marmoreus dried using four different ways, originating from the hydrolysis of fats to short-chain volatile fatty acids or from the degradation of amino acids [23]. Among the eight identified carboxylic acid compounds, the total peak intensity of carboxylic acid compounds under HAD was significantly higher compared to the other three drying methods (p < 0.05). In contrast, the total peak intensities under the remaining three drying methods did not differ significantly, indicating that HAD favored the formation of carboxylic acid compounds. Specifically, the peak intensities of butanoic acid and propanoic acid-D were the highest under HAD, while the peak intensities of propanoic acid-M and acetic acid-D were the highest under HPD (p < 0.05).
Alcohols are primarily produced by the degradation of unsaturated fatty acids by enzymes such as lipoxygenase and peroxygenase [24], and they are the main volatile compounds in H. marmoreus dried by four different methods. The total peak intensity of alcohol compounds ranked highest to lowest among the four drying treatments is as follows: HAD > UFD > HFD > HPD. Among the 23 identified alcohol compounds, the peak intensities of eight compounds (3-methyl-1-butanol-M, 1-butanol-M, 2-methyl-1-propanol, etc.) were the highest under HAD compared to the other three drying methods, while the peak intensities of six compounds (3-methyl-1-pentanol, (E)-2-hexenol-M, 2-propanol, etc.) were the highest under HPD. The peak intensities of four compounds (3-methyl-1-butanol-D, 1-butanol-D, ethanol, etc.) were the highest under UFD.
Esters were formed through esterification reactions between carboxylic acids and alcohols [25], and they were the primary volatile compounds in H. marmoreus dried by four different methods. The total peak intensity of ester compounds in HAD was similar to that of HPD and significantly higher than the two freeze-drying methods, indicating that both HAD and HPD favored the formation of ester compounds.
Among the 25 identified ester compounds, the peak intensities of nine ester compounds (isoamyl acetate-M, butyl acetate-M, ethyl 3-methylbutanoate-M, etc.) were the highest under HAD compared to the other three drying methods, while the peak intensities of ten ester compounds (isoamyl acetate-D, butyl acetate-D, etc.) were the highest under HPD (p < 0.05). Additionally, the peak intensities of three ester compounds (hexyl acetate-M, butyl acetate-M, and ethyl 3-methylbutanoate-D) were significantly higher in both HAD and HPD compared to the two freeze-drying methods (p < 0.05).
Aldehydes were products of the lipoxygenase pathway and Strecker degradation [26] and were the main volatile compounds in dried H. marmoreus. The total peak intensity of aldehyde compounds under HPD was significantly higher than the other three drying methods (p < 0.05). Among the 24 identified aldehyde compounds, the peak intensities of eight compounds (3-methylbutanal, 2-methylpropanal, acetaldehyde, etc.) were highest under HAD compared to the other three drying methods. In HFD, the peak intensities of nine compounds ((E)-2-octenal, nonanal, pentanal, etc.) were the highest, while under HPD, only heptanal and (Z)-2-pentenal-D showed the highest peak intensities (p < 0.05) among aldehyde compounds. Acrolein is a harmful volatile compound commonly found in food, could be generated by the high-temperature processing of fatty-rich foods, and was frequently encountered in baked, fermented, and pickled foods [27]. The World Health Organization’s chemical safety regulations specify a tolerable daily intake of acrolein for the human body at 7.5 µg/kg·bw [28]. However, acrolein’s peak intensity was generally low (426~911) under the four drying methods, and it was difficult to assess its harmful effects on human health. Furthermore, it was only present as a key volatile compound in the HFDHM (Table 2), providing cherry and almond odors [29].
Ketones originated from amino acid degradation, the Maillard reaction, and the thermal oxidation of unsaturated fatty acids [30]. The total peak intensity of ketone compounds was also highest under HAD (p < 0.05), with little difference among the other three drying methods, indicating that HAD also had a specific promoting effect on the formation of ketone compounds. Among the 13 identified ketone compounds, eight compounds (2-octanone, 2-butanone, acetone, etc.) had the highest peak intensities under HAD compared to the other three drying methods (p < 0.05).
Heterocyclic compounds, sensitive to heat and mainly originating from the Maillard reaction and pyrolysis [31], were detected in dried H. marmoreus, including furans, pyrazines, pyridines, and thiophenes. Among the 10 identified heterocyclic compounds, compared to the other three drying methods, HAD had the highest peak intensities for seven compounds (2-methylpyrazine, 2-pentylfuran, 2-butylfuran, etc.), and the total peak intensity of heterocyclic compounds was also highest under HAD (p < 0.05).
Terpenes are widely present secondary metabolites in organisms, classified into monoterpenes, sesquiterpenes, diterpenes, triterpenes, and polyterpenes based on the number of carbon atoms they contain [32]. The terpenes detected in dried H. marmoreus were all monoterpenes. Among the seven identified terpene compounds, compared to the other three drying methods, HAD had the highest peak intensities for four compounds (alpha-pinene, beta-pinene, etc.), and the total peak intensity of terpenes was also highest under HAD (p < 0.05).
Sulfur-containing compounds are commonly present in the volatile components of edible mushrooms. For instance, Dimethyl trisulfide and Dimethyl disulfide were key flavor substances in L. edodes after HAD [33]. Compared to the other three drying methods, HFD exhibited the highest peak intensities of dimethyl trisulfide and methyl 2-propenyl sulfide and had the highest total peak intensity of sulfur-containing compounds (p < 0.05).
Among nitrogen-containing compounds, the peak intensity of trimethylamine was highest in HFD and UFD. Additionally, the total peak intensity of HFD and HPD was significantly higher than that of HAD and HPD (p < 0.05), indicating that the heating–drying process affects the formation of nitrogen-containing compounds.
A discussion can be conducted on the peak intensities of some volatile compounds. The Maillard reaction is a non-enzymatic browning reaction between carbonyl compounds and amino compounds [34], and the quantity of heterocyclic compounds corresponds to the extent of the Maillard reaction [35]. Based on the peak intensities of heterocyclic compounds in different drying methods, it can be observed that HAD exhibited the highest degree of the Maillard reaction, followed by HPD and HFD, while the reaction was significantly inhibited in UFD. Pyrazine compounds are heat-sensitive and are formed through the Maillard reaction and the Strecker degradation of reducing sugars and amino acids [36]. Their peak intensity was highest in HAD (p < 0.05), confirming the highest degree of the Maillard reaction in HAD. The initial products of the Maillard reaction are mainly precursors of volatile flavor compounds and browning products [37], and their content is related to the temperature, oxygen, and water activity [38,39]. Therefore, non-vacuum, heated drying conditions determine the Maillard flavor and browning degree of H. marmoreus. The high temperature and oxygen content in HAD and HPD contribute to the accumulation of Maillard reaction precursors, and the exhaust efficiency of HAD is lower than that of HPD, resulting in higher heat transfer efficiency in HAD and a higher degree of the Maillard reaction. The temperature in HFD relies on plate conduction, making it difficult to ensure a uniform overall temperature during drying. The lack of oxygen under vacuum conditions weakens lipid oxidation and the generation of carbonyl compounds [40], thus reducing Maillard reaction substrates and weakening the Maillard reaction. Unheated freeze-drying is conducted throughout the process in a vacuum environment at 0 °C or below, inhibiting the progress of the Maillard reaction due to the low temperature and lack of oxygen.
Table 2. The ROAV of volatile compounds of H. marmoreus using four drying methods.
NO.CompoundOdor DescriptionOdor Threshold
(μg/L)
ROAV
HADHPDHFDUFD
10, 11Ethyl 3-methylbutanoateapple, pineapple, fruity0.00011100.0000100.0000100.0000100.0000
102, 103Acetic acidsour, pungent, vinegar0.01312.509013.438181.405641.4407
442-Methylbutanalcocoa, almond0.0011.79323.590237.995719.0935
41Propanalalcohol, cocoa, nutty0.00483.80914.089227.754213.6690
113Methyl 2-propenyl sulfidegarlic, onion, alliaceous0.00053.11811.941126.77879.6130
114Trimethylaminefishy, pungent0.021.60572.549124.290413.9812
783-Octanoneherbal, fresh, mushroom0.00132.31672.063621.253714.2491
43Acetaldehydewhiskey, pungent, fruity0.00272.23931.853913.86607.0853
98, 992-Methylpropanoic acidbutter, strawberry, cheese0.041.91170.795912.88567.7170
95Thiophenegarlic, alliaceous0.00192.07111.332511.16357.3497
40Butanalchocolate, herbaceous, floral, fruity0.0020.46920.41845.66781.3346
29Heptanalcitrus, fatty, rancid0.0030.39880.58893.99851.4950
27(E)-2-Octenalnuts, green, fatty0.0030.19100.38913.56831.2711
642-Methyl-1-propanolsolvent, ether, wine, bitter0.0330.46600.35992.62151.7375
922-Pentylfurangreen beans, vegetable0.0060.60260.44232.34721.3056
90Dimethyl disulfidevegetable, nutty, meaty, green0.00840.14630.32062.10861.2490
39Acroleincherry, almond0.00830.19520.17642.08320.5202
912-Butylfuranwine, sweet, fruity, spicy0.0050.42750.35741.93031.3321
422-Methylpropanalmalt, pungent, green0.00151.26490.69961.63040.6312
65, 661-Propanolfermented, fusel, pungent0.240.14070.10720.71330.4071
843-Nonanonejasmin, herbal, fresh0.0170.02840.06330.56420.3300
45cis-4-Heptenalbiscuit, dairy, green0.0400.00430.01540.48710.3523
62, 631-Butanolvanilla, fruit, balsam0.480.03220.02670.25720.1513
19Ethyl Acetatepineapple, anise, fruity, green0.880.03430.03260.24300.1493
69Ethanolethereal, sweet0.620.03040.03000.22790.1478
8, 9Butyl acetatesweet, banana0.130.03740.04100.22620.1452
37Pentanalbready, berry, almond0.40.01680.02080.17830.0593
6, 7Isoamyl acetatebanana, fruity, sweet0.9180.03370.03820.16160.1130
60, 613-Methyl-1-butanolsweet, malty, rubber1.690.02200.02040.15230.0928
83Acetoneapple, pear, ethereal0.8320.02620.01570.10430.0467
Note: The content of the monomer and dimer of the same substance is calculated after adding them up. HAD: Hot air drying; HPD: Heat pump drying; HFD: Heat freeze-drying; UFD: Unheated freeze-drying. The odor thresholds are from “Compilations of odour threshold values in air, water and other media (second enlarged and revised edition)” [41] and “Odor thresholds for chemicals with established occupational health standards (second edition)” [42].

3.4. ROAV Analysis of Volatile Compounds in H. marmoreus Dried by Different Methods

The relative odor activity value (ROAV) is widely used to characterize the contribution of volatile flavor compounds to the overall flavor [43]. Compounds with a ROAV value which is not less than 1 are typically defined as key flavor compounds, while those with a ROAV value between 0.1 and 1 are considered to have a modifying effect on the overall flavor [44]. The ROAV value was calculated based on the relative contents of each compound in H. marmoreus obtained through four different drying methods, as shown in Table 2. From Table 2, it could be observed that the number of compounds contributing to flavor varies from highest to lowest among the four drying methods as follows: HFD, UFD, HAD, and HPD, which also corresponds to the order of the number of key flavor compounds. Additionally, all four drying methods contain 20 common compounds contributing to flavor (ROAV > 0.1), among which nine compounds were identified as key flavor compounds (ROAV > 1) across all four drying methods. These nine common key flavor compounds were ethyl 3-methylbutanoate, acetic acid, 2-methylbutanal, propanal, methyl 2-propenyl sulfide, trimethylamine, 3-octanone, acetaldehyde, and thiophene. Their aroma characteristics collectively form the basic aroma of dried H. marmoreus, with an overall aroma profile of fruity, sour, cocoa, garlic, fishy, and mushroom. In addition, according to the composition of H. marmoreus’ flavor substances dried by four drying methods, there were significant differences in the composition of the flavor-contributing compounds and the ROAV values of identical compounds of H. marmoreus between two heat-drying methods (HAD and HPD) and two freeze-drying methods (HFD and UFD). These indicate that the flavor characteristics of the two heat-drying and two freeze-drying methods also exhibited significant differences. The composition of the flavor-contributing compounds in HFD and UFD was essentially the same. The difference lay in the fact that two key flavor compounds (acrolein, 2-methylpropanal) of HFDHM only played a modifying role in the flavor of UFDHM. In comparison, UFDHM has three more compounds (pentanal, 3-methyl-1-butanol, acetone) that play a role in the modifying flavor. Moreover, overall, the ROAV values of the same flavor compounds in HFDHM were generally higher than those in UFDHM, indicating that the aroma in HFDHM was stronger than in UFDHM. Similarly, the flavor characteristics between HADHM and HPDHM are similar. The composition of the flavor compounds contributing to the whole flavor in both were identical, and their ROAV values were close. Among them, 2-methylpropanoic acid and 2-methylpropanal were identified as key flavor compounds in HADHM (ROAV > 1), while in HPDHM, they only played a modifying role in their flavor (0.1 < ROAV < 1). Consequently, the buttery, cheesy, and pungent odors in HADHM were more pronounced than HPDHM’s.
The seafood-like aroma of H. marmoreus is a well-known characteristic flavor among the public [45]. This seafood-like aroma corresponds to odor descriptions such as fishy, fresh, and green, typically found in fresh seafood products [46]. In the four methods of dried H. marmoreus, flavor compounds related to the odor descriptions included trimethylamine, 3-octanone, (E)-2-octenal, and dimethyl disulfide. Among them, trimethylamine is commonly found in various seafood products and is a crucial indicator of seafood freshness [47]. 3-Octanone is identified as a primary flavor compound in fresh H. marmoreus [48]. (E)-2-octenal is a lipid-derived volatile aroma compound produced by the lipoxygenase/hydroperoxide lyase (LOX/HPL) pathway, which has been shown to contribute to the characteristic flavor of fresh seafood [46,49]. Dimethyl disulfide is a sulfur-containing volatile compound that has been shown to enhance the aroma of some fresh seafood [46]. The relative odor activity values (ROAV) of these seafood-like compounds in the H. marmoreus treated with four drying methods roughly followed this sequence: HFD > UFD > HPD > HAD. Consequently, it could be concluded that H. marmoreus dried by the HFD method exhibited the most potent seafood-like flavor among the four drying methods.

3.5. Cluster Analysis of Volatile Compounds in H. marmoreus Dried by Different Methods

A Principal Component Analysis (PCA) was performed on the volatile compounds of dried H. marmoreus using different drying methods (Figure 7). The cumulative contribution rates of the first and second principal components were 79.8%, indicating that PC1 and PC2 in the figure effectively characterized the differences in volatile compounds among the different treatment groups. From Figure 7, it can be observed that the parallel samples of the four drying treatments clustered distinctly, and the distance between HFD and UFD was close, suggesting that the differences in volatile compounds between these two freeze-drying treatments were relatively small, and they might exhibit similar overall flavor characteristics. Additionally, there was a clear separation trend between the two principal components for HAD, HPD, and the two freeze-dried groups, indicating significant differences in volatile compounds.
The “nearest neighbor” fingerprint analysis was used to calculate the Euclidean distance between each pair of treatment groups and retrieve the minimum distance to determine the similarity level of the treatment groups (Figure 8). Figure 8 shows that the parallel samples of the four drying methods clustered distinctly, with the non-heat freeze-dried group exhibiting the most concentrated normal distribution. This indicated that the volatile compounds expressed in H. marmoreus under UFD were the most uniform, and the consistency of multiple treatments was better. At the same time, the distribution of the Euclidean distances indicated differences in the composition of volatile compounds among the four drying methods, with a smaller difference between HFD and UFD, and a larger difference between them and the two freeze-drying methods (HAD and HPD), consistent with the conclusion in Figure 7.

4. Conclusions

This study analyzed the differences in the volatile compounds of H. marmoreus under different drying methods using GC-IMS technology. A total of 116 signal peaks were identified by GC-IMS, including 25 esters, 24 aldehydes, 23 alcohols, 13 ketones, 10 heterocyclic compounds, 8 carboxylic acids, 7 terpenes, 3 sulfur-containing compounds, 2 nitrogen-containing compounds, and 1 aromatic hydrocarbon. The major volatile compound compositions were the same among the four drying methods, with carboxylic acids > alcohols > esters > aldehydes in decreasing order of relative proportions, all accounting for over 80% of the total relative abundance. Significant differences were observed in the peak intensities of volatile compounds under different drying methods, as indicated by the fingerprint patterns and peak intensities. The total peak intensity of alcohols, ketones, and carboxylic acids was highest in HADHM, while that of aldehydes was highest in HPDHM, of sulfur-containing compounds in HFDHM, esters in the two heat-dried methods, and nitrogen-containing compounds in the two freeze-dried methods. According to the results of the relative odor activity values, all four drying methods contained 20 compounds contributing to flavor (ROAV > 0.1), with 9 compounds making a critical contribution to flavor (ROAV > 1). The odor descriptions of these nine key flavor compounds constituted the basic flavor of dried H. marmoreus, including fruity, sour, cocoa, garlic, fishy, and mushroom flavors. Furthermore, among their key flavor compounds, trimethylamine, 3-octanone, (E)-2-octenal, and dimethyl disulfide have a seafood flavor or enhance the seafood flavor, and the order of the ROAV values for these four compounds was HFD > UFD > HPD > HAD. Therefore, HFDHM had the most potent seafood flavor.
This study revealed the composition characteristics and flavor profiles of H. marmoreus dried by four different methods. This study’s results can provide references for the flavor requirements in the fine processing of H. marmoreus using various drying methods.

Supplementary Materials

The following supporting information can be downloaded at: https://0-www-mdpi-com.brum.beds.ac.uk/article/10.3390/foods13091322/s1, Table S1: Gas chromatography program conditions; Table S2: GC-IMS analysis conditions; Table S3: Total peak intensity of volatile compounds; Table S4: Percentage of volatile compounds.

Author Contributions

P.L.: Conceptualization, Visualization, Methodology, Data curation, Software, Writing—original draft preparation, Writing—review and editing. L.L.: Conceptualization, Visualization, Data curation, Supervision, Project administration, Writing—original draft preparation, Writing—review and editing. Y.W.: Conceptualization, Software, Writing—review and editing. J.S.: Writing—review and editing, Project administration. B.T.: Writing—review and editing, Project administration. Y.Y.: Conceptualization, Software, Writing—review and editing. J.C.: Conceptualization, Funding acquisition, Writing—review and editing, Project administration. L.W.: Conceptualization, Funding acquisition, Supervision, Writing—review and editing, Project administration. All authors have read and agreed to the published version of the manuscript.

Funding

This work was supported by funding from the Fujian Provincial People’s Government—China Academy of Agricultural Sciences’ High-quality Development of Agriculture Beyond the “5511” Collaborative Innovation Engineering Project (XTCXGC2021014), the Fujian Academy of Agricultural Sciences, China (YCZX202411, CXPT2023009, YC20210007), the Finance Special Project of the Province of Fujian Technology and Innovation Team (CXTD2021018-2), Central Guidance for the Local Science and Technology Development Special Project (2022L3040), and the Fujian provincial department of science and technology, China (2021R10320011, 2023R1100).

Institutional Review Board Statement

Not applicable.

Informed Consent Statement

Not applicable.

Data Availability Statement

The original contributions presented in the study are included in the article/Supplementary Materials, further inquiries can be directed to the corresponding author.

Conflicts of Interest

The authors declare no conflicts of interest.

References

  1. Jiang, C.; Duan, X.; Lin, L.; Wu, W.; Li, X.; Zeng, Z.; Luo, Q.; Liu, Y. A review on the edible mushroom as a source of special flavor: Flavor categories, influencing factors, and challenges. Food Front. 2023, 4, 1561–1577. [Google Scholar] [CrossRef]
  2. Lee, Y.; Jian, S.; Lian, P.; Mau, J. Antioxidant properties of extracts from a white mutant of the mushroom Hypsizigus marmoreus. J. Food Compos. Anal. 2008, 21, 116–124. [Google Scholar] [CrossRef]
  3. Wu, Y.-Y.; Shang, J.-J.; Li, Y.; Zhou, C.-L.; Hou, D.; Li, J.-L.; Tan, Q.; Bao, D.-P.; Yang, R.-H. The complete mitochondrial genome of the Basidiomycete edible fungus Hypsizygus marmoreus. Mitochondrial DNA Part B. 2018, 3, 1241–1243. [Google Scholar] [CrossRef] [PubMed]
  4. Cao, Z.; Chen, H.; Zhou, C.; Gong, M.; Li, Y.; Shao, Y.; Wu, Y.; Bao, D. Exogenous γ-aminobutyric acid (GABA) enhanced response to abiotic stress in Hypsizygus marmoreus by improving mycelial growth and antioxidant capacity. Metabolites 2024, 14, 94. [Google Scholar] [CrossRef]
  5. Li, J.; Lei, Y.; Qin, Z.; Liu, J.; Rensing, C.; Lin, Z.; Lin, D. Effects of seafood mushroom spent substrate solid-state fermentation combined with pgpr as a microbial fertilizer on the soil environment and growth promotion of Cenchrus fungigraminus. J. Soil Sci. Plant Nutr. 2024, 24, 1261–1277. [Google Scholar] [CrossRef]
  6. Zhang, L.; Zhang, M.; Mujumdar, A. Development of flavor during drying and applications of edible mushrooms: A review. Dry. Technol. 2021, 39, 1685–1703. [Google Scholar] [CrossRef]
  7. Zheng, C.; Li, J.; Liu, H.; Wang, Y. Review of postharvest processing of edible wild-grown mushrooms. Food Res. Int. 2023, 173, 113223. [Google Scholar] [CrossRef]
  8. Deng, G.; Li, J.; Liu, H.; Wang, Y. Volatile compounds and aroma characteristics of mushrooms: A review. Crit. Rev. Food Sci. Nutr. 2023, 1–18. [Google Scholar] [CrossRef] [PubMed]
  9. Moon, B.; Lo, Y.M. Conventional and novel applications of edible mushrooms in today’s food industry. J. Food Process. Preserv. 2014, 38, 2146–2153. [Google Scholar] [CrossRef]
  10. Tian, Y.; Zhao, Y.; Huang, J.; Zeng, H.; Zheng, B. Effects of different drying methods on the product quality and volatile compounds of whole shiitake mushrooms. Food Chem. 2016, 197, 714–722. [Google Scholar] [CrossRef]
  11. Liu, Y.; Qian, Y.; Shu, B.; Liu, Y.; Tu, X.; Ouyang, H.; Li, Y.; Tan, G.; Yu, Z.; Chen, F.; et al. Effects of four drying methods on Ganoderma lucidum volatile organic compounds analyzed via headspace solid-phase microextraction and comprehensive two-dimensional chromatography-time-of-flight mass spectrometry. Microchem. J. 2021, 166, 106258. [Google Scholar] [CrossRef]
  12. Pei, F.; Yang, W.; Ma, N.; Fang, Y.; Zhao, L.; An, X.; Xin, Z.; Hu, Q. Effect of the two drying approaches on the volatile profiles of button mushroom (Agaricus bisporus) by headspace GC–MS and electronic nose. LWT-Food Sci. Technol. 2016, 72, 343–350. [Google Scholar] [CrossRef]
  13. Wang, Y.; Gui, X.; Jia, M.; Dong, X.; Li, M.; Xu, H. Effect of different drying methods on the quality characteristics and non-volatile taste compounds of Hypsizygus marmoreus pileus and stipe. LWT-Food Sci. Technol. 2024, 192, 115685. [Google Scholar] [CrossRef]
  14. Wu, F.; Tang, J.; Pei, F.; Wang, S.; Chen, G.; Hu, Q.; Zhao, L. The influence of four drying methods on nonvolatile taste components of White Hypsizygus marmoreus. Eur. Food Res. Technol. 2015, 240, 823–830. [Google Scholar] [CrossRef]
  15. Arroyo-Manzanares, N.; Martín-Gómez, A.; Jurado-Campos, N.; Garrido-Delgado, R.; Arce, C.; Arce, L. Target vs. spectral fingerprint data analysis of Iberian ham samples for avoiding labelling fraud using headspace—Gas chromatography–ion mobility spectrometry. Food Chem. 2018, 246, 65–73. [Google Scholar] [CrossRef] [PubMed]
  16. Rodríguez-Maecker, R.; Vyhmeister, E.; Meisen, S.; Rosales Martinez, A.; Kuklya, A.; Telgheder, U. Identification of terpenes and essential oils by means of static headspace gas chromatography-ion mobility spectrometry. Anal. Bioanal. Chem. 2017, 409, 6595–6603. [Google Scholar] [CrossRef]
  17. Gerhardt, N.; Birkenmeier, M.; Sanders, D.; Rohn, S.; Weller, P. Resolution-optimized headspace gas chromatography-ion mobility spectrometry (HS-GC-IMS) for non-targeted olive oil profiling. Anal. Bioanal. Chem. 2017, 409, 3933–3942. [Google Scholar] [CrossRef] [PubMed]
  18. Wang, S.; Chen, H.; Sun, B. Recent progress in food flavor analysis using gas chromatography–ion mobility spectrometry (GC–IMS). Food Chem. 2020, 315, 126158. [Google Scholar] [CrossRef] [PubMed]
  19. Liu, N.; Shen, S.; Huang, L.; Deng, G.; Wei, Y.; Ning, J.; Wang, Y. Revelation of volatile contributions in green teas with different aroma types by GC–MS and GC–IMS. Food Res. Int. 2023, 169, 112845. [Google Scholar] [CrossRef]
  20. Hou, H.; Liu, C.; Lu, X.; Fang, D.; Hu, Q.; Zhang, Y.; Zhao, L. Characterization of flavor frame in shiitake mushrooms (Lentinula edodes) detected by HS-GC-IMS coupled with electronic tongue and sensory analysis: Influence of drying techniques. LWT-Food Sci. Technol. 2021, 146, 111402. [Google Scholar] [CrossRef]
  21. Guo, Y.; Chen, D.; Dong, Y.; Ju, H.; Wu, C.; Lin, S. Characteristic volatiles fingerprints and changes of volatile compounds in fresh and dried Tricholoma matsutake Singer by HS-GC-IMS and HS-SPME-GC–MS. J. Chromatogr. B-Anal. Technol. Biomed. Life Sci. 2018, 1099, 46–55. [Google Scholar] [CrossRef] [PubMed]
  22. Lai, P.; Tang, B.; Li, Y.; Wu, L.; Weng, M.; Chen, J. Grey correlation analysis for physical and nutritional quality of Hypsizygus marmoreus from different drying methods. J. Nucl. Agric. Sci. 2021, 35, 2118–2126. [Google Scholar] [CrossRef]
  23. Zhang, Y.; Gao, P.; Zhang, W.; Zhu, H.; Wang, C.; Xie, N.; Wang, Y.; Pang, X.; Marie-Laure, F.; Lü, J.; et al. Free fatty acid hydrolyzed with lipases and their effects on enzyme-modified cheese flavor. Food Sci. Anim. Prod. 2023, 1, 9240031. [Google Scholar] [CrossRef]
  24. Huang, Q.; Dong, K.; Wang, Q.; Huang, X.; Wang, G.; An, F.; Luo, Z.; Luo, P. Changes in volatile flavor of yak meat during oxidation based on multi-omics. Food Chem. 2022, 371, 131103. [Google Scholar] [CrossRef]
  25. Liu, S.; Holland, R.; Crow, V. Esters and their biosynthesis in fermented dairy products: A review. Int. Dairy J. 2004, 14, 923–945. [Google Scholar] [CrossRef]
  26. Zamora, R.; Gallardo, E.; Hidalgo, F. Strecker degradation of phenylalanine initiated by 2,4-decadienal or methyl 13-oxooctadeca-9,11-dienoate in model systems. J. Agric. Food Chem. 2007, 55, 1308–1314. [Google Scholar] [CrossRef]
  27. Liu, J.; Lu, Y.; Si, B.; Tong, A.; Lu, Y.; Lv, L. Synergistic inhibitory effect of multiple polyphenols from spice on acrolein during high-temperature processing. Foods 2023, 12, 2326. [Google Scholar] [CrossRef]
  28. Gomes, R.; Meek, M. World Health Organization & International Programme on Chemical Safety; World Health Organization: Geneva, Switzerland, 2002. [Google Scholar]
  29. Li, B.; Zhang, T.; Dai, Y.; Jiang, G.; Peng, Y.; Wang, J.; Song, Y.; Ding, Z. Effects of probiotics on antioxidant activity, flavor compounds and sensory evaluation of Rosa roxburghii Tratt. LWT-Food Sci. Technol. 2023, 179, 114664. [Google Scholar] [CrossRef]
  30. Yin, C.; Fan, X.; Fan, Z.; Shi, D.; Yao, F.; Gao, H. Comparison of non-volatile and volatile flavor compounds in six Pleurotus mushrooms. J. Sci. Food Agric. 2019, 99, 1691–1699. [Google Scholar] [CrossRef] [PubMed]
  31. Zhang, L.; Chen, Q.; Liu, Q.; Xia, X.; Wang, Y.; Kong, B. Effect of different types of smoking materials on the flavor, heterocyclic aromatic amines, and sensory property of smoked chicken drumsticks. Food Chem. 2022, 367, 130680. [Google Scholar] [CrossRef] [PubMed]
  32. Yang, W.; Chen, X.; Li, Y.; Guo, S.; Wang, Z.; Yu, X. Advances in pharmacological activities of terpenoids. Nat. Prod. Commun. 2020, 15, 1934578X–20903555X. [Google Scholar] [CrossRef]
  33. Liu, Q.; Bau, T.; Jin, R.; Cui, X.; Zhang, Y.; Kong, W. Comparison of different drying techniques for shiitake mushroom (Lentinus edodes): Changes in volatile compounds, taste properties, and texture qualities. LWT-Food Sci. Technol. 2022, 164, 113651. [Google Scholar] [CrossRef]
  34. Cui, H.; Yu, J.; Zhai, Y.; Feng, L.; Chen, P.; Hayat, K.; Xu, Y.; Zhang, X.; Ho, C.-T. Formation and fate of Amadori rearrangement products in Maillard reaction. Trends Food Sci. Technol. 2021, 115, 391–408. [Google Scholar] [CrossRef]
  35. Yin, X.; Wei, Y.; Li, T.; Zhang, J.; Zou, L.; Cui, Q.; Lu, C.; Ning, J. Heterocyclic compounds formation in large-leaf yellow tea induced by the Maillard reaction at different roasting temperatures. LWT-Food Sci. Technol. 2023, 182, 114856. [Google Scholar] [CrossRef]
  36. Zhu, J.; Niu, Y.; Xiao, Z. Characterization of the key aroma compounds in Laoshan green teas by application of odour activity value (OAV), gas chromatography-mass spectrometry-olfactometry (GC-MS-O) and comprehensive two-dimensional gas chromatography mass spectrometry (GC × GC-qMS). Food Chem. 2021, 339, 128136. [Google Scholar] [CrossRef]
  37. Huang, C.; Cui, H.; Hayat, K.; Zhang, X.; Ho, C. Variation of moisture state and taste characteristics during vacuum drying of Maillard reaction intermediates of hydrolyzed soybean protein and characterization of browning precursors via fluorescence spectroscopy. Food Res. Int. 2022, 162, 112086. [Google Scholar] [CrossRef]
  38. Xie, Q.; Wang, C.; Peng, L.; Dong, Y.; Gao, Y.; Xu, J.; Ping, H.; Liu, S. Effect of vacuum roasting on total selenium content of selenium-enriched rapeseed, Maillard reaction products, oxidative stability and physicochemical properties of selenium-enriched rapeseed oil. Foods 2023, 12, 3204. [Google Scholar] [CrossRef]
  39. Weerawatanakorn, M.; Wu, J.; Pan, M.; Ho, C. Reactivity and stability of selected flavor compounds. J. Food Drug Anal. 2015, 23, 176–190. [Google Scholar] [CrossRef]
  40. Esterbauer, H.; Schaur, R.; Zollner, H. Chemistry and biochemistry of 4-hydroxynonenal, malonaldehyde and related aldehydes. Free. Radic. Biol. Med. 1991, 11, 81–128. [Google Scholar] [CrossRef] [PubMed]
  41. Van Gemert, L.; Li, Z.; Wang, K.; Mao, D.; Jiang, J. Compilations of Odour Threshold Values in Air, Water and Other Media (Second Enlarged and Revised Edition); Science Press: Beijing, China, 2018. [Google Scholar]
  42. Murnane, S.; Lehocky, A.; Owens, P. Odor Thresholds for Chemicals with Established Occupational Health Standards, 2nd ed.; American Industrial Hygiene Association: Falls Church, VA, USA, 2013. [Google Scholar]
  43. Bi, J.; Lin, Z.; Li, Y.; Chen, F.; Liu, S.; Li, C. Effects of different cooking methods on volatile flavor compounds of chicken breast. J. Food Biochem. 2021, 45, e13770. [Google Scholar] [CrossRef] [PubMed]
  44. Su, D.; He, J.; Zhou, Y.; Li, Y.; Zhou, H. Aroma effects of key volatile compounds in Keemun black tea at different grades: HS-SPME-GC-MS, sensory evaluation, and chemometrics. Food Chem. 2022, 373, 131587. [Google Scholar] [CrossRef]
  45. Tang, B.; Wu, L.; Weng, M.; Chen, J.; Li, Y.; Lai, P. Effect of Hypsizygus marmoreus powder on cooking characteristics, color and texture of wheat noodles. Food Sci. Technol. 2022, 42, e00622. [Google Scholar] [CrossRef]
  46. Josephson, D. Seafood. In Volatile Compounds in Foods and Beverages; Routledge: New York, USA, 2017; pp. 179–202. [Google Scholar] [CrossRef]
  47. Wu, T.; Wang, M.; Wang, P.; Tian, H.; Zhan, P. Advances in the formation and control methods of undesirable flavors in fish. Foods 2022, 11, 2504. [Google Scholar] [CrossRef]
  48. Chen, G.; Wu, F.; Pei, F.; Cheng, S.; Muinde, B.; Hu, Q.; Zhao, L. Volatile components of white Hypsizygus marmoreus detected by electronic nose and HS-SPME-GC-MS: Influence of four drying methods. Int. J. Food Prop. 2017, 20, 2901–2910. [Google Scholar] [CrossRef]
  49. Han, Y.; Barringer, S. Formation of volatiles in the lipoxygenase pathway as affected by fruit type and temperature. J. Exp. Food Chem. 2015, 1, 1–7. [Google Scholar] [CrossRef]
Figure 1. Schematic diagram of different drying methods for processing H. marmoreus.
Foods 13 01322 g001
Figure 2. Three-dimensional chromatographic analysis plot of volatile components in dried H. marmoreus using four different methods. HADHM: Hot-air-dried H. marmoreus; HPDHM: Heat-pump-dried H. marmoreus; HFDHM: Heated freeze−dried H. marmoreus; UFDHM: Unheated freeze-dried H. marmoreus. Migration time, retention time, and peak intensity correspond to the X-axis, Y-axis, and Z-axis in the figure, respectively. The color of each volatile component represents its concentration, with white indicating low concentration and red indicating high concentration. The darker the color, the higher the concentration. The green boxes represent the highlighted region where differences are evident.
Foods 13 01322 g002
Figure 3. Top-down analysis plot of volatile components in dried H. marmoreus using four different methods. HADHM: Hot-air-dried H. marmoreus; HPDHM: Heat-pump-dried H. marmoreus; HFDHM: Heated freeze-dried H. marmoreus; UFDHM: Unheated freeze-dried H. marmoreus. The red vertical line at 1.0 on the x-axis represents the normalized response ion peak. The color of each volatile component represents its concentration, with white indicating low concentration and red indicating high concentration. The darker the color, the higher the concentration. The green boxes represent the highlighted region where differences are evident.
Foods 13 01322 g003
Figure 4. Differential analysis plot of volatile components in dried H. marmoreus using four different methods. HADHM: Hot-air-dried H. marmoreus; HPDHM: Heat-pump-dried H. marmoreus; HFDHM: Heated freeze-dried H. marmoreus; UFDHM: Unheated freeze-dried H. marmoreus. The blue color represents a lower concentration of the substance compared with the reference, while the red color represents a higher concentration. The darker the color, the more significant the difference.
Foods 13 01322 g004
Figure 5. The relative content of volatile compounds of dried H. marmoreus using four different methods. HADHM: Hot-air-dried H. marmoreus; HPDHM: Heat-pump-dried H. marmoreus; HFDHM: Heated freeze-dried H. marmoreus; UFDHM: Unheated freeze-dried H. marmoreus. Regarding the invisibility of the brown portion, it is because the Aromatic hydrocarbons, has a very low percentage in each group, approximately around 0.2% (see Table S4).
Foods 13 01322 g005
Figure 6. The fingerprint profiles of volatile flavors of dried H. marmoreus using four different methods. HADHM: Hot-air-dried H. marmoreus; HPDHM: Heat-pump-dried H. marmoreus; HFDHM: Heated freeze-dried H. marmoreus; UFDHM: Unheated freeze-dried H. marmoreus. Each row represents all the peaks of volatile compounds expressed in a sample, while each column represents the expression of the same compound in different samples. The darker the color, the higher the concentration of that compound. Compounds that have not been identified are represented by numbers.
Foods 13 01322 g006
Figure 7. PCA analysis chart of volatile compounds in H. marmoreus dried by different methods. HADHM: Hot-air-dried H. marmoreus; HPDHM: Heat-pump-dried H. marmoreus; HFDHM: Heated freeze-dried H. marmoreus; UFDHM: Unheated freeze-dried H. marmoreus.
Foods 13 01322 g007
Figure 8. Euclidean distance chart of volatile compounds in H. marmoreus dried by different methods. HADHM: Hot-air-dried H. marmoreus; HPDHM: Heat-pump-dried H. marmoreus; HFDHM: Heated freeze-dried H. marmoreus; UFDHM: Unheated freeze-dried H. marmoreus.
Foods 13 01322 g008
Table 1. The volatile compounds and peak intensities of dried H. marmoreus using different methods.
NO.Volatile CompoundsRIRt
(s)
Dt
(RIP Rel)
Peak Intensity
HADHPDHFDUFD
Esters
1Hexyl propionate1337.7893.6171.43424241.61 ± 10.46 d464.64 ± 23.18 c757.47 ± 34.34 b828.52 ± 28.27 a
2Hexyl acetate-M1282.4793.5961.3862674.92 ± 99.27 a562.1 ± 48.77 a305.08 ± 29.93 b267.38 ± 4.71 b
3Hexyl acetate-D1282.4793.5961.89535156.32 ± 14.17 a113.69 ± 16.74 b60.86 ± 11.3 c57.72 ± 7.64 c
4Pentyl acetate-M1185.3643.6221.312041150.78 ± 32.37 c1588.67 ± 12.9 a1413.03 ± 42.98 b1221.99 ± 19.45 c
5Pentyl acetate-D1185.6644.291.7582451.8 ± 3.36 d1351.58 ± 44.56 a937.06 ± 85.42 b750.87 ± 3.7 c
6Isoamyl acetate-M1135544.7411.301623365.42 ± 79.76 a2640.67 ± 133.59 b2286.55 ± 43.5 c2317.59 ± 15.86 c
7Isoamyl acetate-D1135544.7411.749529328.41 ± 157.54 b11,216.06 ± 505.59 a5546.66 ± 277.33 d7923.42 ± 70.32 c
8Butyl acetate-M1085.7464.3991.236941067.03 ± 51.34 a1059.32 ± 13.84 a873.34 ± 5.62 b935.29 ± 14.14 b
9Butyl acetate-D1085.4463.8951.61559926.87 ± 35.44 b1048.73 ± 77.18 a679.65 ± 26 c927.68 ± 5.24 b
10Ethyl 3-methylbutanoate-M1078453.8321.262082174.67 ± 81.19 a1995 ± 24.28 b479.4 ± 45.81 d833.28 ± 10.68 c
11Ethyl 3-methylbutanoate-D1079.1455.3421.649612336.09 ± 69.4 a2353.17 ± 178.56 a100.61 ± 21.15 b252.28 ± 3.87 b
12Ethyl 2-methylbutanoate1063.8435.2151.645172387.04 ± 81.78 b2686.19 ± 211.72 a252.08 ± 32.34 d633.72 ± 10.77 c
132-Methylpropyl acetate1025387.9181.606722759.58 ± 170.79 a1949.85 ± 151.1 b953.58 ± 74.75 c1954.3 ± 31.99 b
14Methyl 2-methylbutanoate-M1008.9369.8041.214751014.19 ± 1.84 a943.87 ± 6.35 b499.46 ± 7.26 c364.92 ± 10.69 d
15Methyl 2-methylbutanoate-D1009.4370.3071.512053729.79 ± 230.78 b2994.94 ± 78.08 c5011.2 ± 72.91 a3891.53 ± 102.22 b
16Propyl acetate989.4350.6841.47368152.93 ± 87.35 a6641.38 ± 227.45 b2376.46 ± 106.77 d2844.48 ± 80.86 c
17Ethyl isobutyrate976.5340.621.556431752.69 ± 34.7 b2406.14 ± 105.73 a774.62 ± 171.94 d1260.66 ± 50.77 c
18Ethyl propanoate969.9335.5891.445491387.63 ± 55.61 a764.79 ± 42.32 b297.81 ± 45.09 d458.48 ± 30.1 c
19Ethyl Acetate893.9282.7561.331612,380.05 ± 281.02 a11,332.59 ± 110.14 b11,284.8 ± 557.25 b12,969.61 ± 252.01 a
20Methyl acetate850.8256.5921.19848516.21 ± 41.65 a302.11 ± 12.99 b125.11 ± 10.76 c99.69 ± 9.06 c
21gamma-Butyrolactone1708.41997.641.088321430.92 ± 73.16 d3436.07 ± 160.6 a2306.96 ± 62.02 b1829.2 ± 45.2 c
22Butyl pentanoate1299.9823.3281.92958171.18 ± 3.44 b269.15 ± 20.15 a110.96 ± 2.68 c113.67 ± 4.78 c
23Ethyl 2-methylpentanoate1150.1572.6981.7647691.77 ± 2.56 b324.18 ± 50.62 a39.63 ± 1.93 b32.46 ± 3.24 b
243-Methylbutyl propanoate1184.3641.4481.8218438.84 ± 2.29 b142.58 ± 10.09 a32.21 ± 4.77 b28.79 ± 1.3 b
25Ethyl heptanoate1358.9935.7741.422162.42 ± 3.17 a28.88 ± 2.28 b22.28 ± 2.36 c24.07 ± 1.09 bc
Total 25 kinds57,749.18 ± 1645.53 a58,616.34 ± 1823.31 a37,526.87 ± 1142.76 c42,821.6 ± 487.72 b
Aldehydes
26Benzaldehyde1549.21414.3291.156531222.35 ± 66.3 a1284.04 ± 74.14 a904.32 ± 108.94 b819.43 ± 43.81 b
27(E)-2-Octenal1437.11108.8221.33821234.96 ± 11.23 d461.45 ± 21.76 b565.4 ± 33.75 a376.31 ± 19.07 c
28Nonanal1400.61024.4111.48034257.34 ± 11.74 d370.74 ± 7.38 c528.49 ± 5.25 a435.71 ± 9.72 b
29Heptanal1196.3663.9671.34493490.65 ± 19.48 c698.53 ± 16.59 a633.62 ± 27.5 b442.62 ± 2.3 d
302-Methyl-2-pentenal-M1174.8621.5741.1612138.4 ± 78.52 a1755.37 ± 27.9 b672.46 ± 62.04 c552.39 ± 11.21 c
312-Methyl-2-pentenal-D1174.8621.5741.497791612.1 ± 68.76 a1309.62 ± 34.02 b237.07 ± 14.46 c77.07 ± 1.34 d
32(E)-2-Pentenal1144.5562.1121.36933260.2 ± 3.76 b228.02 ± 3.95 c332.19 ± 6.15 a222.08 ± 10.58 c
33(Z)-2-Pentenal-M1113.6507.3271.093292131.07 ± 53.72 a1937.64 ± 25.22 b1281.12 ± 11.41 c1296.05 ± 17.96 c
34(Z)-2-Pentenal-D1113.6507.3271.351976444.13 ± 243.92 b7690.42 ± 89.31 a5870.24 ± 215.59 c4373.53 ± 148.63 d
35Hexanal-M1097.3480.6021.272112102.39 ± 65.3 a1637.01 ± 38.43 b1086.82 ± 38.32 d1393.17 ± 14.53 c
36Hexanal-D1098.1481.9381.560295269.69 ± 202.28 d7606.58 ± 168.82 b8467.13 ± 43.39 a6108.9 ± 97.85 c
37Pentanal999.1359.2371.417392756.34 ± 98.98 c3283.39 ± 88.24 b3764.36 ± 22.79 a2339.38 ± 37.51 d
383-Methylbutanal925.9303.8891.399645410.07 ± 242.58 a4268.28 ± 219.01 b3056.66 ± 101.49 c2597.13 ± 49.48 d
39Acrolein862.8263.6361.05797664.72 ± 91.54 ab580.02 ± 100.57 b910.87 ± 177.78 a426.15 ± 64.22 b
40Butanal882.7275.7121.27688384.91 ± 43.37 b331.1 ± 17.49 bc598.2 ± 50.91 a263.42 ± 8.6 c
41Propanal813.6235.9621.124537497.44 ± 135.36 a7762.17 ± 12.21 a7030.3 ± 178.14 b6474.92 ± 26.1 c
422-Methylpropanal824.8242.01.27983778.23 ± 68.42 a414.99 ± 5.78 b128.65 ± 32.17 c93.45 ± 17.79 c
43Acetaldehyde763.5210.8040.979582479.01 ± 25.98 a1979.76 ± 33.2 b1975.78 ± 49.29 b1887.97 ± 75.73 b
442-Methylbutanal910.1293.3231.18961734.52 ± 215.47 c1419.16 ± 69.62 b2006.24 ± 105.61 a1884.19 ± 81.01 a
45cis-4-Heptenal1245.6735.4351.6181570.84 ± 3.19 c242.82 ± 15.21 c1029.64 ± 83.71 b1390.49 ± 122 a
463-Methyl-2-butenal1213687.3731.09618157.6 ± 25.22 ab133.03 ± 6.81 b177.42 ± 4.69 a135.57 ± 6.21 b
47(E)-2-Hexenal1230711.9381.18348154.8 ± 0.22 b170.25 ± 6.16 b286.31 ± 14.44 a153.66 ± 2.98 b
48Diethyl acetal903.2288.7621.02714276.12 ± 6.25 a170.46 ± 8.5 b126.97 ± 8.16 c74.28 ± 4.67 d
49(E)-2-Heptenal1327.4874.0161.2559144.33 ± 4.9 d232.34 ± 8.48 c659.91 ± 43.22 a414.24 ± 6.62 b
Total 24 kinds43,672.23 ± 1224.98 b45,967.2 ± 562.19 a42,330.17 ± 255.35 b34,232.11 ± 266.53 c
Alcohols
501-Octanol1653.71774.2751.48139738.87 ± 20.36 a689.76 ± 36.41 ab477.77 ± 54.1 c600.69 ± 34.89 b
511-Octen-3-ol1482.71224.0761.16471975.22 ± 48.6 a653.88 ± 6.77 c857.5 ± 10.26 b690.69 ± 6.14 c
52(E)-2-Hexenol-M1428.21087.721.166561926.68 ± 221.16 c2379.84 ± 21.3 b3381.28 ± 95.24 a1952.71 ± 147.46 c
53(E)-2-Hexenol-D1428.21087.721.51725199.71 ± 5.13 c278.09 ± 14.91 b706 ± 53.34 a230.34 ± 14.03 bc
541-Heptanol1485.11230.571.40651245.94 ± 25.34 a213.71 ± 7.15 a230.92 ± 8.56 a254.91 ± 19.76 a
551-Hexanol-M1367.6953.6291.331773793.23 ± 105.92 a2530.37 ± 40.78 c3100.05 ± 345.88 b3370.52 ± 95.04 ab
561-Hexanol-D1367.6953.6291.64238813.54 ± 51.17 a379.91 ± 9.37 c615.39 ± 140.35 b727.75 ± 25.9 bc
573-Methyl-1-pentanol1337.7893.6171.30135414.7 ± 22.04 d1110.91 ± 27.76 c2023.41 ± 78.93 a1795.84 ± 59.67 b
581-Pentanol-M1263.4763.0011.254922197.89 ± 192.52 b2657.8 ± 37.39 a2813.86 ± 55.17 a2582.88 ± 82.92 a
591-Pentanol-D1263.6763.2731.71603902.58 ± 96.53 d1264.25 ± 40.14 c1847.54 ± 90.82 a1631.14 ± 68.75 b
603-Methyl-1-butanol-M1219.2696.1981.240614449.66 ± 105.95 a4045.96 ± 41.58 b3601.74 ± 24.13 c3587.98 ± 40.99 c
613-Methyl-1-butanol-D1219.8697.0691.4889110,788.77 ± 254.76 b9589.59 ± 129.5 c9987.41 ± 226.35 c11,891.83 ± 56.3 a
621-Butanol-M1157.8587.5011.183573102.04 ± 51.56 a2593.62 ± 6.2 b2463.16 ± 26.15 c2407 ± 19.52 c
631-Butanol-D1158.5588.8371.379743233.01 ± 70.61 c2470.59 ± 29.61 d4053.32 ± 53.54 b4760.83 ± 13.58 a
642-Methyl-1-propanol1104.7492.6281.390166306.28 ± 171.31 a4695.26 ± 109.49 c4567.56 ± 138.74 c5658.44 ± 24.48 b
651-Propanol-M1050.7418.6111.111221882.13 ± 50.35 a1627.25 ± 64.08 b1536.6 ± 25.95 b1546.95 ± 36.87 b
661-Propanol-D1051.1419.1141.2472911,961.7 ± 478.32 a8549.22 ± 93.45 b7500.83 ± 61.2 c8094.03 ± 79.96 bc
672-Butanol-M1035.8400.4971.14967990.75 ± 49.48 b952.05 ± 46.01 b972.38 ± 28.65 b1165.87 ± 39.56 a
682-Butanol-D1036.24011.32569640.94 ± 70.13 a234 ± 8.35 b299.43 ± 21.73 b285.32 ± 2.58 b
69Ethanol943.2315.9651.134887727.46 ± 255.36 b7364.08 ± 131.31 b7454.53 ± 325.25 b9043.37 ± 69.68 a
702-Propanol943.2315.9651.236944257.82 ± 27.13 b3479.58 ± 14.36 d4822.08 ± 144.74 a3735.1 ± 69.94 c
71Furfuryl alcohol1733.32108.8971.127241893.82 ± 134.66 a1881.74 ± 43.66 a1184.24 ± 49.39 b1064.05 ± 19.02 b
723-Octanol1414.41055.5891.77946104.85 ± 7.25 c118.03 ± 5.15 c452.65 ± 9.74 a175.51 ± 1.6 b
Total 23 kinds69,547.58 ± 1584.08 a59,759.48 ± 398.29 d64,949.65 ± 688.18 c67,253.74 ± 339.13 b
Ketones
731-Hydroxy-2-propanone-M1313.4847.7251.069192426.74 ± 18.5 a1949.15 ± 12.6 b1463.61 ± 52.52 c1238.03 ± 44.05 d
741-Hydroxy-2-propanone-D1313.4847.7251.2325520.19 ± 67.7 a394.24 ± 18.01 b240.12 ± 9.12 c220.14 ± 3.81 c
753-Hydroxy-2-butanone-M1297.1818.3071.067593504.65 ± 167.54 b3185.82 ± 48.14 c3943.9 ± 10.62 a3767.79 ± 53.03 a
763-Hydroxy-2-butanone-D1297.1818.3071.330175157.27 ± 232.7 a2542.07 ± 64.24 d4253.49 ± 284.87 b3684.5 ± 67.95 c
772-Octanone1300.4824.1911.784881083.03 ± 76.4 a666.59 ± 35.04 b134.72 ± 4.25 c137.84 ± 2.82 c
783-Octanone1263.4763.0011.716031235.36 ± 127.28 bc1059.89 ± 104.44 c1458.15 ± 74.36 b1828 ± 46.49 a
792-Heptanone-M1191.5656.9841.263431357.14 ± 34.32 a727.85 ± 20.58 d1184.67 ± 28.83 b929.75 ± 31.56 c
802-Heptanone-D1191.5656.9841.633212237.69 ± 100.71 a2277.34 ± 111.55 a1129.18 ± 39.51 b867.47 ± 53.61 c
812,3-Pentanedione1065436.7251.250251387.07 ± 96.13 a958.8 ± 18.06 b377.64 ± 9.02 d561.82 ± 11.62 c
822-Butanone911.7294.3291.23993117.95 ± 186.47 a1261.81 ± 11.48 c1696.4 ± 67.78 b1364.74 ± 10.33 c
83Acetone835.7248.0381.112698956.62 ± 783.61 a5174.84 ± 149.74 b4568.71 ± 810.31 b3831.34 ± 395.24 b
843-Nonanone1337.4893.1381.39632197.65 ± 7.06 d425.63 ± 19.61 c506.26 ± 10.34 b553.58 ± 30.51 a
85Cyclopentanone1147.8568.3051.10548156.54 ± 2.94 c279.27 ± 13.43 a184.54 ± 13.71 b133.7 ± 9.83 c
Total 13 kinds31,337.91 ± 1695.68 a20,903.29 ± 81.83 b21,141.37 ± 683.66 b19,118.7 ± 406.56 b
Heterocyclic compounds
863-Ethylpyridine1386.5993.5681.10565494.71 ± 9.31 a508.7 ± 18.96 a206.13 ± 23.53 b212.88 ± 1.73 b
872,3-Dimethylpyrazine1349915.9741.11082555.23 ± 28.29 a412.82 ± 14.69 b196.94 ± 3.82 c177.47 ± 4.54 c
882,5-Dimethylpyrazine1325.4870.0821.12042438.9 ± 4.51 a172.45 ± 7 b63.12 ± 7.48 c57.8 ± 2.26 c
892-Methylpyrazine1275.2781.8291.09641453.58 ± 23.77 a214.37 ± 2.85 b147.87 ± 7.17 c134.66 ± 4.4 c
902-Pentylfuran1241728.4291.25091482.58 ± 54.72 a1049.54 ± 24.67 b743.91 ± 30.97 c773.04 ± 6.68 c
912-Butylfuran1107.6497.3051.17142876.46 ± 5.58 a706.88 ± 19.12 b509.37 ± 7.29 d657.32 ± 16.49 c
922,5-Dimethylfuran946.7318.4811.377452174.36 ± 141.44 a1152.76 ± 62.46 b1978.58 ± 307.44 a317.52 ± 25.71 c
932-Ethylfuran958.4327.0351.28871252.83 ± 22.01 a74.43 ± 5.81 c117.04 ± 3.49 b61.61 ± 2.85 c
94Pyridine1170.9613.681.2635112.19 ± 18.39 d150.43 ± 4.62 c616.37 ± 2.79 a216.79 ± 1.95 b
95Thiophene1027390.2071.04751613.63 ± 39.07 a1001.38 ± 17.84 d1118.64 ± 79.38 c1378.14 ± 29.08 b
Total 10 kinds8454.45 ± 313.69 a5443.76 ± 82.71 b5697.97 ± 228.32 b3987.23 ± 37.23 c
Carboxylic acids
96Butanoic acid-M1712.92017.4811.1624737,635.9 ± 732.85 a20,863.3 ± 2142.89 b18,271.38 ± 519.5 b18,186.25 ± 147.07 b
97Butanoic acid-D1712.42015.051.3684828,868.24 ± 1837.27 a52,63.79 ± 1187.17 b4516.87 ± 242.04 b4668.38 ± 72.59 b
982-Methylpropanoic acid-M1640.31723.2021.1505923,690.86 ± 384.85 a11,082.69 ± 884.89 c21,625.23 ± 915.42 b23,702.71 ± 281.66 a
992-Methylpropanoic acid-D1640.91725.6341.372457659.53 ± 811.85 a1517.3 ± 250.71 c5605.63 ± 474.18 b6759.93 ± 141.04 ab
100Propanoic acid-M1633.71698.8811.118893317.51 ± 51.9 b4065.17 ± 57.08 a1145.18 ± 20.61 c967.87 ± 39.12 d
101Propanoic acid-D16351703.7451.295191833 ± 104.99 a1075.68 ± 95.15 b749.73 ± 14 c623.17 ± 114.39 c
102Acetic acid-M1500.81273.271.0594730,454.85 ± 730.64 a29,370.65 ± 488.98 a28,918.44 ± 1048 a29,322.27 ± 185.48 a
103Acetic acid-D1500.81273.271.1565336,224.97 ± 190.56 b39,720.15 ± 185.77 a26,958.14 ± 367.99 c23,843.66 ± 830.55 d
Total 8 kinds169,684.85 ± 3386.03 a112,958.72 ± 5135.23 b107,790.6 ± 3056.05 b108,074.25 ± 964.34 b
Terpenes
104gamma-Terpinene1246.7737.141.22592471.25 ± 14.58 d785.15 ± 22.78 c1505.13 ± 48.29 b1666.59 ± 35.72 a
105alpha-Terpinene1189.3652.3081.226971356.99 ± 15.96 b1484.76 ± 28.85 a831.85 ± 41.68 d1031.31 ± 57.85 c
106Myrcene-M1180.6633.61.226971075.64 ± 21.45 a541.83 ± 5.87 b115.37 ± 8.11 c90.54 ± 1.19 c
107Myrcene-D1180.6633.61.64015326.92 ± 9.47 a144.96 ± 7.73 b65.26 ± 1.36 c44.37 ± 0.7 d
108beta-Pinene1144.8562.781.21655623.32 ± 14.21 a542.98 ± 22.48 b382.47 ± 7.39 d422.19 ± 5.49 c
109alpha-Pinene1026.8389.931.28723610.47 ± 41.58 a322.49 ± 5.34 b301.2 ± 5.51 b287.75 ± 3.08 b
110p-Cymene1302.5827.9051.29549388.01 ± 16.68 a427.03 ± 30.2 a161.29 ± 6.63 b138.19 ± 4.61 b
Total 7 kinds4852.6 ± 122.64 a4249.2 ± 65.77 b3362.57 ± 70.83 d3680.95 ± 89.49 c
Sulfur-containing compounds
111Dimethyl trisulfide1412.91052.0071.3013183.99 ± 9.1 d396.61 ± 6.65 c1385.08 ± 25.62 a590.74 ± 26.53 b
112Dimethyl disulfide1048.8416.2461.15241503.64 ± 100.66 b1064.68 ± 24.48 a935.1 ± 49.2 a1035.39 ± 35.01 a
113Methyl 2-propenyl sulfide982.4345.1811.03654639.33 ± 20.79 b383.92 ± 11.65 d706.6 ± 15.61 a474.33 ± 7.24 c
Total 3 kinds1326.96 ± 88.41 d1845.21 ± 15.2 c3026.78 ± 64.68 a2100.46 ± 19.72 b
Nitrogen-containing compounds
114Trimethylamine837.5249.0441.1452413,163.86 ± 1177.72 c20,155.58 ± 621.09 b25,675.48 ± 2361.68 a27,593.84 ± 1417.5 a
115Ammonia1260.2757.9160.851093525.72 ± 635.6 a2840.95 ± 260.16 ab2313.13 ± 105.74 b2771.16 ± 205.98 ab
Total 2 kinds16,689.58 ± 1745.14 c22,996.53 ± 371.18 b27,988.61 ± 2256.53 a30,365 ± 1623.45 a
Aromatic hydrocarbons
116p-Xylene1144.5562.1121.07593760.66 ± 23.35 b719.13 ± 15.16 b850.45 ± 52.77 a419.44 ± 14.21 c
Total 1 kind760.66 ± 23.35 b719.13 ± 15.16 b850.45 ± 52.77 a419.44 ± 14.21 c
Note: HAD: Hot air drying; HPD: Heat pump drying; HFD: Heat freeze-drying; UFD: Unheated freeze-drying. The suffix “-M” after the compound name indicates that the compound is monomeric, while “-D” indicates that the compound is dimeric. Different letters within the same row indicate significant differences (p < 0.05).
Disclaimer/Publisher’s Note: The statements, opinions and data contained in all publications are solely those of the individual author(s) and contributor(s) and not of MDPI and/or the editor(s). MDPI and/or the editor(s) disclaim responsibility for any injury to people or property resulting from any ideas, methods, instructions or products referred to in the content.

