

Precision Food Composition Data as a Tool to Decipher the Riddle of Ultra-Processed Foods and Nutritional Quality


Abstract
:1. Introduction
2. Materials and Methods
2.1. Data Source
2.2. Classification of Foods Using the NOVA System Groups

| NOVA1 | -natural, packaged, cut, chilled, or frozen -bulk or packaged grains -fresh or pasteurized vegetables or fruit juices with no added sugar or other substances -grains or wheat, oats, and other cereals -grits, flakes, and flours made from corn, wheat, or oats, including those fortified with iron, folic acid, and other nutrients lost during processing -dried or fresh pasta, couscous, and polenta made from water and the grits/flakes/flours described above -eggs -lentils, chickpeas, beans, and other legumes -dried fruits -nuts, peanuts, and other seeds without salt or sugar -fresh or dried herbs and spices (e.g., oregano, pepper, thyme, cinnamon) -fresh and dried mushrooms and other fungi or algae -fresh, chilled, or frozen meat, poultry, fish, and seafood, whole or in the form of steaks, fillets, and other cuts -fresh or pasteurized milk; yoghurt without sugar -tea, herbal infusions, coffee -tap, spring, and mineral water |
| NOVA2 | -oils made from seeds, nuts, and fruits, including soybeans, corn, oil palm, sunflower, or olives -white, brown, and other types of sugar and molasses obtained from cane or beet -honey extracted from honeycombs -syrup extracted from maple trees -starches extracted from corn and other plants -butter -lard -coconut fat -refined or coarse salt, mined or from seawater -any food combining 2 of these, such as “salted butter” |
| NOVA3 | -canned or bottled legumes or vegetables preserved in salt (brine) or vinegar, or by pickling -tomato extract, pastes, or concentrates (with salt and/or sugar) -fruits in sugar syrup (with or without added antioxidants) -beef jerky, bacon -salted or sugared nuts and seeds -canned fish, such as sardines and tuna, with or without added preservatives -salted, dried, smoked, or cured meat or fish -coconut fat -freshly made (unpackaged) breads made of wheat flour, yeast, water, and salt -fermented alcoholic beverages such as beer, alcoholic cider, and wine |
| NOVA4 | -fatty, sweet, savory, or salty packaged snacks -biscuits (cookies), chocolates, candies, and confectionery in general -ice creams and frozen desserts -cola, soda, and other carbonated soft drinks -”energy” and sports drinks -canned, packaged, dehydrated (powdered), and other “instant” soups, noodles, sauces, desserts, drink, mixes, and seasonings -sweetened and flavored yogurts, including fruit yogurts -dairy drinks, including chocolate milk -sweetened juices -margarines and spreads -pre-prepared (packaged) meat, fish, and vegetables, pizza, pasta dishes, burgers, hot dogs, sausages, poultry, and fish “nuggets” and “sticks” -other animal products made from remnants -packaged breads, hamburger and hot dog buns -baked products made with ingredients such us hydrogenated vegetable fat, sugar, yeast, whey, emulsifiers, and other additives -breakfast cereals and bars -infant formulas and drinks, meal replacement shakes (e.g., “Slim Fast”) -pastries, cakes, and cake mixes -Industrial formulations and manufacturing techniques such as extrusion, molding, and preprocessing by frying |
2.3. Application of the Nutri-Score Algorithm
2.4. Statistical Analysis
3. Results
3.1. Differences in NOVA Classification between the Generic and Branded Food Approaches
3.2. Differences in the Nutritional Quality of NOVA Groups as Identified via the Generic versus the Branded Food Approach
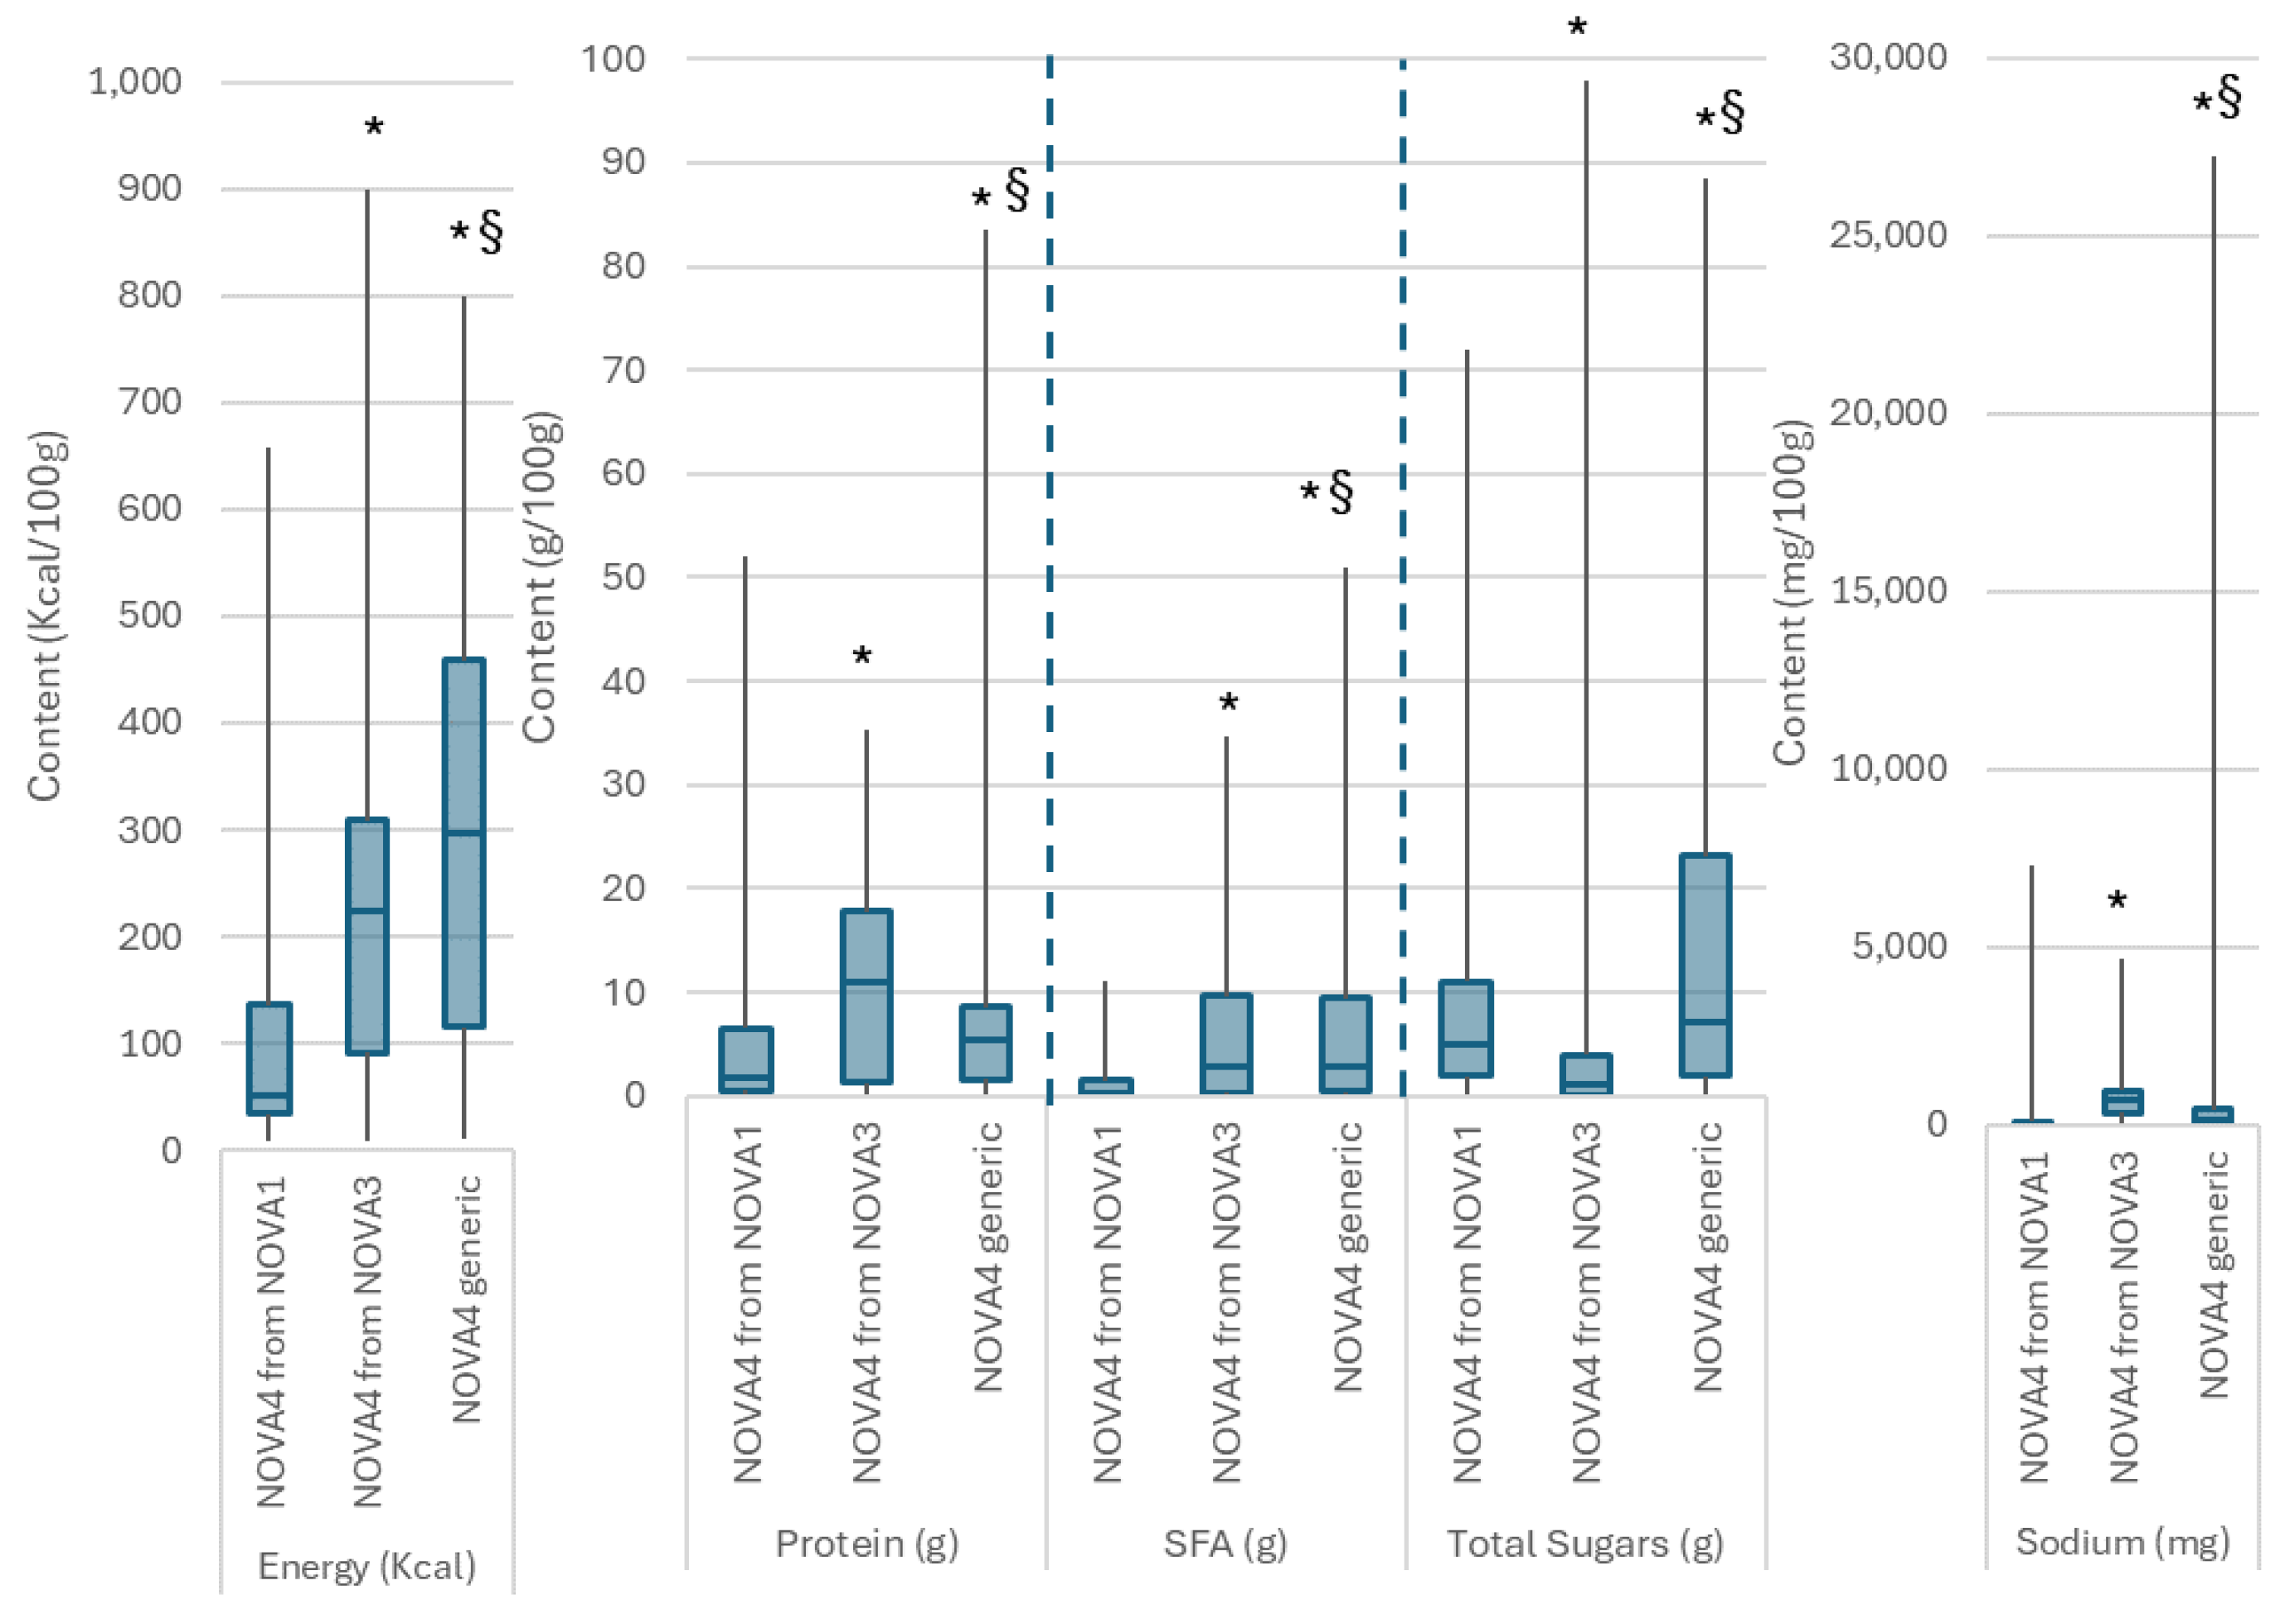
3.2.1. Differences in the Nutritional Composition
3.2.2. Differences in Nutri-Score Performance
4. Discussion
5. Conclusions
Author Contributions
Funding
Institutional Review Board Statement
Informed Consent Statement
Data Availability Statement
Conflicts of Interest
References
- Steele, E.M.; O’Connor, L.E.; Juul, F.; Khandpur, N.; Galastri Baraldi, L.; Monteiro, C.A.; Parekh, N.; Herrick, K.A. Identifying and Estimating Ultraprocessed Food Intake in the US NHANES According to the Nova Classification System of Food Processing. J. Nutr. 2023, 153, 225–241. [Google Scholar] [CrossRef] [PubMed]
- Cattafesta, M.; Petarli, G.B.; Zandonade, E.; Bezerra, O.M.; Abreu, S.M.; Salaroli, L.B. Energy Contribution of NOVA Food Groups and the Nutritional Profile of the Brazilian Rural Workers’ Diets. PLoS ONE 2020, 15, e0240756. [Google Scholar] [CrossRef] [PubMed]
- Mozaffarian, D. Dietary and Policy Priorities for Cardiovascular Disease, Diabetes, and Obesity. Circulation 2016, 133, 187–225. [Google Scholar] [CrossRef] [PubMed]
- Jeong, S.Y.; Wee, C.C.; Kovell, L.C.; Plante, T.B.; Miller, E.R.; Appel, L.J.; Mukamal, K.J.; Juraschek, S.P. Effects of Diet on 10-Year Atherosclerotic Cardiovascular Disease Risk (from the DASH Trial). Am. J. Cardiol. 2023, 187, 10–17. [Google Scholar] [CrossRef] [PubMed]
- Belardo, D.; Michos, E.D.; Blankstein, R.; Blumenthal, R.S.; Ferdinand, K.C.; Hall, K.; Klatt, K.; Natajaran, P.; Ostfeld, R.J.; Reddy, K.; et al. Practical, Evidence-Based Approaches to Nutritional Modifications to Reduce Atherosclerotic Cardiovascular Disease: An American Society For Preventive Cardiology Clinical Practice Statement. Am. J. Prev. Cardiol. 2022, 10, 100323. [Google Scholar] [CrossRef] [PubMed]
- Lane, M.M.; Gamage, E.; Du, S.; Ashtree, D.N.; McGuinness, A.J.; Gauci, S.; Baker, P.; Lawrence, M.; Rebholz, C.M.; Srour, B.; et al. Ultra-Processed Food Exposure and Adverse Health Outcomes: Umbrella Review of Epidemiological Meta-Analyses. Br. Med. J. 2024, 384, e077310. [Google Scholar] [CrossRef] [PubMed]
- Cordova, R.; Viallon, V.; Fontvieille, E.; Peruchet-Noray, L.; Jansana, A.; Wagner, K.-H.; Kyrø, C.; Tjønneland, A.; Katzke, V.; Bajracharya, R.; et al. Consumption of Ultra-Processed Foods and Risk of Multimorbidity of Cancer and Cardiometabolic Diseases: A Multinational Cohort Study. Lancet Reg. Health Eur. 2023, 35, 100771. [Google Scholar] [CrossRef] [PubMed]
- Srour, B.; Kordahi, M.C.; Bonazzi, E.; Deschasaux-Tanguy, M.; Touvier, M.; Chassaing, B. Ultra-Processed Foods and Human Health: From Epidemiological Evidence to Mechanistic Insights. Lancet Gastroenterol. Hepatol. 2022, 7, 1128–1140. [Google Scholar] [CrossRef] [PubMed]
- Slimani, N.; Deharveng, G.; Southgate, D.A.T.; Biessy, C.; Chajès, V.; van Bakel, M.M.E.; Boutron-Ruault, M.C.; McTaggart, A.; Grioni, S.; Verkaik-Kloosterman, J.; et al. Contribution of Highly Industrially Processed Foods to the Nutrient Intakes and Patterns of Middle-Aged Populations in the European Prospective Investigation into Cancer and Nutrition Study. Eur. J. Clin. Nutr. 2009, 63, S206–S225. [Google Scholar] [CrossRef]
- Poti, J.M.; Mendez, M.A.; Ng, S.W.; Popkin, B.M. Is the Degree of Food Processing and Convenience Linked with the Nutritional Quality of Foods Purchased by US Households?23. Am. J. Clin. Nutr. 2015, 101, 1251–1262. [Google Scholar] [CrossRef]
- Levine, A.S.; Ubbink, J. Ultra-Processed Foods: Processing versus Formulation. Obes. Sci. Pract. 2023, 9, 435–439. [Google Scholar] [CrossRef]
- Monteiro, C.A.; Cannon, G.; Moubarac, J.-C.; Levy, R.B.; Louzada, M.L.C.; Jaime, P.C. The UN Decade of Nutrition, the NOVA Food Classification and the Trouble with Ultra-Processing. Public Health Nutr. 2018, 21, 5–17. [Google Scholar] [CrossRef]
- Martinez-Steele, E.; Khandpur, N.; Batis, C.; Bes-Rastrollo, M.; Bonaccio, M.; Cediel, G.; Huybrechts, I.; Juul, F.; Levy, R.B.; da Costa Louzada, M.L.; et al. Best Practices for Applying the Nova Food Classification System. Nat. Food 2023, 4, 445–448. [Google Scholar] [CrossRef]
- Cordova, R.; Kliemann, N.; Huybrechts, I.; Rauber, F.; Vamos, E.P.; Levy, R.B.; Wagner, K.-H.; Viallon, V.; Casagrande, C.; Nicolas, G.; et al. Consumption of Ultra-Processed Foods Associated with Weight Gain and Obesity in Adults: A Multi-National Cohort Study. Clin. Nutr. 2021, 40, 5079–5088. [Google Scholar] [CrossRef]
- Suksatan, W.; Moradi, S.; Naeini, F.; Bagheri, R.; Mohammadi, H.; Talebi, S.; Mehrabani, S.; Hojjati Kermani, M.A.; Suzuki, K. Ultra-Processed Food Consumption and Adult Mortality Risk: A Systematic Review and Dose-Response Meta-Analysis of 207,291 Participants. Nutrients 2021, 14, 174. [Google Scholar] [CrossRef]
- Zhang, Y.; Giovannucci, E.L. Ultra-Processed Foods and Health: A Comprehensive Review. Crit. Rev. Food Sci. Nutr. 2023, 63, 10836–10848. [Google Scholar] [CrossRef]
- Bonaccio, M.; Castelnuovo, A.D.; Ruggiero, E.; Costanzo, S.; Grosso, G.; Curtis, A.D.; Cerletti, C.; Donati, M.B.; de Gaetano, G.; Iacoviello, L. Joint Association of Food Nutritional Profile by Nutri-Score Front-of-Pack Label and Ultra-Processed Food Intake with Mortality: Moli-Sani Prospective Cohort Study. Br. Med. J. 2022, 378, e070688. [Google Scholar] [CrossRef]
- Katidi, A.; Vlassopoulos, A.; Noutsos, S.; Kapsokefalou, M. Ultra-Processed Foods in the Mediterranean Diet According to the NOVA Classification System; A Food Level Analysis of Branded Foods in Greece. Foods 2023, 12, 1520. [Google Scholar] [CrossRef]
- Dicken, S.J.; Batterham, R.L.; Brown, A. Nutrients or Processing? An Analysis of Food and Drink Items from the UK National Diet and Nutrition Survey Based on Nutrient Content, the NOVA Classification and Front of Package Traffic Light Labelling. Br. J. Nutr. 2024, 1–14. [Google Scholar] [CrossRef]
- Braesco, V.; Souchon, I.; Sauvant, P.; Haurogné, T.; Maillot, M.; Féart, C.; Darmon, N. Ultra-Processed Foods: How Functional Is the NOVA System? Eur. J. Clin. Nutr. 2022, 76, 1245–1253. [Google Scholar] [CrossRef]
- Katidi, A.; Xypolitaki, K.; Vlassopoulos, A.; Kapsokefalou, M. Nutritional Quality of Plant-Based Meat and Dairy Imitation Products and Comparison with Animal-Based Counterparts. Nutrients 2023, 15, 401. [Google Scholar] [CrossRef]
- Vlassopoulos, A.; Katidi, A.; Kapsokefalou, M. Performance and Discriminatory Capacity of Nutri-Score in Branded Foods in Greece. Front. Nutr. 2022, 9, 993238. [Google Scholar] [CrossRef]
- Vlassopoulos, A.; Katidi, A.; Savvidou, T.; Kapsokefalou, M. Alignment of Nutri-Score with Mediterranean Diet Pyramid: A Food Level Analysis. Nutrients 2022, 14, 5097. [Google Scholar] [CrossRef]
- Lockyer, S.; Spiro, A.; Berry, S.; He, J.; Loth, S.; Martinez-Inchausti, A.; Mellor, D.; Raats, M.; Sokolović, M.; Vijaykumar, S.; et al. How Do We Differentiate Not Demonise–Is There a Role for Healthier Processed Foods in an Age of Food Insecurity? Proceedings of a Roundtable Event. Nutr. Bull. 2023, 48, 278–295. [Google Scholar] [CrossRef]
- Leung, C.W.; Fulay, A.P.; Parnarouskis, L.; Martinez-Steele, E.; Gearhardt, A.N.; Wolfson, J.A. Food Insecurity and Ultra-Processed Food Consumption: The Modifying Role of Participation in the Supplemental Nutrition Assistance Program (SNAP). Am. J. Clin. Nutr. 2022, 116, 197–205. [Google Scholar] [CrossRef]
- Romero Ferreiro, C.; Lora Pablos, D.; Gómez de la Cámara, A. Two Dimensions of Nutritional Value: Nutri-Score and NOVA. Nutrients 2021, 13, 2783. [Google Scholar] [CrossRef]
- Lorenzoni, G.; Di Benedetto, R.; Silano, M.; Gregori, D. What Is the Nutritional Composition of Ultra-Processed Food Marketed in Italy? Nutrients 2021, 13, 2364. [Google Scholar] [CrossRef]
- Rolls, B.J.; Cunningham, P.M.; Diktas, H.E. Properties of Ultraprocessed Foods That Can Drive Excess Intake. Nutr. Today 2020, 55, 109. [Google Scholar] [CrossRef]
- Scrinis, G.; Monteiro, C. From Ultra-Processed Foods to Ultra-Processed Dietary Patterns. Nat. Food 2022, 3, 671–673. [Google Scholar] [CrossRef]
- Chen, Z.; Khandpur, N.; Desjardins, C.; Wang, L.; Monteiro, C.A.; Rossato, S.L.; Fung, T.T.; Manson, J.E.; Willett, W.C.; Rimm, E.B.; et al. Ultra-Processed Food Consumption and Risk of Type 2 Diabetes: Three Large Prospective U.S. Cohort Studies. Diabetes Care 2023, 46, 1335–1344. [Google Scholar] [CrossRef]
- Hall, K.D.; Ayuketah, A.; Brychta, R.; Cai, H.; Cassimatis, T.; Chen, K.Y.; Chung, S.T.; Costa, E.; Courville, A.; Darcey, V.; et al. Ultra-Processed Diets Cause Excess Calorie Intake and Weight Gain: An Inpatient Randomized Controlled Trial of Ad Libitum Food Intake. Cell Metab. 2019, 30, 67–77.e3. [Google Scholar] [CrossRef] [PubMed]
- Popkin, B.M.; Miles, D.R.; Taillie, L.S.; Dunford, E.K. A policy approach to identifying food and beverage products that are ultra-processed and high in added salt, sugar and saturated fat in the United States: A cross-sectional analysis of packaged foods. Lancet Reg. Health Am. 2024, 32, 100713. [Google Scholar] [CrossRef] [PubMed]


| FOOD CATEGORY | NOVA CLASSIFICATION | ||||||||
|---|---|---|---|---|---|---|---|---|---|
| By Name | By Ingredients | p-Value | |||||||
| NOVA1 | NOVA2 | NOVA3 | NOVA4 | NOVA1 | NOVA2 | NOVA3 | NOVA4 | ||
| Dairy and Substitutes | 365 (34) | 0 (0) | 264 (25) | 432 (41) | 146 (14) | 0 (0) | 187 (18) | 715 (68) | <0.001 |
| Egg and Egg Products | 35 (97) | 0 (0) | 0 (0) | 1 (3) | 34 (94) | 0 (0) | 0 (0) | 2 (6) | Ν/A |
| Meat and Meat Products | 8 (3) | 0 (0) | 129 (52) | 109 (44) | 1 (<1) | 0 (0) | 2 (1) | 237 (99) | <0.001 |
| Seafood, Fish and Products | 0 (0) | 0 (0) | 73 (89) | 9 (11) | 0 (0) | 0 (0) | 54 (67) | 27 (33) | <0.001 |
| Fats and Oils | 0 (0) | 42 (52) | 0 (0) | 39 (48) | 0 (0) | 33 (41) | 0 (0) | 48 (59) | <0.001 |
| Grains and Grain Products | 276 (24) | 0 (0) | 17 (1) | 849 (74) | 235 (26) | 0 (0) | 12 (1) | 894 (78) | <0.001 |
| Nuts, Seeds, and Kernels | 62 (47) | 0 (0) | 58 (44) | 11 (8) | 29 (22) | 0 (0) | 34 (26) | 67 (52) | <0.001 |
| Vegetables and Vegetable Products | 539 (88) | 0 (0) | 50 (8) | 27 (4) | 489 (80) | 0 (0) | 37 (6) | 88 (14) | <0.001 |
| Fruit and Fruit Products | 20 (44) | 0 (0) | 25 (56) | 0 (0) | 1 (2) | 0 (0) | 5 (11) | 38 (86) | 0.335 |
| Sugars and Sugar Products | 2 (<1) | 35 (9) | 47 (12) | 321 (79) | 1 (<1) | 35 (9) | 28 (7) | 341 (84) | <0.001 |
| Beverages | 119 (27) | 0 (0) | 0 (0) | 329 (73) | 48 (11) | 0 (0) | 1 (<1) | 397 (89) | <0.001 |
| Ready Meals | 0 (0) | 0 (0) | 0 (0) | 84 (100) | 0 (0) | 0 (0) | 0 (0) | 84 (100) | Ν/A |
| Miscellaneous | 5 (1) | 1 (<1) | 57 (12) | 406 (87) | 5 (1) | 1 (<1) | 7 (1) | 460 (97) | <0.001 |
| TOTAL | 1431 (29.5) | 78 (1.6) | 720 (14.9) | 2617 (54.0) | 989 (20.4) | 69 (1.4) | 367 (7.6) | 3398 (70.5) | <0.001 |
| FOOD SUBCATEGORY | NOVA CLASSIFICATION | |||||||||
|---|---|---|---|---|---|---|---|---|---|---|
| By Name | By Ingredients | p-Value | ||||||||
| NOVA1 | NOVA2 | NOVA3 | NOVA4 | NOVA1 | NOVA2 | NOVA3 | NOVA4 | |||
| Cream | 0 | 0 | 0 | 50 (100%) | 0 | 0 | 0 | 50 (100%) | N/A | |
| Milk | 122 (69.7%) | 0 | 6 (3.4%) | 47 (26.9%) | 94 (54%) | 0 | 6 (3%) | 74 (43%) | <0.001 | |
| Yoghurt | 88 (51.2%) | 0 | 0 | 84 (48.8%) | 46 (27.2%) | 0 | 0 | 123 (72.8%) | <0.001 | |
| Cheese | 0 | 0 | 191 (87.6%) | 27 (12.4%) | 0 | 0 | 127 (59.6%) | 86 (40.4%) | <0.001 | |
| Imitation Milk Products | 155 (37.4%) | 0 | 67 (16.2%) | 192 (46.4%) | 6 (1.4%) | 0 | 54 (13.2%) | 350 (85.3%) | <0.001 | |
| Frozen Dairy Desserts | 0 | 0 | 0 | 40 (100%) | 0 | 0 | 0 | 40 (100%) | N/A | |
| Fresh or Processed Eggs | 35 (100%) | 0 | 0 | 0 | 34 (100%) | 0 | 0 | 0 | N/A | |
| Poultry Meat | 3 (37.5%) | 0 | 0 | 5 (62.5%) | 0 | 0 | 0 | 8 (100%) | N/A | |
| Meat Analogue | 0 | 0 | 0 | 111 (100%) | 0 | 0 | 0 | 111 (100%) | N/A | |
| Preserved Meat | 1 (1.2%) | 0 | 82 (98.8%) | 0 | 1 (1.2%) | 0 | 2 (2.4%) | 80 (96.4%) | <0.001 | |
| Sausage or Similar Meat | 0 | 0 | 38 (100%) | 0 | 0 | 0 | 0 | 37 (100%) | N/A | |
| Meat Dish | 5 (20%) | 0 | 8 (32%) | 12 (48%) | 0 | 0 | 0 | 20 (100%) | 0.056 | |
| Seafood or Related Organism | 0 | 0 | 5 (100%) | 0 | 0 | 0 | 2 (40%) | 3(60%) | <0.001 | |
| Seafood Product | 0 | 0 | 73 (91.3%) | 7 (8.7%) | 0 | 0 | 54 (68.4%) | 25 (31.6%) | N/A | |
| Vegetable Fat or Oil | 0 | 8 (100%) | 0 | 0 | 0 | 1 (12.5%) | 0 | 7 (87.5%) | N/A | |
| Margarine or Lipid of Mixed Origins | 0 | 0 | 0 | 39 (100%) | 0 | 0 | 0 | 39 (100%) | N/A | |
| Butter or Other Animal Fat | 0 | 34 (100%) | 0 | 0 | 0 | 32 (94%) | 0 | 2 (6%) | N/A | |
| Cereal or Cereal-Like Milling Products and Derivatives | 0 | 0 | 51 (100%) | 0 | 0 | 0 | 51 (100%) | N/A | ||
| Rice or Other Grain | 76 (78.5%) | 0 | 2 (2%) | 19 (19.5%) | 64 (66%) | 0 | 2 (2%) | 31 (32%) | <0.001 | |
| Pasta and Similar Products | 185 (91.1%) | 0 | 14 (6.9%) | 4 (2%) | 167 (82.7%) | 0 | 9 (4.5%) | 26 (12.8%) | <0.001 | |
| Breakfast Cereals | 15 (9.5%) | 0 | 1 (0.5%) | 139 (90%) | 4 (2.5%) | 0 | 1 (0.5%) | 150 (97%) | <0.001 | |
| Bread and Similar Products | 0 | 0 | 0 | 259 (100%) | 0 | 0 | 0 | 259 (100%) | N/A | |
| Fine Bakery Ware | 0 | 0 | 0 | 289 (100%) | 0 | 0 | 0 | 289 (100%) | N/A | |
| Savoury Cereal Dish | 0 | 0 | 0 | 88 (100%) | 0 | 0 | 0 | 88 (100%) | N/A | |
| Nuts | 36 (52.2%) | 0 | 29 (42%) | 4 (5.8%) | 20 (29.5%) | 0 | 16 (23.5%) | 32 (47%) | <0.001 | |
| Seeds and Kernels | 11 (37.5%) | 0 | 24 (68.5%) | 0 | 0 | 0 | 18 (51.5%) | 17 (48.5%) | 0.803 | |
| Nut or Seed Product | 15 (55.5%) | 0 | 5 (18.5%) | 7 (26%) | 9 (33.5%) | 0 | 0 | 18 (66.5%) | <0.001 | |
| Vegetable (Excluding Potato) | 112 (65.1%) | 0 | 50 (29.1%) | 10 (5.8%) | 65 (38.2%) | 0 | 35 (20.6%) | 70 (41.2%) | <0.001 | |
| Starchy Root or Potato | 4 (19%) | 0 | 0 | 17 (81%) | 1 (4.8%) | 0 | 2 (9.5%) | 18 (85.7%) | <0.001 | |
| Pulse and Pulse Product | 423 (100%) | 0 | 0 | 0 | 423 (100%) | 0 | 0 | 0 | N/A | |
| Processed Food Product (Fruit) | 20 (44.4%) | 0 | 25 (55.6%) | 0 | 1 (2%) | 0 | 5 (11.5%) | 38 (86.5%) | 0.335 | |
| Sugar, Honey, or Syrup | 1 (2%) | 35 (76%) | 6 (13%) | 4 (9%) | 1 (2%) | 35 (76%) | 6 (13%) | 4 (9%) | <0.001 | |
| Jam or Marmalade | 0 | 0 | 0 | 83 (100%) | 0 | 0 | 0 | 83 (100%) | N/A | |
| Non-Chocolate Confectionery or Other Sugar Product | 1 (1.5%) | 0 | 41 (60.5%) | 26 (38%) | 0 | 0 | 22 (32.5%) | 46 (67.5%) | <0.001 | |
| Chocolate or Chocolate Product | 0 | 0 | 0 | 208 (100%) | 0 | 0 | 0 | 208 (100%) | N/A | |
| Juice or Nectar | 114 (69%) | 0 | 0 | 51 (31%) | 48 (29.5%) | 0 | 1 (0.5%) | 114 (70%) | <0.001 | |
| Non-Alcoholic Beverage | 5 (2%) | 0 | 0 | 278 (98%) | 0 | 0 | 0 | 283 (100%) | N/A | |
| Spice, Condiment, or Other Ingredient | 3 (1.1%) | 1 (0.4%) | 57 (20.1%) | 223 (78.5%) | 1 (0.4%) | 1 (0.4%) | 7 (2.5%) | 275 (96.8%) | <0.001 | |
| Prepared Food Product | 2 (1.2%) | 0 | 0 | 170 (98.8%) | 0 | 0 | 0 | 172 (100%) | N/A | |
| Ready-To-Eat Food | 0 | 0 | 0 | 43 (100%) | 0 | 0 | 0 | 43 (100%) | N/A | |
| Frozen, Semi-Ready Meal | 0 | 0 | 0 | 41 (100%) | 0 | 0 | 0 | 41 (100%) | N/A | |
| Energy (Kcal) | Protein (g) | SFA (G) | Total Sugars (g) | Sodium (mg) | |||||||||||
|---|---|---|---|---|---|---|---|---|---|---|---|---|---|---|---|
| NOVA4 from NOVA1 | NOVA4 from NOVA3 | NOVA4 Generic | NOVA4 from NOVA1 | NOVA4 from NOVA3 | NOVA4 Generic | NOVA4 from NOVA1 | NOVA4 from NOVA3 | NOVA4 Generic | NOVA4 from NOVA1 | NOVA4 from NOVA3 | NOVA4 Generic | NOVA4 from NOVA1 | NOVA4 from NOVA3 | NOVA4 Generic | |
| Dairy and Substitutes | 50.0 (32, 71) | 279.0 (199, 337) | 96.0 (63, 221) | 1.4 (1, 5) | 11.0 (1, 25) | 3.2 (1, 5) | 0.9 (0, 2) | 18.0 (3, 21) | 1.3 (1, 9) | 3.7 (1, 5) | 0.0 (0, 1) | 7.1 (3, 12) | 52.0 (40, 72) | 700.0 (440, 800) | 48.0 (40, 68) |
| Meat and Meat Products | 196.0 (156, 238) | 215.0 (125, 273) | 222.0 (192, 248) | 19.0 (15, 21) | 14.6 (13, 22) | 16.0 (14, 22) | 4.7 (1, 6) | 4.3 (1, 8) | 1.8 (1, 5) | 1.1 (1, 2) | 1.0 (0, 1) | 1.1 (1, 2) | - | 952.0 (800, 1000) | 600.0 (560, 680) |
| Seafood, Fish, and Products | - | 187.0 (102, 341) | 203.0 (195, 233) | - | 11.6 (10, 15) | 12.3 (12, 13) | - | 2.1 (1, 6) | 1.0 (1, 1) | - | 1.0 (0, 1) | 0.9 (1, 2) | - | 628.0 (560, 804) | 364.0 (360, 400) |
| Grains and Grain Products | 358.0 (272, 402) | 359.5 (290, 375) | 399.0 (317, 467) | 8.2 (7, 11) | 12.6 (11, 13) | 8 (6, 10) | 0.7 (0, 2) | 3.5 (2, 5) | 4.9 (2, 9) | 2.8 (1, 14) | 3.7 (3, 5) | 12.7 (3, 25) | 216.0 (60, 340) | 610.0 (520, 680) | 320.0 (200, 500) |
| Nuts, Seeds, and Kernels | 517.5 (402, 607) | 574.0 (248, 625) | 573.0 (568, 579) | 14.9 (10, 21) | 17.4 (2, 22) | 18.4 (16, 24) | 5.0 (4, 8) | 6.0 (3, 8) | 8.4 (8, 10) | 5.3 (1, 11) | 2.7 (0, 5) | 7.4 (1, 31) | 220.0 (16, 1400) | 528.0 (208, 1700) | 16.0 (0, 72) |
| Vegetables and Vegetable Products | 20.0 (18, 29) | 26.0 (25, 31) | 136.0 (94, 195) | 1.6 (1, 2) | 1.5 (1, 2) | 2.6 (2, 7) | 0.1 (0, 0) | 0.1 (0, 0) | 0.6 (0, 1) | 2.4 (0, 4) | 3.5 (3, 4) | 1.3 (1, 4) | 28.0 (12, 252) | 20.0 (12, 252) | 52.0 (24, 208) |
| Fruit and Fruit Products | 294.0 (241, 327) | 68.5 (61, 289) | - | 2.4 (2, 3) | 0.4 (90, 1) | - | 0.1 (0, 0) | 0 (0, 0) | - | 47.0 (38, 56) | 17.5 (12, 57) | - | 52.0 (12, 60) | 10.0 (4, 120) | - |
| Sugars and Sugar Products | - | 420.0 (301, 530) | 529.0 (465, 550) | - | 8.0 (0, 150 | 6.2 (4, 9) | - | 0.1 (0, 3) | 17.0 (7, 20) | - | 47.0 (24, 59) | 48.1 (38, 55) | - | 24.0 (3, 40) | 44.0 (12, 120) |
| Beverages | 49.0 (45, 53) | - | 44.0 (3, 50) | 0.3 (0, 0) | - | 0 (0, 0) | 0 (0, 0) | - | 0 (0, 0) | 11.5 (11, 13) | - | 7.9 (0, 12) | 4.0 (0, 8) | - | 8.0 (0, 20) |
| Miscellaneous | 350.0 (348, 3710 | 77.0 (60, 102) | 280.0 (115, 427) | 44.6 (7, 51) | 1.3 (1, 2) | 3.3 (1, 6) | 1.0 (1, 1) | 0.1 (0, 0) | 2.0 (0, 6) | 10.0 (6, 11) | 10.0 (5, 22) | 3.3 (1, 11) | 3995.0 (670, 7320) | 720.0 (400, 980) | 568.0 (352, 920) |
| Nutri-Score Grade n (%) | |||||
|---|---|---|---|---|---|
| A | B | C | D | E | |
| NOVA4 from NOVA1 | 73 (21.0) | 139 (39.9) | 46 (13.2) | 25 (7.2) | 64 (18.4) |
| NOVA4 from NOVA3 | 41 (8.9) | 102 (22.0) | 84 (18.1) | 161 (34.8) | 73 (15.8) |
| NOVA4 generic | 228 (8.8) | 665 (25.8) | 448 (17.4) | 634 (24.6) | 602 (23.3) |
| Total | 342 (10.1) | 906 (26.7) | 578 (17.0) | 820 (24.2) | 739 (21.8) |
| Food Category | Food Subcategory | NOVA Group | FSAm-NPS Score | p-Value | A [n (%)] | B [n (%)] | C [n (%)] | D [n (%)] | E [n (%)] |
|---|---|---|---|---|---|---|---|---|---|
| Milk, Milk Product, or Milk Substitute (n = 1048) | Milk (n = 174) | NOVA 1 (n = 94) | −0.117 ± 1.302 | <0.001 | 42 (44.7) | 52 (55.3) | - | - | - |
| NOVA 3 (n = 6) | −1.667 ± 0.516 | 6 (100.0) | - | - | - | - | |||
| NOVA 4 (n = 74) | 1.595 ± 4.684 | 14 (18.9) | 48 (64.9) | 8 (10.8) | 2 (2.7) | 2 (2.7) | |||
| Yogurt (n = 169) | NOVA 1 (n = 46) | −0.630 ± 2.886 | 0.853 | 22 (47.8) | 15 (32.6) | 9 (19.6) | - | - | |
| NOVA 4 (n = 123) | −0.447 ± 2.237 | 63 (51.2) | 48 (39.0) | 12 (9.8) | - | - | |||
| Cheese (n = 213) | NOVA 3 (n = 127) | 11.819 ± 7.140 | 0.125 | 3 (2.4) | 26 (20.5) | 5 (3.9) | 84 (66.1) | 9 (7.1) | |
| NOVA 4 (n = 86) | 10.384 ± 7.288 | 6 (7.0) | 17 (19.8) | 12 (14.0) | 46 (53.5) | 5 (5.8) | |||
| Milk Substitute (n = 410) | NOVA 1 (n = 6) | −1.000 ± 1.265 | <0.001 | 4 (66.7) | 2 (33.3) | - | - | - | |
| NOVA 3 (n = 54) | 1.241 ± 3.923 | 5 (9.3) | 46 (85.2) | 1 (1.9) | - | 2 (3.7) | |||
| NOVA 4 (n = 350) | 5.297 ± 8.564 | 63 (18.0) | 167 (47.7) | 30 (8.6) | 33 (9.4) | 57 (16.3) | |||
| Milk Cream (n = 42) | NOVA 4 (n = 42) | 8.191 ± 6.181 | N/A | - | 14 (33.3) | 7 (16.7) | 21 (50.0) | - | |
| Dairy Dessert (n = 40) | NOVA 4 (n = 40) | 14.050 ± 6.341 | N/A | 1 (2.5) | 3 (7.5) | 2 (5.0) | 23 (57.5) | 11 (27.5) | |
| Fresh or processed eggs (n = 35) | Fresh or processed eggs (n = 35) | NOVA 1 (n = 34) | −0.529 ± 1.107 | <0.001 | 11 (32.4) | 23 (67.6) | - | - | - |
| NOVA 4 (n = 1) | −4.000 | 1 (100.0) | - | - | - | - | |||
| Meat or meat product (n = 250) | Meat analogue (n = 110) | NOVA 4 (n = 110) | 5.818 ± 6.956 | N/A | 16 (14.5) | 26 (23.6) | 29 (26.4) | 34 (30.9) | 5 (4.5) |
| Preserved meat (n = 83) | NOVA 1 (n = 1) | 17.000 | 0.382 | 1 (100.0) | - | - | - | - | |
| NOVA 3 (n = 2) | 17.000 ± 0.000 | - | - | - | 2 (100.0) | - | |||
| NOVA 4 (n = 80) | 10.463 ± 8.016 | 4 (5.0) | 14 (17.5) | 11 (13.8) | 36 (45.0) | 15 (18.8) | |||
| Sausage or similar meat (n = 37) | NOVA 4 (n = 37) | 11.027 ± 9.435 | N/A | 3 (8.1) | 11 (29.7) | - | 13 (35.1) | 10 (27.0) | |
| Meat dish (n = 20) | NOVA 4 (n = 20) | 7.300 ± 6.309 | N/A | 1 (5.0) | 7 (35.0) | 1 (5.0) | 11 (55.0) | - | |
| Seafood or related product (n = 79) | Seafood product (n = 79) | NOVA 3 (n = 54) | 6.167 ± 6.624 | 0.463 | 3 (5.6) | 19 (35.2) | 11 (20.4) | 20 (37.0) | 1 (1.9) |
| NOVA 4 (n = 25) | 4.600 ± 7.427 | 6 (24.0) | 9 (36.0) | 4 (16.0) | 4 (16.0) | 2 (8.0) | |||
| Fat or oil (n = 81) | Vegetable fat or oil (n = 8) | NOVA 2 (n = 1) | 0.000 | <0.001 | - | 1 (100.0) | - | - | - |
| NOVA 4 (n = 7) | 15.429 ± 2.878 | - | - | 1 (14.3) | 6 (85.7) | - | |||
| Margarine or lipid of mixed origins (n = 39) | NOVA 4 (n = 39) | 9.590 ± 3.618 | N/A | - | 1 (2.6) | 21 (53.8) | 17 (43.6) | - | |
| Butter or other animal fat (n = 34) | NOVA 2 (n = 32) | 12.688 ± 8.042 | 0.343 | - | 8 (25.0) | 1 (3.1) | 7 (21.9) | 16 (50.0) | |
| NOVA 4 (n = 2) | 7.000 ± 9.899 | - | 1 (50.0) | - | 1 (50.0) | - | |||
| Grain or grain product (n = 1141) | Cereal or cereal-like milling products and derivatives (n = 51) | NOVA 4 (n = 51) | 7.059 ± 7.857 | N/A | 5 (9.8) | 19 (37.3) | 7 (13.7) | 13 (25.5) | 7 (13.7) |
| Rice or other grain (n = 97) | NOVA 1 (n = 64) | −1.125 ± 1.741 | <0.001 | 31 (48.4) | 33 (51.6) | - | - | - | |
| NOVA 3 (n = 2) | 4.000 ± 0.000 | - | - | 2 (100.0) | - | - | |||
| NOVA 4 (n = 31) | 6.516 ± 7.447 | 1 (3.2) | 13 (41.9) | 8 (25.8) | 5 (16.1) | 4 (12.9) | |||
| Pasta and similar products (n = 202) | NOVA 1 (n = 167) | −2.934 ± 2.024 | <0.001 | 161 (96.4) | 4 (2.4) | 2 (1.2) | - | - | |
| NOVA 3 (n = 9) | 9.556 ± 5.897 | 1 (11.1) | 1 (11.1) | 2 (22.2) | 5 (55.6) | - | |||
| NOVA 4 (n = 26) | 4.923 ± 7.579 | 10 (38.5) | 2 (7.7) | 7 (26.9) | 7 (26.9) | - | |||
| Breakfast cereals (n = 155) | NOVA 1 (n = 4) | 1.250 ± 5.620 | 0.067 | 2 (50.0) | - | 2 (50.0) | - | - | |
| NOVA 3 (n = 1) | 10.000 | - | - | 1 (100.0) | - | - | |||
| NOVA 4 (n = 150) | 8.093 ± 5.836 | 16 (10.7) | 15 (10.0) | 59 (39.3) | 60 (40.0) | - | |||
| Bread and similar products (n = 259) | NOVA 4 (n = 259) | 4.247 ± 6.865 | N/A | 43 (16.6) | 114 (44.0) | 53 (20.5) | 35 (13.5) | 14 (5.4) | |
| Fine bakery ware (n = 289) | NOVA 4 (n = 289) | 14.948 ± 8.682 | N/A | 2 (0.7) | 52 (18.0) | 22 (7.6) | 90 (31.1) | 123 (42.6) | |
| Savory cereal dish (n = 88) | NOVA 4 (n = 88) | 10.852 ± 5.247 | N/A | 1 (1.1) | 7 (8.0) | 22 (25.0) | 53 (60.2) | 5 (5.7) | |
| Nuts, seeds, or kernels (n = 130) | Nuts (n = 68) | NOVA 1 (n = 20) | 0.050 ± 6.485 | 0.215 | 14 (70.0) | 2 (10.0) | 2 (10.0) | 1 (5.0) | 1 (5.0) |
| NOVA 3 (n = 16) | 0.000 ± 3.983 | 6 (37.5) | 4 (25.0) | 6 (37.5) | - | - | |||
| NOVA 4 (n = 32) | 2.658 ± 6.136 | 9 (28.1) | 9 (28.1) | 11 (34.4) | 2 (6.3) | 1 (3.1) | |||
| Seeds and kernels (n = 35) | NOVA 3 (n = 18) | 12.000 ± 5.111 | 0.333 | - | 1 (5.6) | 4 (22.2) | 12 (66.7) | 1 (5.6) | |
| NOVA 4 (n = 17) | 10.471 ± 3.986 | - | 1 (5.9) | 6 (35.3) | 10 (58.8) | - | |||
| Nut or seed product (n = 27) | NOVA 1 (n = 9) | 11.000 ± 4.416 | 0.146 | - | 1 (11.1) | 1 (11.1) | 7 (77.8) | - | |
| NOVA 4 (n = 18) | 13.833 ± 4.719 | - | - | 4 (22.2) | 12 (66.7) | 2 (11.1) | |||
| Vegetable or vegetable product (n = 614) | Vegetable (excluding potato) (n = 170) | NOVA 1 (n = 65) | −7.600 ± 2.416 | <0.001 | 65 (100.0) | - | - | - | - |
| NOVA 3 (n = 35) | −2.029 ± 7.127 | 27 (77.1) | 3 (8.6) | 1 (2.9) | 3 (8.6) | 1 (2.9) | |||
| NOVA 4 (n = 70) | −3.729 ± 3.784 | 61 (87.1) | 4 (5.7) | 4 (5.7) | 1 (1.4) | - | |||
| Starchy root or potato (n = 21) | NOVA 1 (n = 1) | −2.000 | 0.984 | 1 (100.0) | - | - | - | - | |
| NOVA 3 (n = 2) | −1.500 ± 2.121 | 1 (50.0) | 1 (50.0) | - | - | - | |||
| NOVA 4 (n = 18) | −1.778 ± 2.463 | 10 (55.6) | 8 (44.4) | - | - | - | |||
| Pulse and pulse product (n = 423) | NOVA 1 (n = 423) | −6.742 ± 2.058 | N/A | 421 (99.5) | 2 (0.5) | - | - | - | |
| Fruit or fruit product (n = 44) | Processed food product (fruit) (n = 44) | NOVA 1 (n = 1) | 1.00 | 0.941 | - | 1 (100.0) | - | - | - |
| NOVA 3 (n = 5) | −0.200 ± 3.899 | 3 (60.0) | - | 2 (40.0) | - | - | |||
| NOVA 4 (n = 38) | 0.316 ± 4.160 | 19 (50.0) | 9 (23.7) | 9 (23.7) | 1 (2.6) | - | |||
| Sugar or sugar product (n = 404) | Sugar, honey, or syrup (n = 45) | NOVA 2 (n = 35) | 0.000 ± 0.000 | N/A | - | 35 (100.0) | - | - | - |
| NOVA 3 (n = 6) | 0.000 ± 0.000 | - | 6 (100.0) | - | - | - | |||
| NOVA 4 (n = 4) | 0.000 ± 0.000 | - | 4 (100.0) | - | - | - | |||
| Jam or marmalade (n = 83) | NOVA 4 (n = 83) | 6.578 ± 5.808 | N/A | 2 (2.4) | 27 (32.5) | 21 (25.3) | 32 (38.6) | 1 (1.2) | |
| Non-chocolate confectionery or other sugar product (n = 68) | NOVA 3 (n = 22) | 4.318 ± 7.767 | 0.020 | 8 (36.4) | 6 (27.3) | - | 7 (31.8) | 1 (4.5) | |
| NOVA 4 (n = 46) | 9.196 ± 7.921 | 9 (19.6) | 6 (13.0) | 2 (4.3) | 28 (60.9) | 1 (2.2) | |||
| Chocolate or chocolate product (n = 208) | NOVA 4 (n = 208) | 22.111 ± 6.589 | N/A | - | 7 (3.4) | 10 (4.8) | 19 (9.1) | 172 (82.7) | |
| Beverage (n = 446) | Juice or nectar (n = 163) | NOVA 1 (n = 48) | 9.958 ± 2.073 | 0.138 | - | - | 2 (4.2) | 17 (35.4) | 29 (60.4) |
| NOVA 3 (n = 1) | 3.000 | - | - | 1 (100.0) | - | - | |||
| NOVA 4 (n = 114) | 9.588 ± 3.376 | - | 4 (3.5) | 10 (8.8) | 31 (27.2) | 69 (60.5) | |||
| Non-alcoholic beverage (n = 283) | NOVA 4 (n = 283) | 8.371 ± 8.541 | N/A | - | 115 (40.6) | 28 (9.9) | 13 (4.6) | 127 (44.9) | |
| Miscellaneous food product (n = 540) | Spice, Condiment, or other Ingredient (n = 284) | NOVA 1 (n = 1) | 15.000 | N/A | - | - | - | 1 (100.0) | - |
| NOVA 2 (n = 1) | 10.000 | - | - | 1 (100.0) | - | - | |||
| NOVA 3 (n = 7) | 2.714 ± 5.765 | 1 (14.3) | 3 (42.9) | 2 (28.6) | 1 (14.3) | - | |||
| NOVA 4 (n = 275) | 9.851 ± 8.033 | 16 (5.8) | 43 (15.6) | 84 (30.5) | 84 (30.5) | 48 (17.5) | |||
| Prepared food product (n = 172) | NOVA 4 (n = 172) | 9.454 ± 6.758 | N/A | 8 (4.7) | 28 (16.3) | 45 (26.2) | 74 (43.0) | 17 (9.9) | |
| Ready-to-eat Food (n = 43) | NOVA 4 (n = 43) | 1.349 ± 4.835 | N/A | 12 (27.9) | 20 (46.5) | 8 (18.6) | 3 (7.0) | - | |
| Frozen, Semi-Ready Meal (n = 41) | NOVA 4 (n = 41) | −2.634 ± 6.335 | N/A | 28 (68.3) | 7 (17.1) | 4 (9.8) | 2 (4.9) | - |
Disclaimer/Publisher’s Note: The statements, opinions and data contained in all publications are solely those of the individual author(s) and contributor(s) and not of MDPI and/or the editor(s). MDPI and/or the editor(s) disclaim responsibility for any injury to people or property resulting from any ideas, methods, instructions or products referred to in the content. |
© 2024 by the authors. Licensee MDPI, Basel, Switzerland. This article is an open access article distributed under the terms and conditions of the Creative Commons Attribution (CC BY) license (https://creativecommons.org/licenses/by/4.0/).
Share and Cite
Vlassopoulos, A.; Katidi, A.; Noutsos, S.; Kapsokefalou, M. Precision Food Composition Data as a Tool to Decipher the Riddle of Ultra-Processed Foods and Nutritional Quality. Foods 2024, 13, 1259. https://0-doi-org.brum.beds.ac.uk/10.3390/foods13081259
Vlassopoulos A, Katidi A, Noutsos S, Kapsokefalou M. Precision Food Composition Data as a Tool to Decipher the Riddle of Ultra-Processed Foods and Nutritional Quality. Foods. 2024; 13(8):1259. https://0-doi-org.brum.beds.ac.uk/10.3390/foods13081259
Chicago/Turabian StyleVlassopoulos, Antonis, Alexandra Katidi, Stamoulis Noutsos, and Maria Kapsokefalou. 2024. "Precision Food Composition Data as a Tool to Decipher the Riddle of Ultra-Processed Foods and Nutritional Quality" Foods 13, no. 8: 1259. https://0-doi-org.brum.beds.ac.uk/10.3390/foods13081259