
Six-Tower Pressure Swing Adsorption Demonstration Animation

School of Chemical Engineering and Blasting, Anhui University of Science and Technology, Huainan 232001, China
*
Authors to whom correspondence should be addressed.
Processes 2024, 12(4), 836; https://0-doi-org.brum.beds.ac.uk/10.3390/pr12040836
Submission received: 3 March 2024
/
Revised: 17 April 2024
/
Accepted: 18 April 2024
/
Published: 20 April 2024
(This article belongs to the Section Chemical Processes and Systems)
Abstract
:The Pressure Swing Adsorption (PSA) technique is a widely embraced automated method for gas separation within the industrial sector, prized for its operational simplicity and substantial economic benefits. In practice, the process typically involves the use of multiple towers to facilitate the completion of the PSA cycle. However, with the increasing number of towers in a PSA system, the intricacies of the cyclic process tend to amplify, posing challenges for novices attempting to grasp the mechanics of a six-tower PSA cycle. Utilizing animation can facilitate the process of comprehending these complex techniques by presenting them in a simplified and visually engaging format. Therefore, our research group has designed an animated depiction of a six-tower PSA device, predicated on the prototype established in our laboratory. This animation furnishes an inclusive demonstration of a complete cycle, encompassing twelve steps, pertaining to the operation of a six-tower PSA. It is our aspiration that this tool will prove advantageous for those who are embarking on the journey of understanding multi-tower PSA, as well as for seasoned professionals engaged in the field of pressure swing adsorption.
1. Introduction
1.1. Research Objective
Gas separation and purification have consistently commanded attention within industrial spheres, with the perpetual quest for economical and cost-efficient methodologies and apparatus. The Pressure Swing Adsorption (PSA) technique is a quintessential illustration of these methods. This technology facilitates gas separation by modifying the adsorption capacity of adsorbents through alterations in system pressure. Its acclaim stems from its cost-efficiency, remarkable return on investment, and the capacity for autonomous operation, which have promoted its extensive application across diverse gas separation processes [1]. Notably, recent advancements in PSA technology have integrated it with smart systems, enhancing the efficiency and expediting the completion of the process [2]. However, as with any other technology, the domain of PSA harbors its unique set of challenges awaiting resolution. Chief among these is the difficulty in establishing a control solution for PSA apparatus, a problem partly attributable to the intricate operational cycles of multi-tower PSA devices [3,4]. For simpler configurations, such as two- or three-tower PSA systems, the number of stages within a cycle is tractable, and the adsorption process can be readily conceptualized. However, as the tower count escalates to six, comprehension of the gas flow process and the inter-tower transitions becomes a formidable endeavor. Animation serves as an efficacious multimedia modality that could potentially ameliorate the learning curve [5]. Its advent can be traced back to the 1980s, when animation tools were primarily conceived to satiate the demands of the film industry. To date, animation retains its potency as an influential tool [6]. Animating intricate process principles can catalyze comprehension and is a significant component of industrial training. Motivated by these benefits, our research consortium has developed a video demonstration delineating the six-tower PSA procedure. This demonstration furnishes an intuitive portrayal of the twelve-stage gas separation process intrinsic to a six-tower PSA apparatus. In doing so, it aims to expedite the learning process pertaining to PSA-related knowledge for curious readers and industry veterans.
1.2. Related Work
The existing literature pertaining to Pressure Swing Adsorption (PSA) is notably scarce, particularly concerning demonstrative materials which elucidate the stages of the PSA process. Predominantly, instructive resources tend to depict this process through a two-tower model. As for articles that delve into the visualization of PSA, most of these focus on employing software for simulating, modeling, and optimizing PSA processes. For instance, Mohammad et al. [7] adopted a combination of differential orthogonal methods and artificial neural networks in their work to predict the performance of PSA systems. In a notable study, Moise et al. [8] undertook simulations of a dual-tower PSA system, implementing artificial neural network controls to regulate the PSA process. The objective was to achieve and maintain the purity of bioethanol production at a molar fraction nearing 99%. In a similar vein, Hense et al. [9] utilized Aspen software for creating a three-bed Vacuum Pressure Swing Adsorption (VPSA) process aimed at conducting simulation analysis for CO separation from alkali oxygen furnace gas. Numerous studies like these serve to authenticate the efficacy and speed of the PSA device via experimental evidence. However, such simulation-based approaches generally cater to those with a pre-existing, comprehensive understanding of the device, offering less assistance to beginners.
Conversely, animations could potentially offer a more accessible means for non-experts to acquire specialized knowledge and principles related to PSA. Given their superior visual effects, animations can significantly expedite the learning process for novices. For instance, Arya et al. [10] designed an animation targeted at preoperative patients, intending to educate them on anemia and thereby augmenting their commitment to the treatment. Similarly, Sharmin et al. [11] developed whiteboard animations for dental students, employing graphical representations and storytelling to elucidate complex scientific concepts.
The main focus of our research group is the production of methane from coal bed methane via a PSA device. Our laboratory houses a six-tower PSA device, the physical model of which is depicted in Figure 1.
We currently find ourselves in the nascent, pilot phase of crafting an animated depiction to bolster comprehension regarding the procedural flow intrinsic to the six-tower, twelve-step Pressure Swing Adsorption (PSA) process, specifically aimed at novices. This visual representation also holds significant potential for research teams engaging in empirical studies using PSA apparatus. The following salient features distinguish our educational animation:
The directional delineation of principal gases during each phase is given prominence. At the incipient stage of the six-tower PSA process, certain gas flows are yet to be established, only appearing once specific towers necessitate pressurization or depressurization within the cycle. To accommodate this dynamic, we have incorporated distinctively hued squares and arrows at the outset, symbolizing the direction of gas flow.
The video encapsulates the changing status of valves: As the six-tower PSA procedure traverses its twelve steps, the internal valves of the PSA apparatus must open to permit the passage of gas. The state of certain valves alternates upon the conclusion of each step. As the tower count rises, the number of valves follows suit, adding to the complexity of their status at any given moment. For this reason, we have meticulously designed a representation of valve transitions during step alternation.
Depiction of the pressure fluctuations or states within the tower also form an integral part of the animation. The fundamental premise of the PSA process revolves around the paradigm of “adsorption under high pressure and desorption under low pressure”. Consequently, it is imperative that pressure changes are visibly presented throughout the animation. Pressure indicators of identical color in the animation correspond to the pressure change resulting from gas transmission between two towers at a certain step.
2. Principle and Methods
2.1. Correlation Principle
2.1.1. Gas Adsorption
Gas adsorption is a process where gas molecules are attracted and held onto the surface of a solid substrate, induced by the chemical affinity or physical adsorptive properties inherent to the solid surface. Given that various gases exhibit divergent adsorption capacities when interacting with solid surfaces, it becomes industrially viable to select or synthesize specific solids for the purpose of separating multicomponent gas mixtures. These solids, often referred to as adsorbents, are generally characterized by their expansive specific surface areas and appropriate pore structure [12,13]. The complex process of gas adsorption can be encapsulated in numerous mathematical expressions. Among them, the Langmuir adsorption isotherm or the Langmuir–Freundlich equation is frequently applied in Pressure Swing Adsorption (PSA) to elucidate the mechanism of gas molecule adsorption on solid surfaces. Additionally, the Ergun equation is typically invoked to detail the dynamic behavior of gas flow within a packed bed of solid particles.
Equations (1) and (2) exemplify the Langmuir adsorption isotherm and the Langmuir–Freundlich equation, respectively. In these equations, signifies the fraction of the total surface area occupied by adsorbed molecules (i.e., the degree of coverage), represents a constant correlated to the heat of adsorption, and denotes the pressure of the gaseous component. In Equation (2), stands for a constant whose value is determined by the temperature and the system [14,15,16].
Equation (3) embodies the Ergun equation, renowned for its capacity to manage both laminar and turbulent flows, thus providing a more comprehensive understanding of fluid dynamics. In this equation, refers to the gas pressure, corresponds to the axial distance coordinate, symbolizes the viscosity of the gas mixture, is the void fraction of the bed (or the inter-particle porosity), is the particle radius, stands for the particle shape factor, denotes the superficial gas velocity, represents the molar mass of the gas mixture, and signifies the gas density [17,18,19].
2.1.2. Valve Switching
The Pressure Swing Adsorption (PSA) system employs an array of remotely controllable solenoid valves. A solenoid valve represents an electromechanical device that utilizes an electric current to generate a magnetic field, which subsequently provides control over the system. This technology has found broad applications in diverse sectors of industrial automation equipment [20,21].
Moreover, the capability to remotely regulate solenoid valves through a Programmable Logic Controller (PLC) substantially augments the safety measures for operators. The operation of these valves, encompassing the opening and closing mechanisms, primarily depends on the alterations in electromagnetic attraction, manipulated by the switching on and off of the power supply [22]. This working principle can be comprehensively elucidated employing Maxwell’s electromagnetic force equation [23,24].
Equation (4) showcases Maxwell’s electromagnetic force equation, where denotes the electromagnetic force, symbolizes the magnetic induction intensity, represents the magnetic permeability of the vacuum, is the area of the pole surface, and corresponds to the magnetic flux of the working air gap.
2.1.3. Pressure Swing Adsorption Cycle
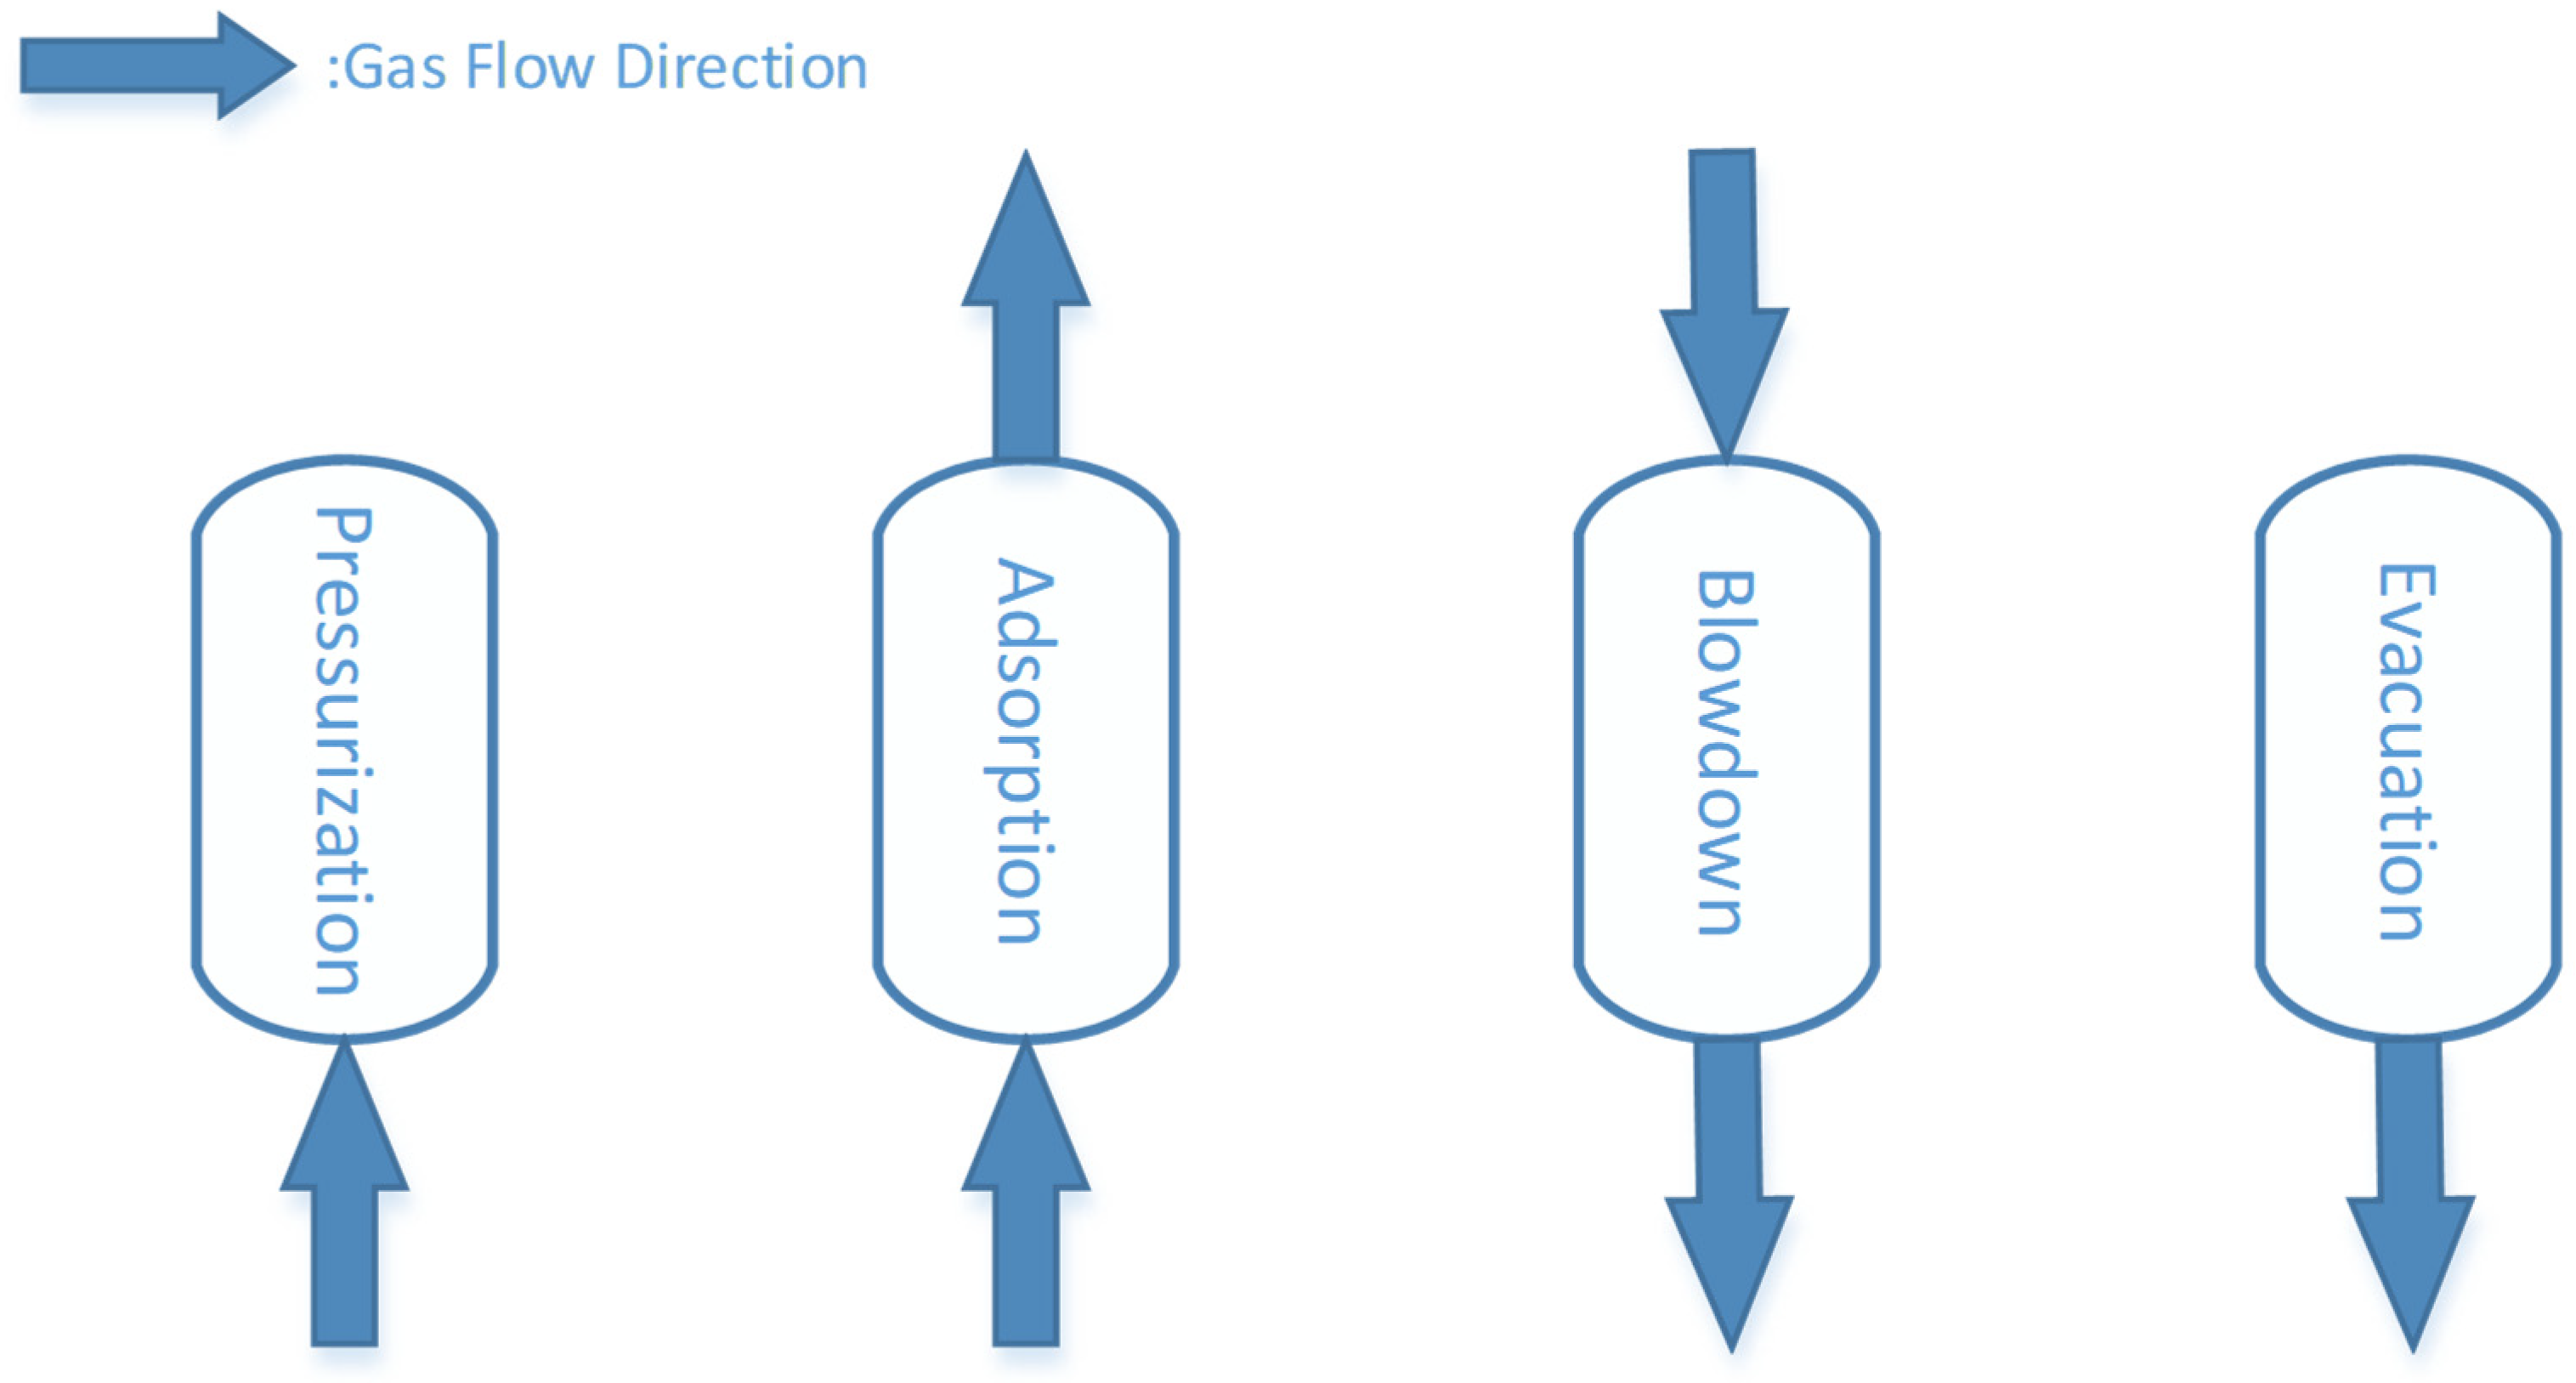
The process of gas separation facilitated by PSA entails the adsorption and desorption of gases on the adsorbent, orchestrated by fluctuations in pressure. Accordingly, the documented PSA systems encompass four cardinal stages, namely pressurization, depressurization, adsorption, and purging [25,26]. A schematic representation of these sequential stages is encapsulated in Figure 2.
The process of pressurization involves an augmentation of pressure within a distinct column, which consequently aids the adsorbent in the segregation of binary component gases. Adsorption transpires as the gas permeates the column and the adsorbent selectively adsorbs one constituent from the binary gases. The other gas, by contrast, is expelled and retained within a tank until the point of adsorbent saturation. Depressurization, a subsequent stage, incites the adsorbed gas to desorb from the adsorbent, thereafter, discharging it into a tank for storage. It is during this phase that the adsorbent is regenerated due to depressurization. Following the fundamental completion of depressurization regeneration, the column undergoes a purging process, ensuring the removal of any lingering gas potentially present on the adsorbent and further reducing column pressure. The number of pressurization and depressurization episodes is contingent on the quantity of columns in the Pressure Swing Adsorption (PSA) device. At its initial stage, the PSA device predominantly relies on a compressor for pressurization. However, following a certain duration, the strategic opening and closing of valves allows particular columns to undergo pressurization and depressurization, facilitating a cyclical operation of the entire apparatus. The animation detailed in this article elucidates this principle in an intuitively clear manner.
2.1.4. Visual Persistence
The concept of visual persistence serves as the primary justification as to why the human eye is capable of discerning image transitions. Upon the observation of an object, the visual nerve’s remembrance of the object does not immediately evaporate even if the object is eliminated but is rather “retained” over a specific timeframe. This phenomenon is recognized as “visual persistence” [27]. A commonplace example of this is the observation of a falling feather. Even though the feather descends over a relatively brief period, it imprints a lingering image of the feather’s fall on the observer’s retina. Animation operates on this principle. For instance, in the animation under discussion, flashing valves were simulated. The underlying principle incorporates alternating imagery every five frames, creating an impression of a flashing valve, as depicted in Figure 3.
2.2. Research Method
2.2.1. Preparations before Production
Before embarking on the construction of the animation, our initial decision centered on selecting a cyclic operational method for a six-column Pressure Swing Adsorption (PSA) system. Our choice fell on the six-column twelve-step cycle, primarily due to its prevalent reporting and wide-ranging implementation in extant literature. This method was identified as the principal sequence for our animation production, given its continuous examination in our tests. Subsequently, we subjected our laboratory’s PSA apparatus to debugging in order to evaluate its functional condition. Upon verifying the apparatus’s operability, we introduced gas via the industrial control system, devoting our attention to documenting and scrutinizing pressure variations in each column and the valve’s activation and deactivation.
A foundational understanding of pressure dynamics during Pressure Swing Adsorption is essential for animators working in this domain. Our analysis of relevant PSA literature and experimental validations within laboratory settings led to the development of Figure 4. This diagram succinctly encapsulates the pressure variations observed following the four principal steps performed by a single-column PSA device. The design inspiration for this figure was drawn from a study conducted by Chung et al. [28]. In the figure, ‘T’ signifies time, while ‘P’ represents pressure.
The temporal sequence of the six-column twelve-step pressure swing adsorption is itemized in Table 1. In this table, ‘Ad’ denotes adsorption, ‘EnR(n = 1 or 2 or 3)’ is representative of equalization rise, ‘EnD(n = 1 or 2 or 3)’ indicates equalization drop, ‘PP’ specifies purge pressurization, ‘P’ implies purge, ‘D’ stands for depressurization, and ‘FR’ embodies the final repressurization. This tabular presentation effectively delineates the activities transpiring concurrently within each tower during a similar time frame. Following the completion of the twelfth step, the device will commence a new cycle from the initial step should it continue to receive a gas intake. Viewed from within Tower A, a complete cycle unfolds as follows: “Adsorption (Ad)–Equalization Drop (E1D-E2D-E3D)–Purge Pressurization (PP)–Depressurization (D)–Purge (P)–Equalization Rise (E1R-E2R-E3R)–Final Repressurization (FR)–Re-adsorption (Ad)–…,” proceeding until the cycle concludes with the achievement of gas purification.
Figure 5 presents a schematic drafted in accordance with a six-tower laboratory configuration, a crucial component of the animation. As discernible from the schematic, each tower is equipped with three pipelines at the top. The central pipeline functions as the product gas outlet, while the twin branch pipelines enable intercommunication between every pair of adsorption towers. At the base, one pipeline operates as the air inlet, with the other serving as the waste gas outlet. In the actual device, these five pipelines operate independently. At each junction of the pipeline and tower, an electromagnetic valve is installed, totaling thirty valves for the six adsorption towers. The variations in pressure in each tower during gas intake into the pressure swing adsorption device are regulated by manipulating these valves. Thus, gaining a thorough understanding of the operation of these valves at each stage is a complex task that requires particular consideration, especially for novices.
The animation was developed utilizing Adobe Animate, a creative software that traces its lineage to Adobe Flash. Despite the discontinuation of Flash, its design platform persists in providing operational functionality to users. Moreover, it retains the capability to export the resulting animation in a video format compatible with various playback options.
2.2.2. Preparations Steps in Production
Initially, in an intricate undertaking such as this, it becomes imperative to stipulate the frame distribution for each significant demonstration segment. Should the transition between frames transpire too slowly, the animation’s dynamic effect could be compromised. Conversely, an overly rapid transition could render the sequence of events incomprehensible to the observer. To counter this, we sought a reasonable temporal scale for the animation, using actual experiments as reference points. After thorough discussion and multiple tests, we have established that the animation’s FPS (Frames per Second) is 12 s. We have also compiled a timetable of the key information presented in the animation, as shown in Table 2.
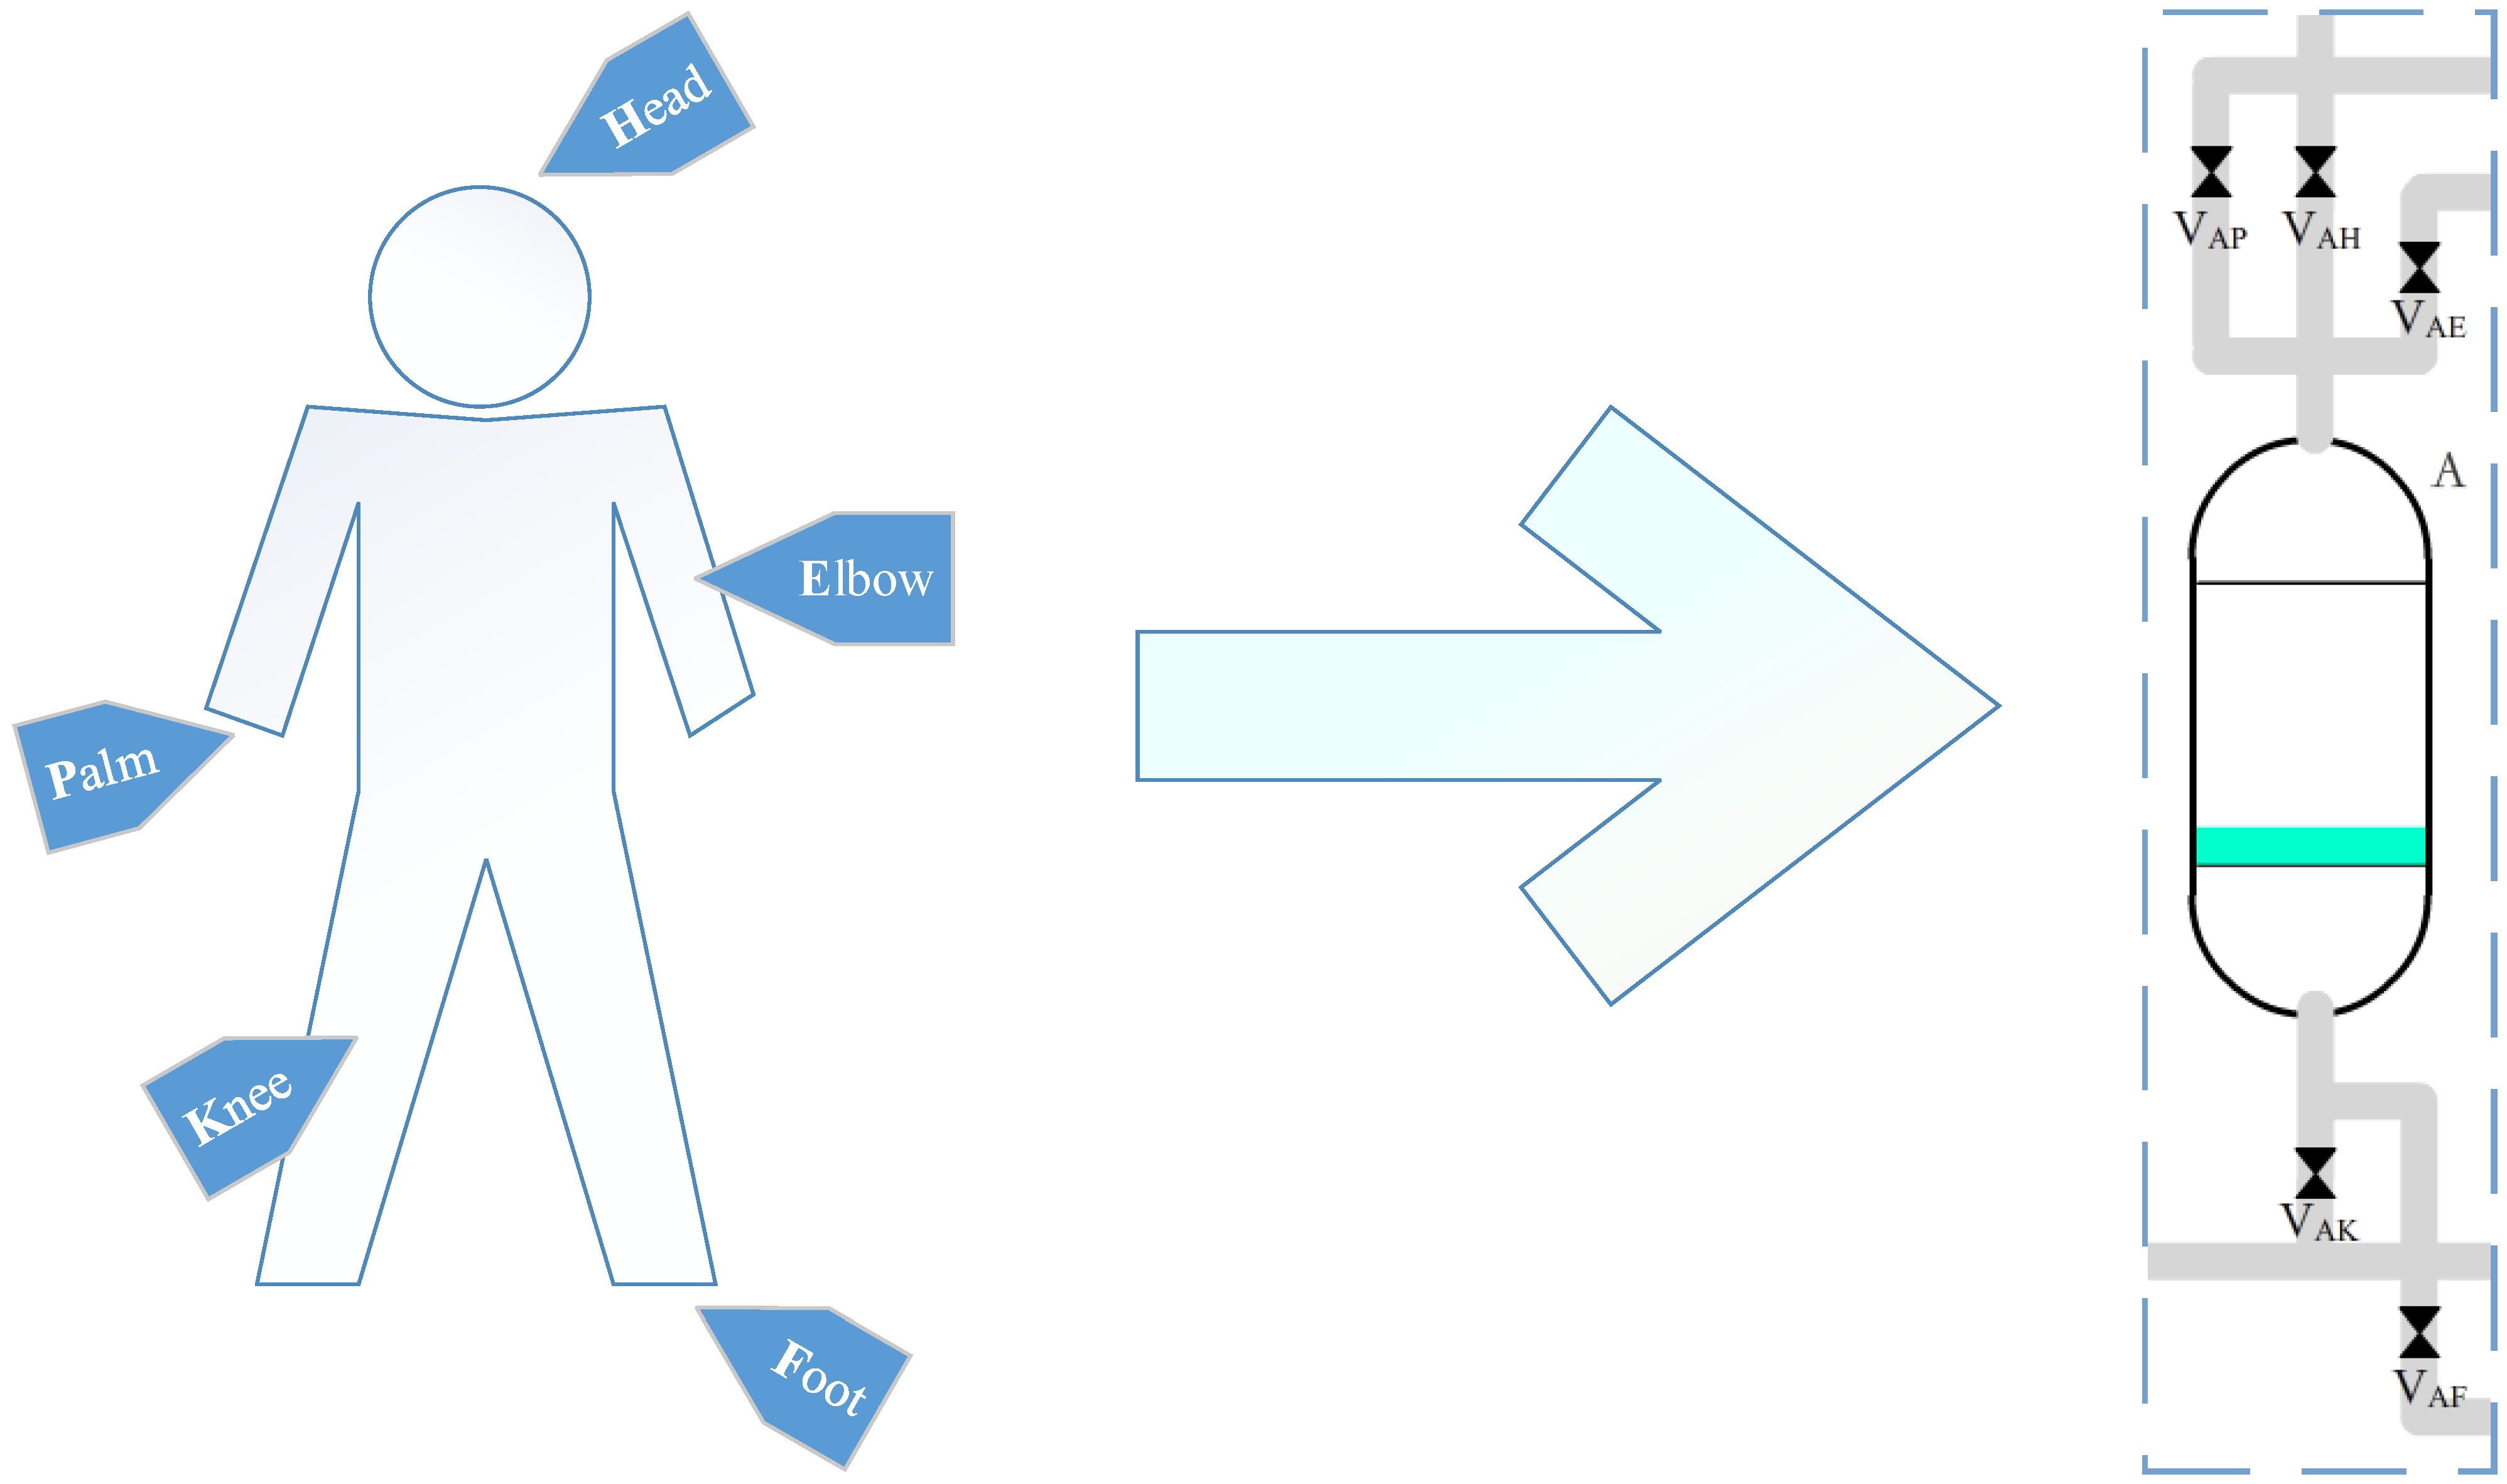
The process of animating the valve switches at each stage is both intricate and pivotal. Through practical application, we discerned a particular pattern to the opening and closing of the valves. For instance, consider Tower A; if a branch pipe valve of Tower A is opened within a step’s duration, only one corresponding branch pipe valve in the other five towers will be open concurrently. This arrangement facilitates an unobstructed connection between Tower A and another tower. As such, this study proposes a novel methodology for valve nomenclature, as depicted in Figure 6. Using Tower A as an illustrative example, it is associated with five valves. We liken Tower A to a human body for the purpose of assigning valve names. Above Tower A are three pipes; the valve connecting the product gas outlet pipe to Tower A is termed as A’s ‘head valve’. The valve on the branch pipe located furthest from Tower A is designated as A’s ‘palm valve’, while the closer one is named A’s ‘elbow valve’. Below Tower A, two pipes exist; the valve that links the air intake pipe to Tower A is referred to as A’s ‘knee valve’, and the valve on the waste gas outlet pipe is denominated as A’s ‘foot valve’. This system of nomenclature is consistently applied to the remaining five towers and is presented in frames 1–5 of the animation.
In the conventional nomenclature of pressure swing adsorption valves, ascending numerical identifiers are customarily utilized. However, as underscored in numerous academic articles, this prevailing method of valve identification lacks a standard system, resulting in potential confounders for novices due to the inconsistency in numbering, which may proceed either top-to-bottom or bottom-to-top. In a bid to surmount this impediment, we have devised a valve nomenclature that enhances learnability and memorization for beginners. Anchored on this nomenclature, a valve switching sequence chart was constructed, delineated in Table 3. In this table, “Op” denotes the act of opening the valve, “Cl” implies closing the valve, while “T” is representative of the time each valve operation (open or close) occurs, commencing from the initial valve opening.
Moreover, the table embodies an adjusted alphabetical arrangement to ensure that the sequence of all ‘Op’ columns, when perused from left to right, correlates with the gas flow direction within the tower. For instance, under the column tagged “palm” at T = 0, the valves tagged “FB” are open, suggesting not only that the hand valves of F and B are simultaneously opened but also that the gas flow direction proceeds from tower F to B.
3. Results
Subsequent to our rigorous investigation, our research collective has synthesized an animation encapsulating 1400 frames at an FPS (Frames per Second) rate of 12, translated into .WMV format, lasting for a duration of 1 min and 47 s.
Prior to delving into the intricacies of the video, it is essential to elucidate two deliberate alterations that, albeit incongruent with reality, are necessitated by the nature of the animation:
Firstly, in order to render the valve switch more discernible for viewers, the duration of the animation depicting valve opening and closing has been substantially elongated, relative to real-world circumstances. Under typical network signal conditions in actual testing, the response time of the solenoid valve switch is instantaneous.
Secondly, to aid in comprehension of the adsorption and desorption mechanisms of the adsorbent, the animation employs fluctuations in rectangle height as a visual representation. This creative liberty is designed to facilitate understanding of the pressure changes occurring within the tower.
Following, we present a series of screenshots (Figure 7) to depict pivotal frames from the animation.
The initial frame (frame = 1) of the animation provides a comprehensive visualization of the starting point of the animation sequence. It exhibits all valve denominations within the system which subsequently dissipate gradually from frame 1 through 5. The animation’s title, ‘A Demonstration Animation of Six-Tower Pressure Swing Adsorption’, is placed at the upper-left corner. To present an intuitive comprehension of the procedural progress, a clock diagram for the pressure swing adsorption process has been designed and positioned in the middle-left of the screen. The twelve-step process inherent to the six-tower pressure swing adsorption, akin to the twelve markings of a traditional clock face, served as an allegorical impetus behind this design. The dynamic nature of the animation is reflected as the clock’s hand advances concurrently with the progression of steps. The clock face is partitioned into twelve equal segments, as demonstrated in the diagram. The hand’s position within a given sector indicates the corresponding step’s progress. The transition of the clock hand from one sector to the next represents the completion of the preceding step and the initiation of the succeeding one in the pressure swing adsorption process.
The animation’s snapshot at frame = 245, illustrated by the Tower A example, portrays that the adsorbent in Tower A has reached its saturation point and is primed to proceed towards depressurization.
The animation frame at 330 corresponds to a specific juncture in the third phase of the six-tower pressure swing adsorption process. The directional flow of the gas is distinctly demonstrated in this animation. We have designed three different combinations to represent the trio of gas pathway types. Pressure alterations are symbolized with a ‘P’ sign accompanied by either an upward or downward arrow. The term ‘in the loop’, displayed below ‘P’, denotes the pressure fluctuations occurring post the device’s cycle initiation, indicating that no pressure changes occur during the device’s initial operation. If two towers within the animation are displayed on the same horizontal plane of ‘P’, it suggests the gas’s transference between those towers. We have incorporated a visual depiction of ‘purging’ by enabling it to descend from the apex, pause midway within the tower for a brief period, and then continue its descent before gradually vanishing.
The still image captured at frame = 1345 from the animation signifies the conclusion of the first cycle (comprising 12 steps) within the six-tower device. Should the supply of gas remain consistent, and providing the equipment continues to receive this feed, the valves will revert to their initial state, thus resuming the cycle until such time as the feed is discontinued.
4. Conclusions and Future Work
The animation under consideration delivers an explicit and accessible demonstration of the operating process, encompassing a cycle of twelve steps, within a six-tower pressure swing adsorption apparatus. The manuscript provides an insightful explanation regarding the valve switching during the cycle of pressure swing adsorption, a feature which notably facilitates newcomers’ comprehension of the basic functioning of the six-tower pressure swing adsorption device. This significantly contributes to the advancement of the pressure swing adsorption industry. Notwithstanding the benefits, there exist certain limitations within the animation that warrant improvement. For instance, the demonstration of the twelve-step process within the six-tower pressure swing adsorption system is relatively monotonous. Furthermore, the changes experienced by the adsorbent within the tower are insufficiently conspicuous during the animation. In forthcoming endeavors, we aim to further develop and refine animations depicting the six-tower PSA process, undertaking a comparative analysis of the design elements between six-tower configurations and other setups, such as four-tower and five-tower systems. This strategy is anticipated to streamline the production of animations for alternate tower configurations, thereby extending the utility of this animation series to a wider array of teams engaged in Pressure Swing Adsorption. Noting a discernible gap in viewer engagement with our current animation videos, we are considering the introduction of interactive elements in future iterations. Potential avenues include the development of interactive software, employing programming codes to incorporate the animations, or leveraging internet technology to convert the animations into interactive videos. Such interactive videos are poised to provide a more engaging and immersive experience for viewers.
At this stage of animation technology development, it would be myopic to confine its application to the creation of children’s cartoons. Animation production technology is a powerful tool that can effectively illustrate complex theories and processes in a visually engaging and innovative way, thereby enriching the learning experience. Indeed, every profession encompasses elements of complex knowledge; hence, the integration of animation production across various industries, particularly in the training of newcomers, should prove immensely beneficial. It is anticipated that with the increasing accessibility of computer technology and advancements in software, a greater number of industries will adopt animation production to facilitate their growth and development.
Author Contributions
Conceptualization, H.X.; methodology, H.X.; software, H.X; validation, H.X. and L.Z.; investigation, H.X. and L.Z.; resources, G.L.; data curation, L.Z.; writing—original draft preparation, H.X.; writing—review and editing, H.X. and L.Z.; visualization, H.X.; supervision, G.L.; project administration, G.L.; funding acquisition, G.L. All authors have read and agreed to the published version of the manuscript.
Funding
This research was funded by the Foreign Science and Technology Co-operation Project of the Department of Science and Technology of Anhui Province, China, grant number 1604b0602023.
Data Availability Statement
All data generated in this study are included in this article.
Conflicts of Interest
None of the authors have a conflict of interest to disclose.
References
- Shigaki, N.; Mogi, Y.; Kijima, H.; Kakiuchi, T.; Yajima, T.; Kawajiri, Y. Performance evaluation of gas fraction vacuum pressure swing adsorption for CO2 capture and utilization process. Int. J. Greenh. Gas. Con. 2022, 120, 103763. [Google Scholar] [CrossRef]
- Song, Q. Development and Prospect of Pressure Swing Adsorption (PSA) Technology for Carbon Dioxide Separation and Capture. Int. J. Trend Res. Dev. 2024, 11, 19–24. [Google Scholar]
- Kim, J.; Son, M.; Sup, H.S.; Yoon, Y.-S.; Oh, H. Computational-cost-efficient surrogate model of vacuum pressure swing adsorption for CO separation process optimization. Sep. Purif. Technol. 2022, 300, 121827. [Google Scholar] [CrossRef]
- Martins, M.A.F.; Rodrigues, A.E.; Loureiro, J.M.; Ribeiro, A.M.; Nogueira, I.B.R. Handling model uncertainty in control of a pressure swing adsorption unit for syngas purification: A multi-model zone control scheme-based robust model predictive control strategy. Sep. Purif. Technol. 2023, 306, 122668. [Google Scholar] [CrossRef]
- Aysolmaz, B.; Reijers, H.A. Animation as a dynamic visualization technique for improving process model comprehension. Inform. Manage-Amster. 2021, 58, 103478. [Google Scholar] [CrossRef]
- Bernhard, P.; Monique, M. A survey of medical animations. Comput. Graph-UK 2022, 107, 304–328. [Google Scholar]
- Mohammad, A.M.; Masoud, M.; Benyamin, J.; Chang-Ha, L. Simulation and analysis of vacuum pressure swing adsorption using the differential quadrature method. Comput. Chem. Eng. 2019, 121, 483–496. [Google Scholar]
- Ramos-Martinez, M.; Torres-Cantero, C.A.; Ortiz-Torres, G.; Sorcia-Vázquez, F.D.J.; Avila-George, H.; Lozoya-Ponce, R.E.; Vargas-Méndez, R.A.; Renteria-Vargas, E.M.; Rumbo-Morales, J.Y. Control for Bioethanol Production in a Pressure Swing Adsorption Process Using an Artificial Neural Network. Mathematics 2023, 11, 3967. [Google Scholar] [CrossRef]
- Hense, J.; Bachmann, M.; Polte, L.; Aßen, N.; Jupke, A. Integrated Process Design and Life Cycle Assessment of Carbon Monoxide Provision from Basic Oxygen Furnace Gas. Chemie. Ingenieur. Technik. 2022, 94, 1524–1535. [Google Scholar] [CrossRef]
- Arya, S.; Xiang, T.; Tang, G.H.; Pavenski, K. Including the patient in patient blood management: Development and assessment of an educational animation tool. Transfusion 2023, 63, 1488–1494. [Google Scholar]
- Sharmin, N.; Carbonaro, M.; Chow, A.K. Whiteboard animation simulation for dental education. J. Dent. Educ. 2023, 87, 1844–1847. [Google Scholar] [CrossRef] [PubMed]
- Chen, M.; Yang, Y.; Gao, C.; Cheng, Y.; Wang, J.; Wang, N. Investigation of the fractal characteristics of adsorption-pores and their impact on the methane adsorption capacity of various rank coals via N2 and H2O adsorption methods. Energy Sci. Eng. 2020, 8, 3228–3243. [Google Scholar] [CrossRef]
- Yang, R.T. Gas Separation by Adsorption Processes, 1st ed.; Imperial College Press: London, UK, 1997; pp. 1–45. [Google Scholar]
- Dias, R.O.M.; Nogueira, I.B.R.; Ferreira, A.F.P.; Rodrigues, A.E.; Ribeiro, A.M. A performance indicator for the screening of adsorbent/desorbent pairs for gas-phase simulated moving bed applications. AIChE J. 2023, 69, e18074. [Google Scholar] [CrossRef]
- Liang, D.; Hu, Y.; Bao, Q.; Zhang, J.; Sun, P.; Feng, J.; Xu, M.; Zhang, H. Study of RHO zeolite with different cations for CO2/CO separation in pressure swing adsorption. Micro Nano Lett. 2021, 16, 319–326. [Google Scholar] [CrossRef]
- Tien, C. Adsorption Calculations and Modeling, 1st ed.; Butterworth-Heinemann: Newton, MA, USA, 1994; pp. 15–69. [Google Scholar]
- Al-Janabi, N.; Vakili, R.; Kalumpasut, P.; Gorgojo, P.; Siperstein, F.R.; Fan, X.; McCloskey, P. Velocity variation effect in fixed bed columns: A case study of CO2 capture using porous solid adsorbents. AIChE J. 2018, 64, 2189–2197. [Google Scholar] [CrossRef]
- Hu, G.; Xiao, G.; Guo, Y.; Manning, M.; Chen, L.; Yu, L.; Li, K.G.; May, E.F. Separation of methane and nitrogen using ionic liquidic zeolites by pressure vacuum swing adsorption. AIChE J. 2022, 68, e17668. [Google Scholar] [CrossRef]
- Bahrun, M.H.V.; Bono, A.; Othman, N.; Zaini, M.A.A. Carbon dioxide removal from biogas through pressure swing adsorption—A review. Chem. Eng. Res. Des. 2022, 183, 285–306. [Google Scholar] [CrossRef]
- Bittorf, L.; Böttger, N.; Neumann, D.; Winter, A.; Kockmann, N. Characterization of an Automated Spinning-Band Column as a Module for Laboratory Distillation. Chem. Eng. Technol. 2021, 44, 1660–1667. [Google Scholar] [CrossRef]
- Angadi, S.V.; Jackson, R.L. A critical review on the solenoid valve reliability, performance and remaining useful life including its industrial applications. Eng. Fail. Anal. 2022, 136, 106231. [Google Scholar] [CrossRef]
- Figueroa, S.J.A.; Beniz, D.B.; Mauricio, J.C.; Piton, J.R.; Parry, S.A.; Cibin, G. Steps towards XAFS beamline automation and remote access. J. Synchrotron Radiat. 2018, 25, 953–959. [Google Scholar] [CrossRef]
- Zheng, Y.; Zhou, Z.; Dai, R. Simulation and optimisation design of the solenoid valve. J. Eng. 2019, 2019, 8701–8705. [Google Scholar] [CrossRef]
- Yang, Z.; Wang, S.; Hon, J.; Li, J. Analysis of electromagnetic exciting force and vibration of rotating armature permanent magnet synchronous motor. J. Eng. 2018, 2018, 1903–1908. [Google Scholar] [CrossRef]
- Lin, H.; Lu, J.; Abed, A.M.; Nag, K.; Fayed, M.; Deifalla, A.; Bin, M.A.S.; Galal, A.M. Simulation of CO2 capture from natural gas by cyclic pressure swing adsorption process using activated carbon. Chemosphere 2023, 329, 138583. [Google Scholar] [CrossRef] [PubMed]
- Wilkes, M.D.; Brown, S. Flexible CO2 capture for open-cycle gas turbines via vacuum-pressure swing adsorption: A model-based assessment. Energy 2022, 250, 123805. [Google Scholar] [CrossRef]
- Elizabeth, S.; Rolf, N. Saccadic Persistence of Vision: Horizontal, Vertical and Oblique Saccades. J. Vision 2022, 22, 3611. [Google Scholar]
- Chung, W.; Kim, J.; Lee, J.H. First-principles based surrogate modeling of pressure swing adsorption processes for CO2 capture. IFAC-PapersOnLine 2022, 55, 310–315. [Google Scholar] [CrossRef]
Figure 1.
Physical model of the six-tower Pressure Swing Adsorption device.

Figure 2.
A conceptual diagram delineating the principal stages of the Pressure Swing Adsorption process.
Figure 2.
A conceptual diagram delineating the principal stages of the Pressure Swing Adsorption process.

Figure 3.
Schematic illustration of the blinking valve in the animation.

Figure 4.
Schematic illustration of pressure change in Pressure Swing Adsorption.

Figure 5.
Schematic illustration of six-tower Pressure Swing Adsorption Equipment.

Figure 6.
A new method of valve nomenclature.

Figure 7.
Display of Significant Scenes in the Animation.


Table 1.
Sequence Table for Six-Tower, Twelve-Step Pressure Swing Adsorption.
| Step | Tower | |||||
|---|---|---|---|---|---|---|
| A | B | C | D | E | F | |
| 1 | Ad | E3R | E1R | D | E3D | E1D |
| 2 | FR | E2R | P | PP | E2D | |
| 3 | E1D | Ad | E3R | E1R | D | E3D |
| 4 | E2D | FR | E2R | P | PP | |
| 5 | E3D | E1D | Ad | E3R | E1R | D |
| 6 | PP | E2D | FR | E2R | P | |
| 7 | D | E3D | E1D | Ad | E3R | E1R |
| 8 | P | PP | E2D | FR | E2R | |
| 9 | E1R | D | E3D | E1D | Ad | E3R |
| 10 | E2R | P | PP | E2D | FR | |
| 11 | E3R | E1R | D | E3D | E1D | Ad |
| 12 | FR | E2R | P | PP | E2D | |
Table 2.
Timeline of key components’ occupancy in the animation.
| Key Component Name | Number of Frames | Occupancy Time (12 FPS) |
|---|---|---|
| Pressure change alert/flush alert | 40 | 3.3~3.4 s |
| Valve flashes open or closed | 25 | 2.1~2.2 s |
| Gas flow direction indication | 80 | 6.6~6.7 s |
| Each cycle | 105 | 8.7~8.8 s |
Table 3.
Sequence Table for Valve Operation.
| Time | Head | Palm | Elbow | Knee | Foot | |||||
|---|---|---|---|---|---|---|---|---|---|---|
| Op | Cl | Op | Cl | Op | Cl | Op | Cl | Op | Cl | |
| 0 | A | F | FB | E | EC | D | A | F | D | C |
| T | AB | FC | B | ED | C | A | D | |||
| 2T | B | A | FD | C | AC | DE | B | A | E | D |
| 3T | BC | AD | F | FE | AC | B | E | |||
| 4T | C | B | AE | D | BD | EF | C | B | F | E |
| 5T | CD | AF | E | BE | D | C | F | |||
| 6T | D | C | BF | A | CE | B | D | C | A | F |
| 7T | DE | CF | B | BA | CE | D | A | |||
| 8T | E | D | DF | C | CA | B | E | D | B | A |
| 9T | EF | DA | F | CB | A | E | B | |||
| 10T | F | E | EA | D | DB | C | F | E | C | B |
| 11T | FA | EB | A | DC | B | F | C | |||
Disclaimer/Publisher’s Note: The statements, opinions and data contained in all publications are solely those of the individual author(s) and contributor(s) and not of MDPI and/or the editor(s). MDPI and/or the editor(s) disclaim responsibility for any injury to people or property resulting from any ideas, methods, instructions or products referred to in the content. |
© 2024 by the authors. Licensee MDPI, Basel, Switzerland. This article is an open access article distributed under the terms and conditions of the Creative Commons Attribution (CC BY) license (https://creativecommons.org/licenses/by/4.0/).
Share and Cite
MDPI and ACS Style
Xu, H.; Li, G.; Zhang, L. Six-Tower Pressure Swing Adsorption Demonstration Animation. Processes 2024, 12, 836. https://0-doi-org.brum.beds.ac.uk/10.3390/pr12040836
AMA Style
Xu H, Li G, Zhang L. Six-Tower Pressure Swing Adsorption Demonstration Animation. Processes. 2024; 12(4):836. https://0-doi-org.brum.beds.ac.uk/10.3390/pr12040836
Chicago/Turabian StyleXu, Hancheng, Guangxue Li, and Luyao Zhang. 2024. "Six-Tower Pressure Swing Adsorption Demonstration Animation" Processes 12, no. 4: 836. https://0-doi-org.brum.beds.ac.uk/10.3390/pr12040836
Note that from the first issue of 2016, this journal uses article numbers instead of page numbers. See further details here.