1. Introduction
Chemerin, encoded by the retinoic acid receptor responder 2 (
RARRES2) gene, was identified in human inflammatory fluids as a natural ligand for the orphan G protein-coupled chemokine-like receptor 1 (CMKLR1), also known as chemR23 and now named chem1 [
1,
2]. It functions as a chemoattractant for leukocytes expressing chem1, such as plasmacytoid dendritic cells and natural killer cells. Two additional receptors bind chemerin with high affinity, chemokine receptor-like 2 (CCRL2) [
3,
4], and G protein-coupled receptor 1 (GPR1; chem2) [
5]. CCRL2 is not a signaling receptor and only binds chemerin, presenting it to its other receptors [
6]. In addition to its immune functions, chemerin is also an adipokine that regulates adipocyte development and metabolic functions such as glucose metabolism [
7,
8,
9,
10,
11] with both chem1 and chem2 implicated in that role [
12,
13]. Elevated levels of chemerin have been found in patients with diabetes [
14,
15] and fatty liver disease [
16,
17,
18]. Although chemerin levels in the blood are elevated in obese humans and rodents and chemerin may serve as a chemoattractant for various types of immune cells that contribute to adipose tissue inflammation commonly found with obesity, the relationship between obesity, insulin resistance, inflammation, and energy homeostasis in determining chemerin levels has not been defined [
19].
A hallmark of cardiometabolic syndrome is insulin resistance, in which chemerin has been implicated in mouse experiments by observation of deterioration of insulin tolerance and glucose tolerance in chemerin or chem2 deficient mice [
10,
12,
20,
21]. Chemerin stimulates insulin-dependent glucose uptake concomitant with the enhanced insulin signaling in adipocytes [
11]. In addition, chemerin drives differentiation of both white and brown adipose tissue in vitro and in vivo [
8,
20].
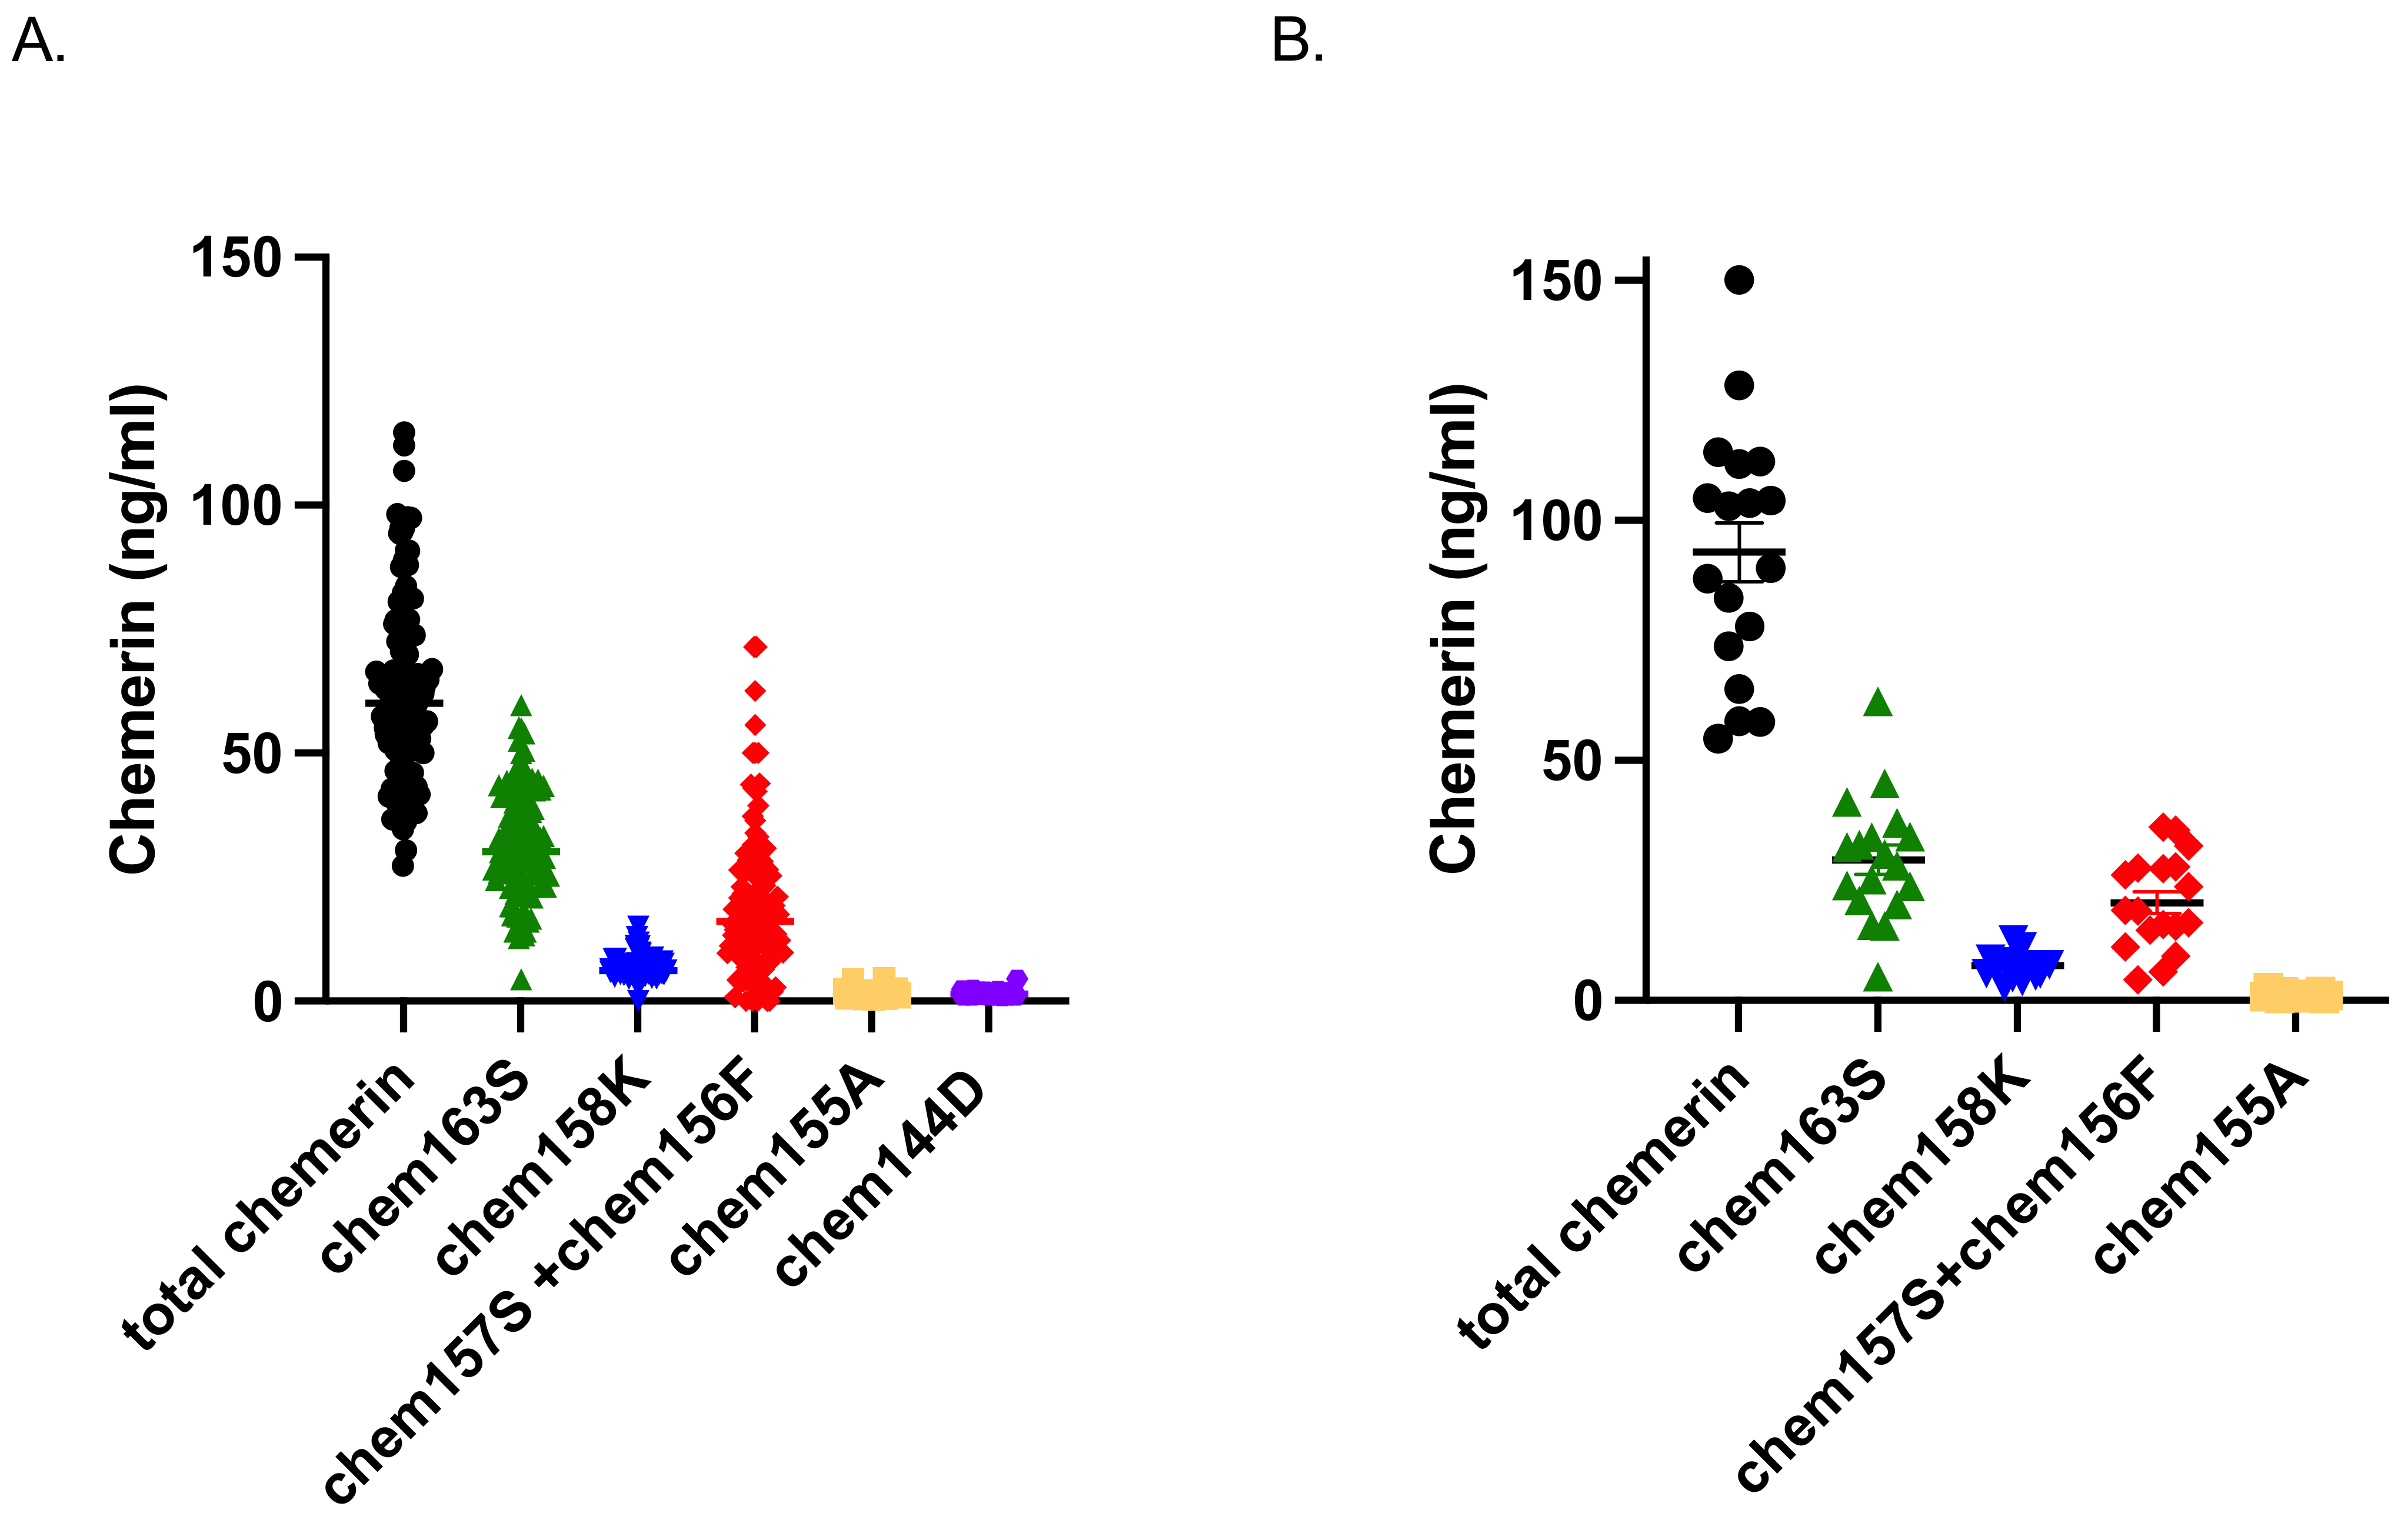
Chemerin is secreted from cells as a 143 amino acid protein with low activity named chem163S (different forms of chemerin are named for their C-terminal amino acid and residue number), that is subsequently enzymatically processed by serine proteases at its C-terminus to generate a partially active form, chem158K [
22]. Then the C-terminal amino acid is removed by plasma basic carboxypeptidases to produce the fully active forms, chem157S and chem156F, which can also be made directly by chymase cleavage of chem163S [
23,
24,
25]. Further proteolysis leads to chem155A and smaller forms such as chem144D that are inactive [
26]. The enzymes responsible for processing chemerin are members of the coagulation, fibrinolytic, and inflammatory systems. Chemerin’s C terminal sequence and its proteolytic cleavage sites are highly conserved between human and mouse, as well as in other mammalian species, with mouse chemerin undergoing extensive, dynamic, and tissue-specific proteolytic processing at homologous sites in vivo, similar to human chemerin [
27].
Blood samples contain a mix of these forms, with the levels of the different forms depending on the status of the person contributing the sample. Chemerin activation is detected in plasma and adipose tissues from people with obesity undergoing bariatric surgery, and further C-terminal processing occurs during the disposition of chemerin from adipose tissue, resulting in substantial levels of novel degraded forms in plasma that correlate with obesity [
26]. Chemerin levels are higher in patients with diabetes, especially those with diabetic complications such as diabetic nephropathy [
28,
29,
30].
Studies using techniques for the direct measurement of insulin action have demonstrated that insulin-stimulated glucose uptake varies several fold in apparently healthy individuals [
31,
32], and approximately one-third of these individuals are sufficiently IR to be at high risk of developing diabetes. Low-grade inflammation is a feature of individuals with either insulin resistance or diabetes and may contribute to the progression of diabetes [
33,
34]. A component of this inflammation is increased proteolysis, due to the secretion of enzymes and inactivation of proteolytic inhibitors, thereby leading to more cleavage of circulating cytokines, chemokines, and adipokines including chemerin [
23].
Insulin resistance is not routinely diagnosed because there are no routine simple tests available. The insulin suppression test is the gold standard but is complicated, expensive, and has low throughput. Simpler tests can be administered such as the oral glucose tolerance test in which a standard quantity of glucose is administered to a person and blood withdrawn over the next two to three hours for glucose testing; however, this test still requires significant time and expense. A simple blood test would enable people with insulin resistance to be diagnosed and treated.
Chemerin levels in blood have a positive correlation with BMI [
35,
36] but, to our knowledge, there have been no reports comparing the levels of different chemerin forms in individuals with diabetes and in those without diabetes with different degrees of insulin resistance. We hypothesized that, due to higher inflammation, chemerin levels would be higher and more chemerin activation would occur in individuals with diabetes than in those without diabetes. Furthermore, among individuals without diabetes, those who are IR would have higher levels of chemerin and more chemerin activation than those who are insulin sensitive. To test this hypothesis, we measured the levels of different forms of chemerin in individuals with diabetes and in those without diabetes divided into groups based on their degree of insulin resistance.
4. Discussion
Chemerin is secreted as a precursor (prochemerin) with low biological activity that terminates in humans at amino acid serine 163 (chem163S) [
23]. Prochemerin is converted into a full agonist for chem1 and chem2 by truncation of the last six amino acids at its C-terminus by proteases belonging to the coagulation, fibrinolytic, and inflammatory cascades [
41,
42,
43,
44]. The most active form of human chemerin, chem157S, can be generated either by direct cleavage of prochemerin by neutrophil-derived serine proteases (elastase or cathepsin G) or tissue-kallikrein [
45], or alternatively by sequential cleavages by clotting factor FXIa or by plasmin to form chem158K, which has modest activity, followed by the removal of the C-terminal lysine by carboxypeptidase N (CPN) or carboxypeptidase B2 (CPB2, also termed thrombin-activatable fibrinolysis inhibitor) producing chem157S [
43]. Chymase was shown to be capable of cleaving chem163S to chem156F, a form of chemerin partially active on chem1, which is more active than its precursor, chem163S, but very much less potent than chem157S on chem1 [
22,
24]. Further enzymatic proteolysis also inactivates bioactive chemerin. Neutrophil-derived protease 3, mast cell chymase [
46], and angiotensin-converting enzymes [
47] can all convert active chemerin into inactive derivatives including chem155A and smaller forms. Thus, precise proteolytic processing is a key regulatory mechanism that determines both systemic and local concentrations of bioactive chemerin. However, chemerin levels as measured by currently commercially available chemerin ELISAs do not distinguish between the various forms of active and inactive chemerin and have not been validated for their response to different chemerin forms. Both of these issues pose significant limitations in understanding the role of chemerin.
In a prospective cohort study, chemerin levels were found to predict the risk of cardiovascular disease independently of other risk factors, plus there was a strong positive association with T2D [
48]. High chemerin levels correlate with increased all-cause mortality, primarily via a raised risk of cancer [
49]. In patients with obesity, chemerin levels are increased and more activation of chemerin occurs [
7,
26,
50,
51]. Chemerin levels are also increased in patients with metabolic syndrome and both type 1 diabetes and T2D [
35,
52,
53,
54]. Diabetic kidney disease was associated with higher levels of serum chemerin [
55].
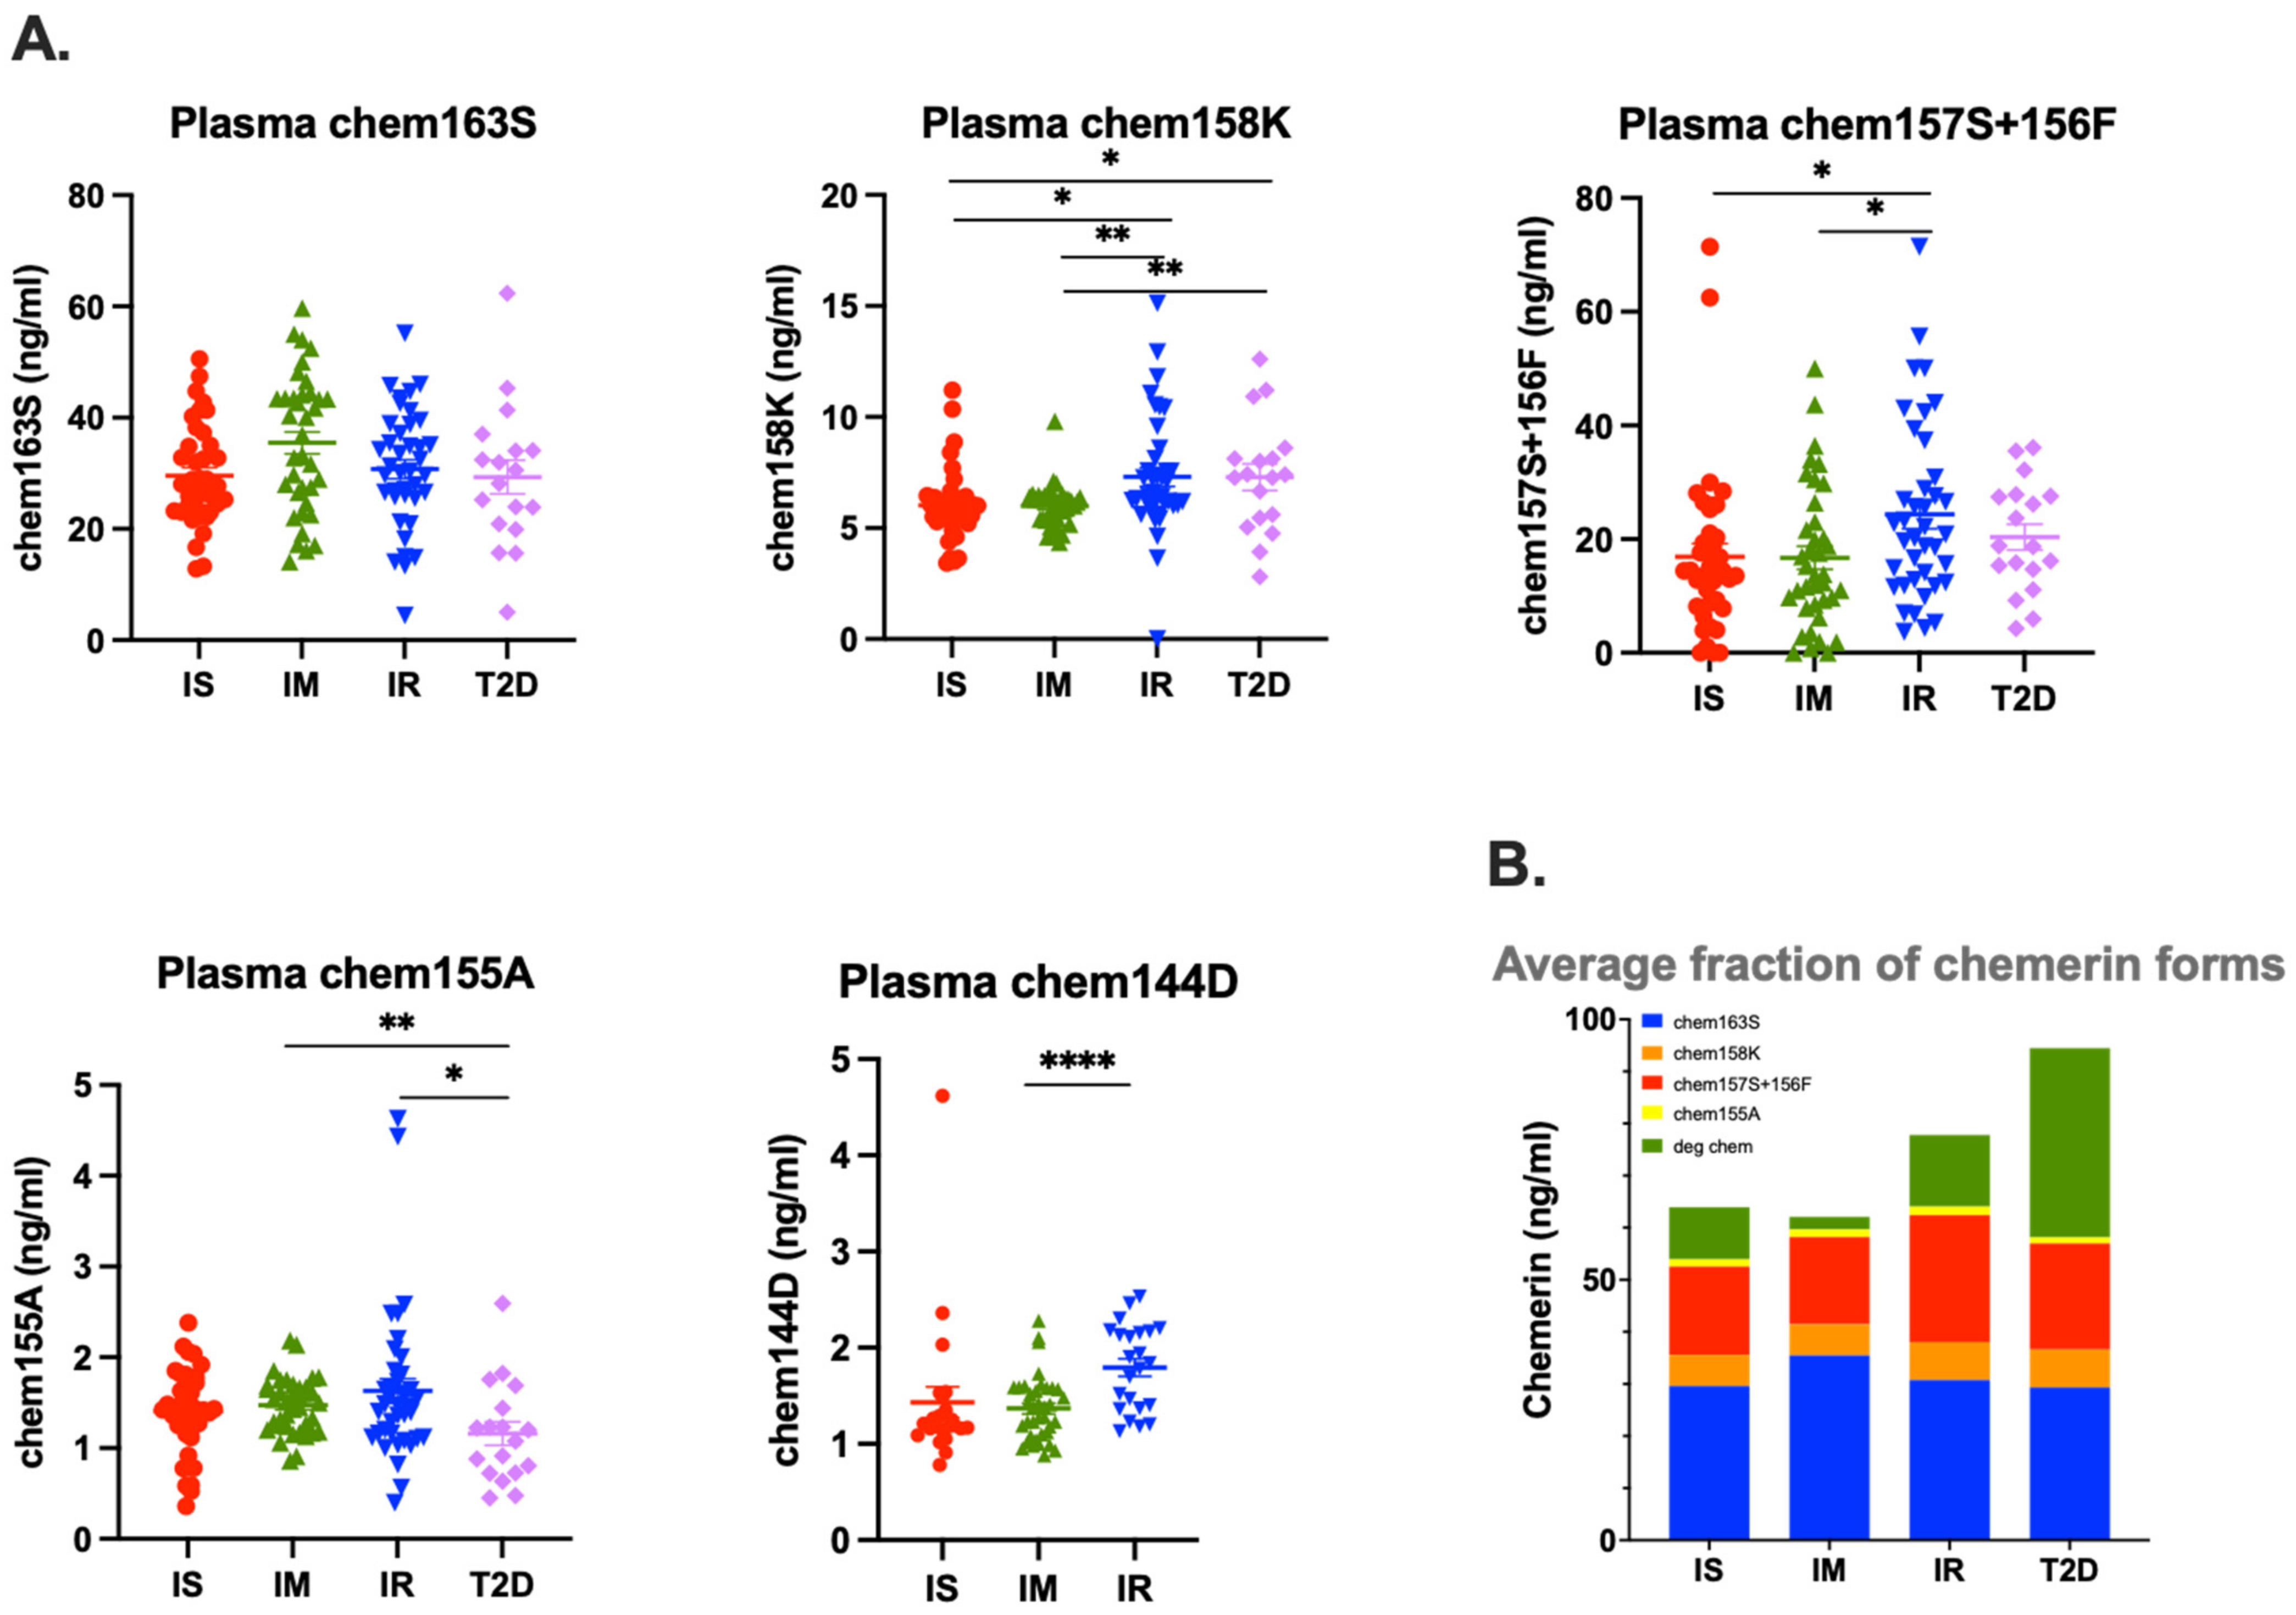
Circulating levels of chemerin are increased in patients with obesity undergoing bariatric surgery [
26], but that increase is not due to significant differences in levels of the precursor, chem163S. In this study, we found similar results in patients with insulin resistance and T2D with the total level of chemerin highest in the T2D group, and the second highest in the IR group, but the levels of chem163S were similar (
Figure 3 and
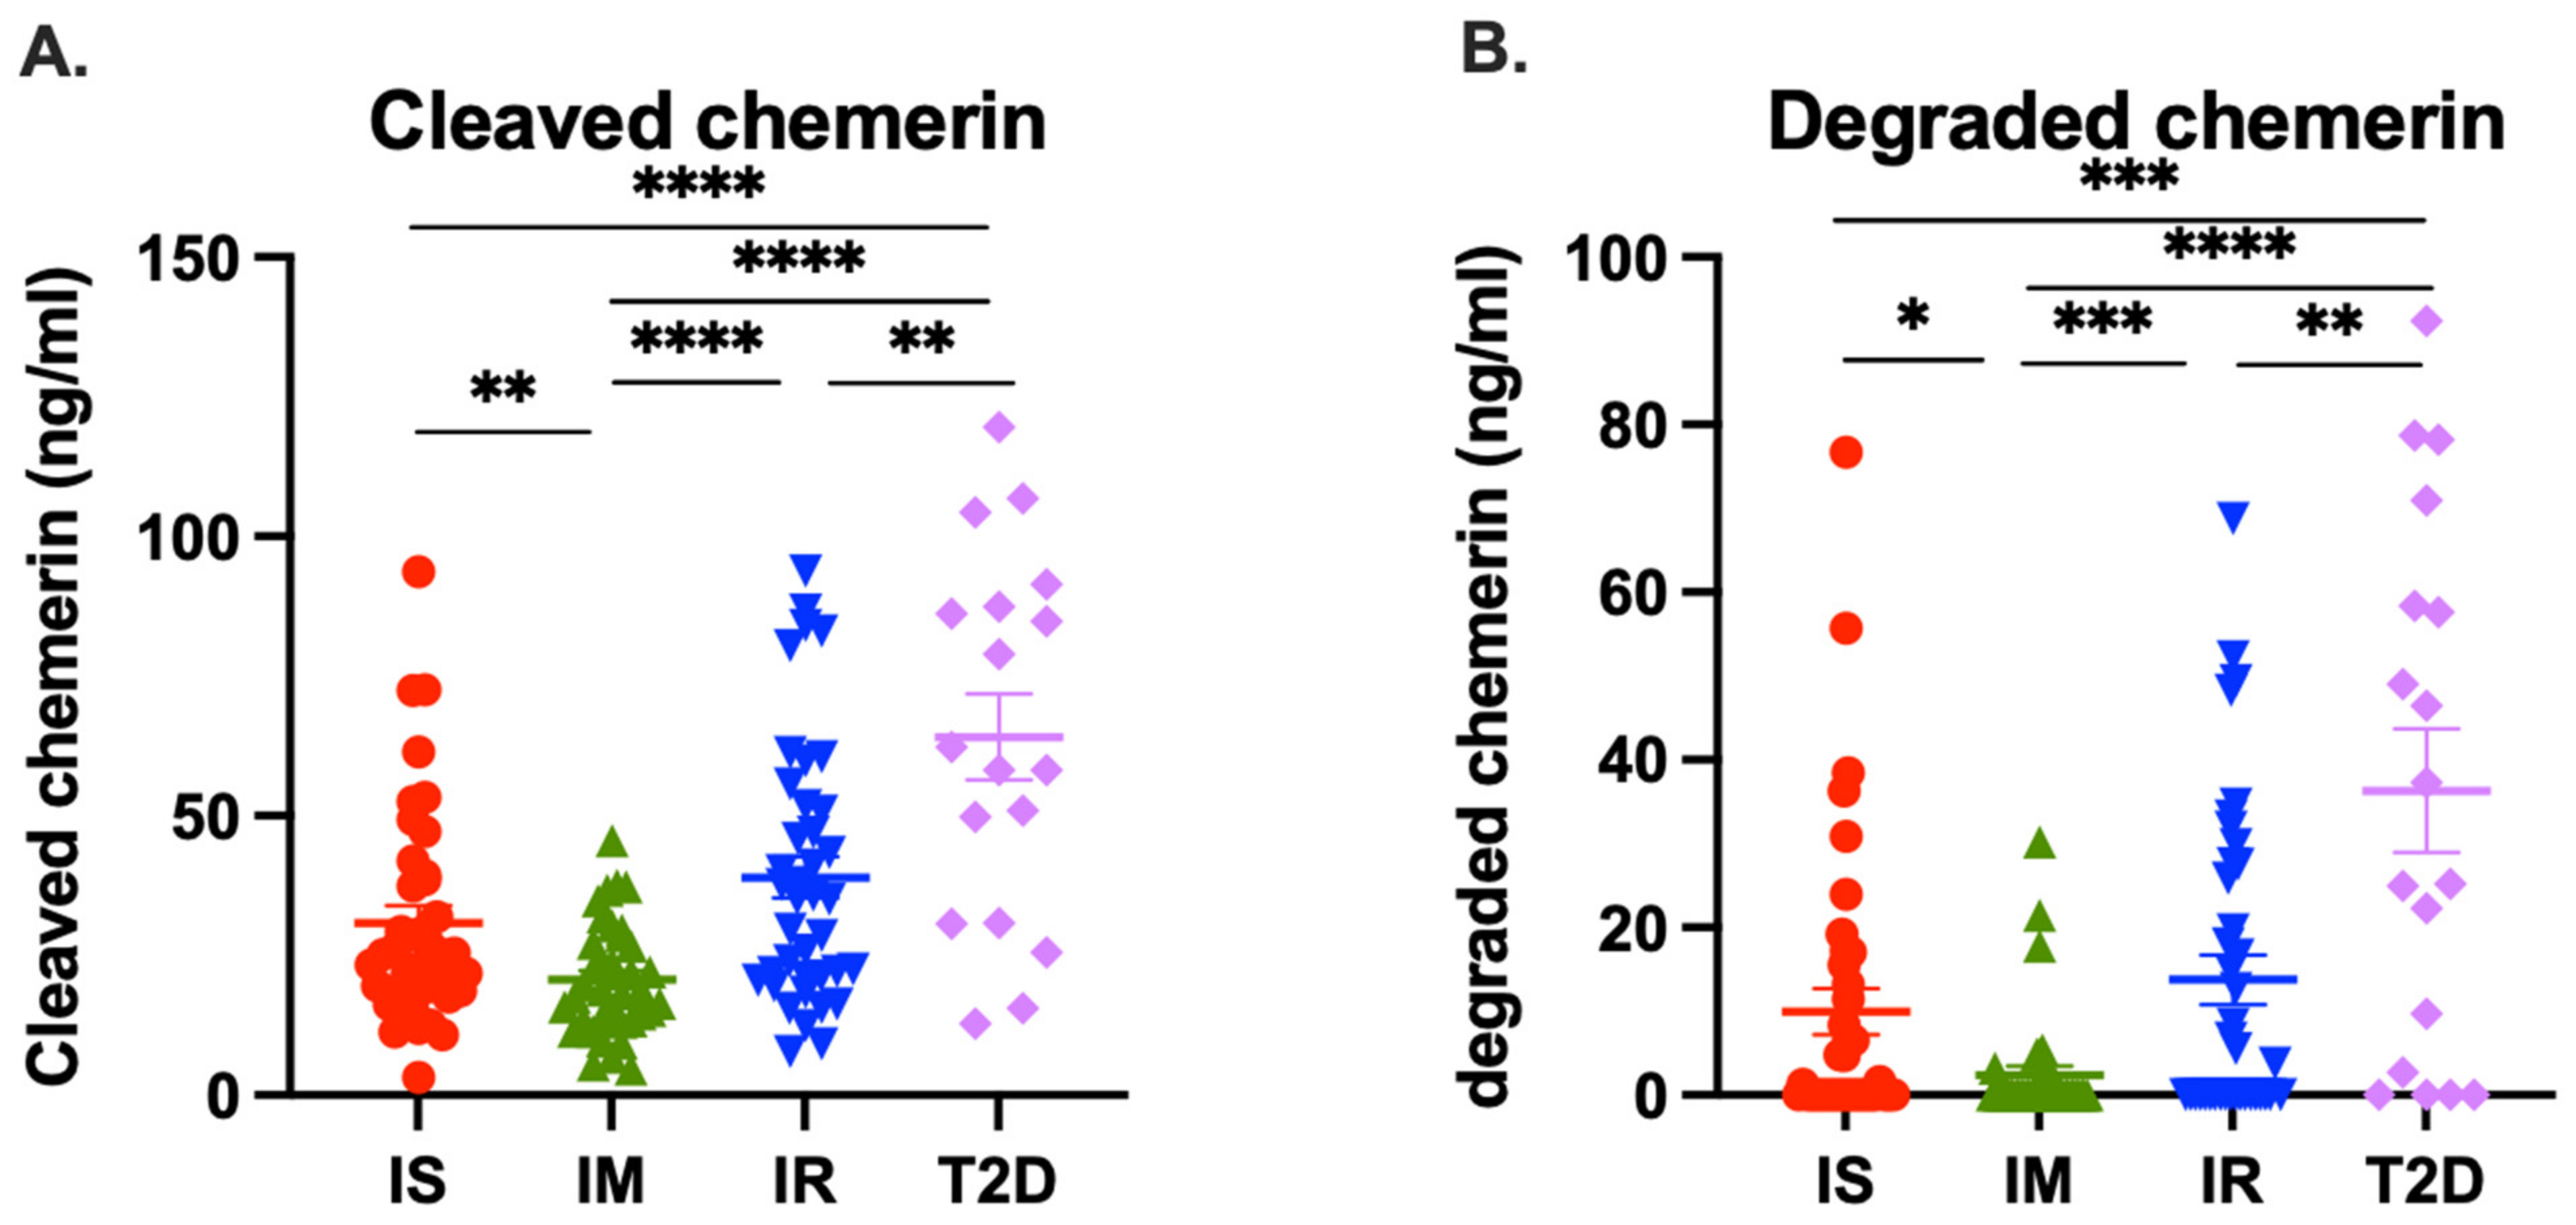
Figure 4A). This implies that the difference in total chemerin is due to increased levels of circulating chemerin that had been proteolytically cleaved. When we investigated the proteolytically cleaved forms, the T2D group had higher levels of them than the IR group and than either of the other two groups. In addition, the T2D and IR groups had increased levels of degraded chemerin. Taken together, these results suggest that there was more ongoing proteolysis in the T2D group, followed by IR group, than the IS or IM groups, probably due to the inflammation associated with the underlying diabetes confirming our original hypothesis [
56,
57]. These data are consistent with the hypothesis that an individual progresses from being insulin sensitive to IR and finally to overt T2D; the increased inflammation results in more production of chemerin as well as greater proteolysis of it [
58,
59].
To our knowledge, this is the first study on chemerin levels and forms that has used the IST, a direct method for quantifying the degree of insulin resistance [
60,
61]. Although the IST is the gold-standard for determining insulin resistance, the procedure is time-consuming, labor intensive, expensive, and, therefore, it is impractical to apply it in large epidemiological studies and burdensome in the clinical care setting.
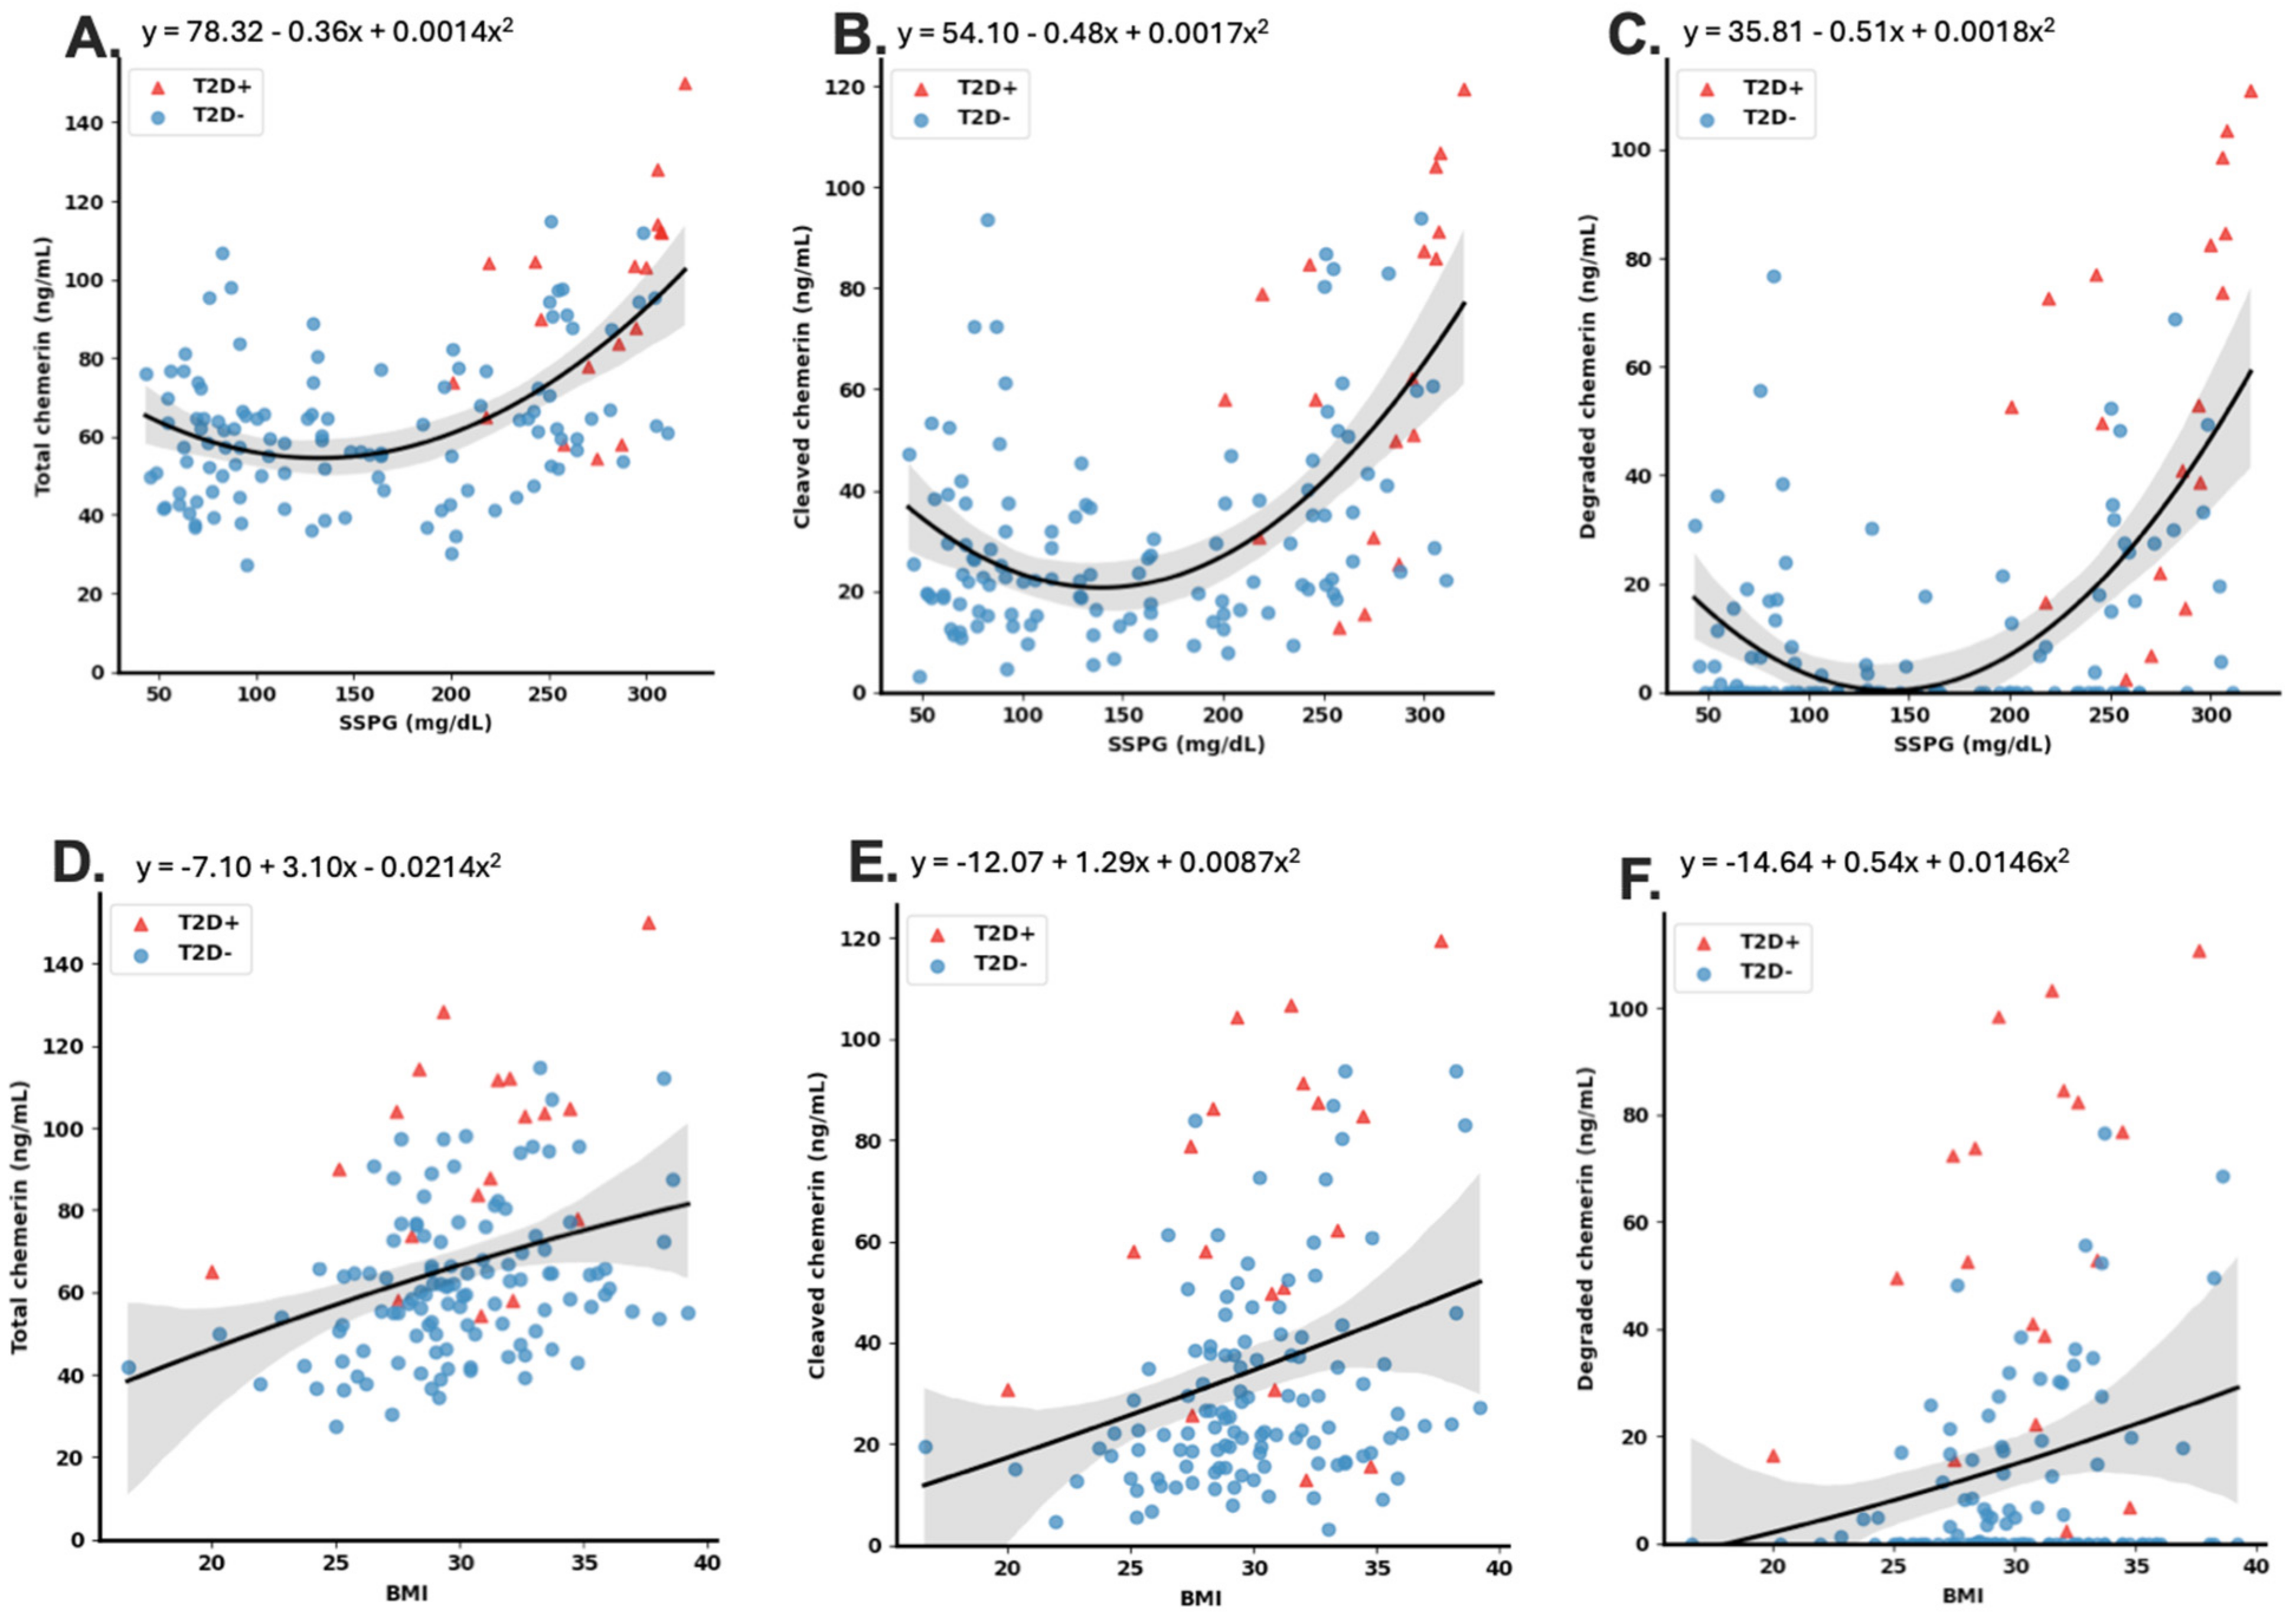
As obesity and insulin resistance are highly correlated [
62,
63], we also analyzed the effect of BMI on chemerin levels and processing. Analysis of the relationship of BMI with total cleaved and degraded chemerin levels showed that BMI also strongly influenced chemerin levels, and multivariate analysis suggested that BMI is a confounder for the association of total cleaved and degraded chemerin levels with SSPG concentration. This probably represents a single metabolic dysfunction influencing chemerin levels and cleavage. Insulin resistance causes an inflammatory state in which the innate immune system is activated [
64]. Both liver and adipose tissue respond to insulin resistance and obesity by increasing chemerin production and, in the case of adipose tissue, its activation [
26,
65,
66]. The association of total cleaved and degraded chemerin levels with glucose levels and BMI could result from chemerin modulating energy metabolism, energy metabolism regulating chemerin, or both being affected by a third factor.
Chemerin is key in both obesity and insulin resistance in chemerin deficient mice, but the available data do not delineate the mechanistic relationship between chemerin, obesity, and insulin resistance [
10,
20,
21,
67]. This is supported by data from mice that are deficient in one of the two signaling chemerin receptors, chem1 or chem2 [
19,
68]. Chem1 deficiency, however, did not affect insulin resistance in one report, but elsewhere the data show that insulin resistance and obesity are affected by chem1 [
19,
68,
69]. Obese chem2 deficient mice develop worse insulin resistance than WT mice showing the critical role of chem2 [
12]. To our knowledge, none of these models has explored the relationship between the various factors under investigation. Thus, all three of the causative models are consistent with the currently available murine in vivo data. In addition, there may be further feedback loops between glucose, weight gain, and chemerin metabolism.
The data presented here suggest that in this cohort of participants without T2D the use of chemerin levels can contribute to improved diagnosis of insulin resistance. Although data are presented on differences in levels of several of the chemerin forms, the greatest improvement in diagnostic power was achieved with incorporating the levels of cleaved chemerin or degraded along with FPG and BMI. To determine cleaved chemerin, two ELISAs are needed, one for total chemerin and the other for prochemerin (chem163S). This combination offers the greatest improvement in diagnosis with the fewest assays. While incorporating the levels of total chemerin improves diagnostic power similarly, the fact that the increased level of chemerin is due to cleaved chemerin was not revealed. We investigated whether our best models perform differently in the different groups, and we found that the model was significantly more accurate for the IR and T2D groups than either the IS or IM group (
Table S2), indicating that chemerin measurements are correlated best with SSPG concentration when an individual is resistant to insulin.
Treatment of patients with obesity, insulin resistance, and T2D is rapidly changing with the introduction of glucagon-like peptide-1 (GLP-1) receptor agonist treatments such as liraglutide and semaglutide [
70,
71,
72]. To our knowledge, there have not been any studies investigating effects of these therapies on chemerin levels and activation. Chemerin expression in the liver and chemerin serum levels are reduced in a rat model of insulin resistance induced by a high fat diet when the animals are treated with liraglutide [
73]. This suggests that GLP-1 down-regulates chemerin. Conversely, chemerin may down-regulate GLP-1 expression and secretion [
74]. GLP-1 and chemerin also have opposing effects on macrophage polarization with GLP-1 promoting M2 formation and chemerin inhibiting it [
75,
76,
77]. Taken together, this suggests a mutual feedback control of GLP-1 and chemerin production which would have implications for overall control of energy balance and inflammation.
The next steps will be to increase the group size and to confirm these data in independent cohorts. In this study, we were unable to analyze the relationship with Hb A1c as the data were not available in the records of the determinations of SSPG concentration so that should also be included as the focus of future studies. Studies on chemerin levels and activation in patients treated with GLP-1 receptor agonists would be informative.
In summary, this study showed that T2D and IR individuals had increased levels of cleaved and degraded chemerin compared to individuals who were IS and IM and those measurements could be useful for understanding the cardiometabolic risk associated with T2D and insulin resistance.


 ,
, 


