Article

Evaluation of the Dynamic Amplification Factors of a Monorail Tourism Transit System Based on Probability Statistics

1
Department of Civil Engineering, Central South University, Changsha 410075, China
2
Zhuzhou CRRC Special Equipment Technology Co., Zhuzhou 412001, China
*
Author to whom correspondence should be addressed.
Submission received: 14 March 2024 / Revised: 10 April 2024 / Accepted: 16 April 2024 / Published: 18 April 2024
(This article belongs to the Special Issue Model and Simulation in Structural Engineering)

Abstract

:
The straddle monorail tourist transportation system (MTTS) has developed rapidly in recent years, and its structure is an elevated steel structure with a beam–column system, and the design is executed according to the Safety Code for Large Amusement Rides (GB 8408-2018). However, the impact coefficient value of this code is deemed partially unreasonable. Based on this, relying on the Seven Colors Yunnan Happy World project, the dynamic response test is carried out; using the finite element (FEM) software ANSYS (2021) and multibody dynamics (MBD) software SIMPACK (2021x) combined with the monorail unevenness spectra based on the measured monorail, the straddle monorail vehicle–bridge coupling vibration model is established, and mutual verification is carried out with the measured data. A continuous random variable probability model is adopted for the regularity study of impact coefficient samples, combined with probability statistics and the function fitting method to analyse the calculation results and derive the MTTS displacement impact coefficient calculation formula with beam span and driving speed as variables. The results show that the calculated values of the finite element model are in good agreement with the measured data, and the MTTS impact coefficients conform to the extreme value I-type distribution in the probability distribution law, which is inversely proportional to the span and is directly proportional to the traveling speed. Considering a multi-factor MTTS displacement impact coefficient fitting formula of high fit can better reflect the impact coefficient, monorail girder span, and train speed of the interrelationship for related research and design reference, in order to ensure safety and, at the same time, to improve the economy.

1. Introduction

In recent years, with the rapid development of tourism and increasing awareness of natural landscape protection, the monorail tour transit system (hereafter referred to as MTTS) has gradually become widely used. The system adopts a steel structure, and the whole line is erected by bridges without the need to build a special construction right-of-way; it adopts a power supply with a rail, which can effectively reduce noise pollution [1,2]. The advantages of traditional cross-seat urban transportation systems are borrowed by the MTTS, but there are some differences in the axle loads, structural parameters, technical parameters, and structural linear design [3,4,5]. For example, the MTTS adopts a lightweight steel girder and steel column structure, while the traditional urban transportation system generally adopts a prestressed concrete structure; the travel system belongs to the category of amusement rides, and its speed is slower than that of the traditional transportation system, with a maximum speed of no more than 40 km/h. The design provisions of conventional railroads and urban rail transit are not fully applicable to the MTTS. In the Safety Code for Large-scale Amusement Rides (GB8408-2018) implemented by this system, the regulations on dynamic amplification factors are not reasonable; when the speed is lower than 7.2 km/h, the dynamic effect of the load is not considered, and the design is biased towards insecurity. When the vehicle speed is greater than 20 km/h, the power amplification factor reaches 1.44, and designing according to these data will cause problems such as excessive structural safety reserves and increased construction costs.
There has been extensive research on the dynamic response of traditional urban transportation systems, and many scholars have achieved good results in vehicle–bridge coupled vibration. Shu et al. established a vehicle–bridge coupling analysis model by measuring the random traffic flow data of a continuous girder bridge and found that the dynamic amplification factors basically obeyed the extreme value type I distribution and obtained the impact coefficient spectra about the mass of the vehicle, the speed, and the irregularity of the roadway surface [6]. Wang et al. proposed a method based on vehicle–bridge coupled vibration to calculate the vibration dynamic amplification factors of various parts of large-span bridges more accurately and calculated and evaluated the remaining life of the bridges according to the minimum vibration dynamic amplification factors. Coefficients were used to calculate and evaluate the remaining life of the bridge based on the minimum vibration impact coefficient [7]. Cui et al. developed a coupled vehicle–bridge-system model that considered material corrosion, analysed the damage of rail road bridges under vehicle loading, and provided the recommended operating speeds for bridges with a span of 30 m and a span of 25 m. The model was used to calculate the vibration dynamic amplification factors of each part of large-span bridges more accurately [8]. Jiang et al. used a Nielsen system lifting basket arch bridge on the Ji qing high-speed railway line as the research object and analysed the influence of vehicle speed and track irregularity level on random vibration characteristics such as the mean value of dynamic stress, standard deviation, and probability density results of the boom based on the probability density evolution method. The principle of bridge–rail interaction and the principle of train–rail–bridge coupling dynamics are considered [9]. Yan established a fine simulation model of a bridge–double-ballast-track system by using the finite element method and investigated the longitudinal force distribution law of the CWR and the dynamic response characteristics of the coupled system [10]. Li and others used a three-span arch bridge made of a continuous combination of concrete-filled steel tube girders as an example and analysed the influence of different parts of the main girders on random vibration characteristics [11]. The influencing factors of different parts of the main girder and the different responses affected by the deck surface roughness, vehicle speed, and number of vehicles were analysed. Wang et al. studied the dynamic characteristics of a monorail tourist transportation system, measured the dynamic response values of typical rail girder segments, and clarified the dynamic characteristics of the system during actual operation [12,13]. Deng et al. used finite element simulation to compare the magnitude relationship between the strain and deflection power amplification factor of simply supported girder bridges and continuous girder bridges [14]. According to the results of the study, the ratio of the strain and deflection power amplification factors of the simply supported girder and continuous girder bridges is close to 1 when the bridge span is less than 30 m. Therefore, this paper selects the displacement dynamic amplification factors for the study of the dynamic amplification factors of the MTTS.
In this paper, on the basis of the research results of traditional urban transportation systems, for the characteristics of the MTTS, a power response test was carried out based on the Happy World project QiCaiYunan. The multibody dynamics and finite element analysis methods were combined with the multibody dynamics software SIMPACK and the general finite element analysis software ANSYS to establish a monorail excursion car and track beam model, and the field test results of the simulation model were used to verify the accuracy of the model. This paper adopts a method based on probabilistic statistical theory and parameter fitting to study the distribution law of bridge displacement dynamic amplification factors and derives an expression of dynamic amplification factors considering multiple factors, such as bridge span, travelling speed, and irregularity.

2. Vehicle–Bridge Coupling Model Based on the Finite Element Method

2.1. Establishment of Vehicle–Bridge Coupling Model

In ANSYS, the track girder is modelled as a SHELL63 plate and shell unit, and the girder material is Q345C. The total weight of the excursion car is 9.3 t, which is modelled by SIMPACK. The single-car model consists of a car body and a bogie, which are regarded as rigid body structures. The main components of the bogie are the frame, rocker, and tires, of which the tires are divided into three kinds: travel wheels, guide wheels, and stabiliser wheels. Compared with the conventional vehicle model, the monorail bogie does not include a series of suspensions, and the second series of suspensions consists of hourglass springs. In this paper, the actual modelling only considers the quality, geometric characteristics, and dynamic characteristics of the components, frame, rocking pillow, etc., as a rigid whole. To improve the model fineness, force elements are used for simulation, such as hourglass springs and shock absorbing equipment. The whole train is organised into four cars, with a single car as a substructure, and multiple cars are connected to the substructure to form the whole train model. Based on the above modelling ideas, the multibody model topology of the monorail excursion car is shown in Figure 1, and the side view of the car–bridge coupling model is shown in Figure 2.

2.2. Track Irregularity Spectrum

Ji [15] conducted a large number of measurements on the track irregularity of the travel transportation system, graded the irregularity spectrum, and established a five-grade evaluation system of the irregularity spectrum of the monorail top plate, as shown in Figure 3. In this paper, the research results are utilised in the analysis, and the irregularity spectrum of each classification (hereinafter referred to as Spectrum 1, Spectrum 2, Spectrum 3, Spectrum 4, and Spectrum 5) is imported into the SIMPACK for calculation, which is used as the external excitation of the vehicle–bridge coupling model.

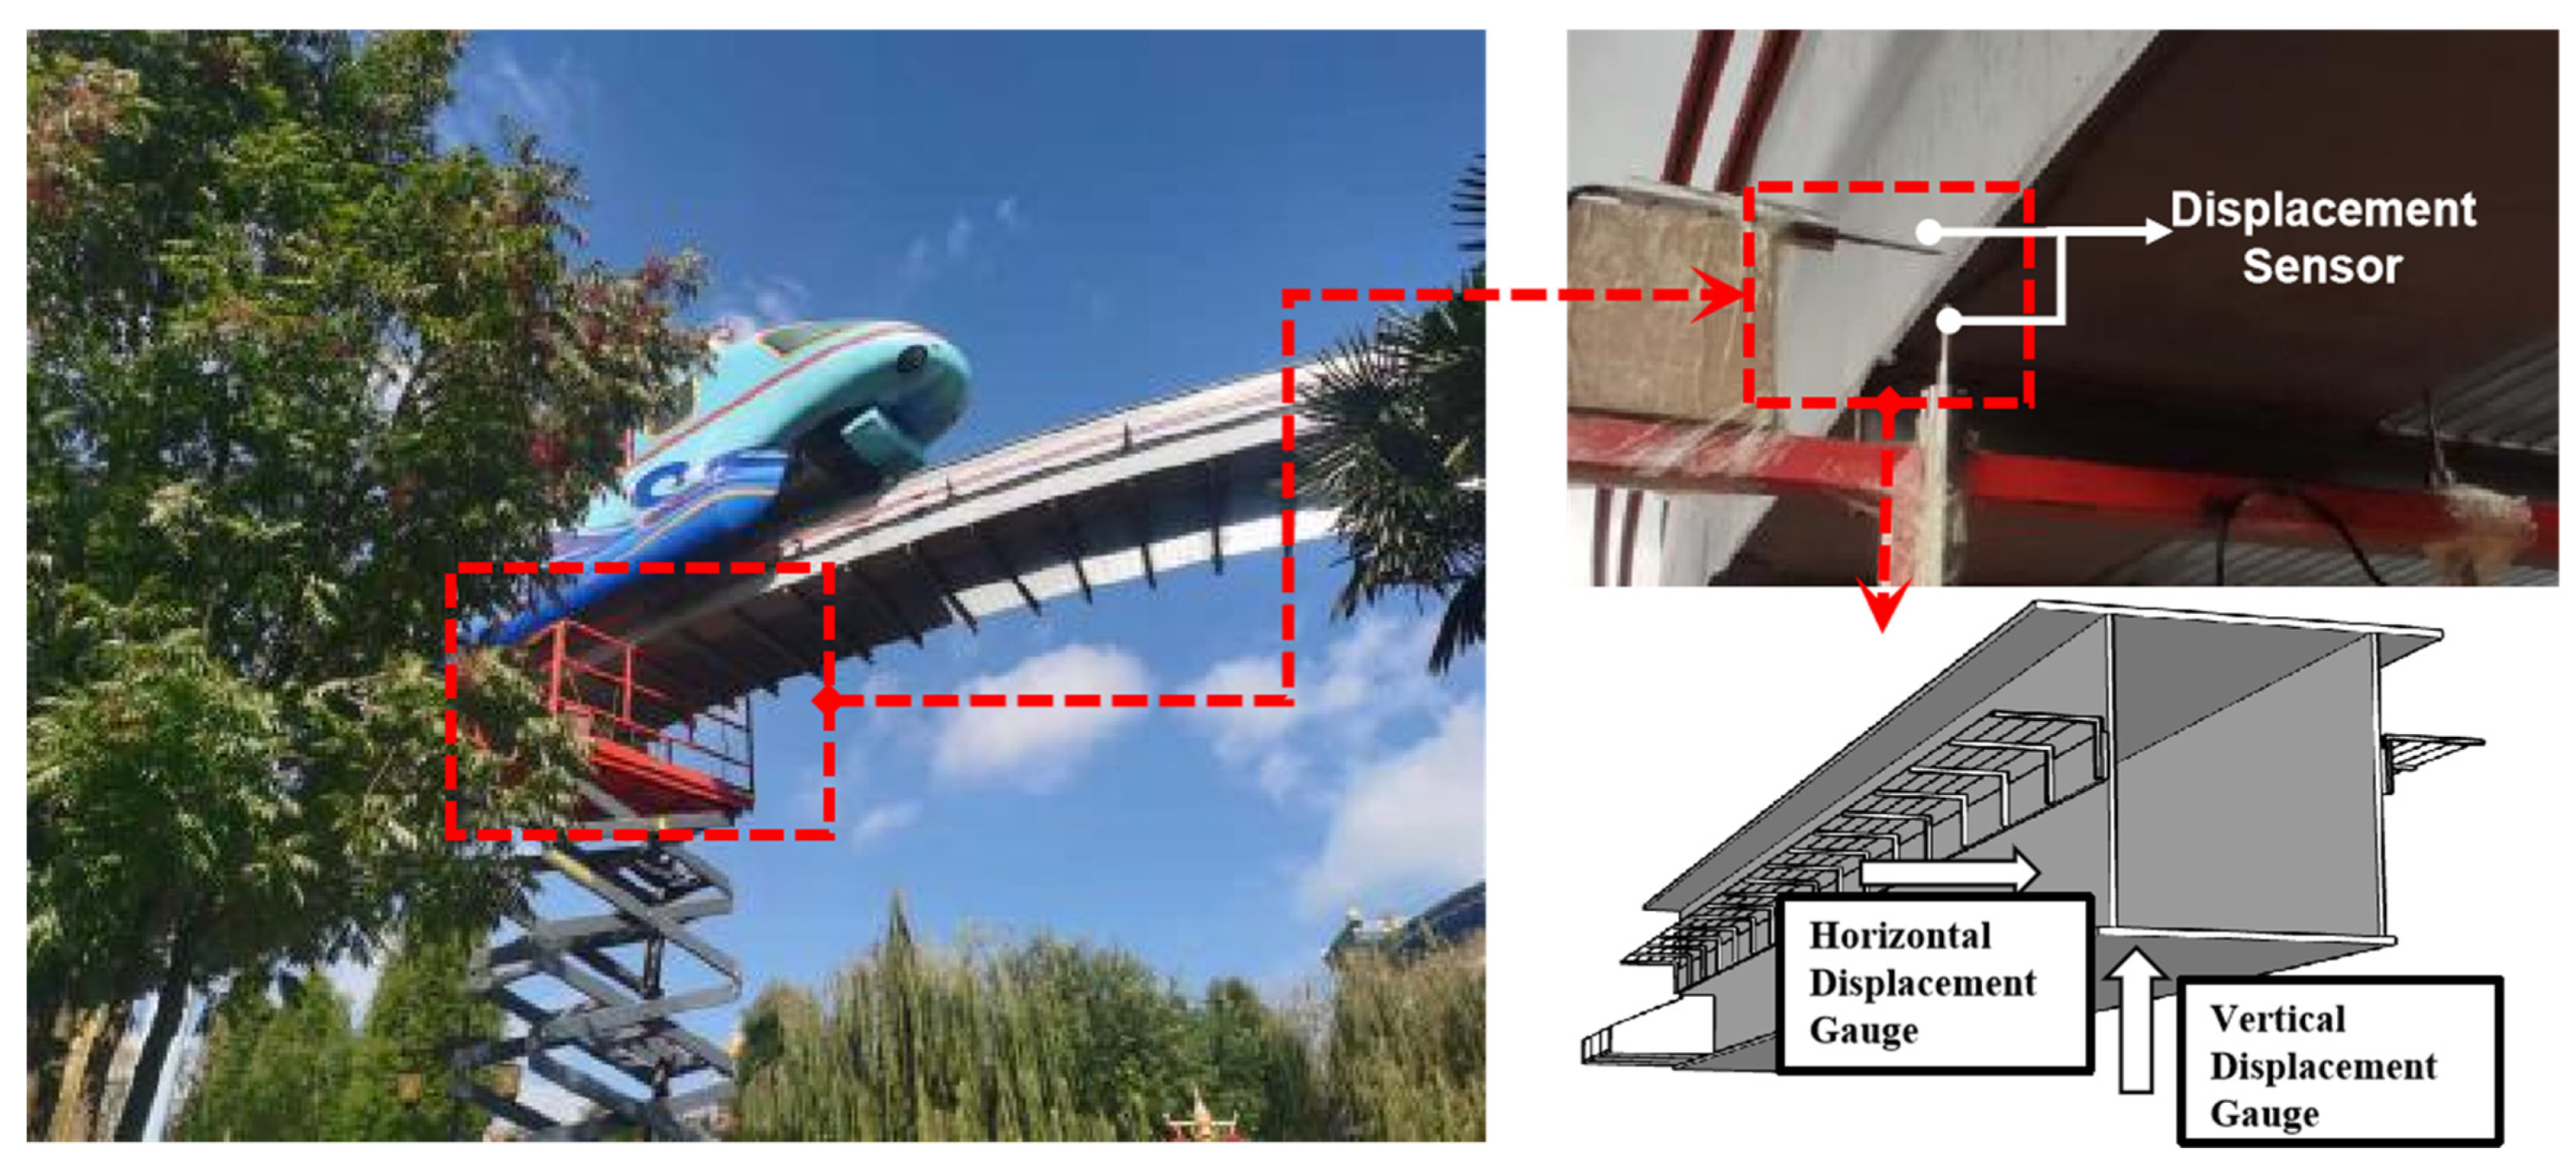
2.3. Model Validation Based on Real Measurements

To verify the correctness of the finite element model, a dynamic load test was carried out on the 47th, 48th, and 49th spans of 3 × 20 m curved continuous girders of the Qicaiyunan project. The cross section of the track girder is a fully welded single box, single chamber steel box girder with a top plate. The width of the top plate is 410 mm, and the height is 700 mm. The detailed dimensions are shown in Figure 4.
The excursion car is organised into four cars, and each car has two sets of wheel pairs. The speed is divided into four gears; the first speed is 2.5 km/h. The first to fourth speeds increase gradually, and the maximum speed is 10 km/h. The weight of the excursion car is 9.3 t, and it is towed by electric traction. The experimental measurement points are placed at the mid-span of a 48-span beam. The deflection and lateral displacement at both the inner and outer sides of the mid-span are measured using displacement transducers, and the vibration signals are collected using the YSV system. Three thimble-type displacement sensors are arranged at the mid-span position of the beam span to detect the transverse displacement and the internal and external deflection of the beam. The measured layout is shown in Figure 5.
The train was operated at four speeds, i.e., 2.5 to 10 km/h, and was tested with no load. The samples measured at the mid-span part include the lateral displacement of the girder, the board displacement of the girder, and the out-board displacement of the girder. A set of field test vertical displacement values are selected for comparison with the theoretical calculation values, in which the dynamic amplification factors of the calculation model are selected as follows: the measured track of the project is selected to be irregular; the train speed is 10 km/h, which is consistent with the measured speed; and the train weight is set to 9.3 t, which is consistent with the loaded condition of the test vehicle. The theoretically calculated and measured values are plotted as time—displacement curves in Figure 6.
Figure 6 reveals that during the initial process of the vehicle entering the monorail beam, the mid-span exhibits an upwards deflection trend. At this stage, the measured results are consistent with the theoretical calculations of the finite element model. The measured upward deflection displacement extreme value is 5.38 mm, and the theoretical calculation extreme value is 5.32 mm, with a difference of 1.12%. As the train gradually enters the monorail beam, the mid-span experiences a downwards deflection. Both the on-site measurements and theoretical calculations show similar slopes. When the train passes through the mid-span position, the monorail beam exhibits the maximum vertical displacement. The maximum value of the field measurement is 15.12 mm, and the theoretical calculation of the maximum value is 15.32 mm, with a difference of 1.32%. After the train exits the monorail beam, the beam initially exhibits some upwards deflection, and then, displacement stabilisation is observed. Throughout the entire process, the beam exhibits slight vibrations. These results indicate that the model developed in this study has high precision and can accurately reflect the mechanical behaviour of the actual structure.

3. Dynamic Amplification Factors of MTTS

3.1. Calculation Conditions

The main reference standards for the comparative analysis of MTTS are shown in Table 1. From the table, it can be observed that the current similar international and domestic standards for dynamic amplification factor expressions mainly consider span-related factors, without considering the influence of train speed and track irregularities. Therefore, this study analyses the influence of the bridge span, train operating speed, and irregularity on the dynamic amplification factors. In the dynamic amplification factor specifications for highway bridges, considerations are also given to the bridge’s fundamental frequency. However, in this monorail urban transit system, the use of steel structures with a unified cross-sectional shape results in a correlation between the vertical fundamental frequency and span. Therefore, this study does not separately consider the vertical fundamental frequency.
Considering the universality and representativeness, six different spans of 10 m, 13 m, 15 m, 17 m, 20 m, and 23 m were selected for calculation, which collectively account for more than 90% of all spans [14]. The train speeds considered ranged from a maximum of 40 km/h to a minimum of 2.5 km/h, with 2.5 km/h being the lowest level of loading. The external excitation was based on the irregularity spectrum of a fifth-level monorail transportation system. Through simulation and modelling, dynamic amplification factors were obtained for each span at 16 different train speeds and under the influence of five different irregularity spectra specifically designed for the monorail transportation system, resulting in a total of 480 data points. The calculation conditions are summarised in Table 2.

3.2. Analysis of Dynamic Amplification Factors Based on Probabilistic Hypothesis Testing

Based on the working conditions presented in Table 2, the parameters of the vehicle–bridge coupling model were adjusted. Subsequently, simulation analyses were conducted according to the conditions of each case, with the train’s quasistatic passing speed set at 0.06 km/h. The calculated results were then subjected to filtering and smoothing treatment to obtain the static maximum displacement solution of the monorail beam. Dynamic amplification factors are comprehensive dynamic amplification factors that are jointly influenced by stochastic factors such as vehicle load excitation and bridge parameters and are generated via stochastic combinations. In this study, dynamic amplification factor samples were obtained based on the aforementioned vehicle–bridge coupling simulation model. By combining probability and mathematical statistical methods, a regular study was conducted on dynamic amplification factor samples using a continuous random variable probability model [19,20,21].
The process of determining the distribution function is as follows:
  • Determine the sample statistics: The dynamic amplification factors sample is denoted as ( X 1 , X 2 , X 3 X n ) , and its mean E ( x ) and variance V a r ( x ) are calculated.
  • The empirical distribution function can be used to estimate the distribution function of the population. The sample observations are determined and sorted from smallest to largest, and the frequency is calculated to obtain the empirical distribution function P n ( x ) as shown in Equation (1):
    P n ( x ) = 0 ( x x 1 ) 1 / n ( x 1 x 2 ) k / n ( x k x k + 1 ) n / n ( x n x )
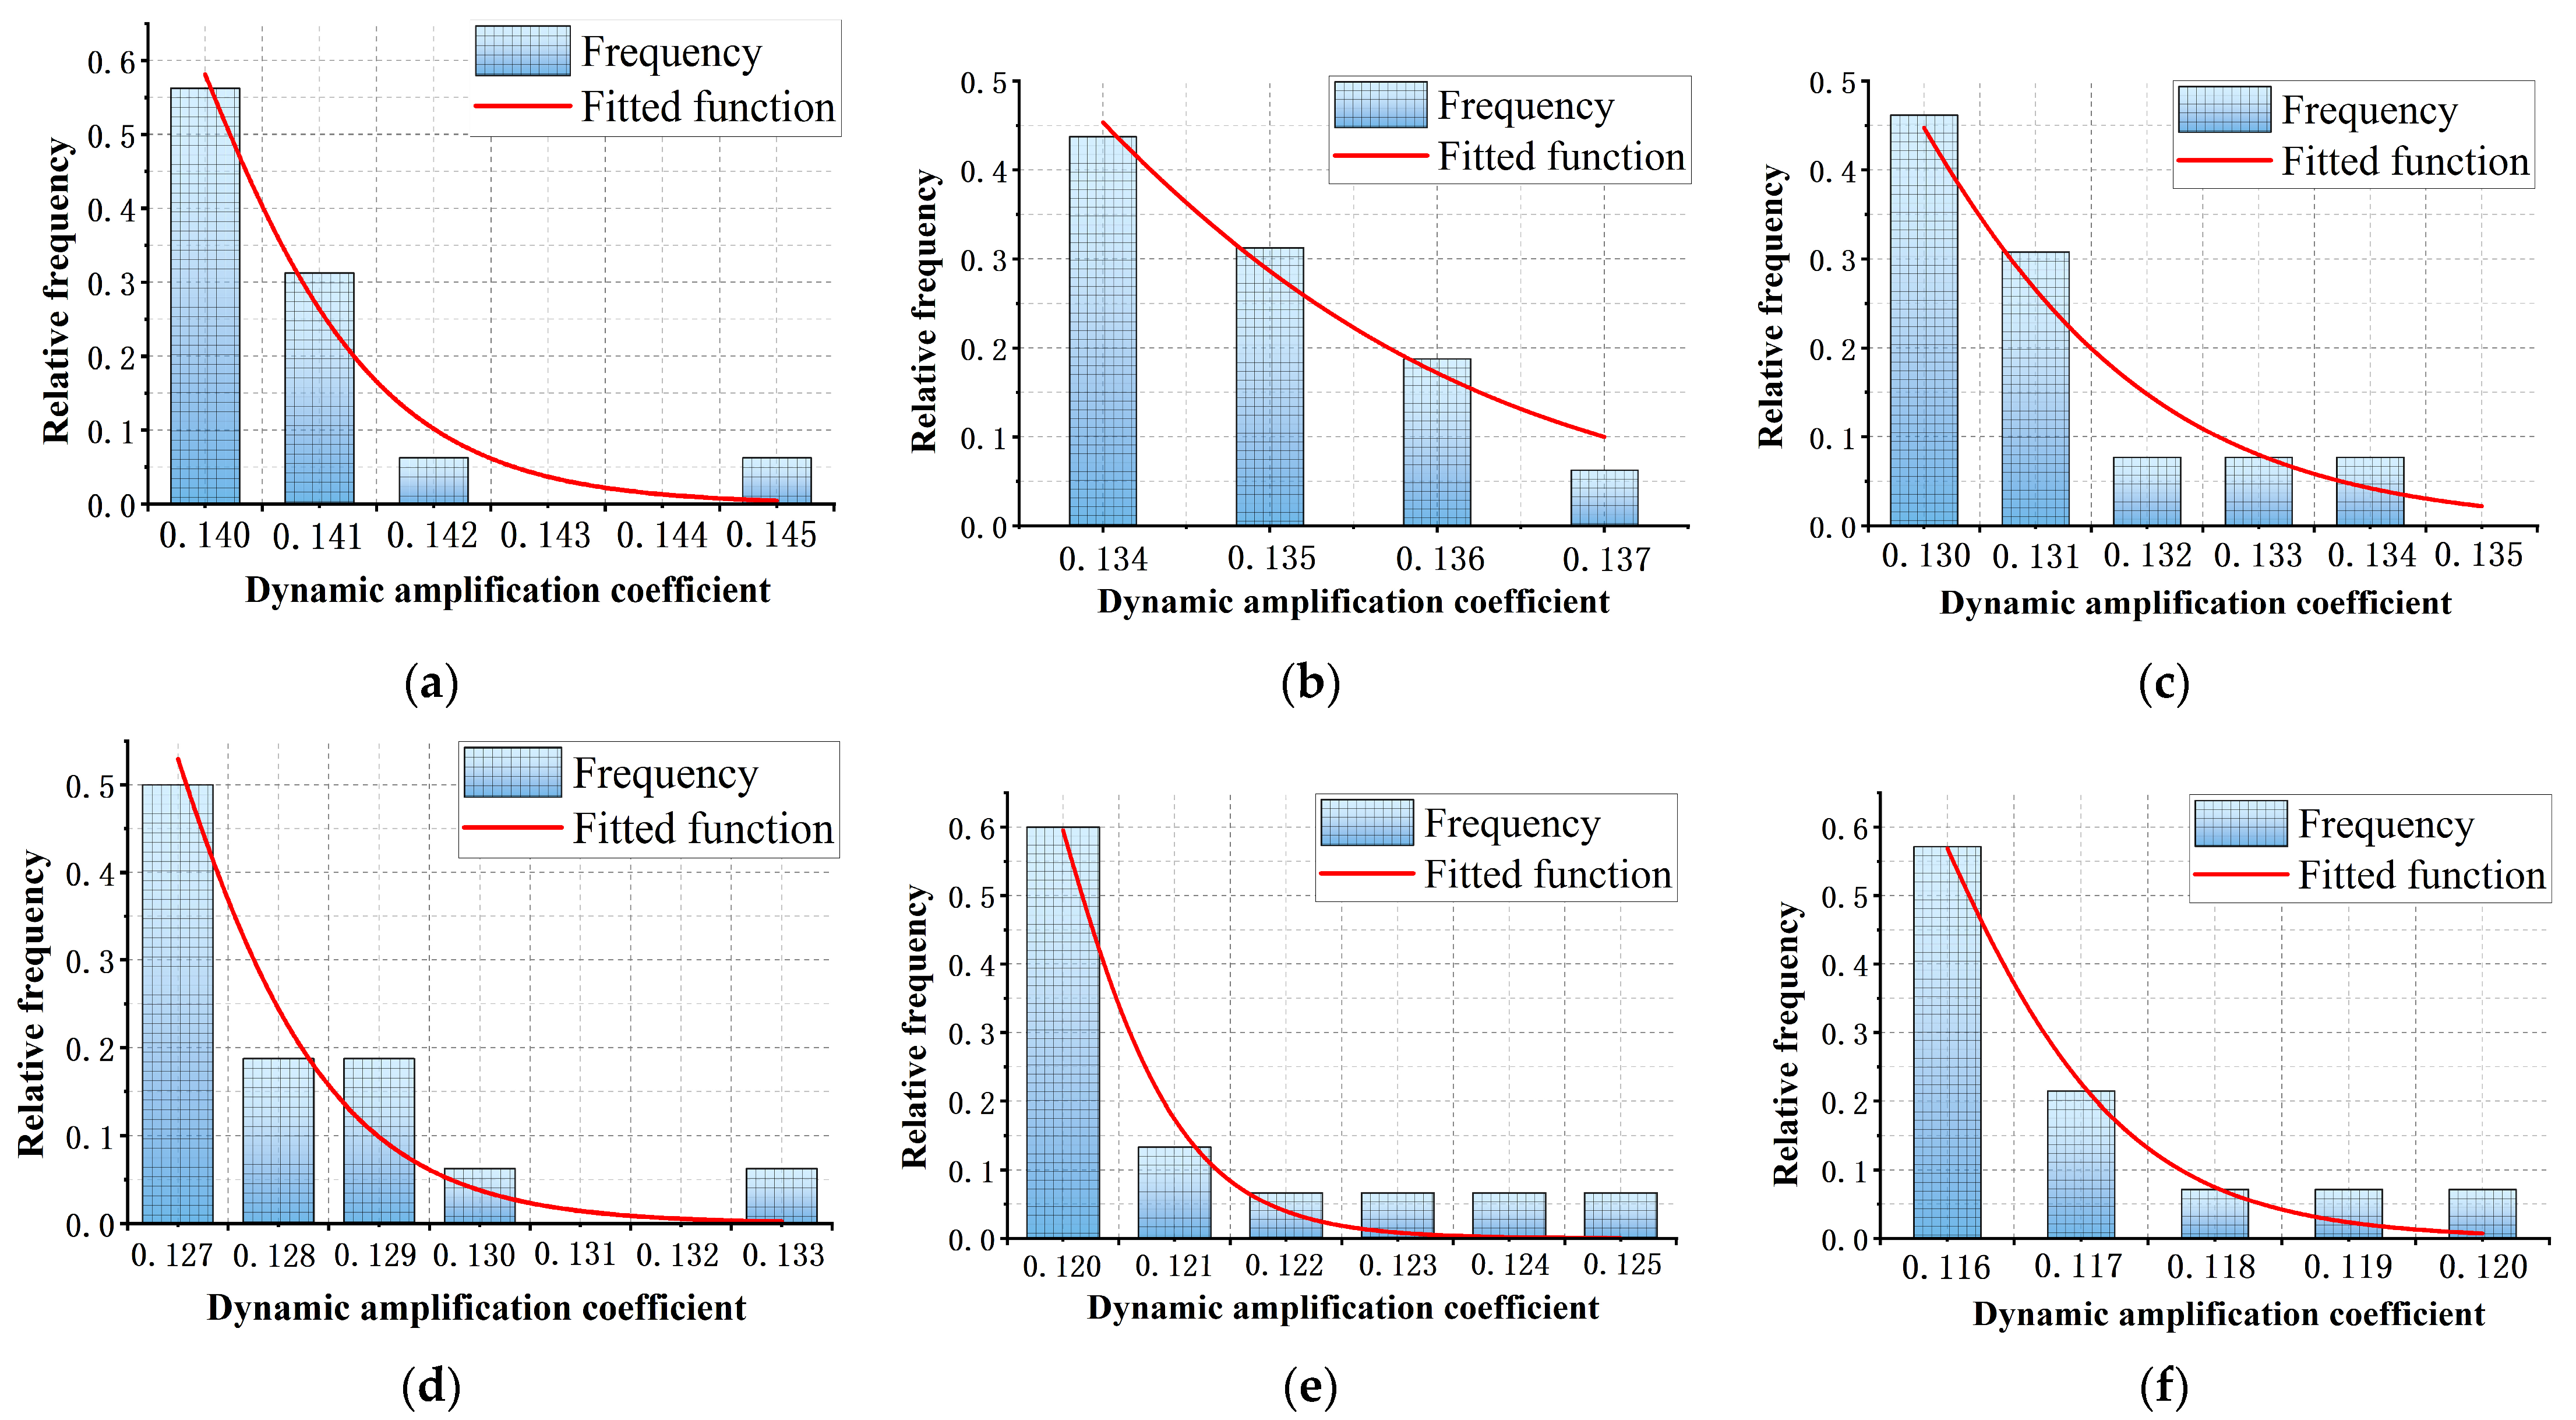
  • Generate a histogram: The histogram can be used to estimate the probability density function of the population. The sample observations are grouped, and the frequency of each group is calculated. The group frequency is then divided by the respective sample size to obtain the group frequency v i / n . Using the group interval as the width and the ratio of the group frequency and the group interval Δ i as the height, a histogram can be drawn to estimate the density function curve of X.
  • Determine the distribution function: Common probability distribution functions include the normal distribution, exponential distribution, Poisson distribution, and lognormal distribution, among others. The dynamic amplification factors generally follow an exponential distribution. After multiple function fittings, this paper confirms that the extreme type I confidence level of the exponential distribution provides the best fit, with its distribution function and probability density function shown in Equations (2) and (3), where A and B are the parameters.
    F ( x ) = e e A ( x B )
    f ( x ) = A e A ( x B ) e A ( x B ) , ( < x < + )
  • Parameter estimation: Common methods for parameter estimation include the method of moments and the maximum likelihood estimation. For parameters A and B of the aforementioned extreme type I distribution, the method of moments can be employed to obtain the following estimators:
    A = π 2 6 V a r ( x ) ,   B = E ( x ) c A
Here, E ( x ) represents the sample mean, V a r ( x ) represents the sample variance, and c is the Euler constant.
6.
Hypothesis testing for fitting the distribution function: Assuming that the sample follows the type I extreme value distribution H 0 : F ( x ) = F 0 ( x ) = e e A ( x B ) , a test statistic T is established, and the K-S test: T n = m a x { F ( x ) P n ( x ) } is used in this paper with a significance level of 0.05. The rejection region W is determined based on T, and the observed value t of the test statistic is calculated from the sample observation and compared with the critical value of the rejection region.
By conducting the aforementioned calculations, the probability distribution function of the dynamic amplification factor μ can be obtained. Using the aforementioned methodology, this study developed MATLAB programs for computation and ultimately obtained the probability distribution functions of the dynamic amplification factor for six different durations, all of which fit well with the type I extreme value distribution (Figure 7).

3.3. Influences of Different Spans and Speeds on Dynamic Amplification Factors

Based on the probability density function of the dynamic amplification factor obtained from Section 3.2, the dynamic amplification factor at a confidence level of α = 0.05 was computed for each density function. The dynamic amplification factors were then regressed against span and speed separately using multiple functional forms, with the correlation coefficient R 2 used to assess the fitting degree. To envelop the data points with the fitted dynamic amplification factors to the maximum extent possible, the regression curve was shifted outwards to obtain the envelope line of the regression curve. The dynamic amplification factor expressions for the span and speed of the monorail tourism transportation system were thus obtained (Equations (1) and (2)), and their corresponding fitted curves are shown in Figure 8 and Figure 9. Figure 8 and Figure 9 show that the dynamic amplification factor decreases gradually with increasing span and obeys an inverse proportion; moreover, it increases gradually with increasing train speed and obeys a direct proportion.
1 + μ = 1 + 10.54 L + 64.83 ( R 2 = 87 % )
1 + μ = 1.06 + 0.03 v ( R 2 = 93 % )
Here, v represents the traveling speed (m/s), and L represents the span (m).
Figure 8. Dynamic amplification factors fitted curve on span.
Mathematics 12 01221 g008
Figure 9. Dynamic amplification factors fitted curve on speed.
Mathematics 12 01221 g009

3.4. Consideration of Multi-Factors in the Expression of Dynamic Amplification Factors

The magnitude of the impact effect is influenced by multiple factors, such as the train speed, track roughness, and bridge span. The current dynamic amplification factor expressions in domestic and foreign regulations mostly consider only the relation to span, without considering the influence of other factors. Therefore, in the process of fitting the dynamic amplification factor formula, comprehensive consideration of multiple factors is necessary. By combining single-factor Formulas (1) and (2) derived in the previous section, as well as other regulation-defined formulas for dynamic amplification factors, various functional forms were selected for regression analysis to obtain the optimal functional form expressed in (7).
1 + μ = K v + α L + φ + i
Here, v represents the travelling speed (m/s), L represents the span (m), and the coefficient i is the impact of track irregularities on the dynamic amplification factors.
When determining the coefficient i, taking a 13 m span as an example, sixteen sets of speeds ranging from 2.5 to 40 km/h are selected within the specified range. The track irregularity spectra of levels 1 to 5 for the monorail transit system are considered. By comparing the difference in dynamic amplification factors between considering and not considering track irregularities under the same working conditions, the range of variation in i is determined to be from 1.00 to 1.06. Considering a margin of safety, i is taken as the maximum value of 1.06.
By substituting all the data obtained from the conditions in Table 2 into Equation (7) and based on regression analysis along with the R-value test, the parameter values can be determined, which are K = 0.2, α = 10.8, and φ = 54.3. Thus, the expression for the dynamic amplification factors of the suspended monorail transit system is obtained as follows:
1 + μ = 0.2 v + 10.8 L + 54.3 + 1.06
Here, v represents the traveling speed (m/s), and L represents the span (m).

3.5. Comparative Analysis of Dynamic Amplification Factors

The dynamic amplification factors considering irregularities for monorail beam spans of 10 m, 13 m, 15 m, 17 m, 20 m, and 23 m are calculated using the dynamic amplification factor fitting formula (Equation (8)), finite element model, and calculations based on the “Standard for design of straddle monorail transit” and the “Large-scale amusement device safety code”, respectively. In the finite element model, the most representative level 3 irregularity spectra are selected. The results of the dynamic amplification factor calculations for all operational conditions are presented in Figure 10. A comparison of the dynamic amplification factors for the highest train speed, namely, 40 km/h, is shown in Table 3.
From Table 3 and Figure 10, it is evident that the calculated values obtained from the dynamic amplification factor fitting formula proposed in this study exhibit good enveloping characteristics, demonstrating strong applicability for the suspended monorail transit system. This ensures safety while avoiding unnecessary waste during design. The results indicate that the dynamic amplification factor calculation formula proposed in this study, which is based on probability statistics and regression analysis fitting methods, can be used to guide engineering practice.

4. Conclusions

(1)
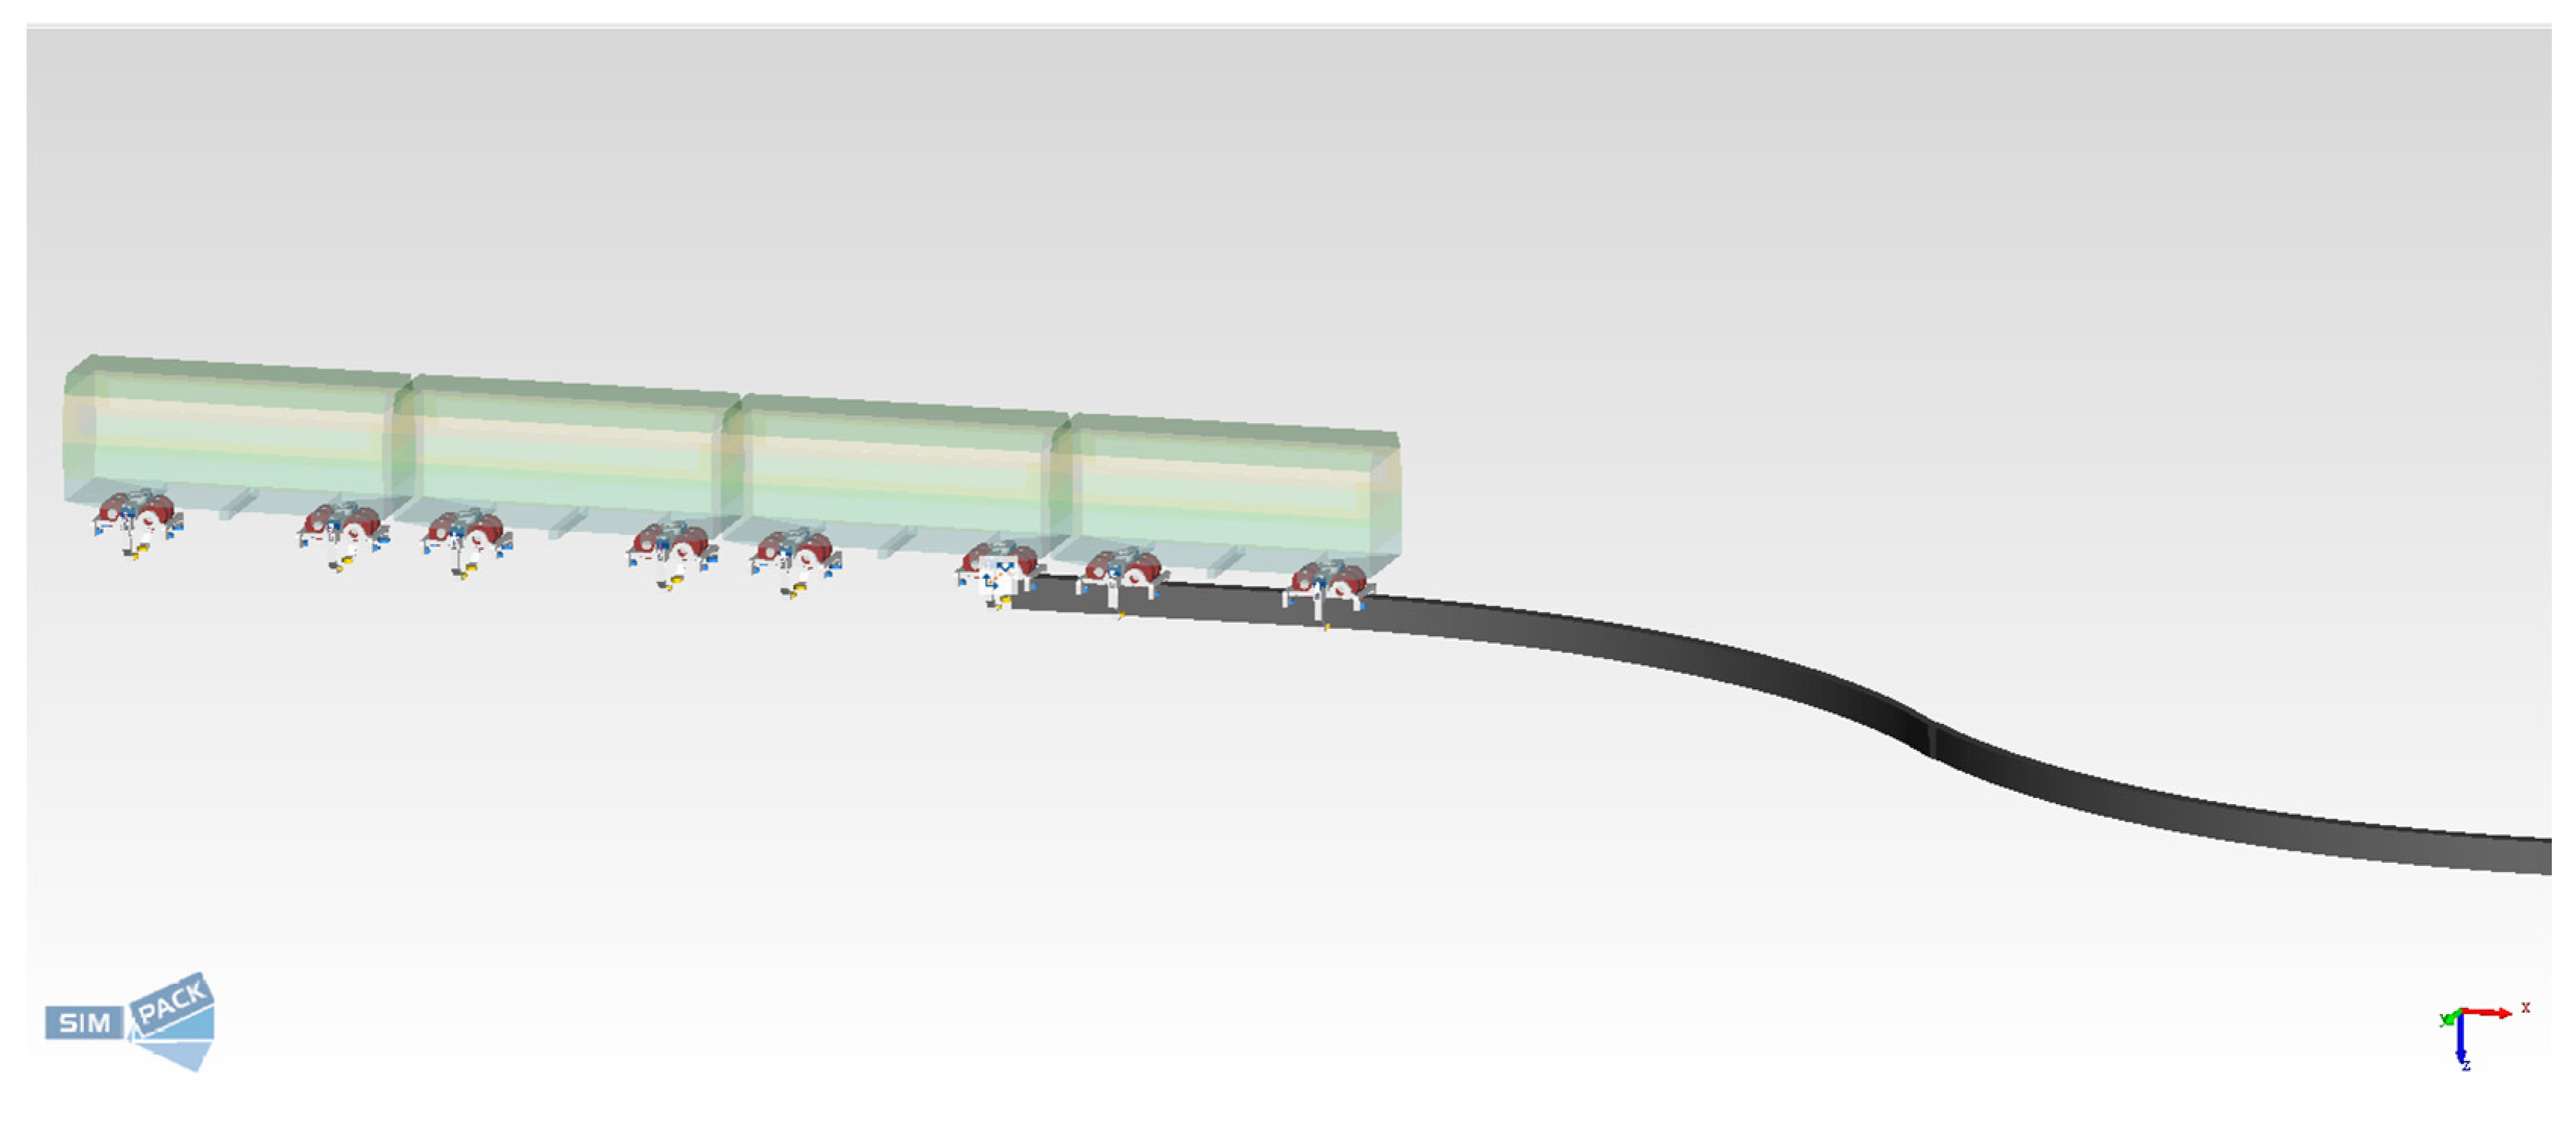
A coupled model of a suspended monorail elevated tourist vehicle and bridge was established based on the finite element analysis software ANSYS and the multibody dynamics software SIMPACK. The six-level spectrum evaluation system of the monorail top plate irregularity spectrum was selected as the external excitation. The theoretically calculated values were compared with the measured displacement time history, with a maximum theoretically calculated displacement error of 1.32% at the mid-span of the beam, demonstrating that the simulation model based on the six-level spectrum has high accuracy and can correctly reflect the mechanical performance of the actual structure.
(2)
Sample values of the dynamic amplification factors were obtained based on the vehicle–bridge coupled simulation model. Combined with probability and mathematical statistical methods, a continuous random variable probability model was used to study the regularity of the dynamic amplification factor samples. After the K-S test, it was proven that the probability distribution characteristics of the dynamic amplification factors based on the span all followed the extreme value type I distribution.
(3)
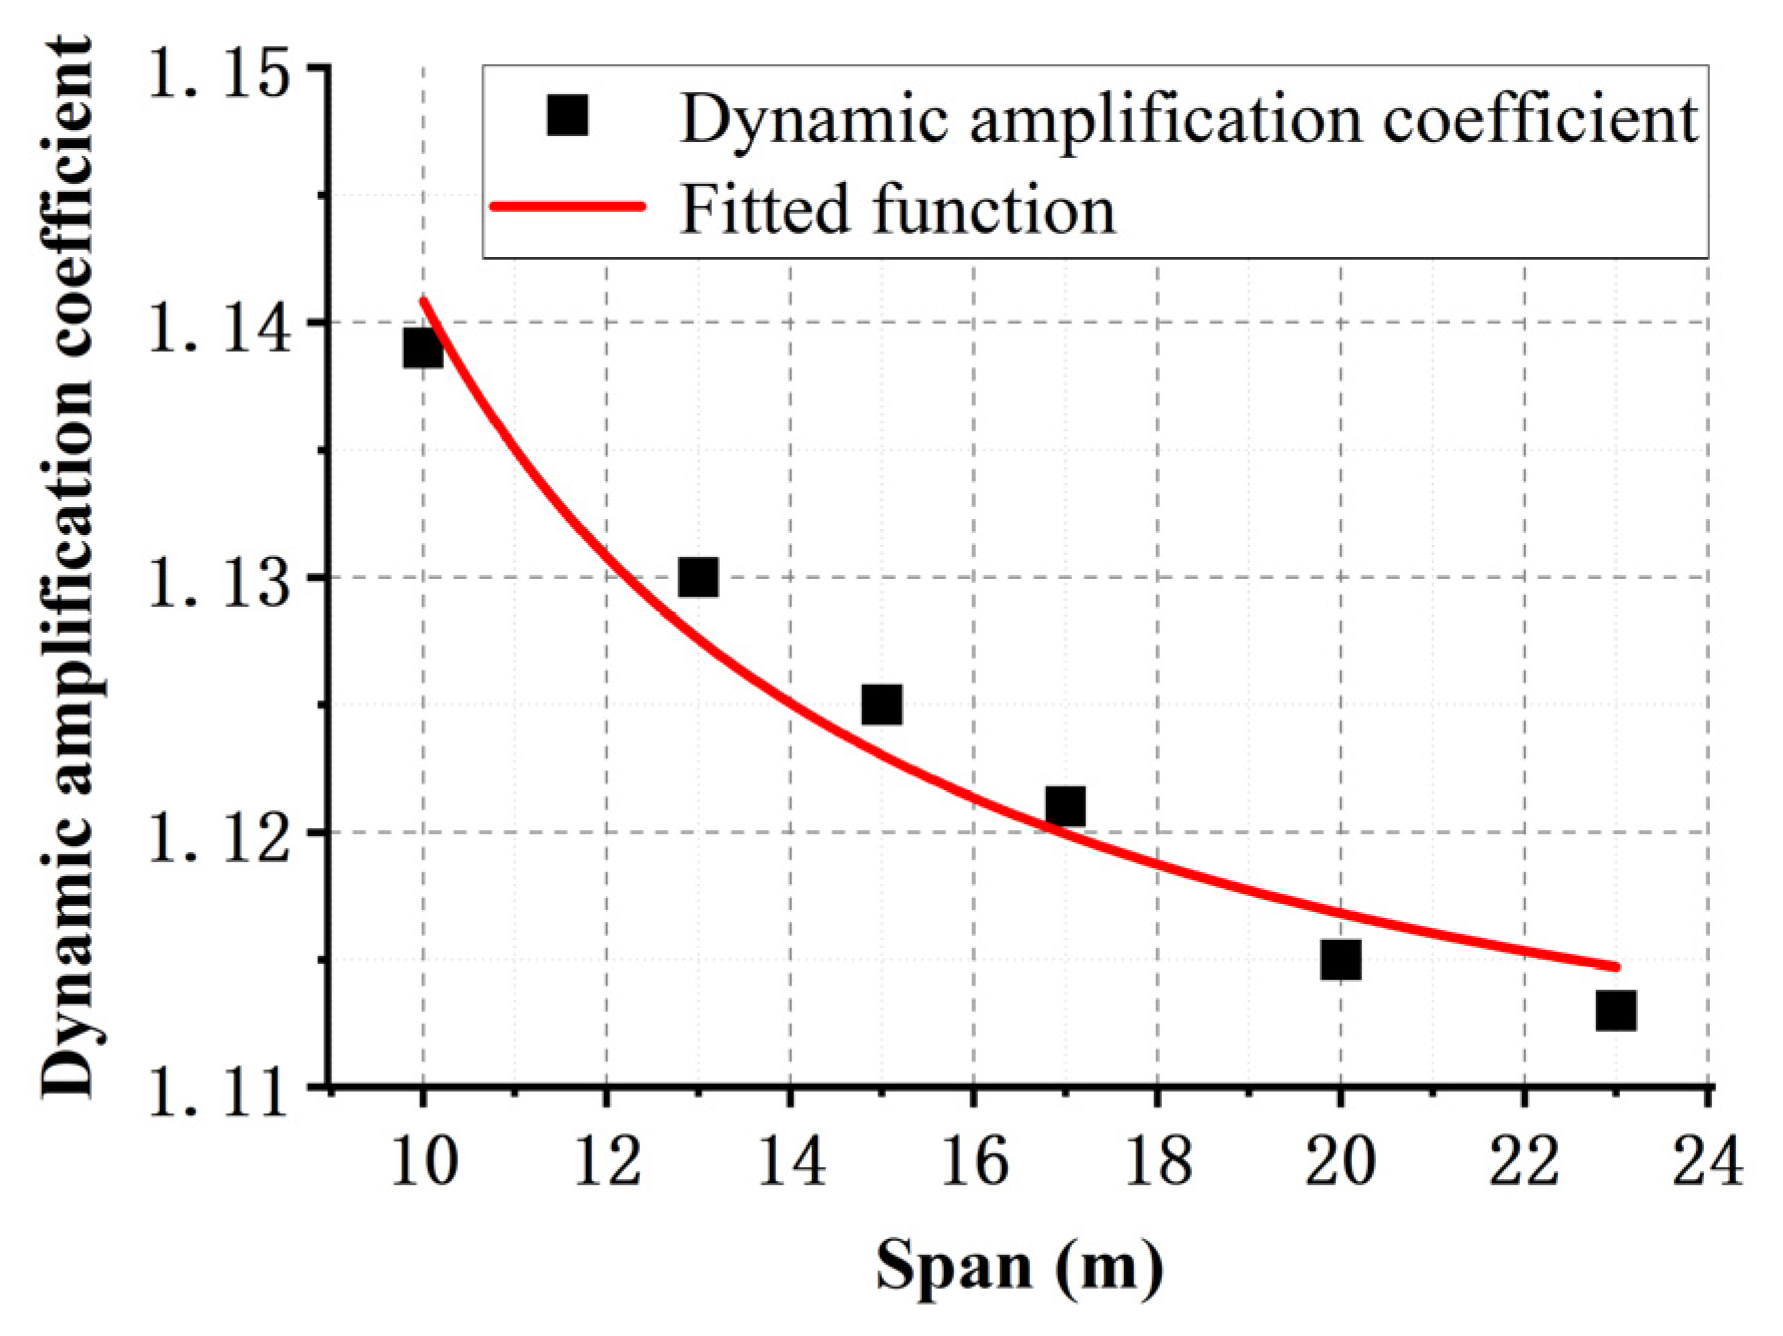
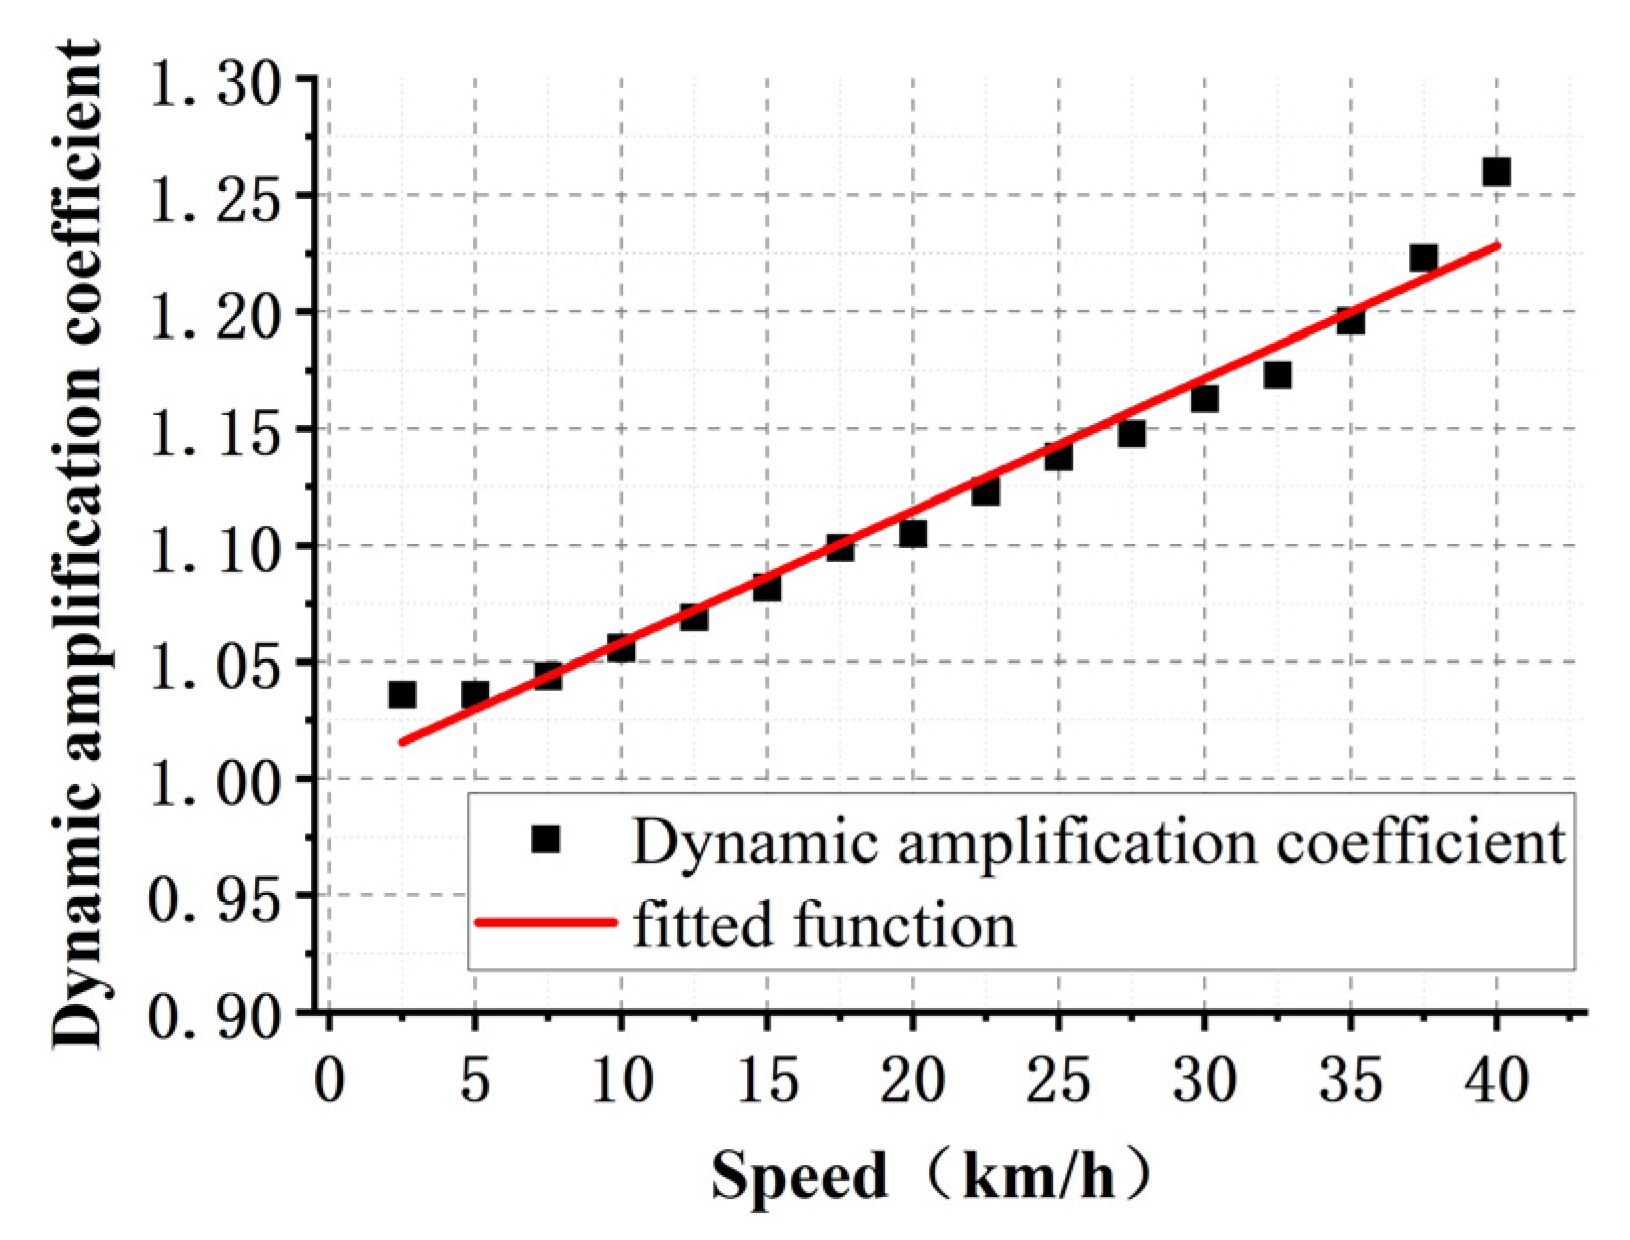
For the extreme value type I distribution function of the dynamic amplification factors mentioned above, expressions for the dynamic amplification factors based on the span and vehicle speed as independent variables were derived through 95% confidence testing and function fitting methods. The changing trend of the dynamic amplification factors based on the span and vehicle speed for the monorail transit system was summarised.
(4)
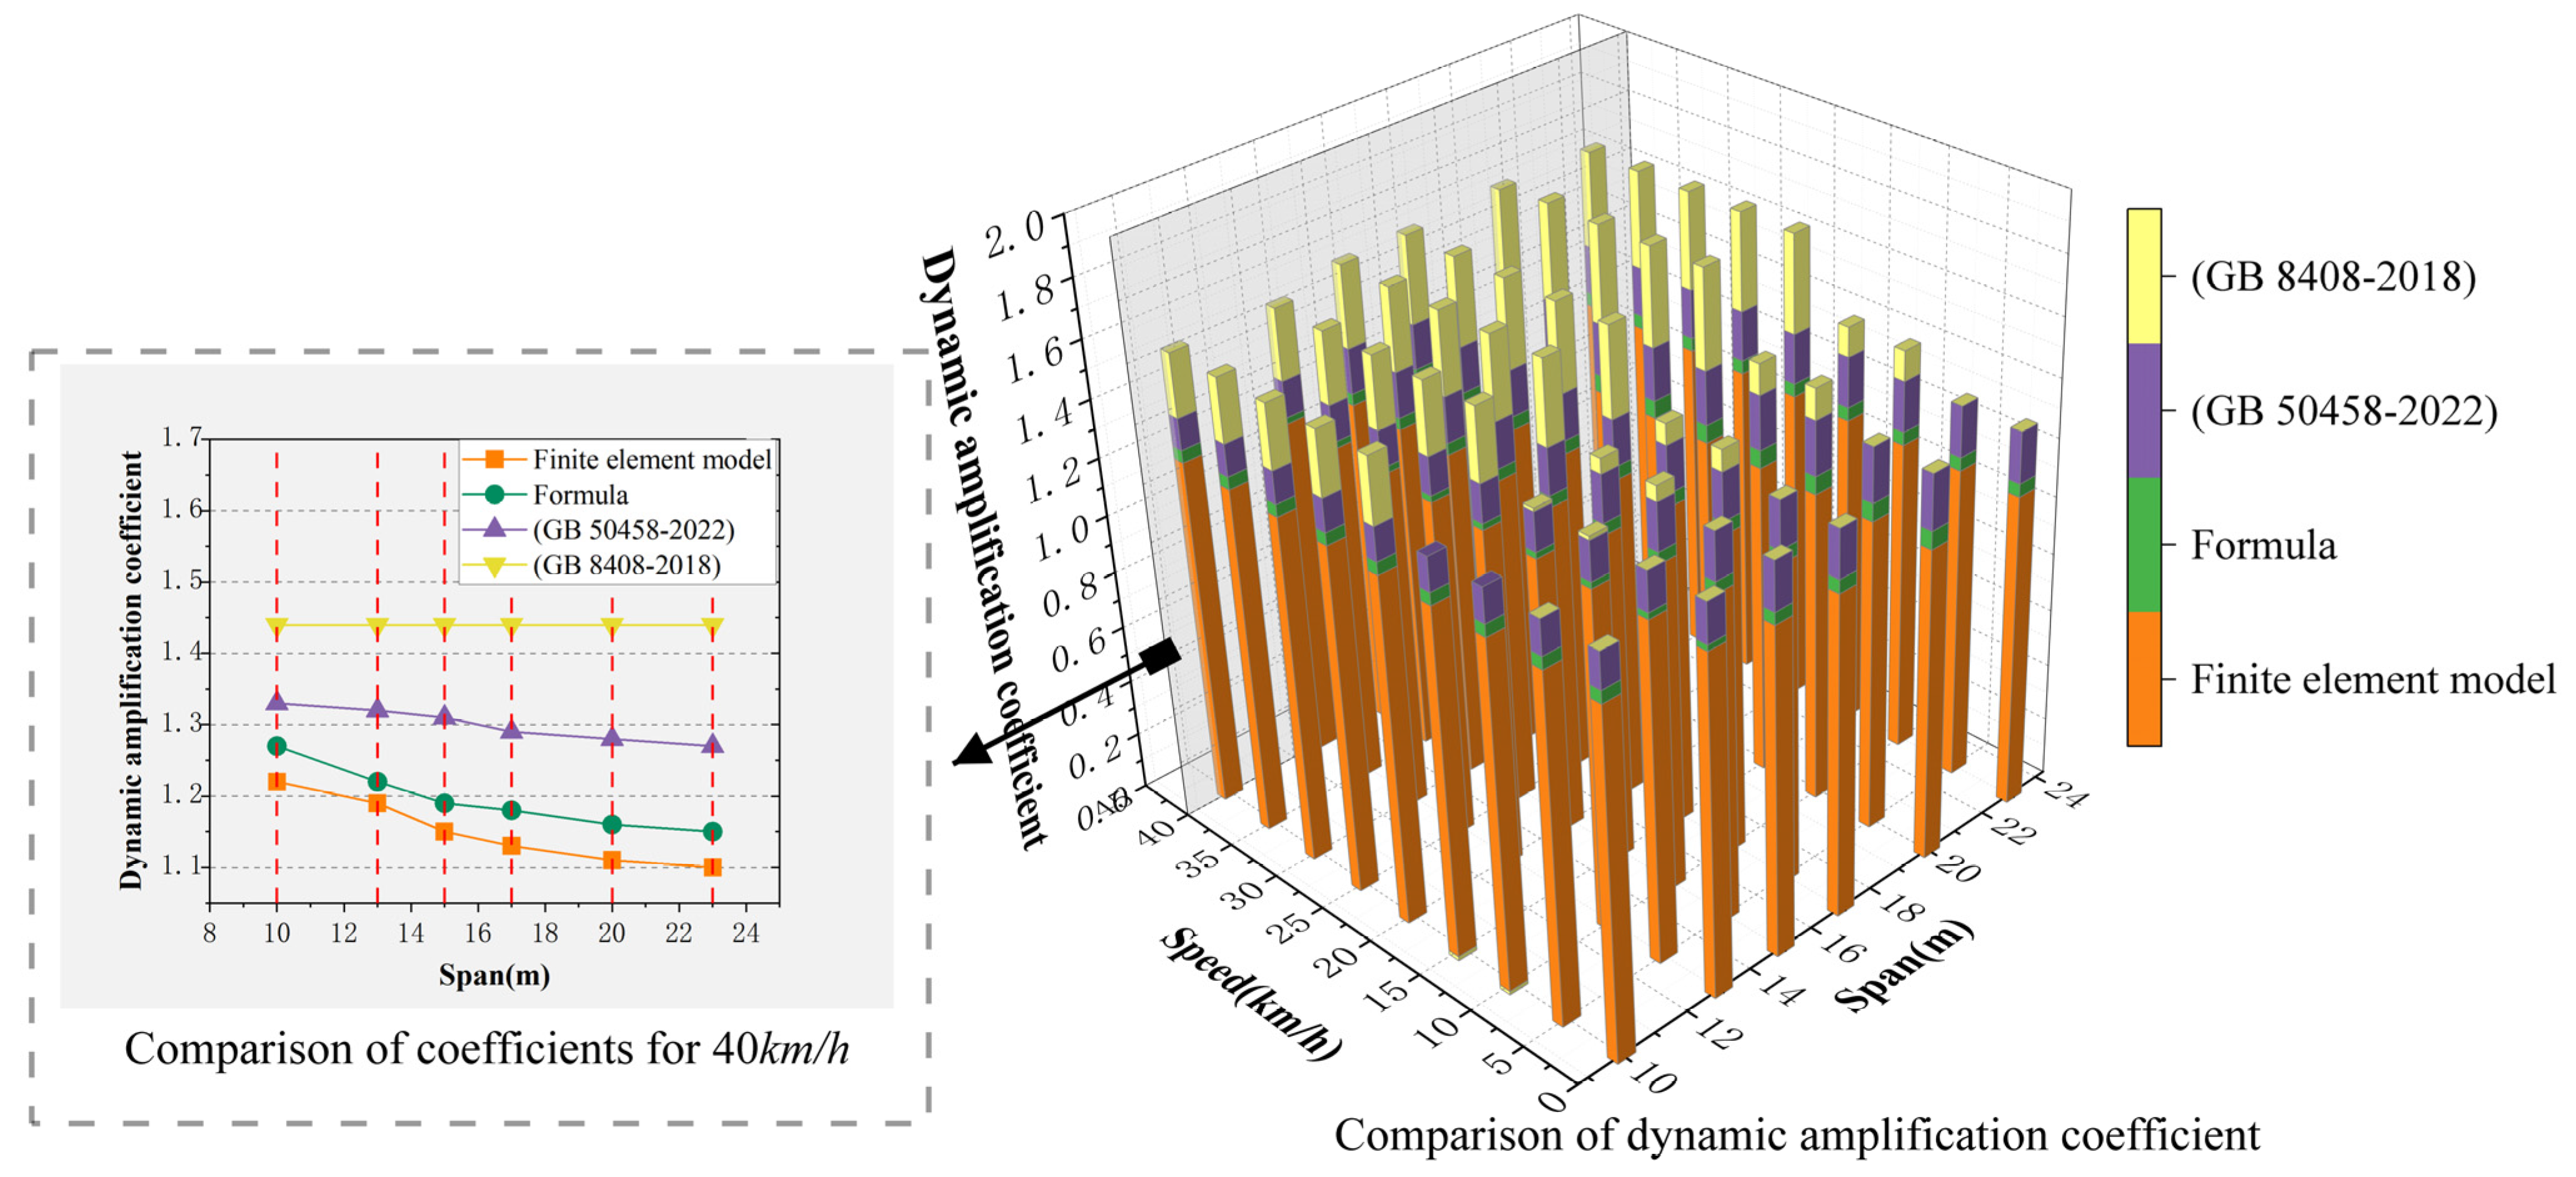
Through 95% confidence testing, function fitting methods, and the relationships among the dynamic amplification factors, span, and vehicle speed, a multi-factor dynamic amplification factor calculation fitting formula considering vehicle speed, span, and irregularity was derived. A comparison of the fitting formula, finite element model, and calculations based on the “Standard for design of straddle monorail transit” and the “Large-scale amusement device safety code” was conducted, demonstrating that the formula has strong applicability and is suitable for the suspended monorail tourist transit system with slower speeds, enhancing economy while ensuring safety and providing technical support for the subsequent research and design of the system.

Author Contributions

Conceptualisation, F.G. and C.L.; methodology, C.L.; software, C.L. and Q.L.; validation, C.L. and C.W.; formal analysis, C.L.; data curation, C.L. and Y.Y.; writing—original draft preparation, C.L.; writing—review and editing, F.G., C.L. and L.J.; project administration, F.G.; funding acquisition, F.G. All authors have read and agreed to the published version of the manuscript.

Funding

This research was funded by Zhuzhou CRRCTK under project No: 738011925, focused on the development of the Monorail Elevated Steel Structure Rapid Transit System.

Data Availability Statement

The data presented in this study may be available on reasonable request from the first or corresponding author.

Conflicts of Interest

Authors Qiaoyun Liao and Yongfeng Yan were employed by the company Zhuzhou CRRC Special Equipment Technology Co. The remaining authors declare that the research was conducted in the absence of any commercial or financial relationships that could be construed as a potential conflict of interest.

References

  1. Mabrouk, B.; Adam, W. Development of Mathmetical Model for Monorail Suspension System under Different Track Conditions. Master’s Thesis, Universiti Tun Hussein Onn Malaysia, Batu Pahat, Malaysia, 2015; pp. 8–10. [Google Scholar]
  2. Wang, Z.; Li, F.; Niu, Y. Development and application prospect of straddled-type monorail. Elec. Locomot. Mass Transit Veh. 2018, 41, 8–13. [Google Scholar]
  3. Zhang, T. APM and Monorail for Urban Applications. In Proceedings of the 15th International Conference on Automated People Movers and Automated Transit Systems, Toronto, ON, Canada, 17–20 April 2016. [Google Scholar]
  4. He, X. Application and prospect of straddle monorail transit system in china. Urban Rail Transit 2015, 1, 26–34. [Google Scholar] [CrossRef]
  5. Guo, F.; Chen, K.; Gu, F.; Wang, H.; Wen, T. Reviews on current situation and development of straddle-type monorail tour transit system in China. J. Cent. South Univ. (Sci. Technol.) 2021, 52, 4540–4551. [Google Scholar]
  6. Shu, T. The Research on Impact Factor Spectrum of Bridgesbased on Measured Ramdom Traffic Flow Data. Master’s Thesis, Chang’an University, Xi’an, China, 2014. [Google Scholar]
  7. Wang, L.; Jiang, P. Research on the computational method of vibration impact coefficient for the long-span bridge and its application in engineering. J. Vibro Eng. 2016, 18, 394–407. [Google Scholar]
  8. Cui, C.; Feng, F.; Meng, X.; Liu, X. Fatigue life assessment of intercity track viaduct based on vehicle–bridge coupled system. Mathematics 2022, 10, 1663. [Google Scholar] [CrossRef]
  9. Jiang, J. Study on stress impact factor of suspenders of Nielsen system arch bridge based on probability density evolution method. J. Railw. Sci. Eng. 2021, 18, 2350–2357. [Google Scholar]
  10. Yan, B.; Tian, J.; Huang, J. Fatigue characteristics of long-Span bridge-double block ballastless track system. Mathematics 2023, 11, 1792. [Google Scholar] [CrossRef]
  11. Li, J.; Cui, H.; Ma, Z.; Liu, H.; Hu, Y. Study of impact factor of arch bridge made with continuous composite concrete filled steel tube beams. Bridg. Struct. 2022, 18, 89–100. [Google Scholar] [CrossRef]
  12. Wang, P. Study on Dynamic Response of Monorail Rapid-Transit Tour System Based on Measured Longitudinal Irregularity. Master’s Thesis, Central South University, Changsha, China, 2021; pp. 11–52, 62–68. [Google Scholar]
  13. Deng, L.; Duan, L.; Zou, Q. Comparison of dynamic amplification factors calculated from bridge strain and deflection. Eng. Mech. 2018, 35, 126–135. [Google Scholar]
  14. Ji, Y. Study on the Irregularity of the Top Plate of Track Beams of Monorail Tour Transit System. Master’s Thesis, Central South University, Changsha, China, 2023; pp. 1–79. [Google Scholar]
  15. Guo, F.; Ji, Y.; Liao, Q.; Liu, B.; Li, C.; Wei, S.; Xiang, P. The limit of the lateral fundamental frequency and comfort analysis of a straddle-type monorail tour transit system. Appl. Sci. 2022, 12, 10434. [Google Scholar] [CrossRef]
  16. GB 8408-2018; Large-Scale Amusement Device Safety Code. State Administration of Work Supervision: Beijing, China, 2018.
  17. GB 50458-2022; Standard for Design of Straddle Monorail Transit. Ministry of Housing and Urban-Rural Development of the People’s Republic of China: Beijing, China, 2022.
  18. TB10002-2017; Code for Design on Railway Bridge and Culvert. National Railroad Administration: Beijing, China, 2017.
  19. Shen, R.; Guan, K.; Fang, K. Probability distribution of random variables of impact coefficient in numerical simulation of vehicle-bridge coupled vibration. Vib. Shock 2015, 34, 123–128. [Google Scholar]
  20. Wang, Y. Study on Dynamic Behavior of Bridge Considering Coupling Vibration of Train-Extradosed Cable-Stayed Bridge. Master’s Thesis, Lanzhou Jiaotong University, Lanzhou, China, 2020. [Google Scholar]
  21. Zhou, Z.; Wang, D.; Wang, R.; Zhang, P.; Zhang, M. Dynamic impact factor for steel-concrete composite l-girder bridge based on vehicle-bridge coupled vibrations. Earthq. Eng. Eng. Dyn. 2022, 42, 127–137. [Google Scholar]
Figure 1. Excursion train topology map.
Mathematics 12 01221 g001
Figure 2. Vehicle–rail coupling model.
Mathematics 12 01221 g002
Figure 3. Monorail transportation system irregularity spectrum.
Mathematics 12 01221 g003
Figure 4. Geometric dimensions of track beam section (mm).
Mathematics 12 01221 g004
Figure 5. Monorail travel system and measurement point layout map.
Mathematics 12 01221 g005
Figure 6. Comparison of measured and numerically calculated results.
Mathematics 12 01221 g006
Figure 7. Fitted plot of probability distribution of dynamic amplification factors (a) 10 m; (b) 13 m.; (c) 15 m; (d) 17 m; (e) 20 m; (f) 23 m.
Mathematics 12 01221 g007
Figure 10. Dynamic amplification factor comparison chart.
Mathematics 12 01221 g010
Table 1. Existing norms of primary reference.
StandardsCalculationsSignificance of Symbols
Large-scale amusement device safety code
(GB 8408-2018) [16]
1 + μ = 1.2 ( 7.2 < v < 20 ) 1.44 ( 20 < v ) v is velocity, the unit is km/h
Standard for design of straddle monorail transit
(GB 50458-2022) [17]
1 + μ = 1 + 20 50 + L L is the span of a bridge
Code for Design on Railway Bridge and Culvert
(TB10002-2017) [18]
1 + μ = 1 + 28 40 + L L is the span of a simply supported or continuous steel bridge superstructure.
Table 2. Calculation table.
Span/mIrregularity SpectraSpeed
/(km/h)
Speed Differential
/(km/h)
Number of Cases
10Spectrum 1~52.5~402.580
13Spectrum 1~52.5~402.580
15Spectrum 1~52.5~402.580
17Spectrum 1~52.5~402.580
20Spectrum 1~52.5~402.580
23Spectrum 1~52.5~402.580
Table 3. Comparison table of dynamic amplification factors under different methods at 40 km/h.
Span/mFormulaFinite Element ModelStandard for Design of Straddle Monorail Transit (GB 50458-2022)Large-Scale Amusement Device Safety Code (GB 8408-2018)
101.2631.2361.331.44
131.2531.2131.321.44
151.2471.1961.311.44
171.2421.1871.291.44
201.2351.1831.281.44
231.2281.1781.271.44
Disclaimer/Publisher’s Note: The statements, opinions and data contained in all publications are solely those of the individual author(s) and contributor(s) and not of MDPI and/or the editor(s). MDPI and/or the editor(s) disclaim responsibility for any injury to people or property resulting from any ideas, methods, instructions or products referred to in the content.

