
Relationship of Time-Dependent Parameters from Destructive and Non-Destructive Tests of Structural Concrete


1
Department of Structural Mechanics, Faculty of Civil Engineering, VSB—Technical University of Ostrava, L. Podéště 1875, Poruba, 70800 Ostrava, Czech Republic
2
Institute of Building Testing, Faculty of Civil Engineering, Brno University of Technology, Veveří 331/95, 60200 Brno, Czech Republic
*
Author to whom correspondence should be addressed.
Mathematics 2022, 10(3), 460; https://0-doi-org.brum.beds.ac.uk/10.3390/math10030460
Submission received: 31 December 2021
/
Revised: 27 January 2022
/
Accepted: 29 January 2022
/
Published: 30 January 2022
(This article belongs to the Special Issue Selected Papers from the International Conference of Numerical Analysis and Applied Mathematics (ICNAAM))
Abstract
:Reinforced concrete structures are typically exposed to a combination of aggressive substances and mechanical stresses, which contribute to fast degradation. The present research was conducted to evaluate five time-dependent parameters from several different tests, namely compressive strength, static modulus, dynamic modulus, surface, and bulk electrical resistance. Some parameters were obtained using destructive testing (DT) and some using non-destructive testing (NDT). Due to the correlation and calculation of regression curves, it was possible to compare the correlation of parameters important for estimating the durability of reinforced concrete structures in relation to degradation and corrosion. Concrete of C40/50 grade was examined in several time periods, and the parameter relationships were analysed. At the same time, a statistical evaluation was carried out, and therefore the study contains the average values and standard deviations of all measured parameters. The results show that the compressive strength and the electrical resistivity of the surface and bulk have a high correlation. In contrast, the dynamic modulus and electrical resistivity have low linear correlation, but it was possible to apply a quadratic curve with a high degree of fit. For the comparison of static elastic modulus and electrical resistance, the quality of the quadratic regression model was low but sufficient. The results show that, for structural concrete, the presented NDT methods can be used to estimate other parameters obtained from the DT methods.
1. Introduction
Building structures are affected throughout their lifetime by mechanical, dynamic, climatic, and degradation factors [1,2]. All these aspects can, over time, cause the part of the structure to become unsatisfactory in terms of load-bearing capacity or serviceability. Due to this, regular inspections and quality control are some of the basic requirements of the construction industry [3]. In the evaluation of building structures, their current condition is assessed based on appropriately selected diagnostic methods. Currently, the diagnostics of building structures are mainly based on destructive methods. Their use is not always optimal precisely because of the invasive intervention into the structure. Non-destructive tests are a suitable choice for structures diagnostics because they are fast, accurate, and can be repeated [4].
The compressive strength of concrete is one of the most important variables in assessing the quality of a structure and should be viewed as a variable parameter. Thus, the evaluation of the condition of existing structures is performed standardly in core wells and their determination of the present value of strength [5]. There are also many studies dealing with the analysis of the relationship between destructive and non-destructive methods of determining compressive strength and other important parameters. The most commonly used non-destructive method to verify the quality of concrete and determine its compressive strength is the rebound hardness test method [6].
It is also possible to use the ultrasonic evaluation method, which works according to the principle of transmitting ultrasonic waves to the surface of the structure by an exciter and then monitoring the speed of the transmitted pulses [7,8].
The general advantages of non-destructive testing of structures are well known, but the most important are speed and economy. On the contrary, the accuracy of non-destructive tests can be affected by many parameters such as aggregate grain size, concrete age, and water coefficient [9,10,11,12]. Trykoz et al. [13] presented evidence of the importance of non-destructive testing (NDT) measurements in practice in the evaluation of existing concrete structures.
This paper presents a correlation and regression analysis of several concrete parameters obtained during the initial curing stage from 1 to 128 days. The selected parameters can be used as input parameters for the numerical analysis of the durability of reinforced concrete structures subjected to common force and chemical loads [14,15,16,17]. These numerical models are available in both deterministic and stochastic forms, and since they are computationally and time-consuming, an adequate description of the input parameters of the time variables is required. The time-dependent parameters mentioned include compressive strengths, static modulus of elasticity, dynamic modulus of elasticity derived from ultrasonic velocity [18,19], and surface and bulk electrical resistivity [20,21,22], which can be used to determine the chloride diffusion parameter of concrete [23]. In studies, a comparison of the results of the resistivity of the surface and the velocity of the ultrasonic pulse was presented [24,25]. Conventional concrete shows the same values from both methods, even in aggressive environments.
The objective was to evaluate the simplest possible relationship between two selected parameters, that is, a linear regression equation or apply a quadratic regression curve. Due to the introduction of these equations in further calculations, the linear form is preferable, but if it is not accurate, a more complex polynomial must be applied. This paper presents a basic description of the experimental evaluation, statistical and correlation analyses, and the resulting equations, accompanied by the degree of agreement. All of this supports the long-term goals of improving non-destructive testing procedures, using non-traditional instrumentation, and analysing relationships between the results of standardised destructive methods.
2. Materials and Methods
For the analysis of the relationship between destructive and non-destructive methods of concrete testing, a standard concrete based on Portland cement was chosen, with an expected strength class of C40/50. This concrete is used in the Czech Republic, among other things, for the load-bearing elements of reinforced concrete bridge structures [26]. This material was chosen for purely pragmatic reasons, as it is widely used in modern times and is not burdened with any chemical additives or non-standard ingredients. At the same time, this concrete composition is ideal for further extension of research where the effect of change in composition, non-standard admixtures, and others can be analysed.
2.1. Properties of Concrete
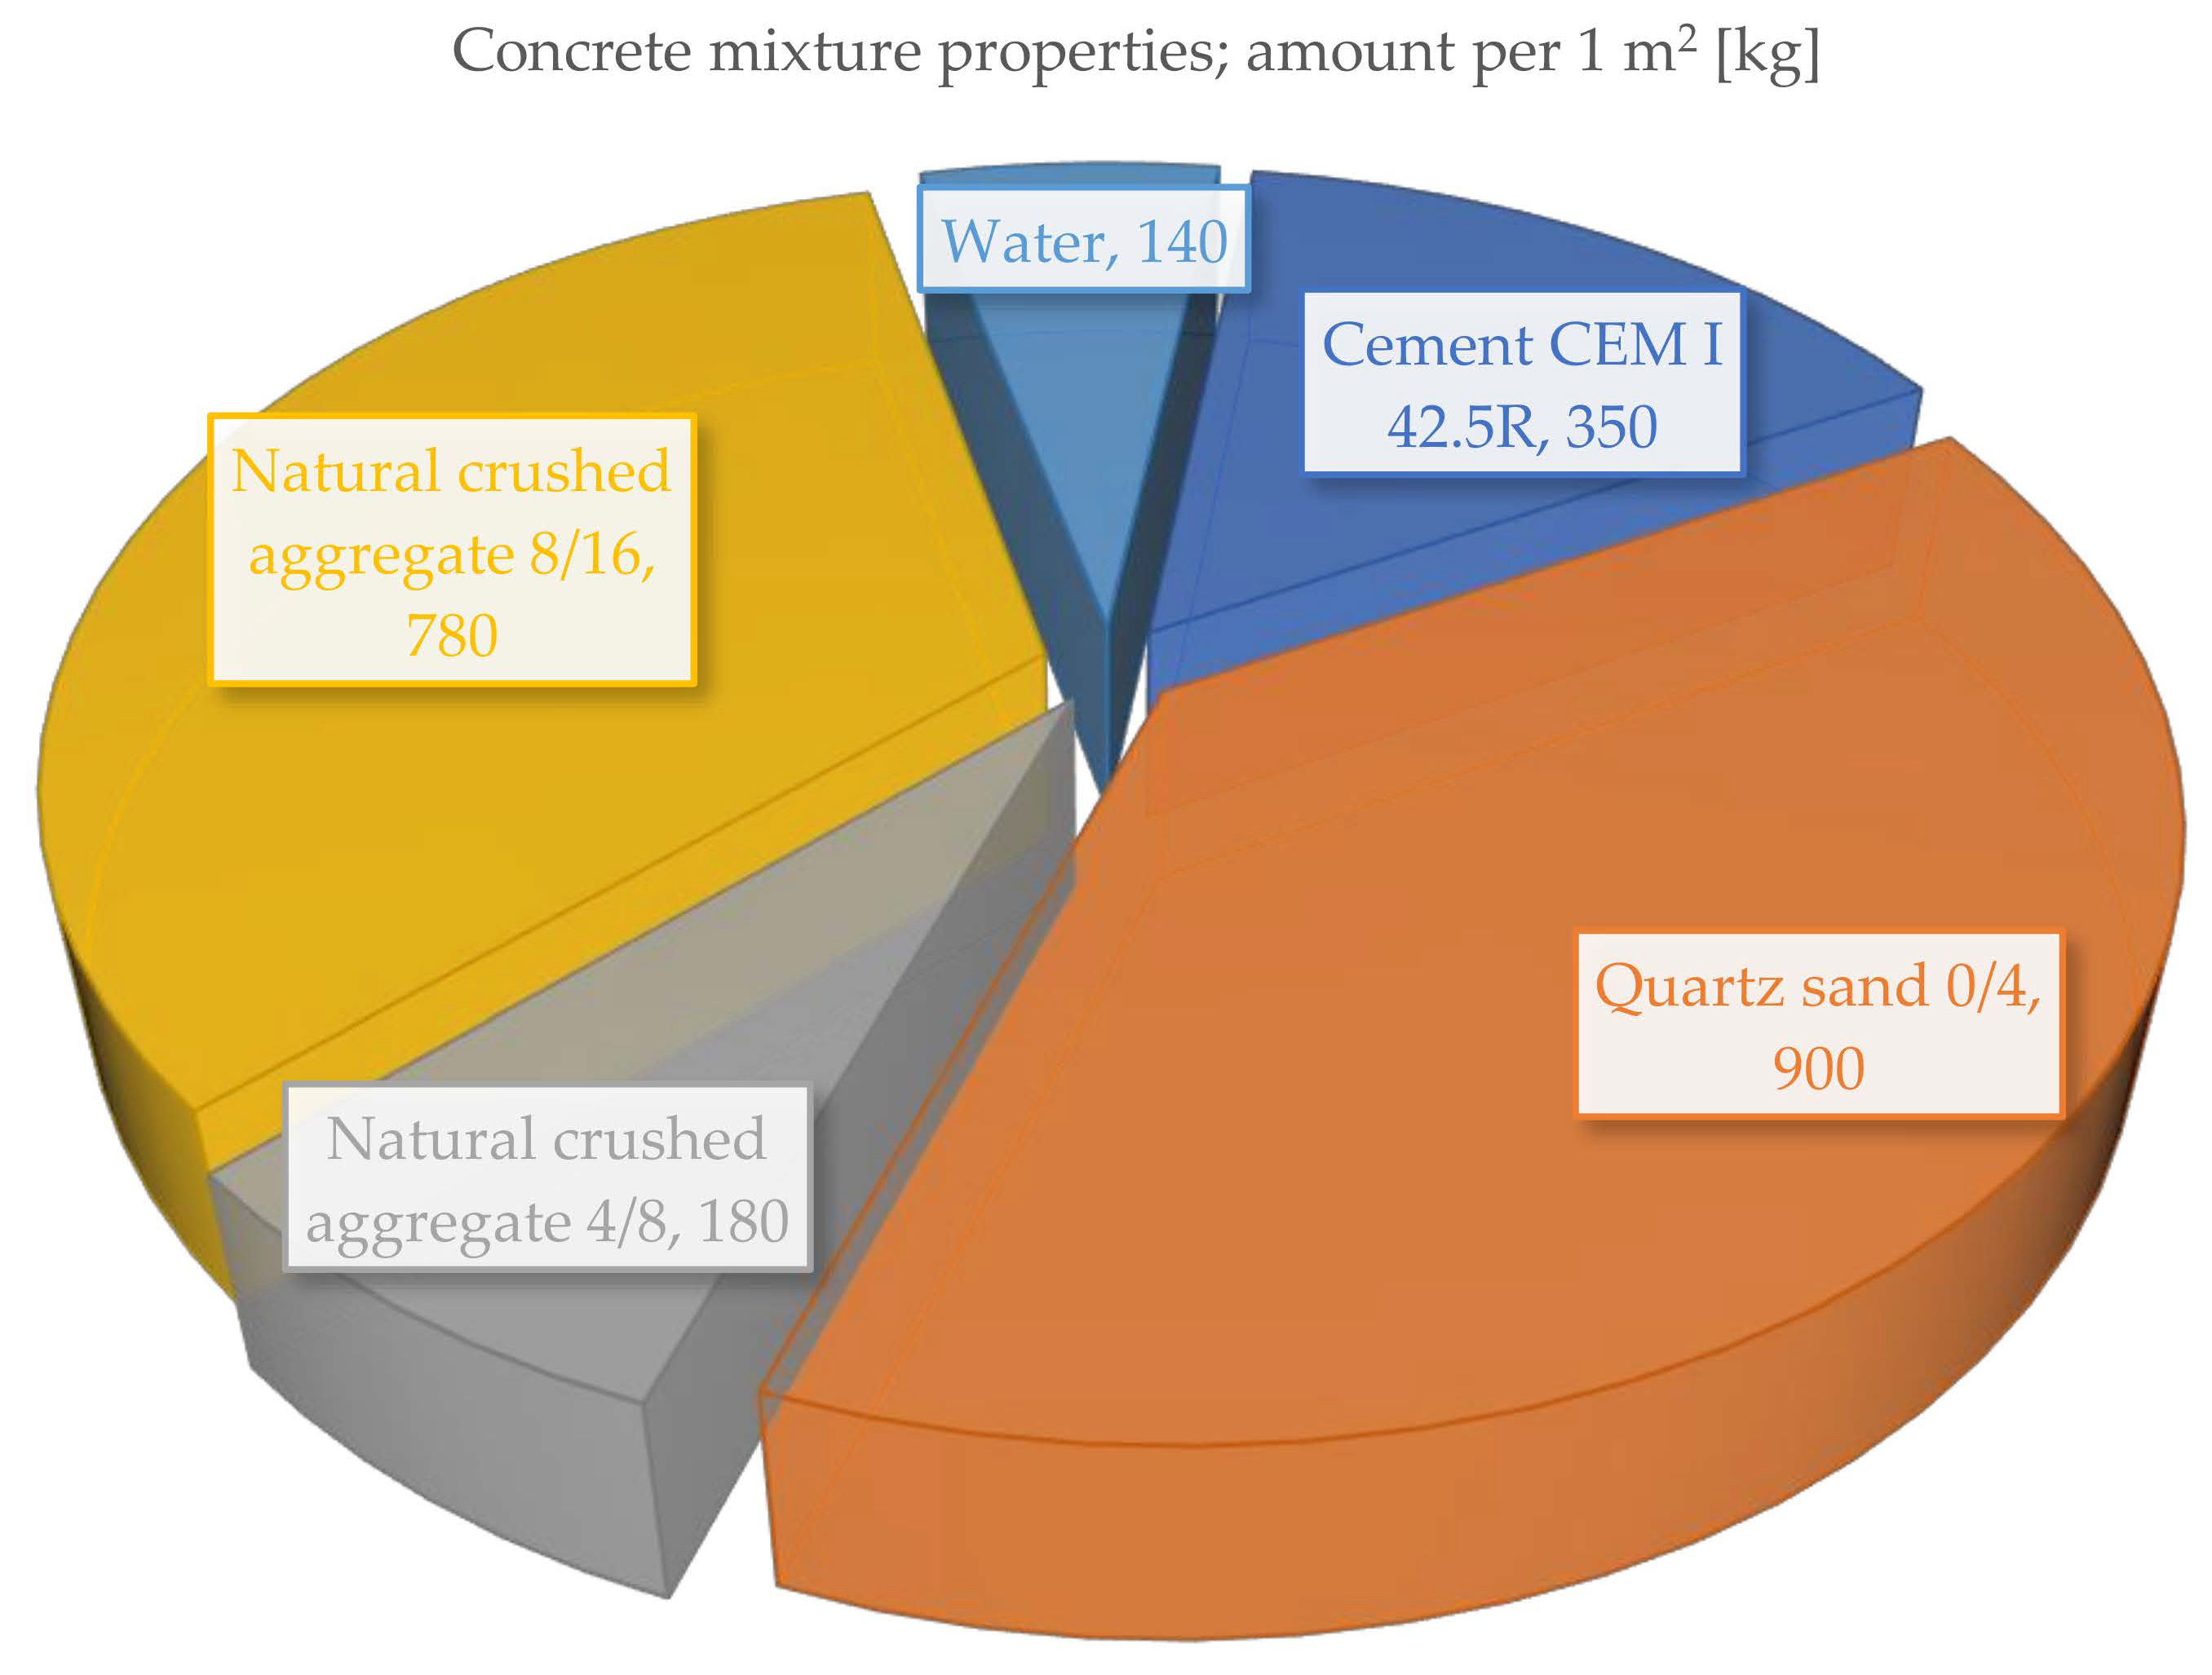
The concrete mixture was prepared according to the practice of EN 206 + A1 [27]. The composition is shown in Figure 1. The requirement was a water coefficient w/c = 0.4 and a strength class of at least C40/50. For the needs of the experimental program, considering the curing of concrete at the time, a larger number of samples were prepared. Cubes with an edge length of 150 mm, large cylinders with a diameter of 150 mm and a length of 300 mm, and small cylinders with a diameter of 100 mm and a length of 200 mm were prepared. The uses of each sample for specific tests are given below. The fresh concrete mix was poured into the moulds, and after an initial curing period of 24 h, the samples were demoulded. The storage of all samples was managed under laboratory conditions to avoid undesirable degradation. The tests were performed 7, 28, 63, and 126 days after concreting. According to standards, it was necessary to use 3 samples for each type of test and each time. Due to this, at least 12 samples for every method were prepared at the beginning. For the non-destructive tests, this need was not present, and the same 3 samples were tested at each time.
2.2. Destructive Testing Methods
For the present research, two standard methods for laboratory testing of concretes were selected, namely a test to determine the compressive strength on cubes and a test to determine the static modulus of elasticity from ultrasonic measurements.
The compressive strength was tested according to EN 12390-3 [28] on three cubes several times-7, 28, 63, and 126 days after concreting. The test was carried out on a standard hydraulic press machine, and the cubic strengths of the concrete were calculated from the maximum force and the load area recorded.
The static modulus of elasticity in the compression of hardened concrete expresses the dependence between the stress and the strain that a given element or structure exhibits under stress. The procedure to determine the static compressive modulus of elasticity for concrete is defined in ISO 1920-10 [29]. The determination of the static modulus of elasticity was carried out by cyclic loading of the test pieces in a press, which was carried out according to EN 12390-13 [30].
2.3. Non-Destructive Testing Methods
Three small cylinders with a diameter of 100 mm and a length of 200 mm and three large cylinders with a diameter of 150 mm and a length of 300 mm were prepared for the NDT methods. Two types of cylinders were chosen to analyse the effect of the shape and size of the sample on the resistivity of the surface.
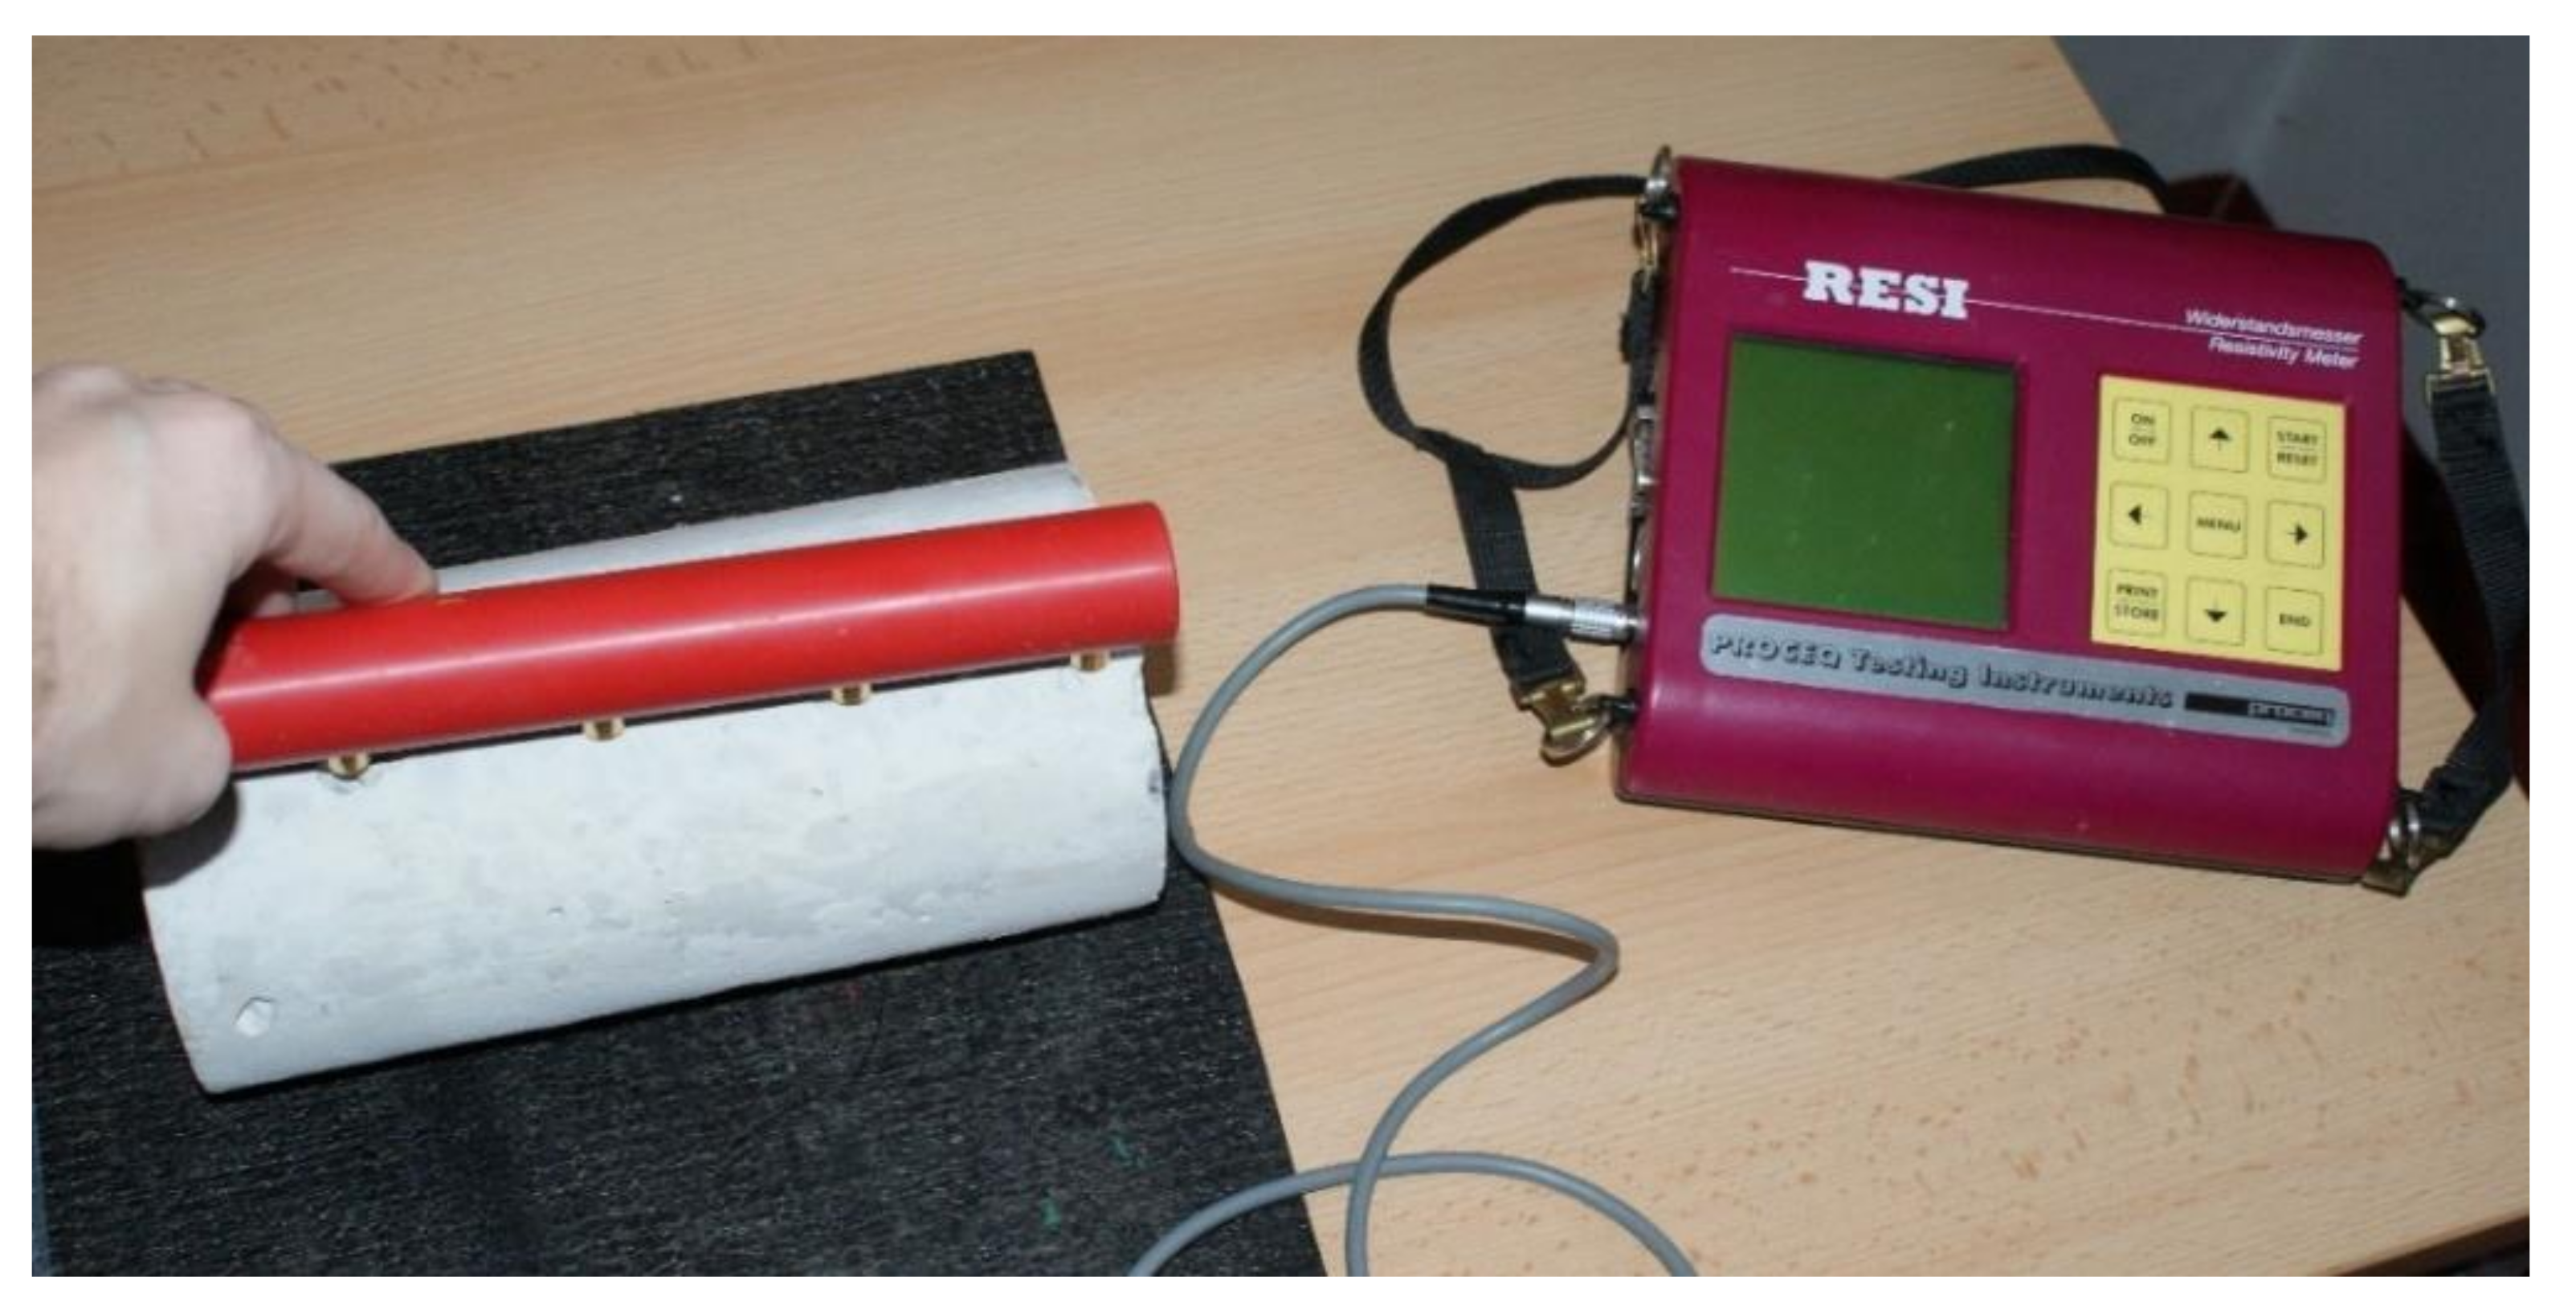
A Wenner probe [31] (see Figure 2) was used to measure the electrical resistivity of the surface. The test was carried out on six cylindrical samples (three small and three large) according to the AASHTO T358 standard [32]. Surface resistance was measured from four longitudinal sides, and then the mean value and standard deviation were determined. The surface resistivity was then converted to an adequate bulk resistivity using a calibration relationship dependent on the dimensions of the sample according to previously published procedures [33].
An rCON meter [34] was used to measure the bulk electrical resistivity. This test was also carried out on six cylindrical samples (three small and three large) according to ASTM C1876 [35].
Furthermore, an ultrasonic pulse method was used to determine the dynamic modulus of elasticity according to EN 12504-4 [7]. The dynamic modulus of elasticity was determined from the bulk density of concrete and the time of ultrasound passage through the sample. The test was performed on three large cylindrical samples.
2.4. Correlation and Regression Analysis
Since all tests were performed on specimens at the same time periods since concreting, the relationship between the results of destructive and non-destructive methods could be analysed. When looking for a relationship between two sets of results, the correlation coefficient can be used at the first level. The presented research shows the Pearson correlation coefficient (PCC), which is one of the most widely used [36]. The PCC shows the degree of linear correlation between two sets of data. If the value is close to 1 (or −1) there is a possible high linear correlation (positive for +1 and negative for −1). On the other hand, if it approaches 0, it is not possible to talk about a linear correlation. PCC provides a basic view of the data sets but can definitely help for further analysis.
The next step in assessing the relationship between the selected outcomes was to introduce a point set consisting of one set of data on the X-axis and another set of data related to the same time on the Y-axis. The points depicting the measured values were then fitted with a line segment showing the standard deviation.
This procedure then allows the search for a linear regression equation or, if the fit is low, a quadratic regression equation that uses a parabola [37]. In either case, it is necessary to evaluate graphically and mathematically how closely the line or parabola fits the set of measured values. The coefficient is useful to determine the best fit [38]. The coefficient of determination shows the fit between the measured values and the chosen curve. The limits for R2 are varied. For example, a value of 0.82 to 1 is reported to indicate a very strong fit, a value of 0.5 to 0.81 is a strong fit, and lower values are moderate or weak fits [39]. Therefore, the value of 0.8 was chosen as the boundary where linear correlation is sufficient, and there is no need to look for a quadratic equation.
3. Results
The following sections show the results of all measurements and then the individual correlations and regressions on the 10 pairs of results. The graphs contain a mathematical description of the linear or quadratic regression curve and the values of R2. Further analysis of the results was performed at the level of application of linear regression and best-fit analysis using the coefficient of determination. In case of low agreement, quadratic regression was applied.
3.1. Time-Dependent Results
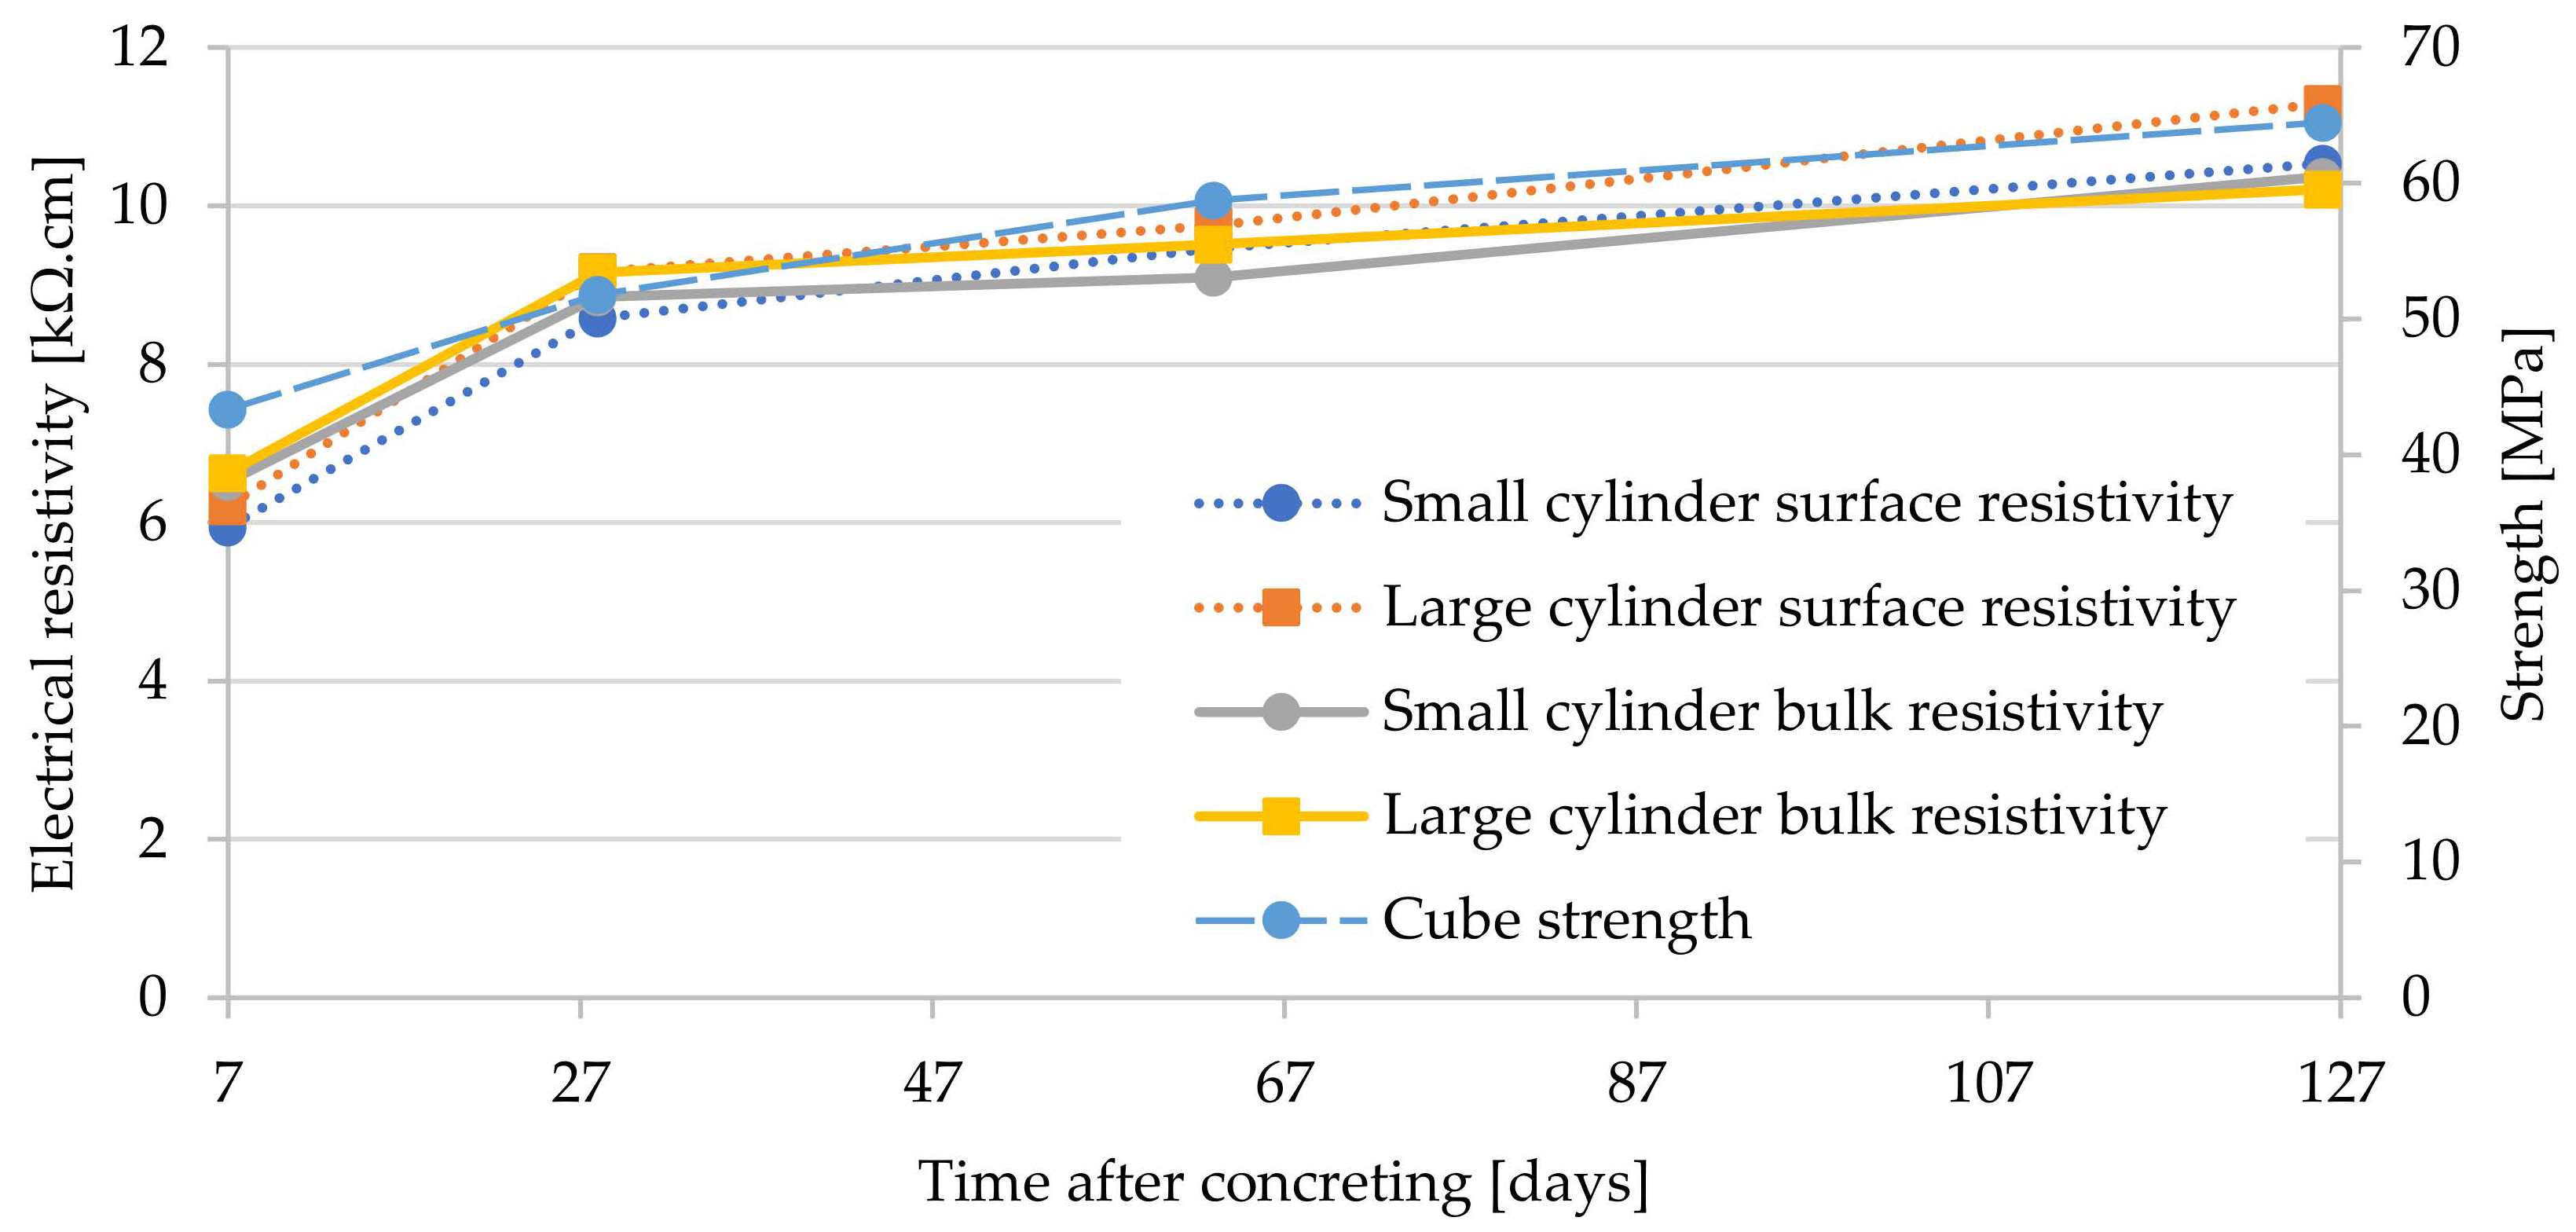
Due to the chosen procedure of measuring all parameters in several time steps, it is possible to display the results together on one graph and look for primary relationships. Figure 3 shows the graph for the electrical resistivity measured in small and large cylinders from both surface and bulk instruments. The same graph in the figure also shows a plot of the increase in compressive strength values on the cubes. The first view foreshadows a relationship that could be further evaluated.
The next graph (Figure 4) again shows the same electrical resistivity values but adds the static and dynamic modulus values at the given times. The literature indicates that the static modulus corresponds to approximately 60% of the dynamic modulus [40]. This fact is also observed here.
The Pearson correlation coefficient described above was chosen as the first numerical result of the analysis. Table 1 shows the results of this coefficient for each pair of results. It can be seen that the electrical resistivity has an almost 100% correlation when comparing surface and bulk measurements. The correlation between compressive strength and electrical resistance ranges from 0.94 to 0.96. The other correlations are at or below 0.8.
3.2. Bulk and Surface Electrical Resistivity
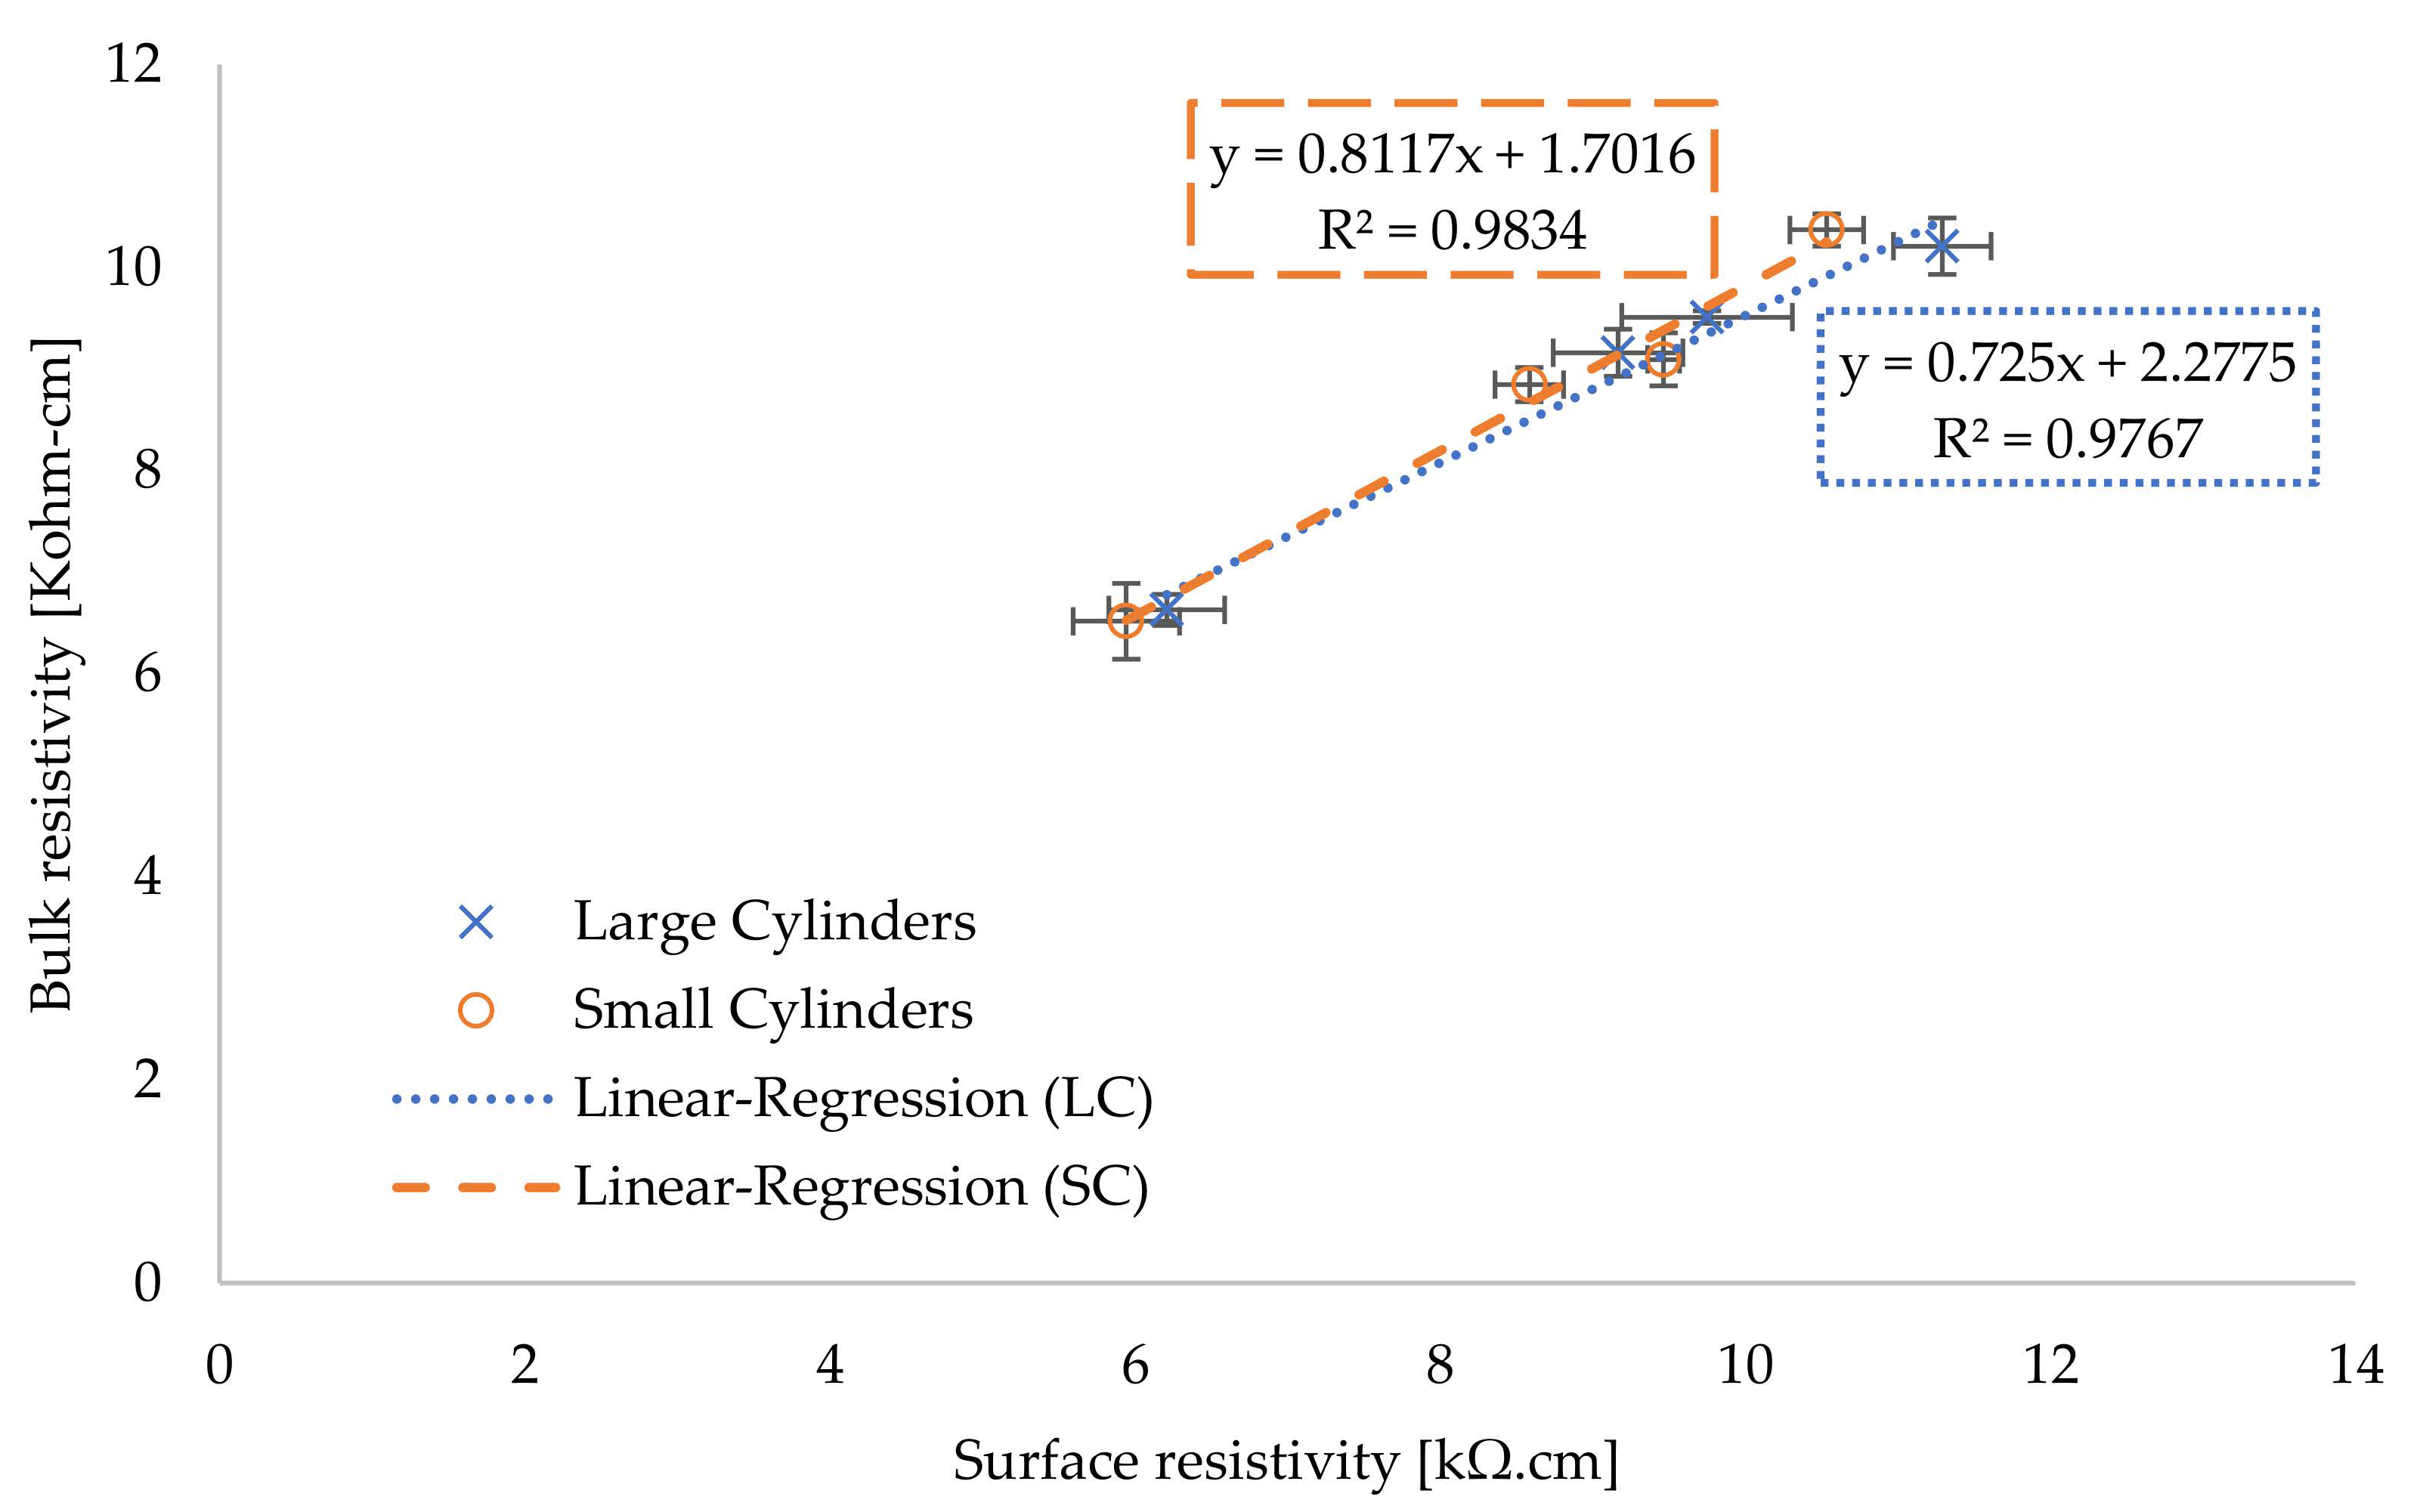
For the first results, i.e., surface and bulk electrical resistivity on small and large cylinders, a high agreement for linear dependence can be observed (see Figure 5). The results show that it is not necessary to look for discrepancies in the Wenner probe and rCon measurements for the prepared concrete type. Therefore, only the bulk resistivities were used for further evaluation.
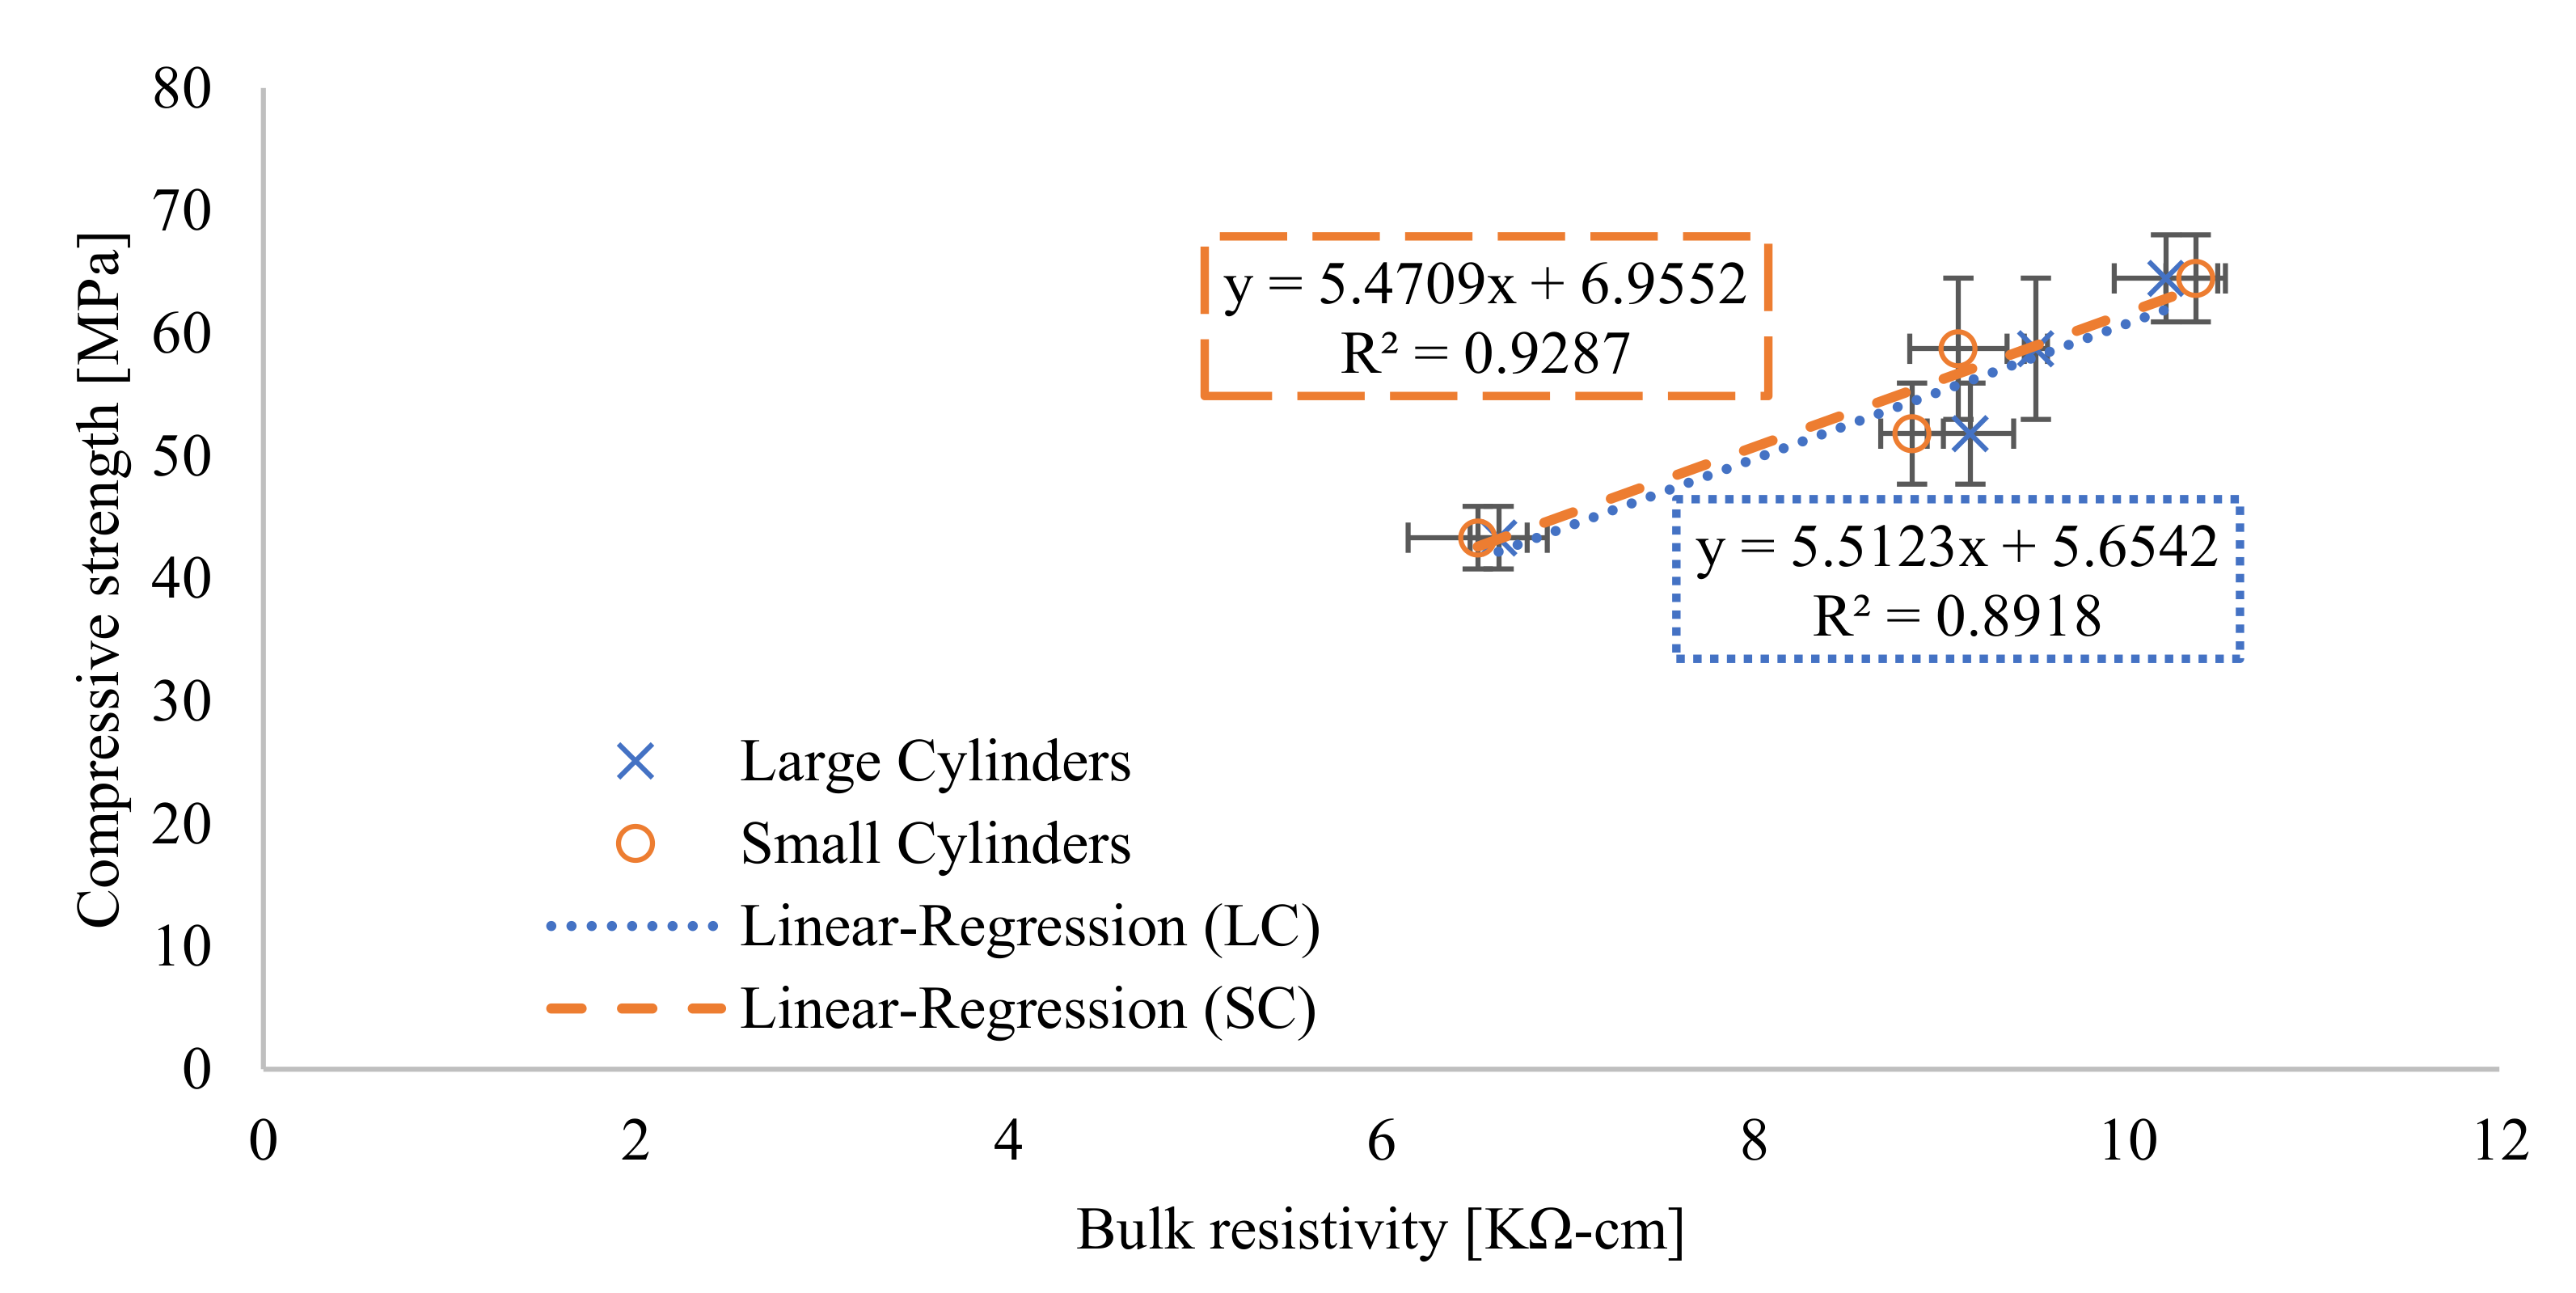
3.3. Compressive Strength vs. Electrical Resistivity
The relationship between the concrete strength obtained from the cubic test and the electrical resistivity measured in large and small cylinders using linear regression is shown in Figure 6. The coefficient of determination values for both sets are high, 0.89 for the large cylinders and up to 0.93 for the small cylinders. Thus, it can be concluded that the time dependence of both parameters is almost linear, which supports the electrical resistivity measurement as an alternative NDT method for determining the compressive strength of concrete. It is possible to use linear regression curves for numerical modelling.
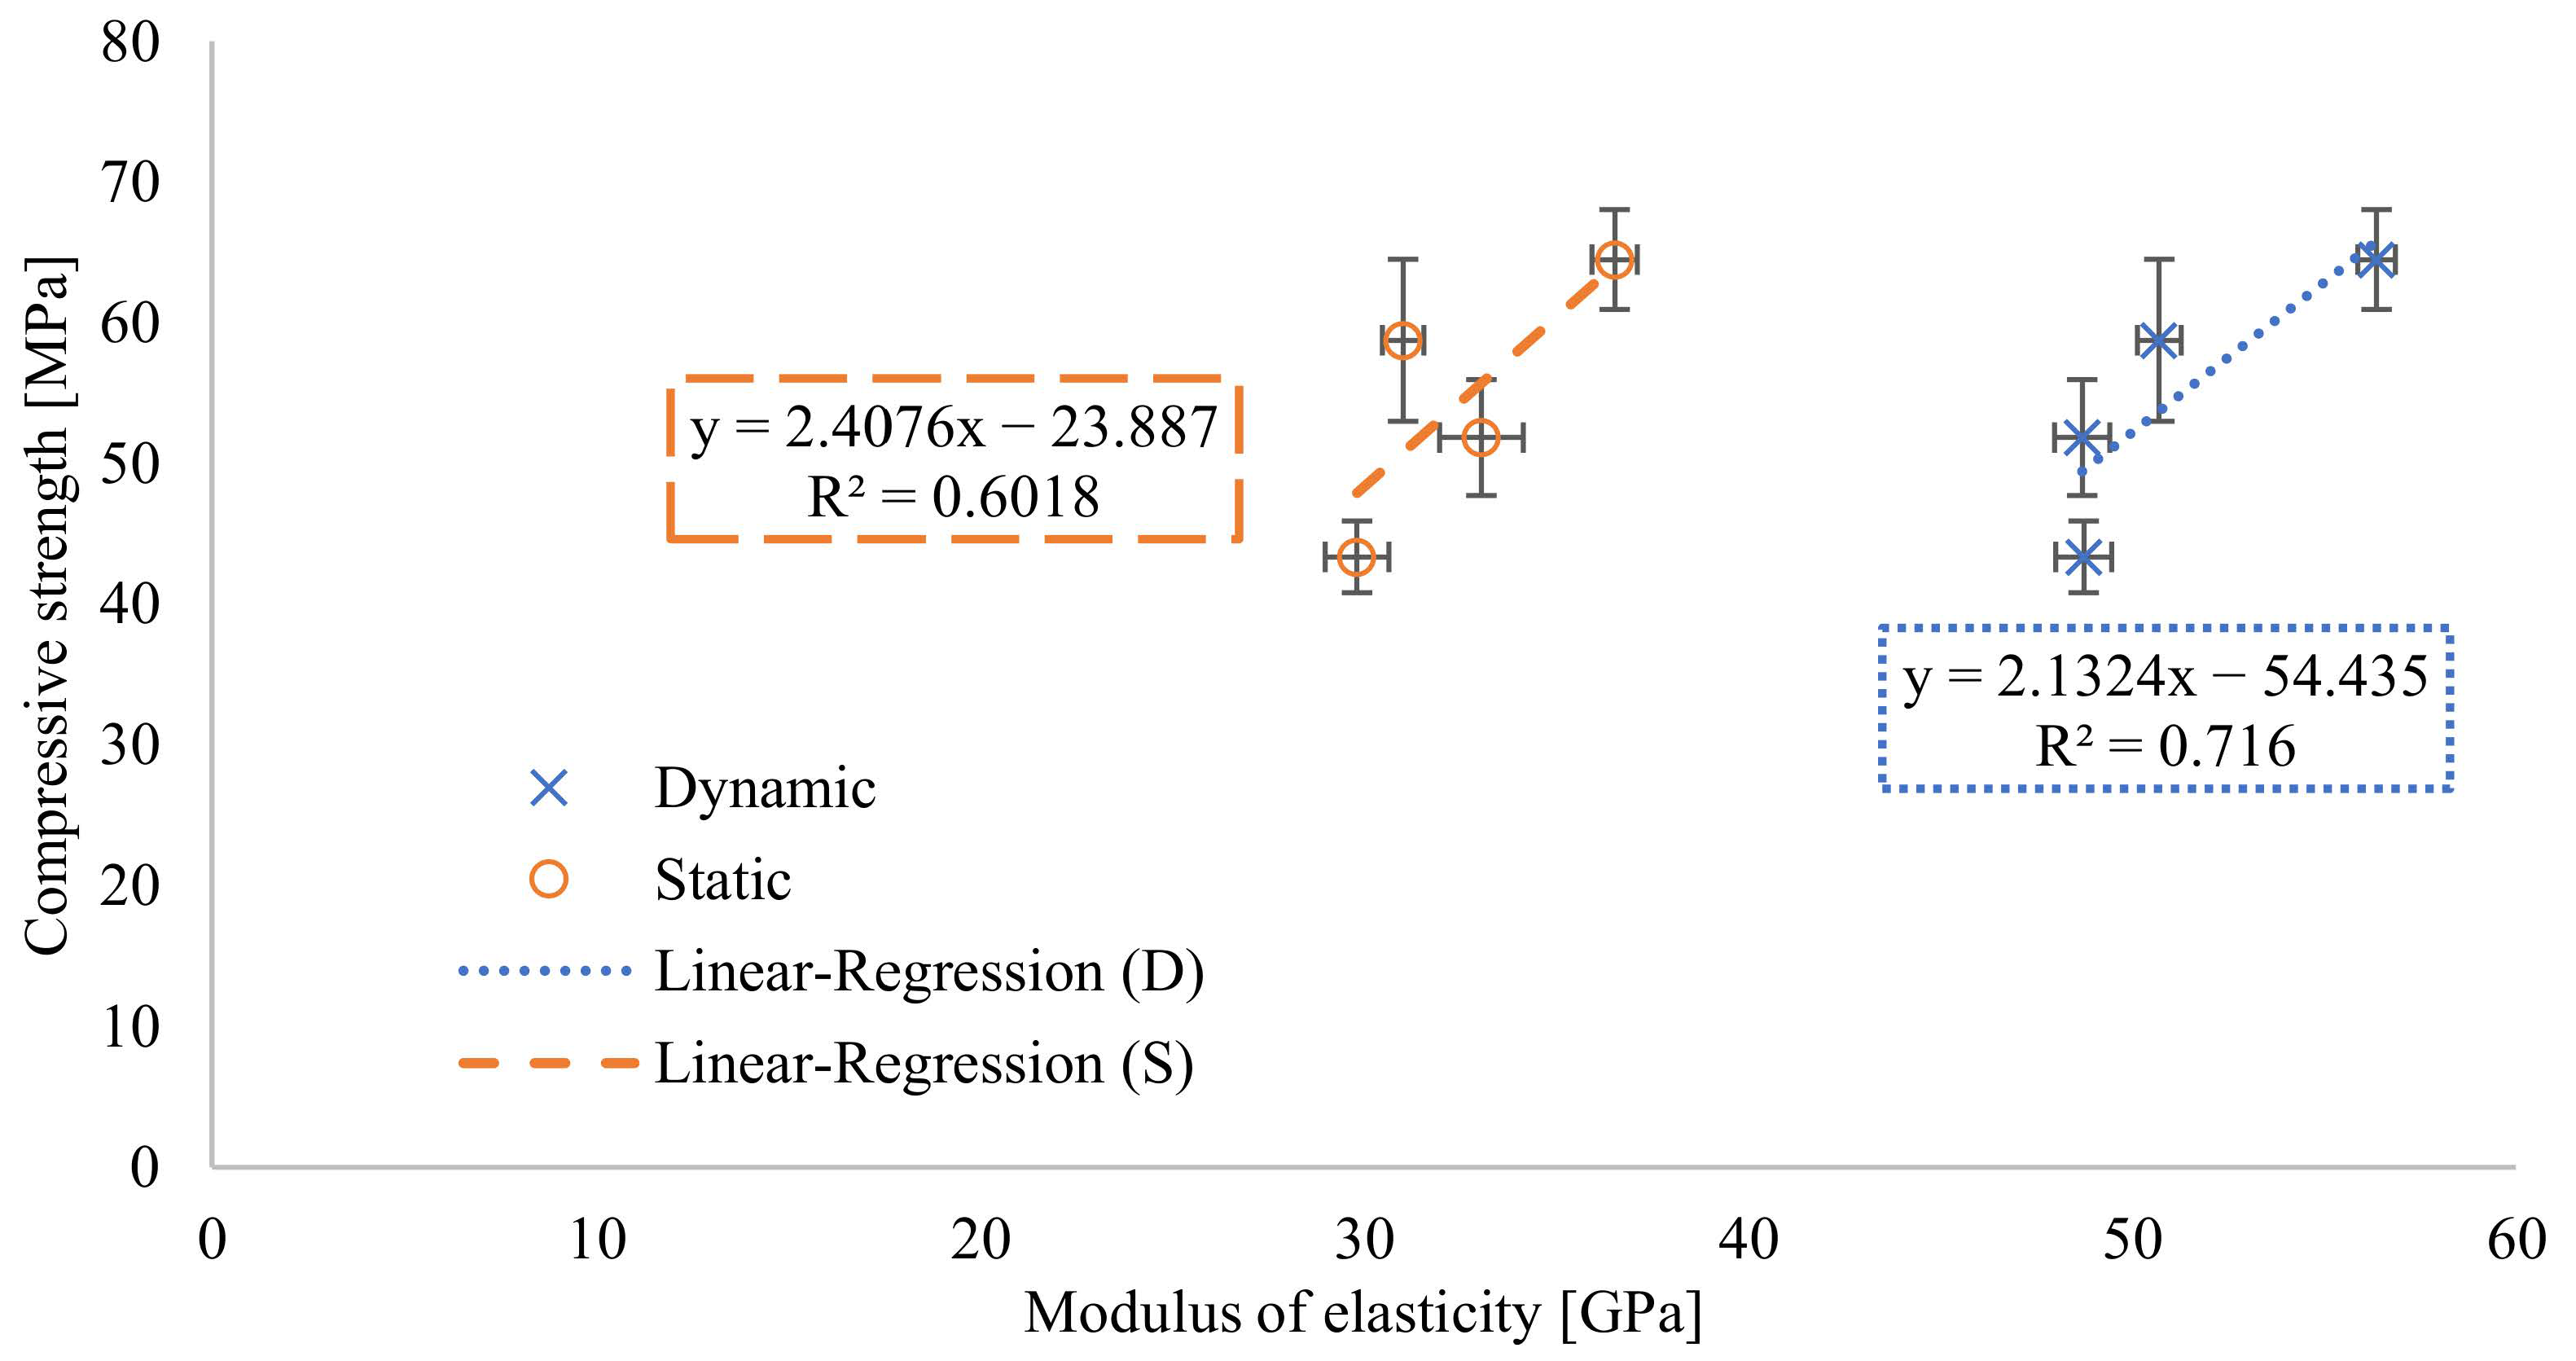
3.4. Compressive Strength vs. Modulus of Elasticity
The relationship between compressive strength and modulus of elasticity was also investigated. Both the static modulus obtained from destructive testing (DT) and the dynamic modulus obtained from NDT ultrasonic propagation velocity testing were evaluated. Figure 7 shows the plots for the linear regression between the parameters. The coefficient of determination has medium values.
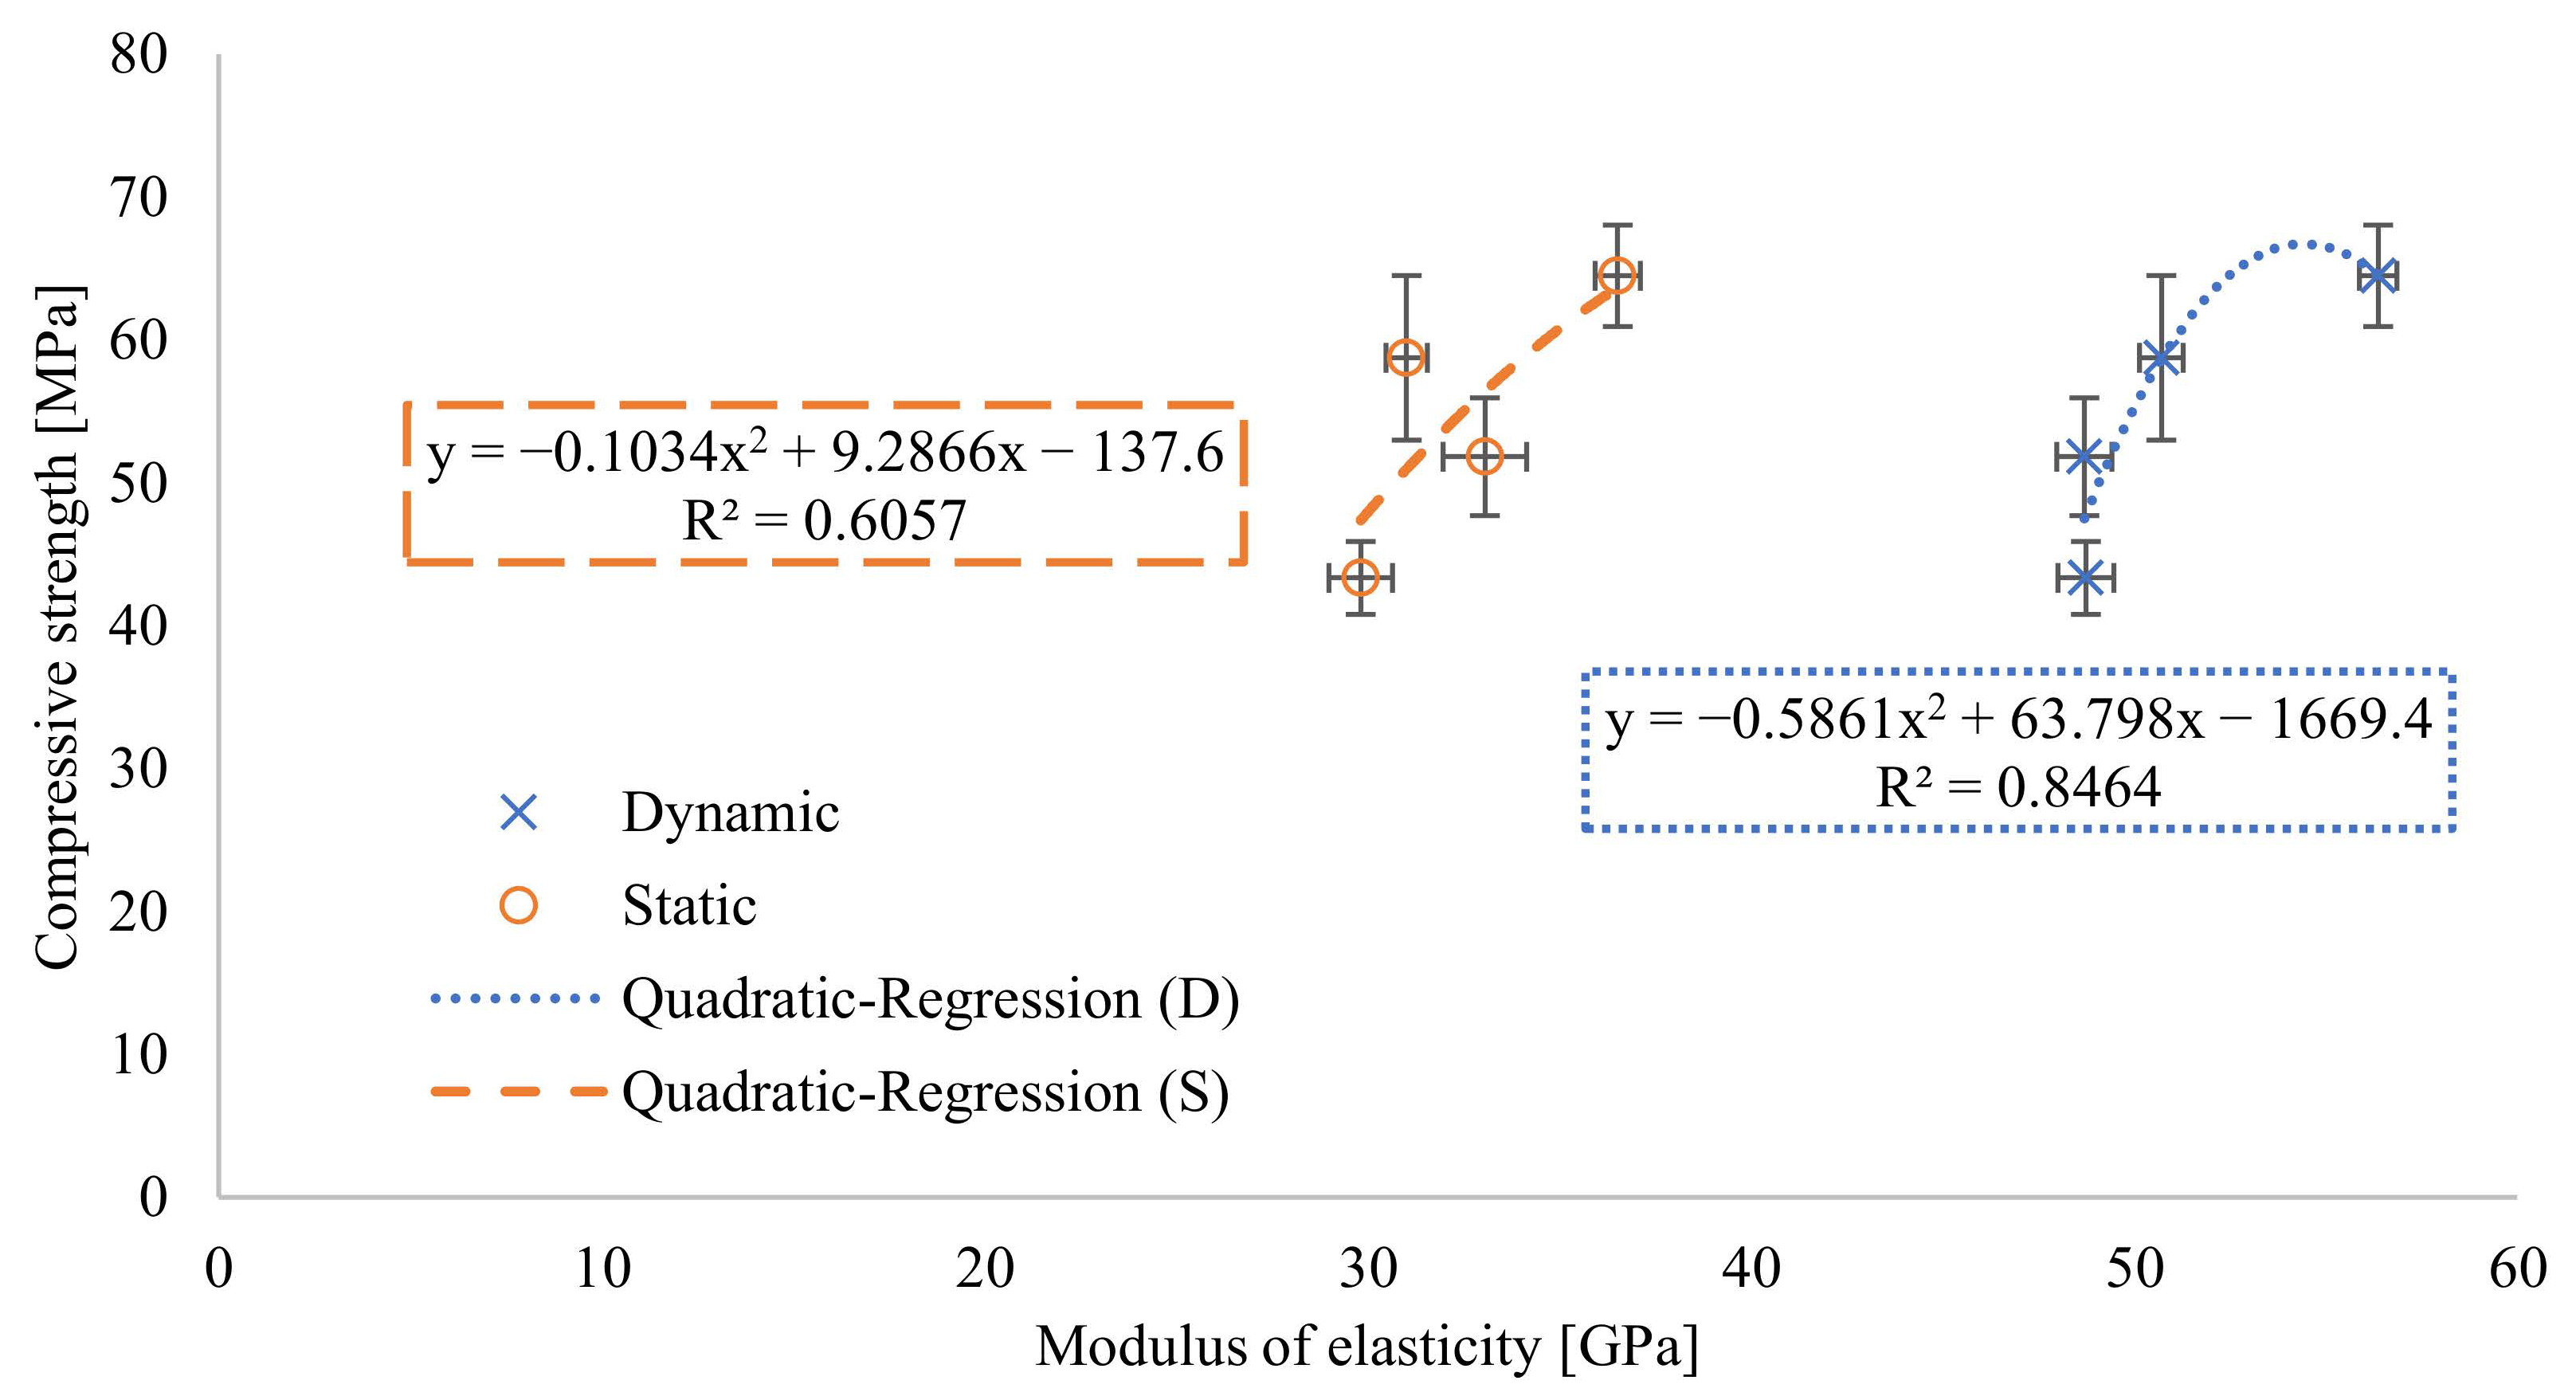
Therefore, the quadratic regression and its fit to both sets of assessed results were analysed (see Figure 8). The relationship between the static modulus and the compressive strength of the concrete also shows the divergence in this case, which is probably due to the non-uniform behaviour of the static modulus over time. On the other hand, when the quadratic curve is applied to the pair of compressive strength and dynamic modulus, the value of the coefficient of determination is 0.85, again showing high agreement.
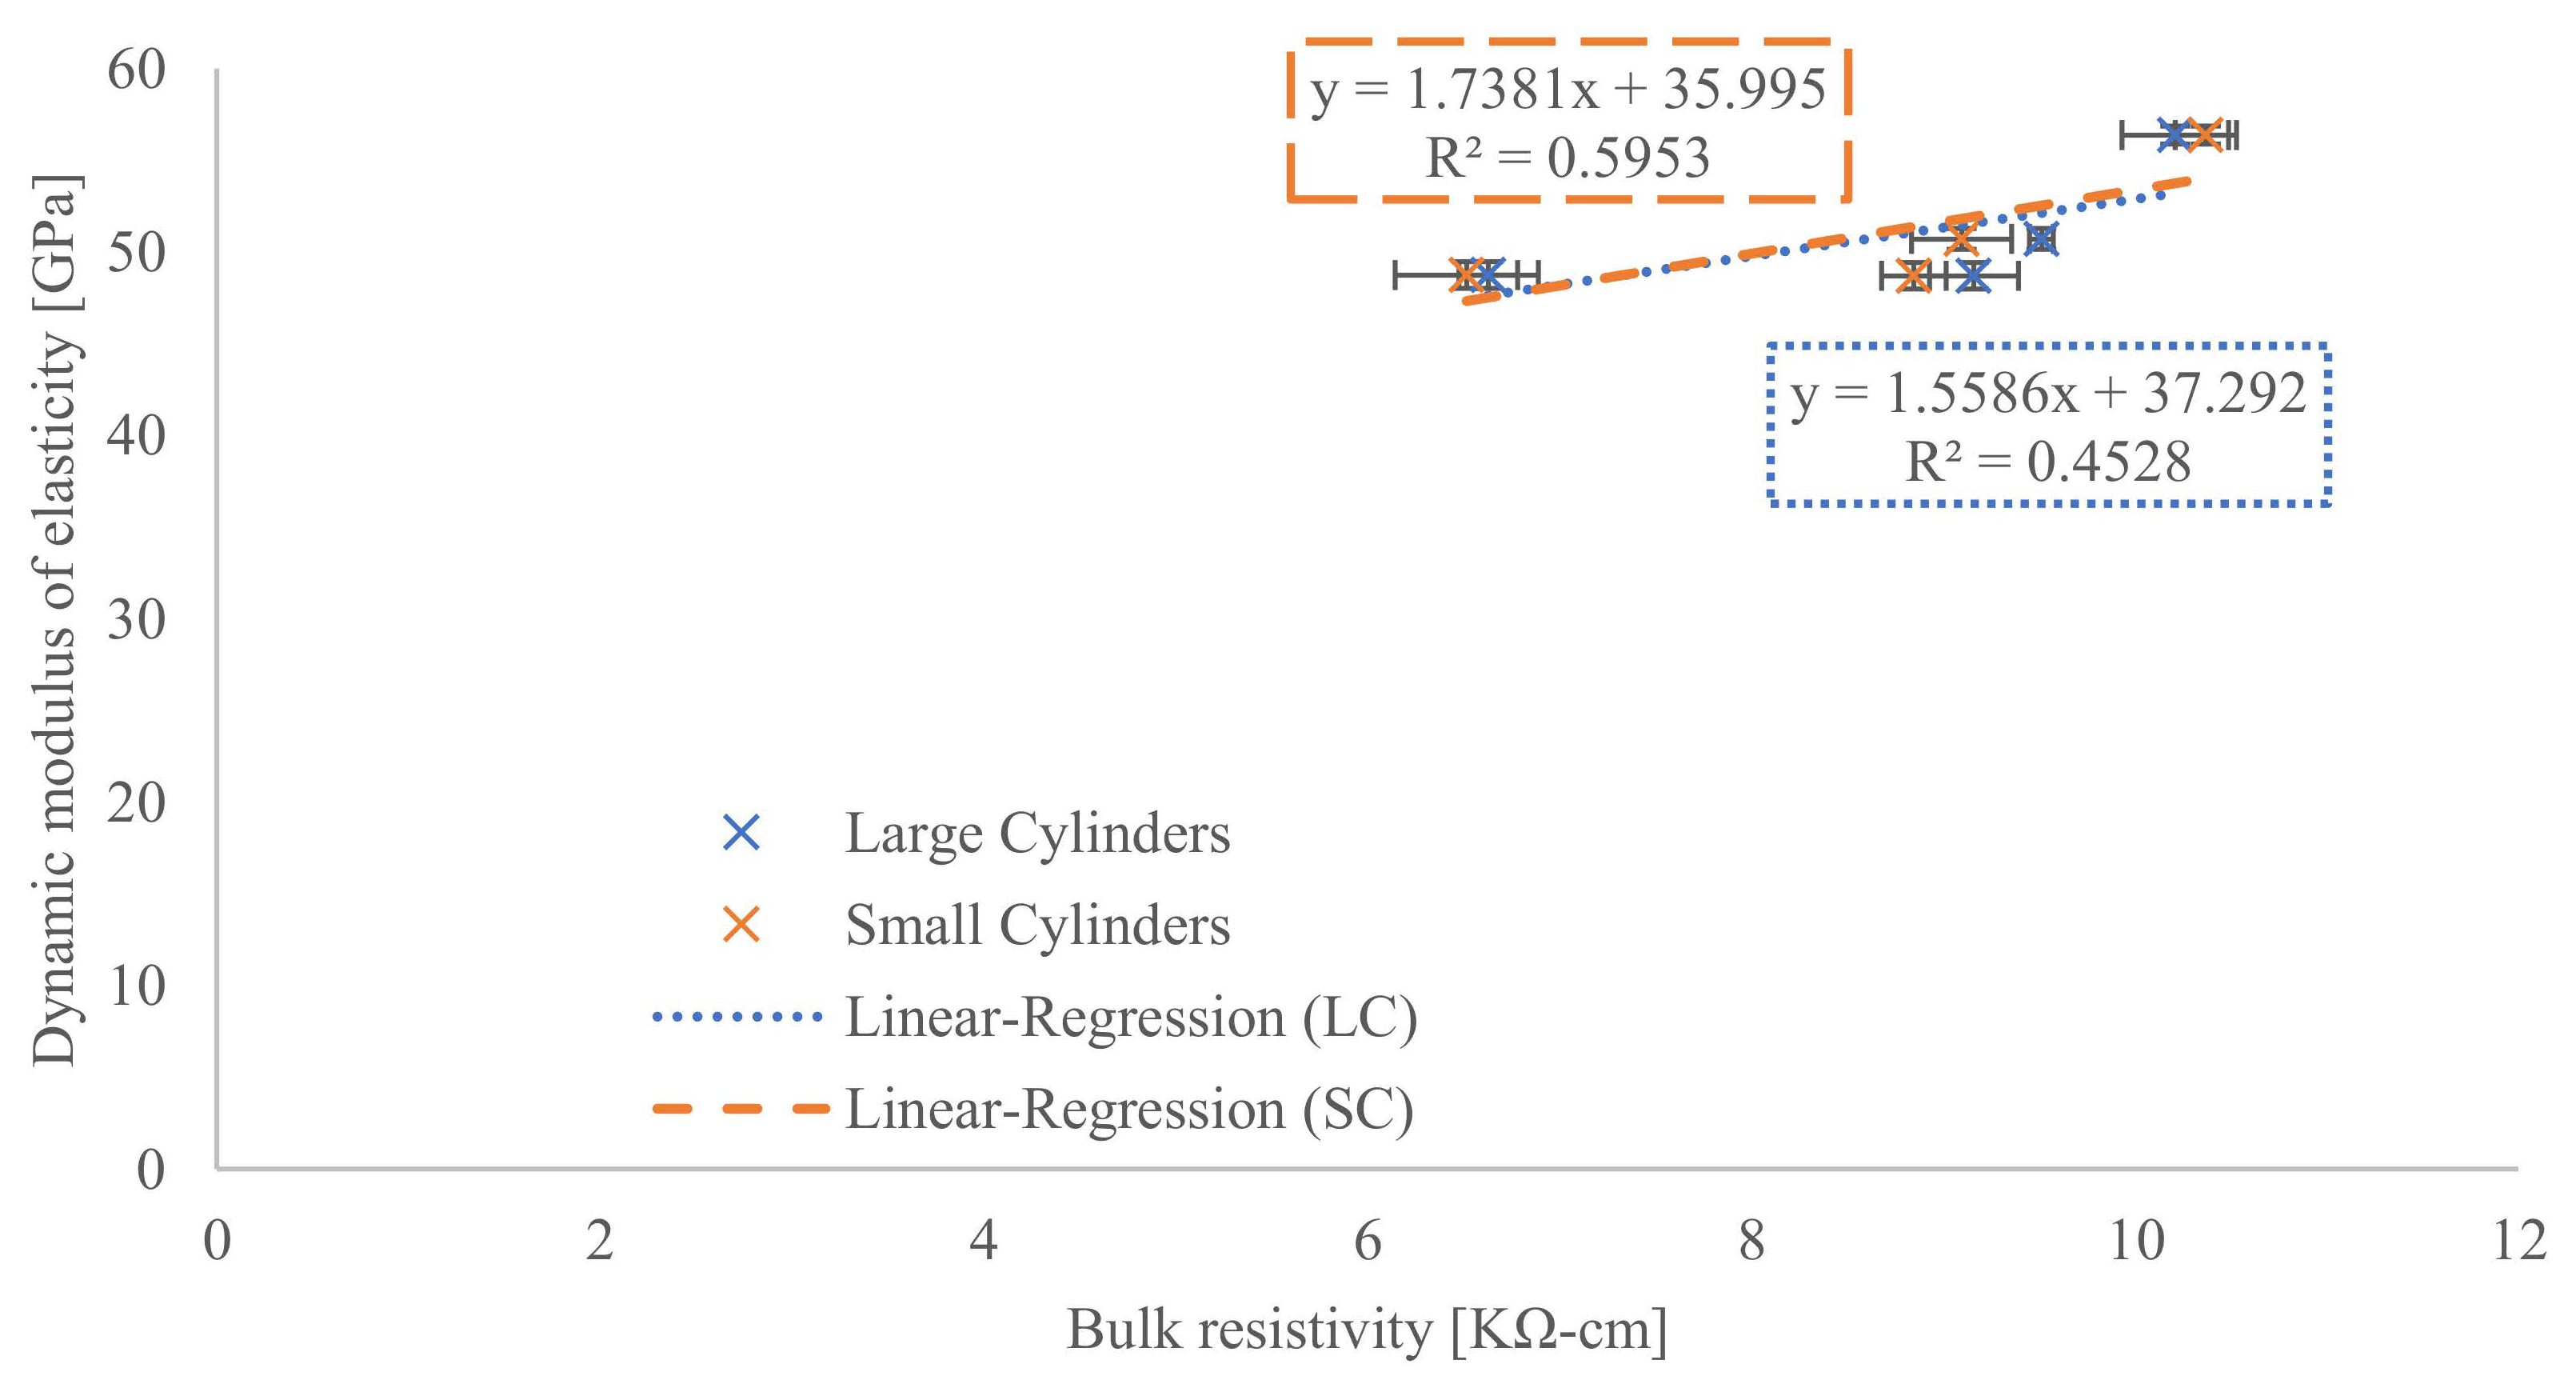
3.5. Dynamic Modulus of Elasticity vs. Electrical Resistivity
The overall evaluation included the analysis of two sets of results from NDT measurements, namely, dynamic modulus of elasticity derived from ultrasonic velocity and electrical resistivity. Linear regression is prepared in Figure 9 for the combination of large and small cylinders that were used for the electrical resistance measurements. The values of the coefficients of determination are low, below 0.6, so it can be concluded that there is a small linear relationship.
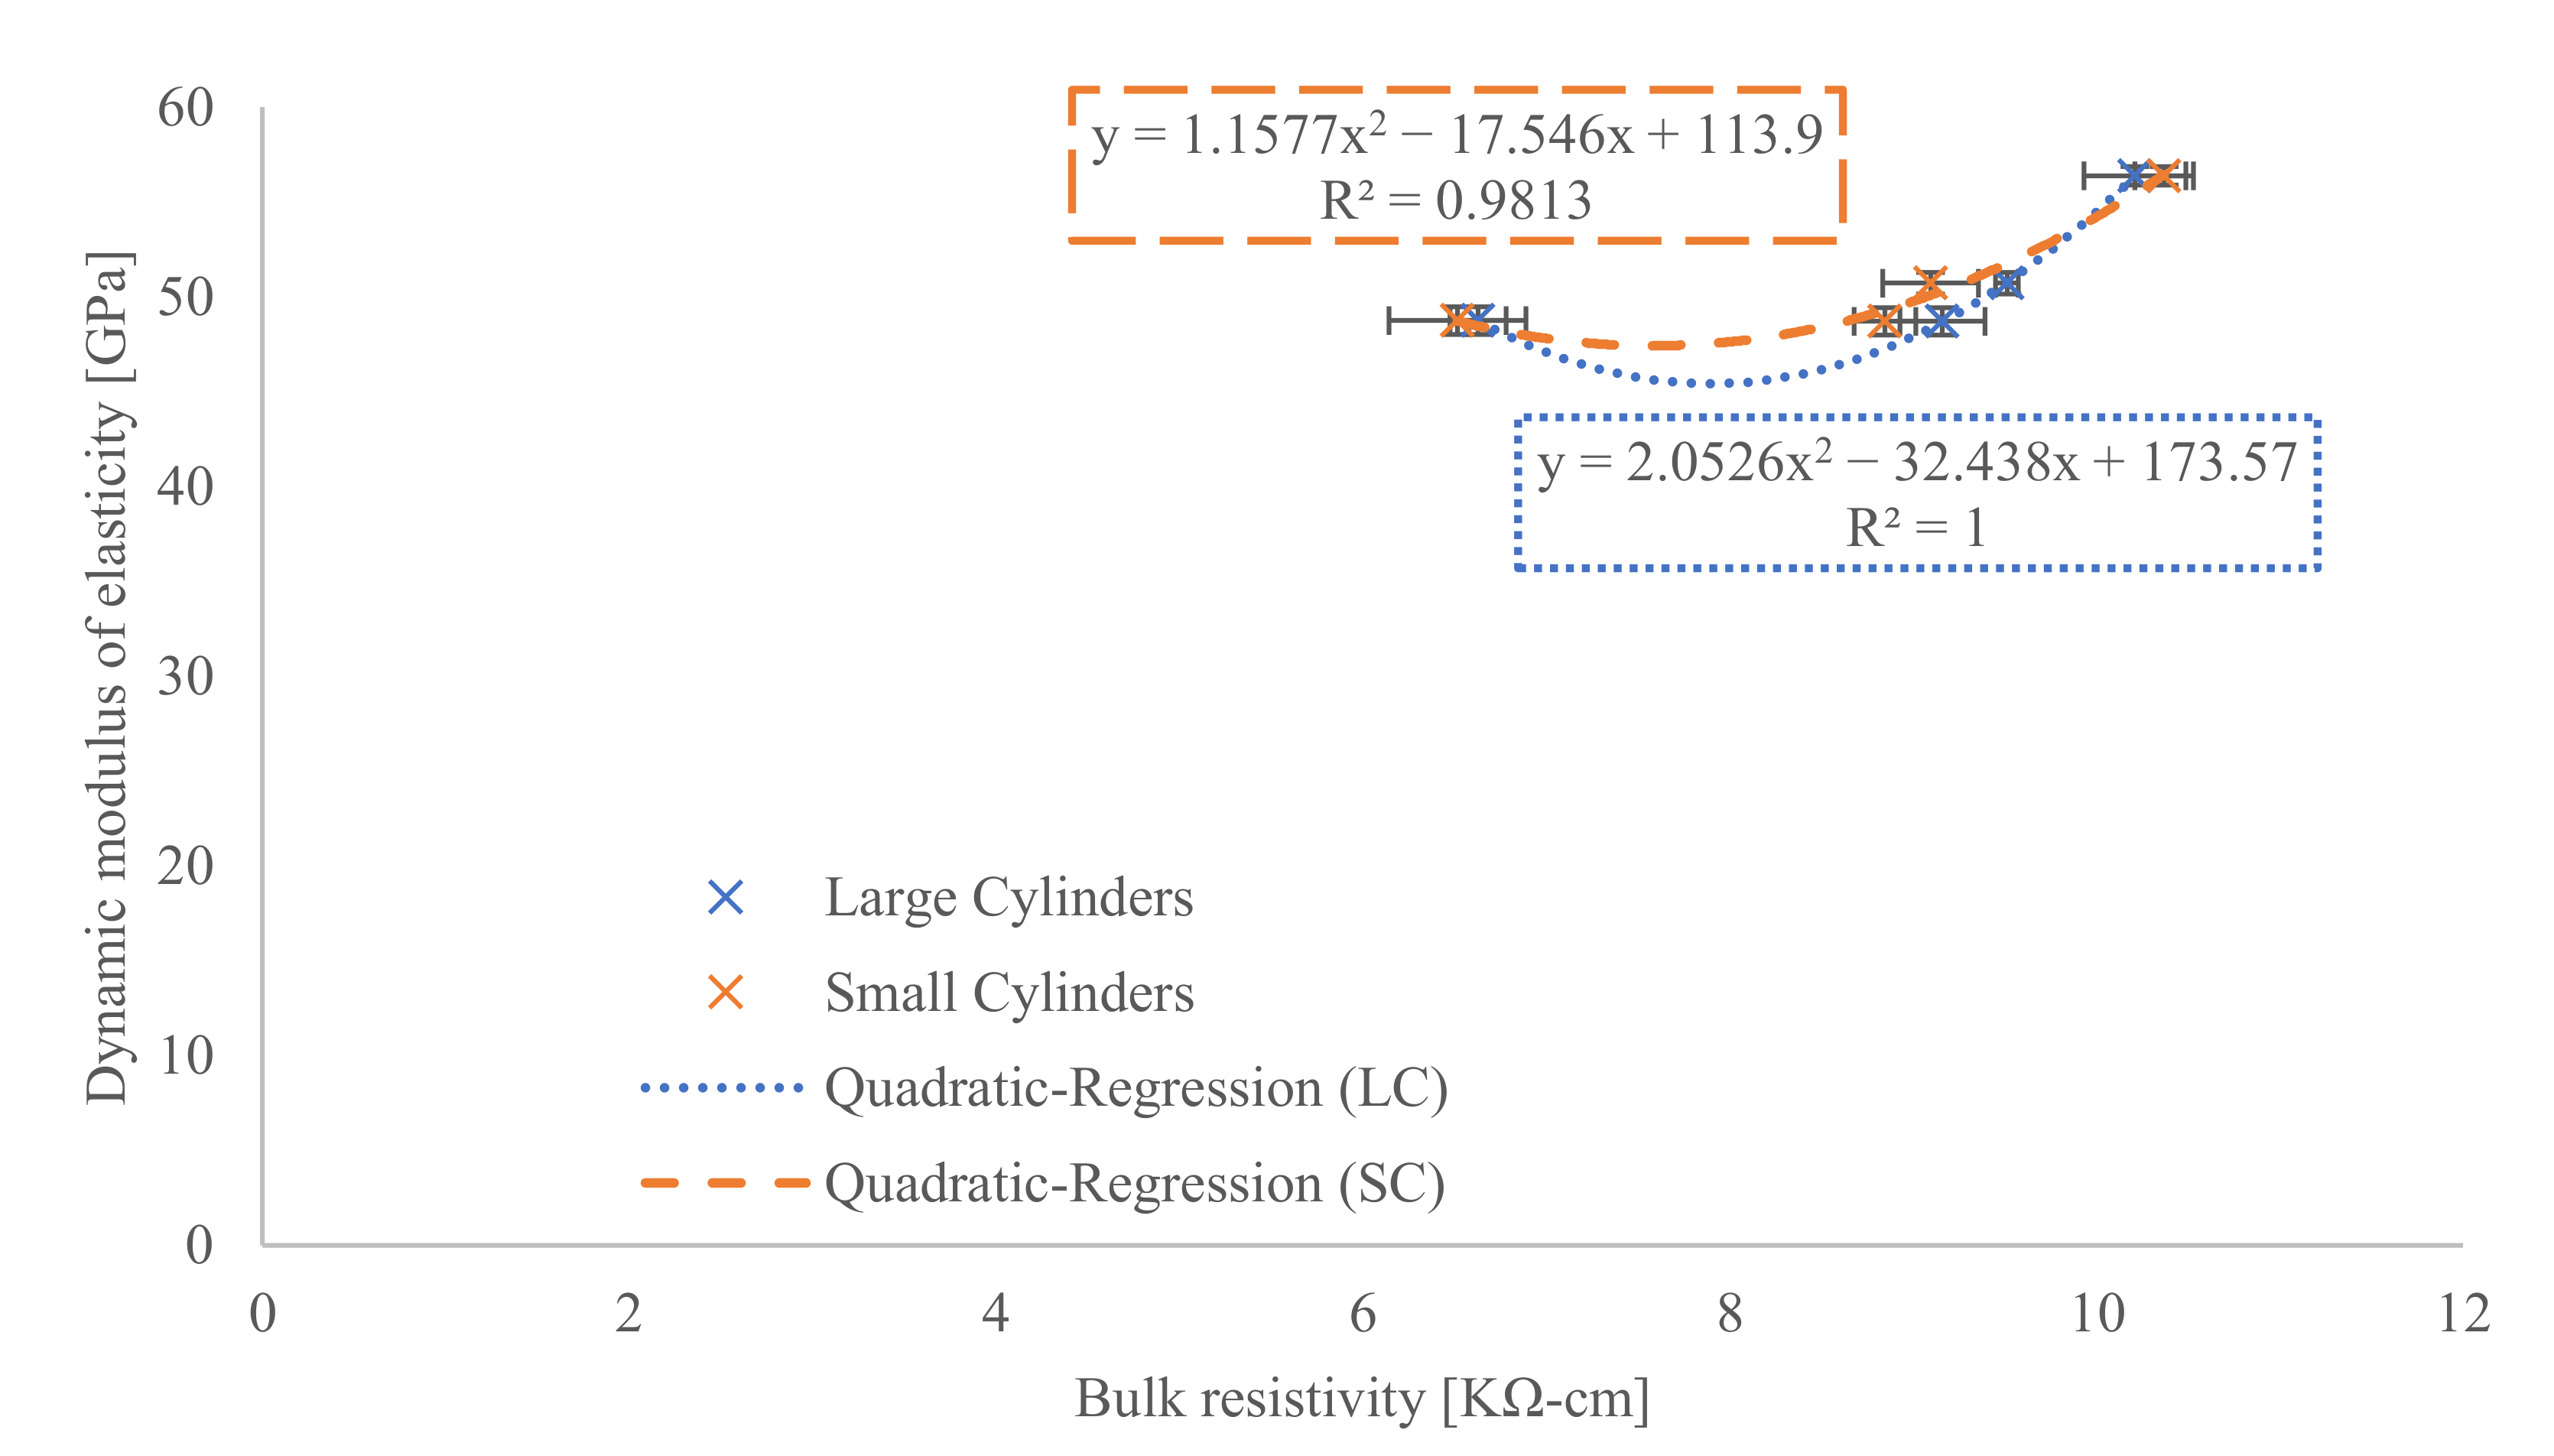
As in the previous case, the next step was to apply a quadratic regression curve, which could show a higher fit. Thus, in Figure 10, it can be seen that, indeed, the quadratic regression provides unexpectedly high goodness of fit for both cases. Thus, the change in the measured electrical resistivity and ultrasonic velocity parameters is highly similar over time and can be alternated for the concrete type evaluated here.
3.6. Static Modulus of Elasticity vs. Electrical Resistivity
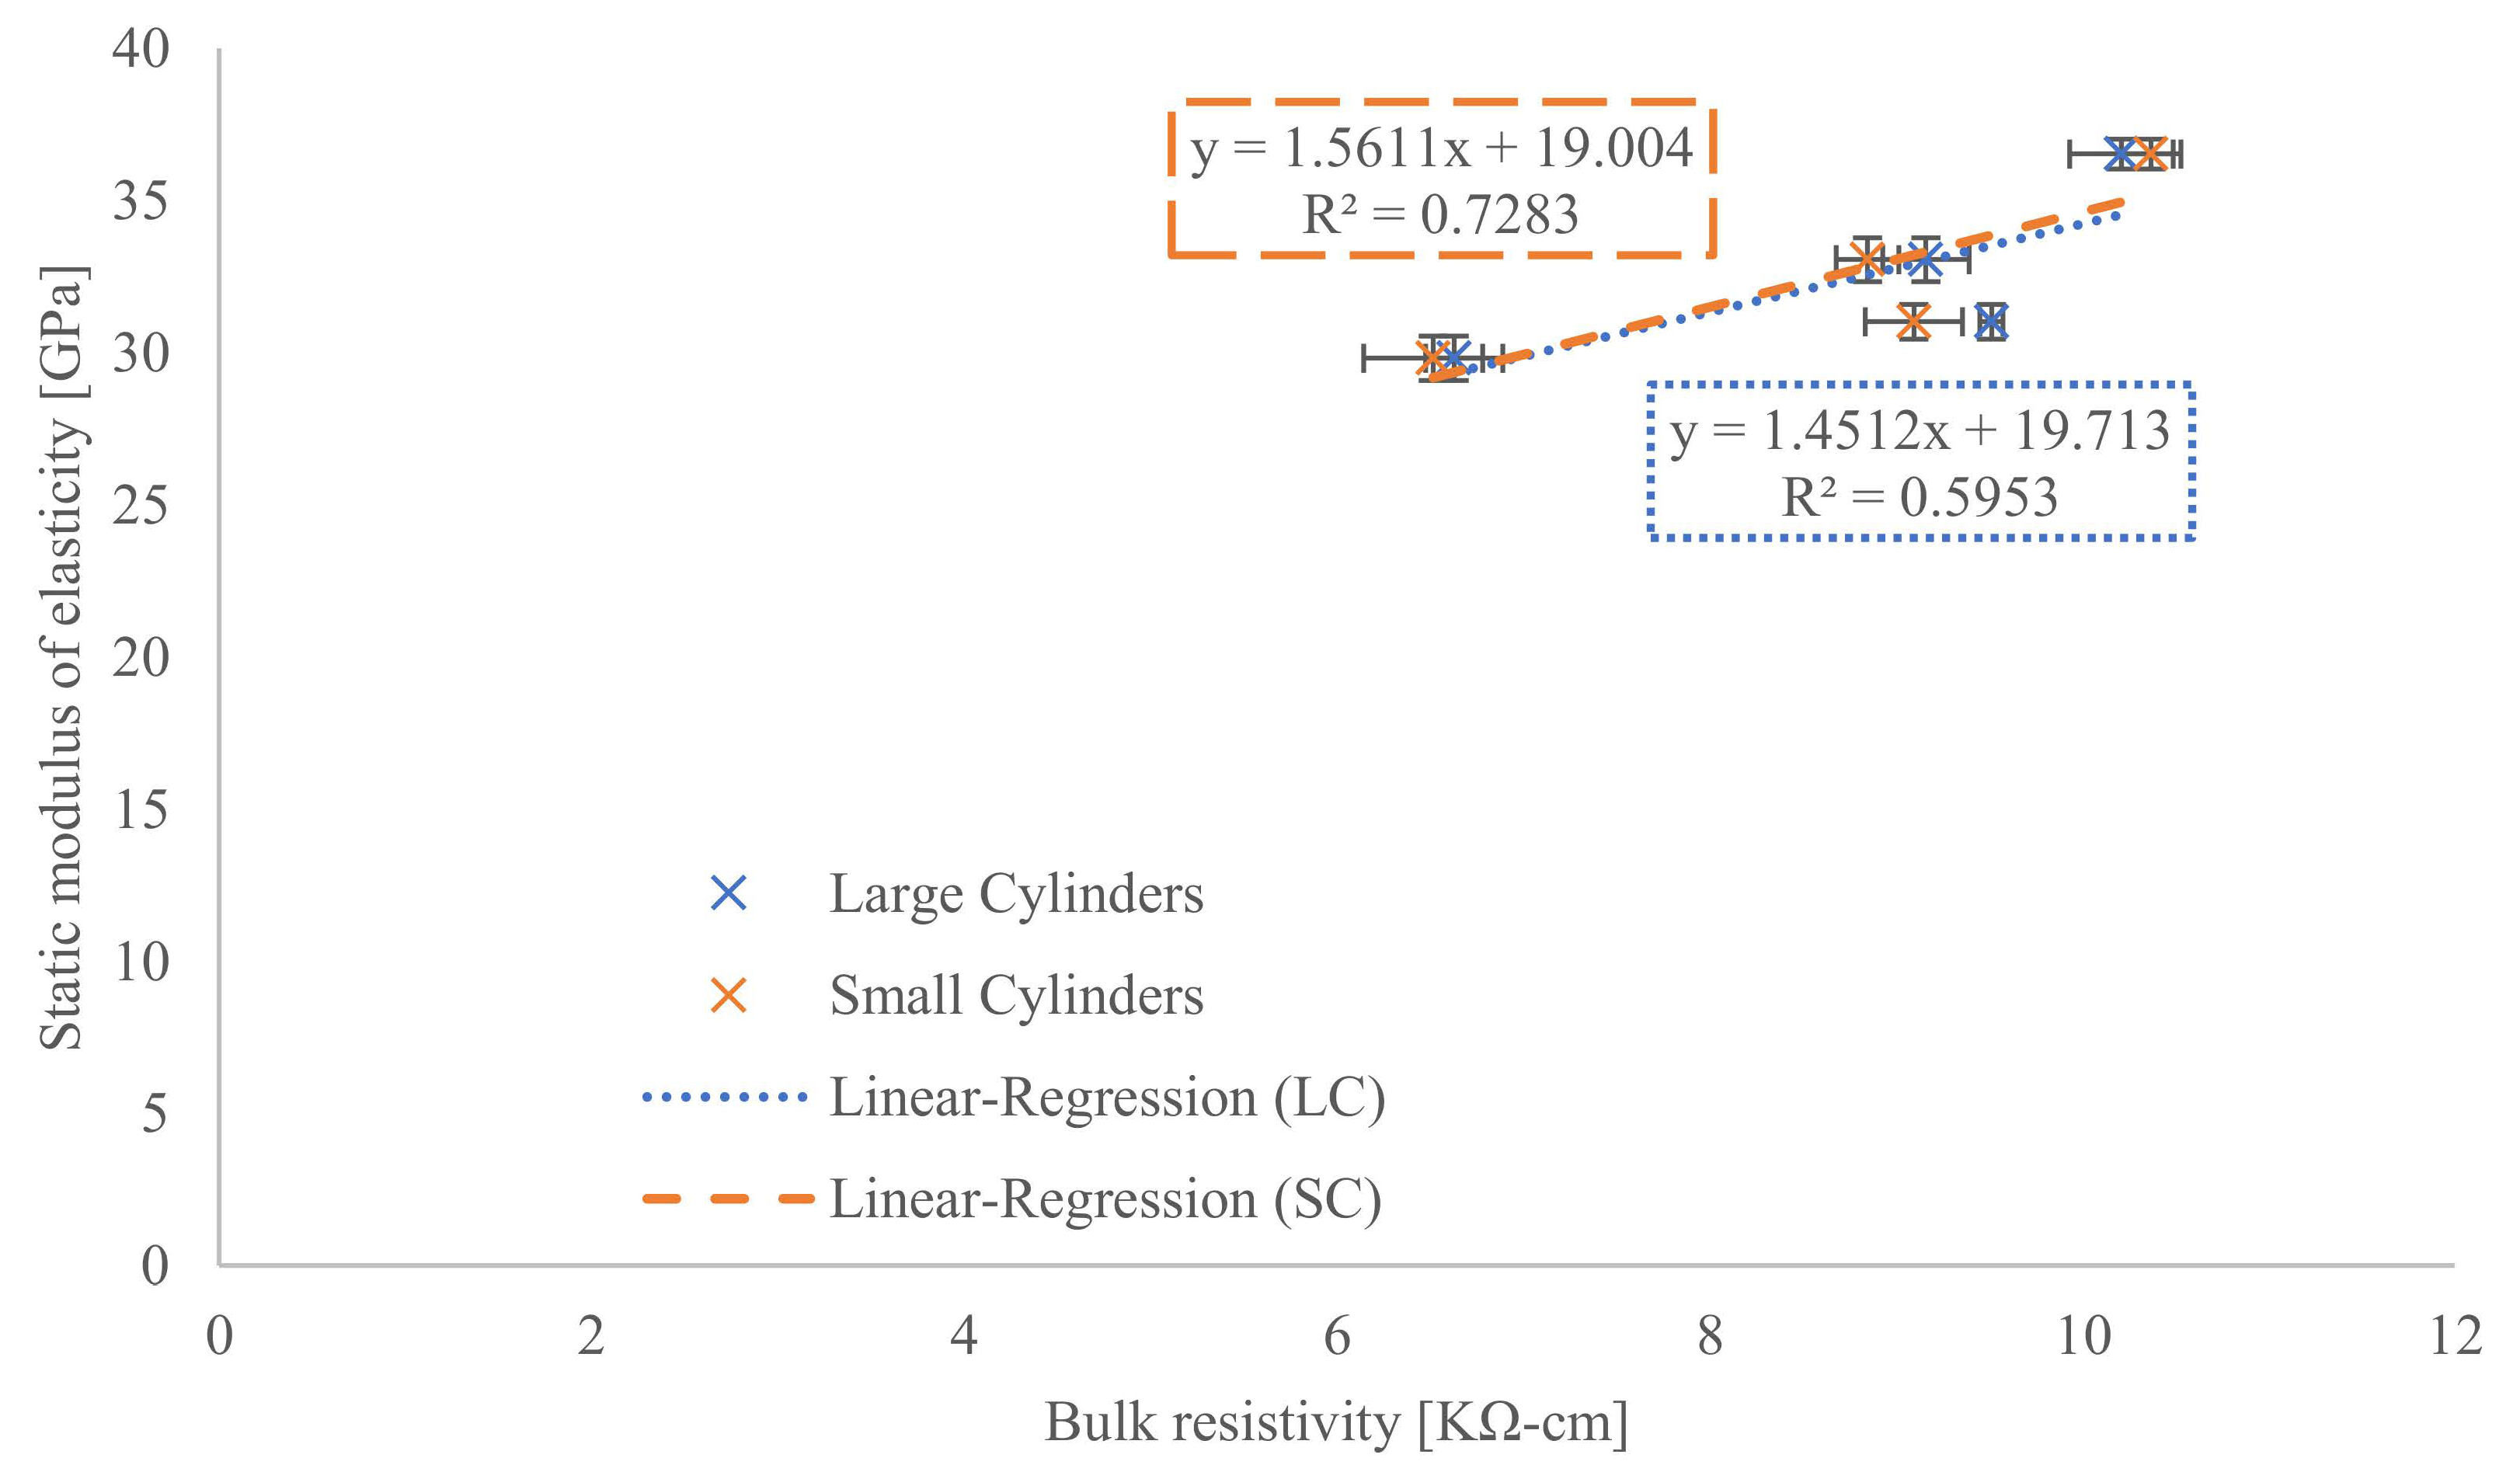
Another pair, this time from DT and NDT measurements, is static modulus versus electrical resistivity on small and large cylinders. In the first stage, the linear curve was applied again (see Figure 11). However, it showed a low agreement, although the coefficient of determination for the small cylinders was almost 0.73.
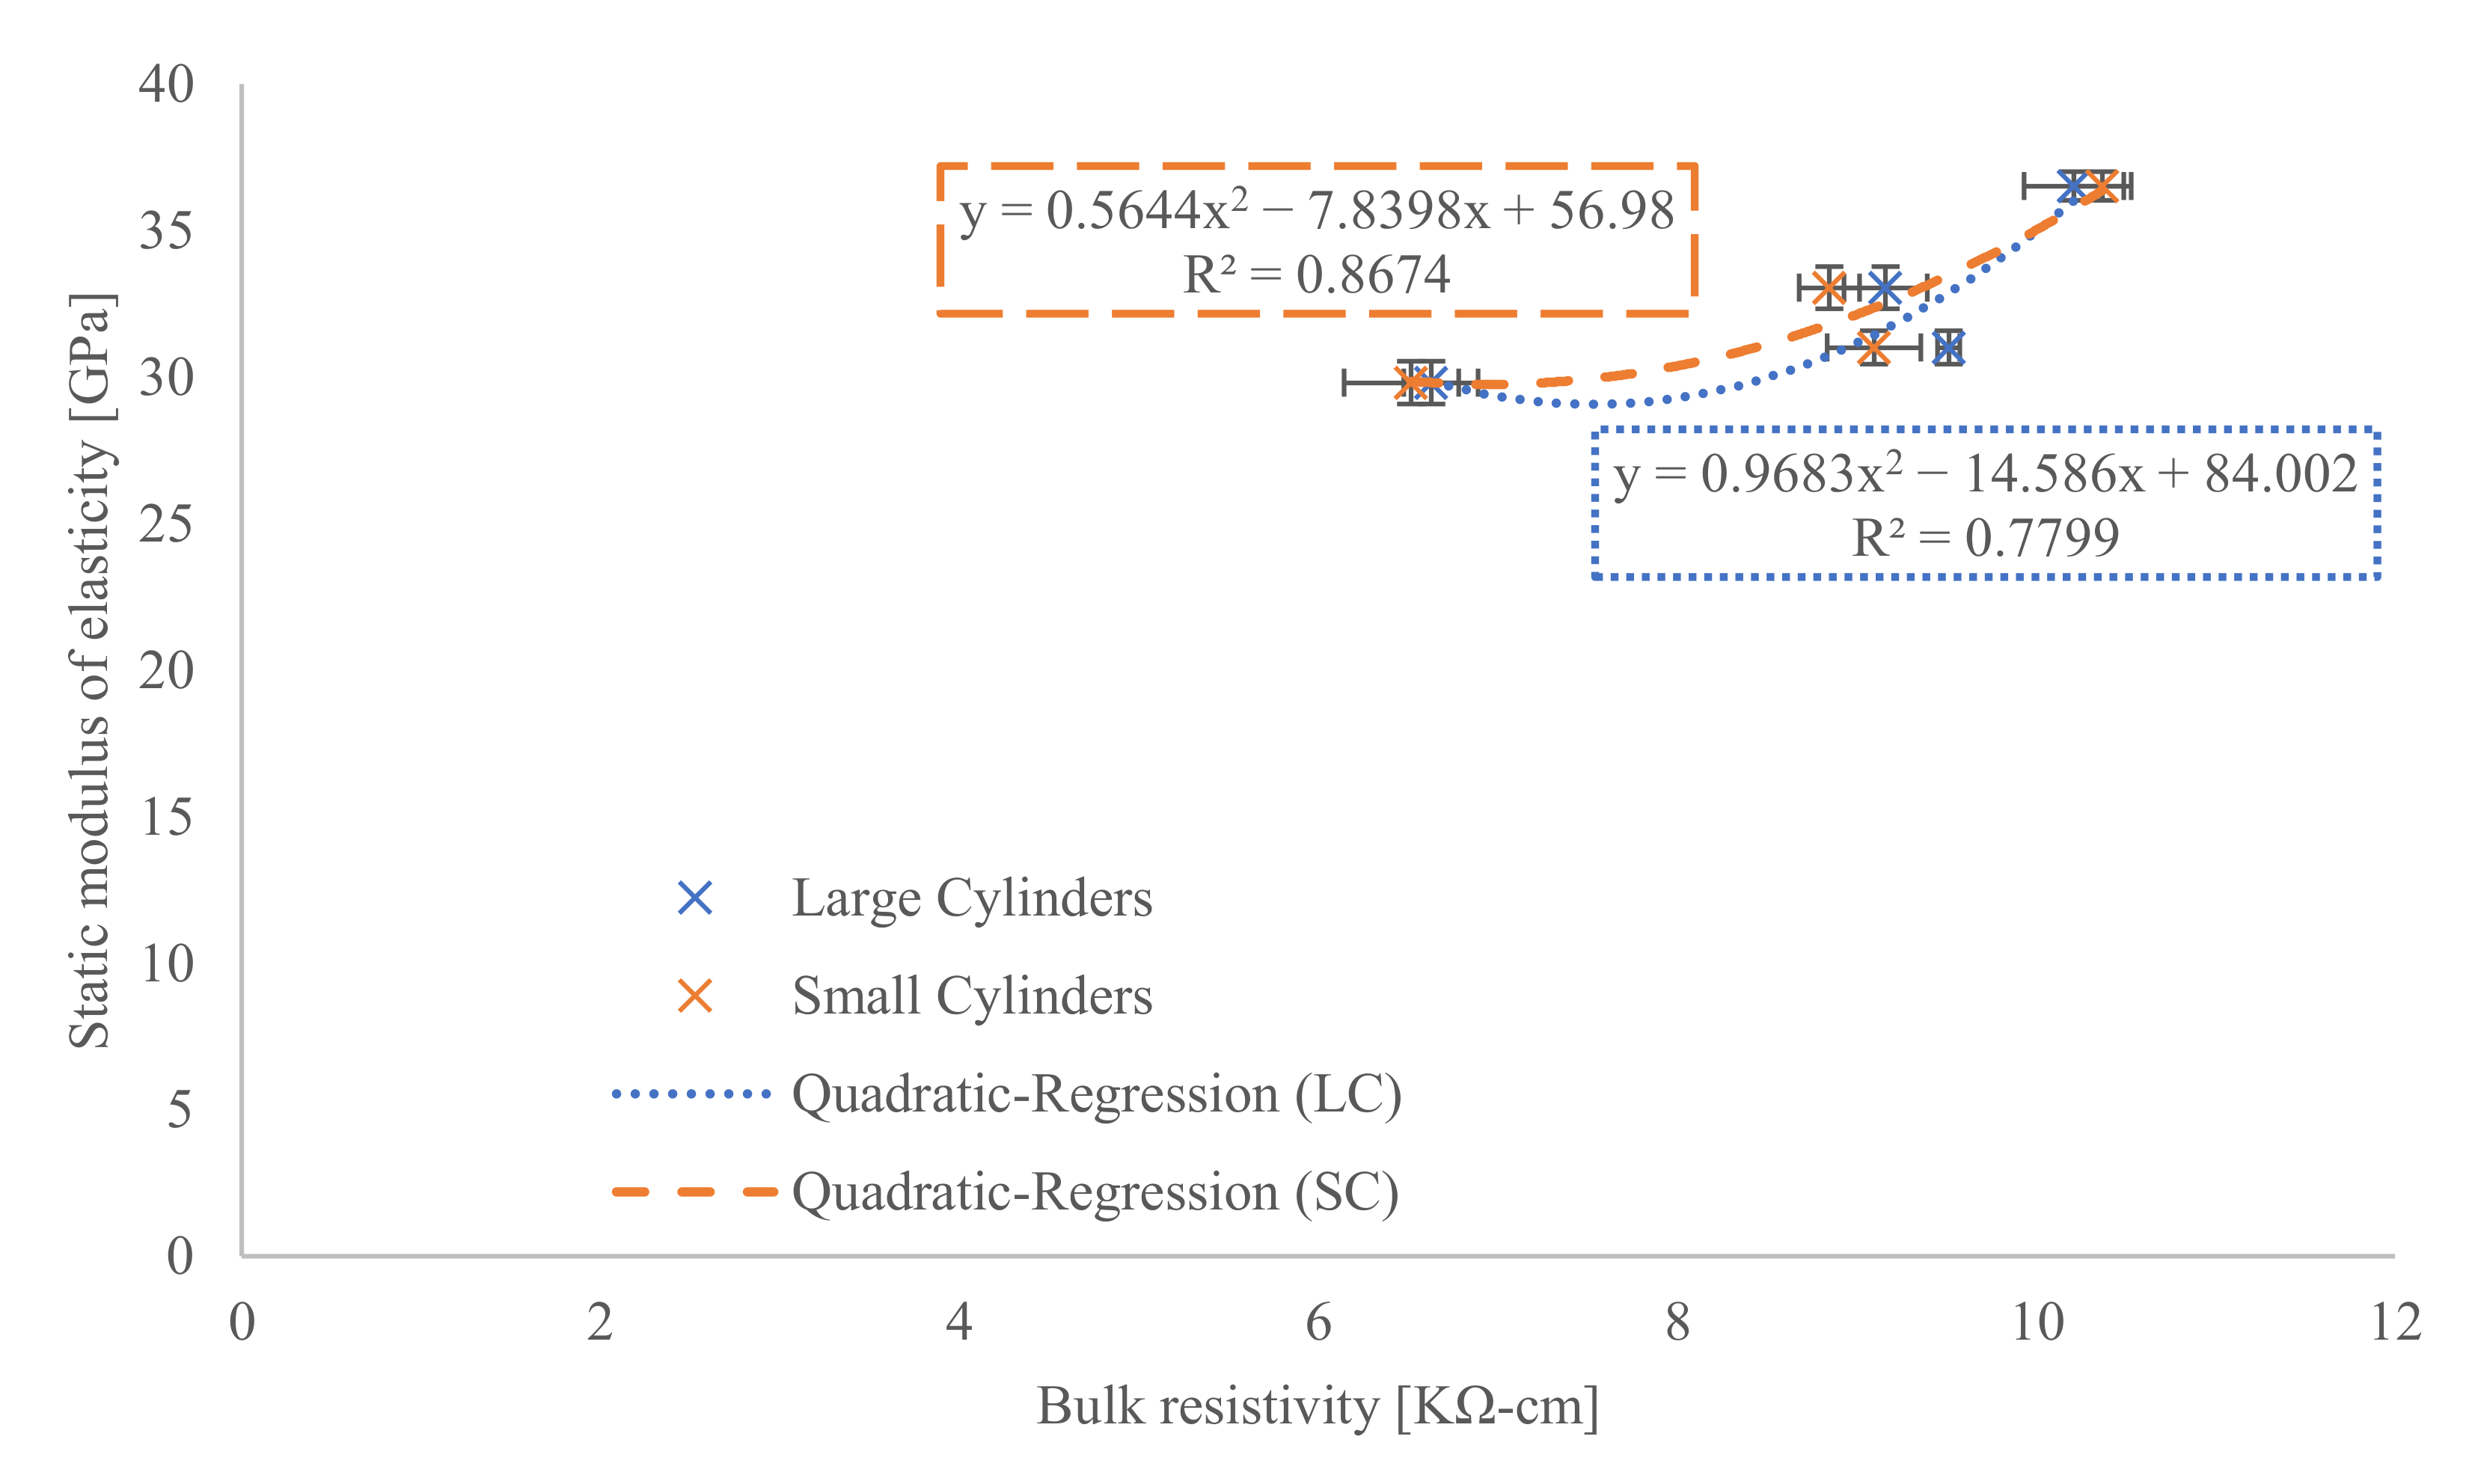
It was expected that a quadratic regression, which was appropriate for some of the previous methods, would give much better results. The quadratic curve analysis for the static modulus and electrical resistivity is shown in Figure 12. Here again, different values can be seen for large and small cylinders. However, in this case, the quadratic regression improved the value of the coefficient of determination for small cylinders to only 0.87, but for large cylinders, this value was increased to 0.78. Both values are significantly higher than for linear regression and demonstrate some agreement between the results of the two methods.
3.7. Summary of Results
To summarise all the results presented, Table 2 was prepared. The two parameters to be compared are always shown, as well as the results of the coefficients of determination for linear or quadratic regression. In the case where the coefficient of determination for the linear regression was higher than 0.8, the quadratic regression was not performed. In almost all cases, the pairs presented here are rated as highly comparable.
4. Discussion
The importance of NDT methods is undeniable, and therefore their compatibility with DT methods is in high demand. The evaluation presented here on structural concrete can be discussed with other materials that are less and more similar.
The presented results of the time-dependent parameters of structural concrete can also be evaluated in comparison with other similar studies. For example, Ghosh and Tran [41] presented correlations between surface and bulk electrical resistivity and showed high agreement. However, the study by Ghosh and Tran presents correlations using an exponential curve, and the results presented here show the possibility of using linear and quadratic regression. Simpler equations allow for better application in modelling chloride degradation.
There are also a number of studies comparing different methods of measuring the electrical resistivity of concrete [20,22,42]. The results in Section 3.2 confirm the observations, i.e., that the bulk and surface resistivity have high correlations over time. In this case, the reason for using both methods was to check the correlation before using the measured values for further comparison.
The results in Section 3.7 show agreement for the evaluation of the temporal change in parameters, which is a desirable result when applying NDT methods to long-lived structures, such as bridges.
The relationship between compressive strength and modulus of elasticity has been analysed in many studies [43,44,45] and is also presented in several standards. However, the importance of the mathematical use of correlation and regression analysis has been little appreciated because it has not always been possible to obtain the necessary data. The application of regression curves has an undeniable advantage if the relationship is properly calibrated for long-term observation of structures.
5. Conclusions
The article showed the results of the standard concrete tests used in load-bearing bridge structures in terms of the effect of maturation. The relationships between DT and NDT tests applied at several periods since concrete placement were analysed. Plots of pairs of measured parameters with standard deviations were presented, accompanied by regression curves.
The following conclusions were drawn from the results:
- NDT methods generally correlate well linearly with compressive strength;
- In case of further comparisons, a quadratic curve had to be applied;
- The quadratic regression between the dynamic modulus and the electrical resistivity showed a highly significant agreement;
- The worst values were observed between static modulus and both non-destructive methods.
The article highlights the importance of statistical and mathematical evaluation of concrete test results with the possibility of further use for numerical modelling of structural degradation. These findings and evaluation procedures can be applied in further research to, for example, high-value concrete, fibre concrete, recycled concrete, and other composite materials.
Author Contributions
Conceptualisation, P.L. and K.H.; methodology, P.L.; software, K.H.; validation, K.H.; formal analysis, P.L.; investigation, K.H.; resources, K.H.; data curation, K.H; writing—original draft preparation, P.L.; writing—review and editing, K.H.; visualisation, P.L.; supervision, P.L.; project administration, P.L.; funding acquisition, P.L. All authors have read and agreed to the published version of the manuscript.
Funding
This contribution has been prepared as a part of project “NFP304010Y277 - Hodnotenie dopadu environmentálneho zaťaženia na stav mostných objektov cezhraničnej dopravnej siete.” Supported by the INTERREG V-A SK-CZ/2019/11.
Institutional Review Board Statement
Not applicable.
Informed Consent Statement
Not applicable.
Acknowledgments
Financial support from VŠB-Technical University of Ostrava by means of the Czech Ministry of Education, Youth and Sports through the Institutional support for conceptual development of science, research, and innovations for the year 2022 is gratefully acknowledged.
Conflicts of Interest
The authors declare no conflict of interest.
References
- Huet, B.; L’Hostis, V.; Idrissi, H.; Tovena, I. A Review on Corrosion Mechanisms of Reinforced Concrete Degradation. In Proceedings of the Environmental Degradation of Engineering Materials, Bordeaux, France, 29 June–1 July 2003. [Google Scholar]
- Matesová, D.; Teplý, B.; Chromá, M.; Rovnaník, P. Stochastic Degradation Models for Durability Limit State Evaluation: Sara—Part Vi. In Proceedings of the 3rd International Conference on Structural Health Monitoring of Intelligent Infrastructure (SHMII-3 2007), Vancouver, BC, Canada, 13–16 November 2007; pp. 1–10. [Google Scholar]
- Cerezo-Narváez, A.; Pastor-Fernández, A.; Otero-Mateo, M.; Ballesteros-Pérez, P. The Relationship between Building Agents in the Context of Integrated Project Management: A Prospective Analysis. Buildings 2021, 11, 184. [Google Scholar] [CrossRef]
- Schabowicz, K. Non-Destructive Testing of Materials in Civil Engineering. Materials 2019, 12, 3237. [Google Scholar] [CrossRef] [PubMed] [Green Version]
- İnel, M.; Çaycı, B.T.; Özmen, H.B. Investigation of Concrete Compressive Strength of Existing Buildings Depending on Number of Core Samples. Pamukkale Univ. J. Eng. Sci. 2019, 25, 621–626. [Google Scholar] [CrossRef]
- NDT-7 COMMITTEE. Recommendations for Testing Concrete by Hardness Methods. Matériaux Constr. 1977, 10, 313–316. [Google Scholar] [CrossRef]
- Determination of Ultrasonic Pulse Velocity; EN 12504-4; British Standards Institution: London, UK, 2004; Volume 3, p. 18.
- Stawiski, B.; Kania, T. Tests of Concrete Strength across the Thickness of Industrial Floor Using the Ultrasonic Method with Exponential Spot Heads. Materials 2020, 13, 2118. [Google Scholar] [CrossRef]
- Qurashi, M.A.; Shah, S.A.R.; Farhan, M.; Taufiq, M.; Khalid, W.; Arshad, H.; Tayyab, M.; Shahzadi, G.; Waseem, M. Sustainable Design and Engineering: A Relationship Analysis between Digital Destructive and Non-Destructive Testing Process for Lightweight Concrete. Processes 2019, 7, 791. [Google Scholar] [CrossRef] [Green Version]
- Wang, B.; Zhong, S.; Lee, T.L.; Fancey, K.S.; Mi, J. Non-Destructive Testing and Evaluation of Composite Materials/Structures: A State-of-the-Art Review. Adv. Mech. Eng. 2020, 12. [Google Scholar] [CrossRef] [Green Version]
- Sobuz, M.H.R.; Datta, S.D.; Rahman, M. Evaluating the Properties of Demolished Aggregate Concrete with Non-Destructive Assessment. In Advances in Civil Engineering; Springer: Singapore, 2022; Volume 184. [Google Scholar]
- Abdallah, W.; Sbartaï, Z.M.; Saliba, J.; Elachachi, S.M.; Hage Chehade, F.; Sadek, M. Assessment of the Reliability of Concrete Evaluation by Multi-Physical Inversion of NDT Measurements—A Probabilistic Approach. Constr. Build. Mater. 2021, 300, 124371. [Google Scholar] [CrossRef]
- Trykoz, L.; Kamchatnaya, S.; Lyuty, V.; Borodin, D.; Atynian, A. Non-Destructive Control Method of the State of Objects Operating Long Time. Diagnostyka 2018, 19, 11–17. [Google Scholar] [CrossRef]
- Xiao, J.; Ying, J.; Shen, L. FEM Simulation of Chloride Diffusion in Modeled Recycled Aggregate Concrete. Constr. Build. Mater. 2012, 29, 12–23. [Google Scholar] [CrossRef]
- Zhang, M.; Ye, G. Modelling of Time Dependency of Chloride Diffusion Coefficient in Cement Paste. J. Wuhan Univ. Technol. Mater. Sci. Ed. 2010, 25, 687–691. [Google Scholar] [CrossRef]
- Tran, Q.; Ghosh, P.; Lehner, P.; Konečný, P. Determination of Time Dependent Diffusion Coefficient Aging Factor of HPC Mixtures. In Key Engineering Materials; Trans Tech Publications Ltd.: Freienbach, Switzerland, 2020; Volume 832. [Google Scholar]
- Han, S.-H. Influence of Diffusion Coefficient on Chloride Ion Penetration of Concrete Structure. Constr. Build. Mater. 2007, 21, 370–378. [Google Scholar] [CrossRef]
- Nilsen, A.; Aitcin, P.-C. Static Modulus of Elasticity of High-Strength Concrete from Pulse Velocity Tests. Cem. Concr. Aggreg. 1992, 14, 64–66. [Google Scholar] [CrossRef]
- Malkin, R.E.; Franklin, A.C.; Bevan, R.L.T.; Kikura, H.; Drinkwater, B.W. Surface Reconstruction Accuracy Using Ultrasonic Arrays: Application to Non-Destructive Testing. NDT E Int. 2018, 96, 26–34. [Google Scholar] [CrossRef] [Green Version]
- Layssi, H.; Ghods, P.; Alizadeh, A.R.; Salehi, M. Electrical Resistivity of Concrete. Concr. Int. 2015, 37, 41–46. [Google Scholar]
- Cosoli, G.; Mobili, A.; Tittarelli, F.; Revel, G.M.; Chiariotti, P. Electrical Resistivity and Electrical Impedance Measurement in Mortar and Concrete Elements: A Systematic Review. Appl. Sci. 2020, 10, 9152. [Google Scholar] [CrossRef]
- Abad Zapico, L. Experimental Investigation on Electrical Resistivity of SFRC. Master’s Thesis, Chalmers University of Technology, Gothenburg, Sweden, 2015. [Google Scholar]
- Luping, T.; Nilsson, L.O. Rapid Determination of the Chloride Diffusivity in Concrete by Applying an Electrical Field. ACI Mater. J. 1993, 89, 49–53. [Google Scholar]
- Ab Manaf, M.B.H.; Yahya, Z.; Abd Razak, R.; Mustafa Al Bakri, A.M.; Ariffin, N.F.; Ahmad, M.M.; Chong, Y.C. Surface Resistivity and Ultrasonic Pulse Velocity Evaluation of Reinforced OPC Concrete and Reinforced Geopolymer Concrete in Marine Environment. In Advances in Mechatronics, Manufacturing, and Mechanical Engineering; Springer: Singapore, 2021; pp. 292–298. [Google Scholar]
- Veselý, V.; Konečný, P.; Lehner, P.; Pařenica, P.; Hurta, J.; Žídek, L. Investigation of Fracture and Electrical Resistivity Parameters of Cementitious Composite for Their Utilization in Deterioration Models. In Key Engineering Materials; Trans Tech Publications Ltd.: Freienbach, Switzerland, 2014; Volume 577–578, ISBN 9783037858301. [Google Scholar]
- Vu, K.A.T.; Stewart, M.G. Structural Reliability of Concrete Bridges Including Improved Chloride-Induced Corrosion Models. Struct. Saf. 2000, 22, 313–333. [Google Scholar] [CrossRef]
- European Committee for Standardization. Concrete—Part 1: Specification, Performance, Production and Conformity; EN 206-1; European Committee for Standardization: Brussels, Belgium, 2000. [Google Scholar]
- European Committee for Standardization. Testing Hardened Concrete Part 3: Compressive Strength of Test Specimens; EN 12390-3; European Committee for Standardization: Brussels, Belgium, 2002. [Google Scholar]
- Misák, P.; Vymazal, T.; Kocáb, D.; Kucharczyková, B. Repeatability and Reproducibility of the Static Elastic Modulus of Concrete Measurement. In Solid State Phenomena; Trans Tech Publications Ltd.: Freienbach, Switzerland, 2018; Volume 272. [Google Scholar]
- European Committee for Standardization. Testing Hardened Concrete—Part 13: Determination of Secant Modulus of Elasticity in Compression; EN 12390-13; European Committee for Standardization: Brussels, Belgium, 2013. [Google Scholar]
- Lehner, P.; Turicová, M.; Konečnỳ, P. Comparison of Selected Methods for Measurement of the Concrete Electrical Resistance to Chloride Penetration. ARPN J. Eng. Appl. Sci. 2017, 12, 937–944. [Google Scholar]
- AASHTO T358; Standard Method of Test for Surface Resistivity Indication of Concrete’s Ability to Resist Chloride Ion Penetration. American Association of State Highway and Transportation Officials: Washington, DC, USA, 2013.
- Morris, W.; Moreno, E.I.; Sagüés, A.A. Practical Evaluation of Resistivity of Concrete in Test Cylinders Using a Wenner Array Probe. Cem. Concr. Res. 1996, 26, 1779–1787. [Google Scholar] [CrossRef]
- Manual for RCON Giatec Scientific. Available online: https://www.giatecscientific.com/products/concrete-ndt-devices/rcon-bulk-resistivity/ (accessed on 20 June 2021).
- ASTM C1876; Standard Test Method for Bulk Electrical Resistivity or Bulk Conductivity of Concrete. ASTM International: West Conshohocken, PA, USA, 2012; pp. 1–5.
- Schober, P.; Boer, C.; Schwarte, L.A. Correlation Coefficients. Anesth. Analg. 2018, 126, 1763–1768. [Google Scholar] [CrossRef]
- Zou, K.H.; Tuncali, K.; Silverman, S.G. Correlation and Simple Linear Regression. Radiology 2003, 227, 617–628. [Google Scholar] [CrossRef] [PubMed]
- Nagelkerke, N.J.D. A Note on a General Definition of the Coefficient of Determination. Biometrika 1991, 78, 691–692. [Google Scholar] [CrossRef]
- Latuni, F. Development of Road and Bridge Infrastructure to Enhance Economic Growth in the Coastal Communities of Tuminting District in Manado City. Int. J. Multicult. Multireligious Underst. 2019, 6, 780–791. [Google Scholar] [CrossRef]
- Park, J.Y.; Sim, S.H.; Yoon, Y.G.; Oh, T.K. Prediction of Static Modulus and Compressive Strength of Concrete from Dynamic Modulus Associated with Wave Velocity and Resonance Frequency Using Machine Learning Techniques. Materials 2020, 13, 2886. [Google Scholar] [CrossRef] [PubMed]
- Ghosh, P.; Tran, Q. Correlation Between Bulk and Surface Resistivity of Concrete. Int. J. Concr. Struct. Mater. 2015, 9, 119–132. [Google Scholar] [CrossRef]
- Whiting, D.A.; Nagi, M.A. Electrical Resistivity of Concrete—A Literature Review. Portland Cem. Assoc. 2003, 2457, 1078. [Google Scholar]
- Suseno, H.; Wijaya, M.N.; Firdausy, A.I. Correlation between Destructive and Non-Destructive Characteristics of Pumice and Scoria Lightweight Concretes. Eng. J. 2021, 25, 113–126. [Google Scholar] [CrossRef]
- Nalon, G.H.; Alves, M.A.; Pedroti, L.G.; Lopes Ribeiro, J.C.; Hilarino Fernandes, W.E.; Silva de Oliveira, D. Compressive Strength, Dynamic, and Static Modulus of Cement-Lime Laying Mortars Obtained from Samples of Various Geometries. J. Build. Eng. 2021, 44, 102626. [Google Scholar] [CrossRef]
- Lehner, P.; Gołaszewski, J. Relationship of Different Properties from Non-Destructive Testing of Heavy Concrete from Magnetite and Serpentinite. Materials 2021, 14, 4288. [Google Scholar] [CrossRef]
Figure 1.
Concrete mixture properties; amount per 1 m2 [kg].

Figure 2.
A Wenner probe before the measurement.

Figure 3.
Time-dependent results of electrical resistivity and compressive strength.

Figure 4.
Time-dependent results of electrical resistivity and modulus of elasticity.

Figure 5.
Linear regression analysis of the relationship between surface and bulk electrical resistivity on large and small cylindrical samples (LC = Large Cylinders, SC = Small Cylinders).
Figure 5.
Linear regression analysis of the relationship between surface and bulk electrical resistivity on large and small cylindrical samples (LC = Large Cylinders, SC = Small Cylinders).

Figure 6.
Linear regression analysis of the relationship between bulk electrical resistivity and compressive strength (LC = Large Cylinders, SC = Small Cylinders).
Figure 6.
Linear regression analysis of the relationship between bulk electrical resistivity and compressive strength (LC = Large Cylinders, SC = Small Cylinders).

Figure 7.
Linear regression analysis of the relationship between modulus of elasticity and compressive strength (D = Dynamic, S = Static).
Figure 7.
Linear regression analysis of the relationship between modulus of elasticity and compressive strength (D = Dynamic, S = Static).

Figure 8.
Quadratic regression analysis of the relationship between modulus of elasticity and compressive strength (D = Dynamic, S = Static).
Figure 8.
Quadratic regression analysis of the relationship between modulus of elasticity and compressive strength (D = Dynamic, S = Static).

Figure 9.
Linear regression analysis of the relationship between bulk electrical resistivity and dynamic modulus of elasticity (LC = Large Cylinders, SC = Small Cylinders).
Figure 9.
Linear regression analysis of the relationship between bulk electrical resistivity and dynamic modulus of elasticity (LC = Large Cylinders, SC = Small Cylinders).

Figure 10.
Quadratic regression analysis of the relationship between bulk electrical resistivity and dynamic modulus of elasticity (LC = Large Cylinders, SC = Small Cylinders).
Figure 10.
Quadratic regression analysis of the relationship between bulk electrical resistivity and dynamic modulus of elasticity (LC = Large Cylinders, SC = Small Cylinders).

Figure 11.
Linear regression analysis of the relationship between bulk electrical resistivity and dynamic modulus of elasticity (LC = Large Cylinders, SC = Small Cylinders).
Figure 11.
Linear regression analysis of the relationship between bulk electrical resistivity and dynamic modulus of elasticity (LC = Large Cylinders, SC = Small Cylinders).

Figure 12.
Quadratic regression analysis of the relationship between bulk electrical resistivity and dynamic modulus of elasticity (LC = Large Cylinders, SC = Small Cylinders).
Figure 12.
Quadratic regression analysis of the relationship between bulk electrical resistivity and dynamic modulus of elasticity (LC = Large Cylinders, SC = Small Cylinders).


Table 1.
Results of the numerical analysis based on Pearson’s correlation coefficient (PCC).
| First Parameter | Second Parameter | PCC |
|---|---|---|
| Small cylinder surface electrical resistivity | Small cylinder bulk electrical resistivity | 0.99 |
| Large cylinder surface electrical resistivity | Large cylinder bulk electrical resistivity | 0.99 |
| Compressive strength | Small cylinder bulk electrical resistivity | 0.96 |
| Compressive strength | Large cylinder bulk electrical resistivity | 0.94 |
| Compressive strength | Dynamic modulus of elasticity | 0.85 |
| Compressive strength | Static modulus of elasticity | 0.78 |
| Dynamic modulus of elasticity | Small cylinder bulk electrical resistivity | 0.77 |
| Dynamic modulus of elasticity | Large cylinder bulk electrical resistivity | 0.68 |
| Static modulus of elasticity | Small cylinder bulk electrical resistivity | 0.75 |
| Static modulus of elasticity | Large cylinder bulk electrical resistivity | 0.65 |
Table 2.
The value of the regression analysis results (not app. means that quadratic regression was not necessary).
Table 2.
The value of the regression analysis results (not app. means that quadratic regression was not necessary).
| First Parameter | Second Parameter | R2 from Linear Regression | R2 from Quadratic Regression |
|---|---|---|---|
| Small cylinder surface electrical resistivity | Small cylinder bulk electrical resistivity | 0.983 | not app. |
| Large cylinder surface electrical resistivity | Large cylinder bulk electrical resistivity | 0.977 | not app. |
| Compressive strength | Small cylinder bulk electrical resistivity | 0.928 | not app. |
| Compressive strength | Large cylinder bulk electrical resistivity | 0.892 | not app. |
| Compressive strength | Dynamic modulus of elasticity | 0.716 | 0.857 |
| Compressive strength | Static modulus of elasticity | 0.602 | 0.606 |
| Dynamic modulus of elasticity | Small cylinder bulk electrical resistivity | 0.595 | 0.981 |
| Dynamic modulus of elasticity | Large cylinder bulk electrical resistivity | 0.453 | 1.000 |
| Static modulus of elasticity | Small cylinder bulk electrical resistivity | 0.728 | 0.867 |
| Static modulus of elasticity | Large cylinder bulk electrical resistivity | 0.595 | 0.780 |
Publisher’s Note: MDPI stays neutral with regard to jurisdictional claims in published maps and institutional affiliations. |
© 2022 by the authors. Licensee MDPI, Basel, Switzerland. This article is an open access article distributed under the terms and conditions of the Creative Commons Attribution (CC BY) license (https://creativecommons.org/licenses/by/4.0/).
Share and Cite
MDPI and ACS Style
Lehner, P.; Hrabová, K. Relationship of Time-Dependent Parameters from Destructive and Non-Destructive Tests of Structural Concrete. Mathematics 2022, 10, 460. https://0-doi-org.brum.beds.ac.uk/10.3390/math10030460
AMA Style
Lehner P, Hrabová K. Relationship of Time-Dependent Parameters from Destructive and Non-Destructive Tests of Structural Concrete. Mathematics. 2022; 10(3):460. https://0-doi-org.brum.beds.ac.uk/10.3390/math10030460
Chicago/Turabian StyleLehner, Petr, and Kristýna Hrabová. 2022. "Relationship of Time-Dependent Parameters from Destructive and Non-Destructive Tests of Structural Concrete" Mathematics 10, no. 3: 460. https://0-doi-org.brum.beds.ac.uk/10.3390/math10030460
Note that from the first issue of 2016, this journal uses article numbers instead of page numbers. See further details here.