
Fuel Price Networks in the EU


Department of Economics, Democritus University of Thrace, 69100 Komotini, Greece
*
Author to whom correspondence should be addressed.
Economies 2024, 12(5), 102; https://0-doi-org.brum.beds.ac.uk/10.3390/economies12050102
Submission received: 21 March 2024
/
Revised: 15 April 2024
/
Accepted: 20 April 2024
/
Published: 26 April 2024
(This article belongs to the Special Issue Complex Networks on Macroeconomics and Finance: Models, Methods, Applications)
Abstract
:This study deals with the evolution of fuels’ prices over time in the EU. The central research inquiry revolves around whether there exists any correlation among the trajectories followed by national prices in the gasoline and diesel markets. The EU, and more specifically the Euro-Area, by its construction, is treated as an OCA (Optimum Currency Area). In an OCA, certain conditions are met to ensure the smooth functioning of a common currency. The fuel price synchronization is essential because it contributes to the effective implementation of policies and promotes stability across the entire macroeconomy. The study covers the period of 2017–2022. For each type of fuel and year, we construct an individual network where network nodes represent the EU member states while the edges connecting these nodes represent strong temporal fuel price correlations among the member states. The properties of the resulting networks are analyzed within a Complex Network framework. Our goal is twofold: first, to detect any potential convergence or divergence in the trajectories of the prices, and second, to investigate the impact of tax and duty implementation on the co-movements of the prices. The empirical findings show that diesel markets have a more pronounced pattern of price co-movements compared to the gasoline markets. Moreover, the application of fuel taxation policies seems to adversely affect the co-movements of prices.
1. Introduction
The global economy heavily relies on fossil fuels, including coal, natural gas, and crude oil. In this paper, we will study two fuels that both result from the process of refining crude oil: gasoline and diesel. Oil is a non-renewable resource that serves as the primary energy source worldwide; it is a commodity traded on a global scale. Next to its role in providing energy, it plays a crucial role as well in supporting various industries and powering transportation. Oil dependence has significant implications for the environment, social fabric, and economic stability. When an economy heavily relies on oil, it becomes a pivotal factor that affects a range of macroeconomic indicators, such as inflation, employment, investment, and consumption. It is clear that oil is essential in shaping the economic landscape.
Crude oil prices are primarily influenced by the interplay of supply and demand1. When there is an oversupply, prices tend to decrease, while in periods of decreasing supply, prices rise. By the same token, rising demand leads to price increases while a limited demand pushes prices to decrease2. The relation between oil prices and supply/demand is a two-way one. Oil in turn, also affects supply and demand. Oil price fluctuations tend to impact the costs associated with producing goods and services and therefore influence the supply (this is also true for gasoline and diesel products). Consequently, the demand adjusts accordingly.
Despite advancements in renewable energy sources, oil remains the predominant fuel in the global energy mix. Data obtained from BP’s website (Statistical Review of World Energy) concerning the years 2017, 2018, 2019, 2020, 2021, and 20223 show that the oil share of the global primary energy consumption is the largest (followed by coal, natural gas, nuclear energy, hydroelectricity, and renewables) in each one of the years. In the EU area, oil and petroleum products hold the largest portion (among natural gas, renewables, solid fossil fuels, etc.) of the final energy consumption (energy use). In all five4 years, the share of oil and petroleum products in total final energy consumption (energy use) was more than 34%, according to the Eurostat Energy Balances. A portion over three-fourths of this is directed to be consumed in the transport sector. Transport constitutes a pillar of the EU economy, facilitating the free flow of goods and people. However, road transport contributes to approximately 20% of the European Union’s greenhouse gas emissions, being the only sector (among industry, agriculture, energy supply, commercial and public services, and households) that has followed an upward trend since 1990 (European Environment Agency Report No 02/2022). Although several initiatives were undertaken and a wide collection of policies was adopted towards transport decarbonization, (European Climate Law established in 20215, international collaboration, government policies concerning emissions standards implementation, cleaner modes of transportation and electrification, investments in efficient technology innovation), the EU transport sector is heavily dependent on oil, which accounts for over 90% of its energy consumption6. The large reliance of the transport sector on fossil fuels is imprinted on the data of the Eurostat Energy Balances. Specifically in 2021, oil and petroleum products cover the needs of the transport sector in general and the road transport sector in particular with a share of 90% and 92%, respectively.
As a general rule, the prices of fuels (being either net or inclusive of taxes and duties) follow the trend of the most traded crude oil commodities: the West Texas Intermediate Crude (WTI) that originates from the US and trades on the New York Mercantile Exchange (NYMEX) and the North Sea Brent Crude (BRENT) which is sourced in Europe and trades on London’s Intercontinental Exchange (ICE). However, the way fuel (both the net and the inclusive of taxes and duties) prices tail after the crude oil prices is more complicated. The so-called “pass-through” phenomenon has been studied to a quite extensive degree by researchers and organizations (Bennett et al. 2021; Owyang and Vermann 2014; Bettendorf et al. 2009; Chesnes 2016; Asane-Otoo and Dannemann 2022; Kristoufek and Lunackova 2015; Bergantino et al. 2020; Bakhat et al. 2022; Apergis and Vouzavalis 2018; Ederington et al. 2021; Bragoudakis et al. 2020; Karagiannis et al. 2015). In short, both the sensitivity and speed at which retail prices respond to crude oil price changes are not consistently uniform; in most cases, retail prices jump quickly when oil prices rise, but they fall slowly when oil prices drop, pointing to an asymmetric pricing adjustment.
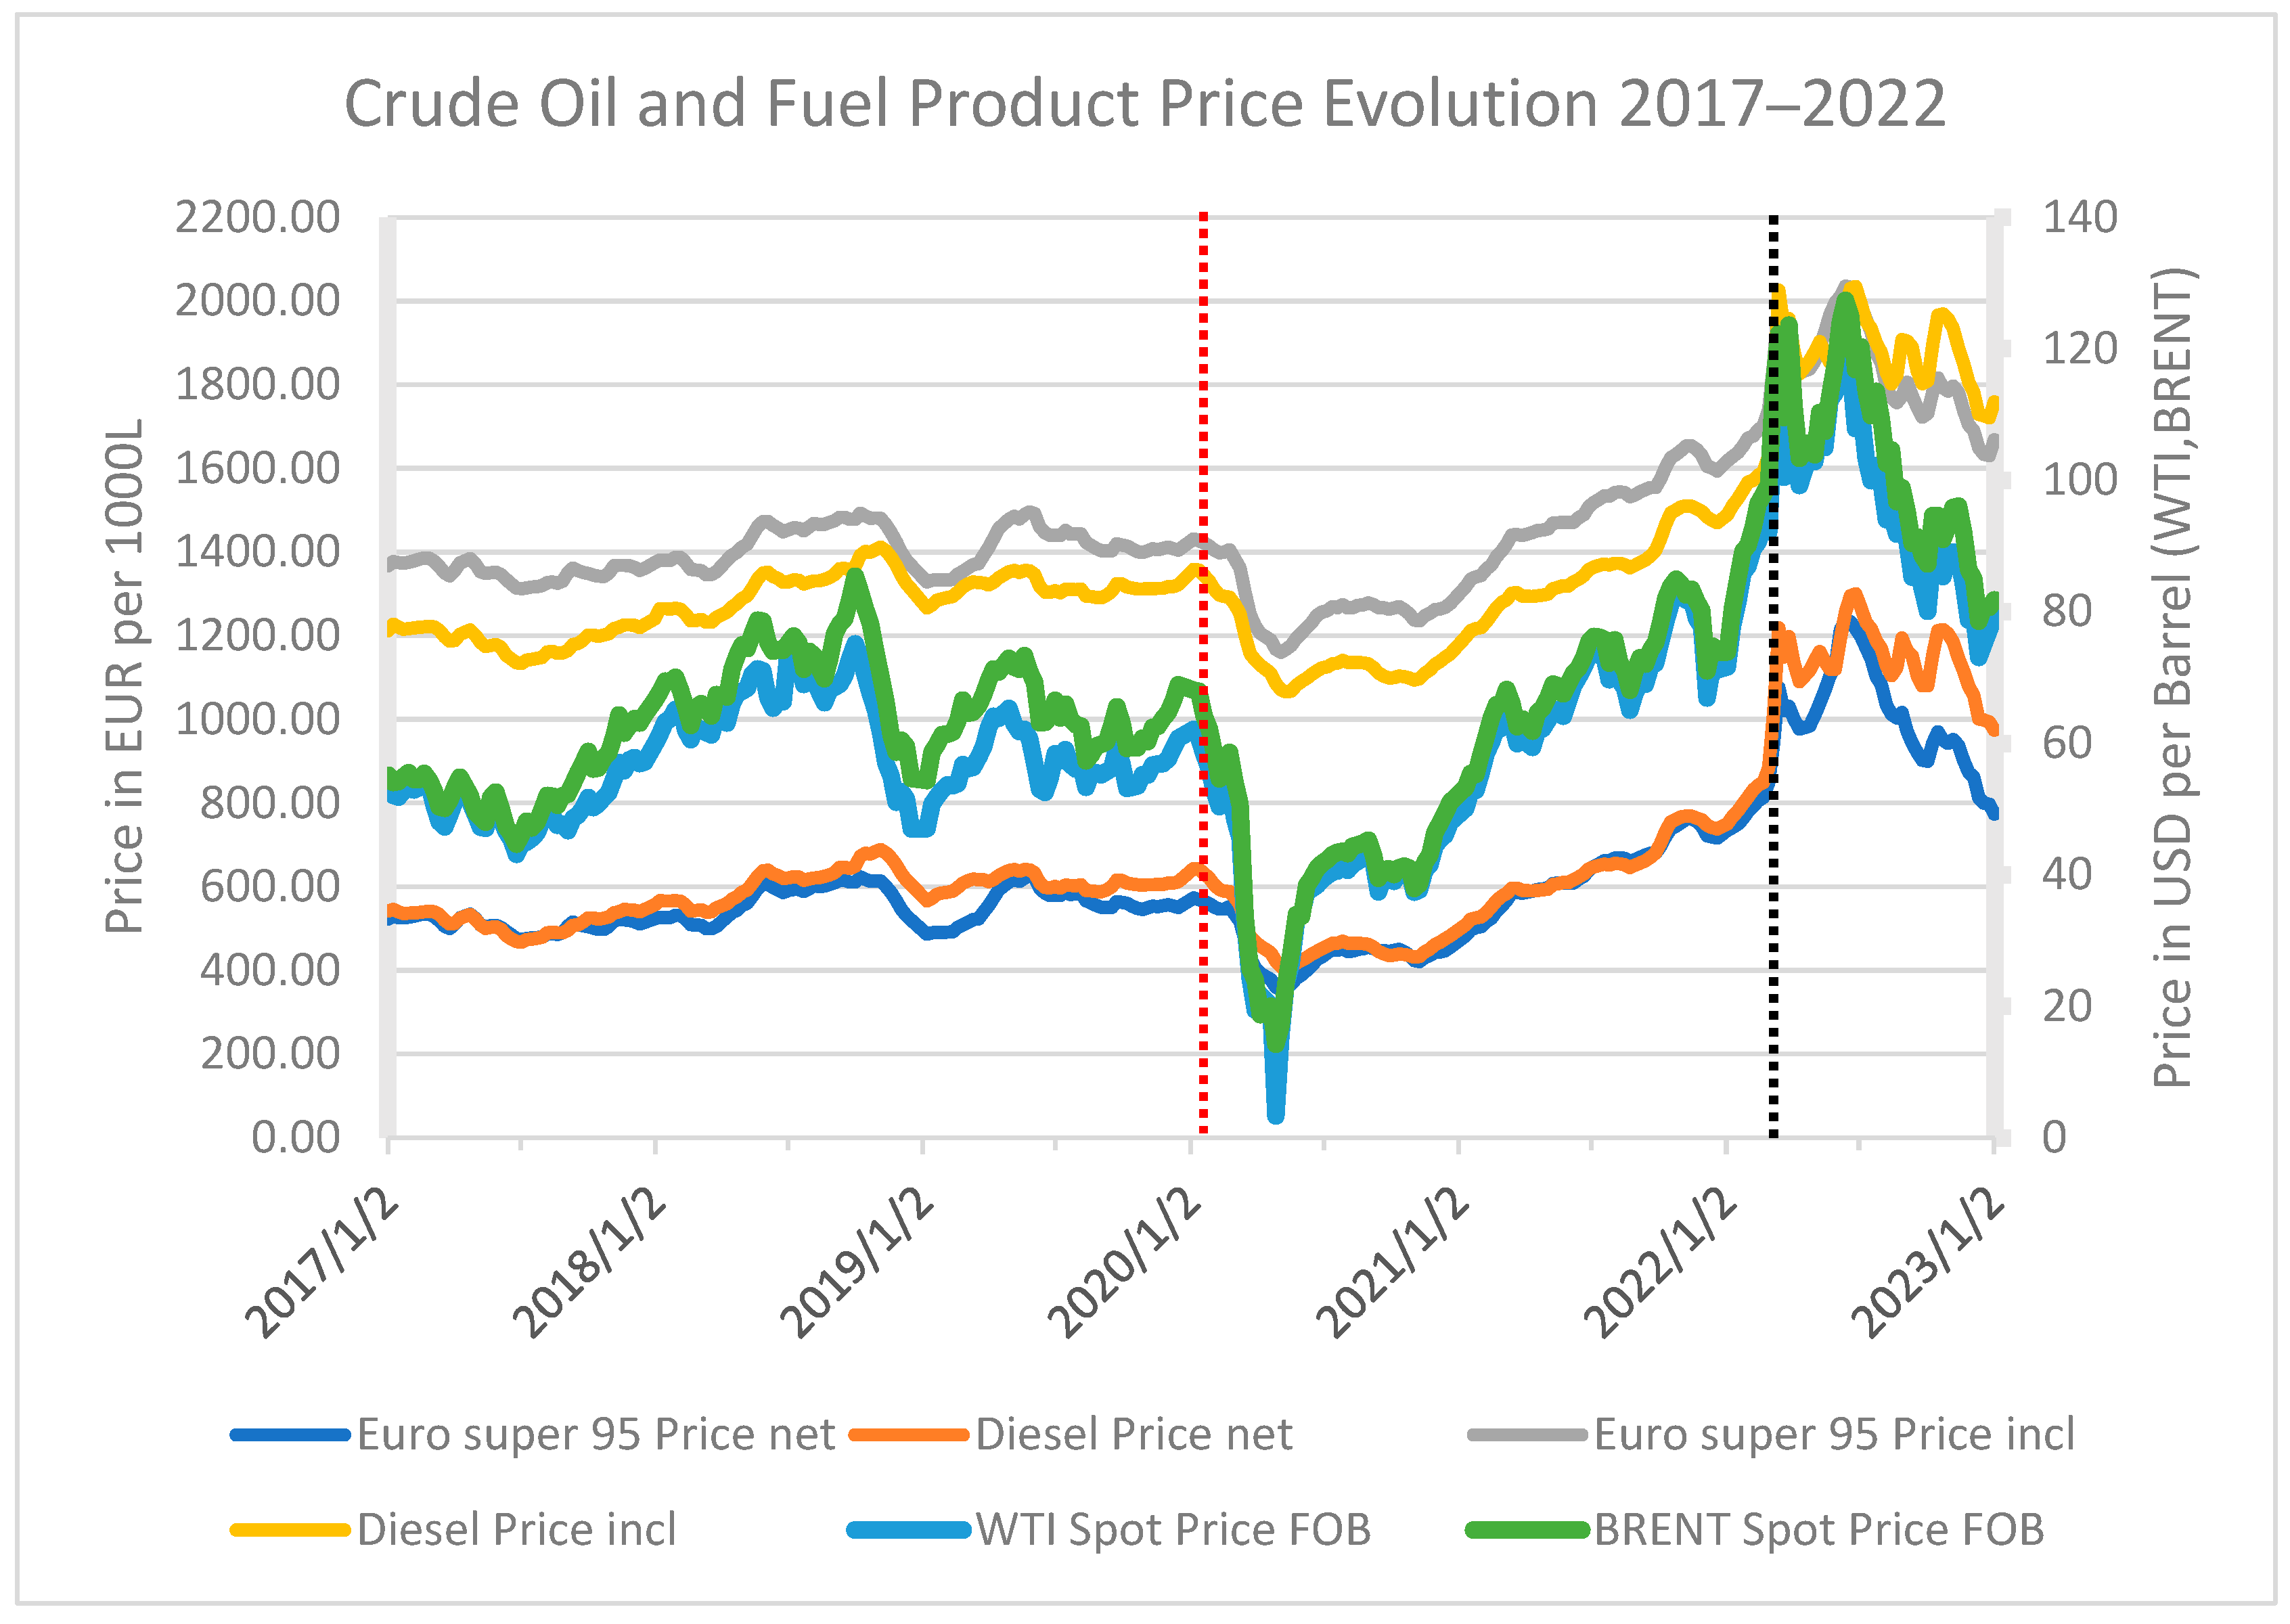
As a result of their vulnerability to both negative and positive shocks, spot oil prices suffer from substantial volatility (Figure 1). This has far-reaching effects on societies, economies, and companies even in foreign policy and global geopolitics that drive various stakeholders to monitor closely oil price fluctuations. Governments, policymakers, energy analysts, corporations, consumers, and the public also pay keen attention to fuel price evolution over time, as it has grave repercussions on transportation and production costs which in turn affect inflation levels and the macroeconomy. In general, awareness and information related to the fuel market provide all stakeholders with significant insights into the dynamics developed within the EU retail fuel market structure. This work heads toward this direction; it seeks to investigate the European Union’s fuel market, with a specific focus on understanding the interrelations developed between the national prices of each of the primary fuels utilized in road transportation—specifically, unleaded petrol and diesel. In this way, it contributes to knowledge related to the EU energy sector and more specifically to the most consumed fuels in the road transport sector.
The current study does not focus on the co-movements of crude oil prices and the prices of downstream7 oil products. Crude oil prices are determined in a relatively consolidated market. This is not the case for fuel products; their price determination may be influenced by other factors as well, which act in a decentralized way. Location, market size, level of competition, production lags, inventory levels, marketing practices, season, average temperatures, taxes, and duties are agents that affect fuel product prices at a considerable rate. Thus, without taking crude oil prices into account, the focus of the present study is on the diesel (gas oil) market as well as on the gasoline (Euro Super 95) market, across the EU member states, so as the trends in each of the two markets to be traced.
The EU, and more specifically the Euro-Area, by its construction, is treated as an OCA (Optimum Currency Area), according to Mundell (1961). In an OCA, synchronized fuel prices play a crucial role:
- Relative price stability within an OCA is important. Synchronization of fuel prices within member states helps maintain consistent relative prices of goods and services within the relevant common currency area.
- Inflation synchronization. As fuel prices are one of the major components of inflation, synchronization of fuel prices can lead to synchronization of inflation rates across the OCA as well. This has very important policy implications. Centrally implemented monetary policy by the ECB can be effective for all member states and thus be efficient and stabilizing; when fuel prices are divergent, thus rendering inflation rates divergent as well, this leads to asynchronous business cycles: some economies are facing an unemployment gap, while others are facing inflationary gaps. Under this situation, stabilizing monetary policy must be expansionary for the first and contractionary for the latter, which is of course an impossible task within a common currency area such as the Eurozone.
- Business cycle synchronization. Fuel prices play an important role in economic activity and aggregate supply. Increases in fuel prices lead to increased production costs and, thus, a lower aggregate supply. On the other hand, decreasing fuel prices lower production costs and boost aggregate supply. Both situations lead to short-term disequilibria and the need for fiscal and/or monetary policy intervention. As a result, synchronization of fuel prices enhances business cycle synchronization—an important feature of OCA and a common currency area like the Eurozone.
- Integration in goods and capital markets. This is an important criterion according to Mundell for an OCA. A well-integrated market facilitates efficient resource allocation.
- Synchronization of shocks. Positive and negative shocks must be synchronized within an OCA for the integration of the national economies within the union. Major shocks originate from fuel price changes; thus, synchronization of fuel prices is an important component of the EU as an OCA.
Thus, fuel price synchronization is vital in a common currency area, as it is an important feature for the implementation of efficient and effective overall fiscal and monetary policy adding to the stability of the OCA, reducing macroeconomic volatility and uncertainty and adding to the stability of the whole macroeconomy.
Our objectives are to examine (a) how fuel (diesel and gasoline) prices behave in terms of synchronization across EU countries and over time, (b) whether the patterns observed in each of the fuel markets follow the same path, and (c) whether and to what extent the intervention of individual member states (through the imposition of taxes and duties) affects the overall price synchronization. Next to these, the current research examines the degree the price synchronization level in the EU was influenced by two incidents—with different characteristics each—that caused a significant swing in oil prices globally due to the effect on demand, production/supply, and (disruption in) the supply chain: the SARS-CoV-2 pandemic outbreak in 2020 and the Russo-Ukrainian war that broke out in 2022. Each of the two fuels is examined separately, as the taxation policy applied to diesel and gasoline differs. Furthermore, each is investigated on two levels; the first concerns the net of taxes and duties price, while the second is about the price that includes taxes and duties (i.e., pump price).
Figure 1 portrays the prices of crude oil as well as the prices of diesel and gasoline (both net and inclusive of taxes and duties) for the 2017–2022 time period. As depicted, fuel prices in the EU exhibit less volatility than crude oil prices do. This is even more intense in the early part of both 2020 and 2022. In 2020, the global economy experienced a significant downturn due to the SARS-CoV-2 virus outbreak. This led to a forcible crude oil price fall, recording an extreme low8. However, this was not the case in the succeeding year, in which a notable recovery took place9. The sensitive economic situation was further exacerbated in early 2022 by the war in Ukraine. Once again, commodity prices were subject to rapid and significant swings, with crude oil not being an exception; its price soared to its highest level in the six-year period. Within this time frame, the prices in both the diesel and the gasoline markets underwent notable fluctuations.
The trend illustrated in Figure 1, where crude oil prices experienced a substantial surge between mid-2020 and the first half of 2022, deserves some further attention. In all likelihood, this surge can be attributed to OPEC’s policy of production cuts aimed at bolstering prices. Despite increased oil demand in 2021, OPEC adhered to its gradual output increase policy to maintain price support. However, as economic activity rose, withdrawals from storage were necessary to meet demand, resulting in decreased inventories. In the first half of 2022, the Russo-Ukraine war eruption, coupled with low crude oil inventories and supply concerns, contributed to crude oil prices reaching their highest inflation-adjusted level during the entire examined period.
Figure 1 clearly shows that the routes of the diesel and gasoline series, net of taxes and duties, fall within a narrow canal. The two routes are almost identical during a certain time period. However, just after the war eruption, the price gap opens further in favor of diesel. On the contrary, in the case of retail prices (taxes and duties included), a clear price gap is observed between the two time series throughout the whole time period. Another thing that emerges from Figure 1 is that since the beginning of the Russo-Ukraine war, diesel prices have been greater than those of gasoline. The pattern is evident when observing the prices that include taxes and duties (grey and yellow lines). Before the outbreak of the war, gasoline prices were consistently higher than diesel prices. However, this changed after the start of the war and remained so for the rest of the dataset. The same pattern holds true for prices net of taxes and duties.
Overall, it seems that (a) the implemented taxation policy within the EU states drives a price gap between the two fuels, as taxation on gasoline is steadily greater than that on diesel throughout the whole six-year period, and (b) the outbreak of war was a turning point that drove the diesel net price above the gasoline one, which is also true for the retail price, despite the lower applied taxation on diesel (Weekly Oil Bulletin of the European Commission’s Energy website).
The body of literature investigating the interplay between crude oil prices and several aspects of the economy is truly vast and multifaceted. Diesel and gasoline price dynamics have also been studied extensively, covering a plethora of subjects. One immensely studied topic involves analyzing the relation between crude oil prices and fuel prices, with a primary focus on how the fuel market responds to fluctuations in crude oil prices (Bennett et al. 2021; Owyang and Vermann 2014; Bettendorf et al. 2009; Chesnes 2016; Asane-Otoo and Dannemann 2022; Kristoufek and Lunackova 2015; Bergantino et al. 2020; Bakhat et al. 2022; Apergis and Vouzavalis 2018; Ederington et al. 2021; Bragoudakis et al. 2020; Karagiannis et al. 2015). Several other fields have been explored regarding the interrelation between fuel prices and the economy (Kpodar and Liu 2022; Kilian and Zhou 2022; Brueckner et al. 2023), tax regulations (Dovern et al. 2023; Drolsbach et al. 2023; Tiezzi and Verde 2016), food prices (Zingbagba et al. 2020; Diab and Karaki 2023), and supply chains (Fisher Ke et al. 2014; Milewska and Milewski 2022), among others. The primary objective of this study, as previously stated, is to analyze the fuel market (each of the two main fuels is examined separately) and its evolution over time, seeking potential price movement synchronization within EU distinct national markets. So far, numerous studies have focused on the fuel markets per se. Wlazlowski et al. (2009) investigated the variations in fuel prices across EU petroleum markets and discovered that these differences considerably affect local fuel price adjustments. Mutascu et al. (2022) examined whether diesel and gasoline prices in Germany, France, and Italy move in tandem. More specifically, they explored the effect that the different tax systems as well as international oil price fluctuations have on the fuel price co-movements. They found evidence in favor of price synchronization, which is not affected by the national tax systems. Dreher and Krieger (2008) examined the price convergence of different petroleum products and further the price convergence to the law of one price within the EU. They found that both producer and consumer prices converge, with the convergence being more pronounced in the former. However, they argue that despite the progressive improvement of the phenomenon, a completely integrated common market remains elusive. The study of Suvankulov et al. (2012) delves into price convergence within the Canadian retail gasoline market and investigates whether specific price regulation mechanisms in certain regions have influenced this convergence. While the impact of price regulation on convergence remains mixed, they do find that retail gasoline markets exhibit strong integration across the regions examined. However, the proportion of cities experiencing convergence declines significantly from 2006 onwards. In their study, Holmes et al. (2021) explored the Canadian retail gasoline markets and found evidence suggesting that these markets are not integrated, regardless of employing prices being either net or inclusive of taxes. Akhmedjonov and Lau (2012) investigated price convergence within the Russian energy market across four energy products: diesel, gasoline, electricity, and coal. Their findings reveal that Russia lacks fully integrated national energy markets, probably due to the peripheral positioning of divergent regions and the limited cross-border transmission capacity. Cárdenas et al. (2017) conducted a study to assess the degree of diesel market integration in France. Their findings indicate that most diesel price ratios among petrol stations maintain stable long-run relationships.
The study closest to ours is that of Mutascu et al. (2022). Their wavelet coherence analysis provides evidence in favor of co-movements between gasoline and diesel prices across all three countries under investigation, namely Germany, France, and Italy. The authors also found that different fuel tax systems in place do not affect these co-movements. Our research diverges from theirs in several aspects: While Mutascu et al. focused on specific countries (Germany, France, and Italy), our study encompasses all EU member states. Secondly, we investigate the fuel price co-movements within each fuel market (gasoline and diesel) separately. Regarding the methodology, our study introduces a novel approach by analyzing the EU within a Complex Network framework, which allows for an alternative viewpoint: EU is treated and analyzed as a graph in an effort to capture not only the behavior of individual member states but also the features of the entire network. In the subsequent paragraphs, we delve deeper into the added value of our research.
We consider the impact of this study on the literature from two distinct angles. At first, the focus is on the synchronization of fuel prices moves across a broad set of countries during a specific time period (which is divided into several consecutive intervals to catch the temporal evolution). Conversely to many studies, the selected period encompasses two world-level events (the COVID-19 pandemic and Russo-Ukraine war eruption) leading to pronounced fluctuations in international oil prices. We examine the fuel price co-movements and study the relationships developed among the countries. Subsequently, we devote attention to the clustering of the EU member states in terms of common behavior over time. The group of 26 countries that make up the European Union have the autonomy to set their own rules for national tax systems while adhering to the fundamental goals outlined in the EU’s founding treaties; these countries maintain their sovereignty and implement their own fuel taxation policies.
The international oil price has a significant effect on the determination of fuel prices, given the yield at which both diesel and gasoline are refined from crude oil10. Since this impact is generally consistent across all independent agents that are active in the fuel production and distribution industry—the oil price is determined in a roughly centralized and integrated market (Ji and Fan 2016)—at large, prices in both the diesel and gasoline markets are expected to move in the same direction. This is expected to be more intense in the case of the net prices, as the role of the crude oil price in shaping the net fuel prices is even greater. We analyze the European Union as a graph (network) using Complex Networks to objectively evaluate its behavior as a whole. This approach allows for a confident assessment of the extent to which the European Union behaves as a cohesive whole or whether its constituent units exhibit divergent behavior. In this manner, we may examine the properties of the network structure. This is our second perspective of this contribution and complement to the existing literature. To the best of our knowledge, no such approach with regard to the EU fuel market has been documented so far. Network analysis is a useful tool for modeling the relationships developed between entities. Complex networks find applications across various scientific disciplines such as biology, sociology, and economics. Moreover, they provide insights for analyzing the entire system holistically and consequently comprehending the overall network behavior.
To conduct the research, particular metrics and techniques from Complex Networks are employed. We carry out our study employing (a) the density dG of a graph G, which is a standard and widely used graph-level metric, and (b) the Threshold Weighted Minimum Dominating Set (TW-MDS). Both tools ensure a consistent temporal analysis of networks. This is of significance since the network that is examined in the current study is a dynamic one; the interconnections among the entities (member states) change in each of the consecutive time intervals the network is examined over. The TW-MDS method has already been utilized in finance and macroeconomics. Papadimitriou et al. (2020) examined the cryptocurrency market across three consecutive time periods and found evidence pointing to progress towards market synchronization as time passes through. In another work, Papadimitriou et al. (2022) examined the synchronization of thirty European countries on a set of macroeconomic variables within three successive time intervals and found mixed proof, indicating that different patterns in terms of convergence/divergence are present for the variables studied.
2. Materials and Methods
The current study is based on data obtained from the European Commission’s Energy website (Weekly Oil Bulletin (europa.eu)). The dataset covers 26 of the EU member states, as shown in Table 111. The data span a time period from 2017 to 2022 in weekly frequency, and the four variables we use in this study are the Euro Super 95 (gasoline) price net of taxes and duties, the automotive gas oil (diesel) price net of taxes and duties, the Euro Super 95 (gasoline) price inclusive of taxes and duties, and the automotive gas oil (diesel) price inclusive of taxes and duties. All processes are quoted in terms of 1000 L12.
Given that the aim of the research is to investigate the intertemporal evolution of fuel prices within the member states of the European Union and consequently the potential price synchronization, the 2017–2022 time period is split into six calendar years: 2017, 2018, 2019, 2020, 2021 and 2022.
For each of the variables, the research process unfolds as follows: each variable is studied in each different year. Thus, six networks are constructed corresponding to the six consecutive calendar years. The networks are composed of nodes and edges (links between the nodes). The nodes represent the EU member states and are therefore identical in all six networks. The edges correspond to the relationship between each pair of nodes and describe the temporal similarity among them. The value used for each edge corresponds to the relevant Pearson’s correlation coefficient and is calculated on the time series of the variable under examination as13:
are pairs of the observations of the variable under examination for the member states i and j. The correlation coefficient value ranges in [−1, 1] and quantifies the strength and direction of the linear relationship between the two countries. Values close to +1 indicate a strong positive relationship, and values close to −1 indicate a strong negative relationship. Values close to zero denote no linear relationship between the member states i and j.
Some key concepts of network analysis used in the empirical section of this paper are presented below.
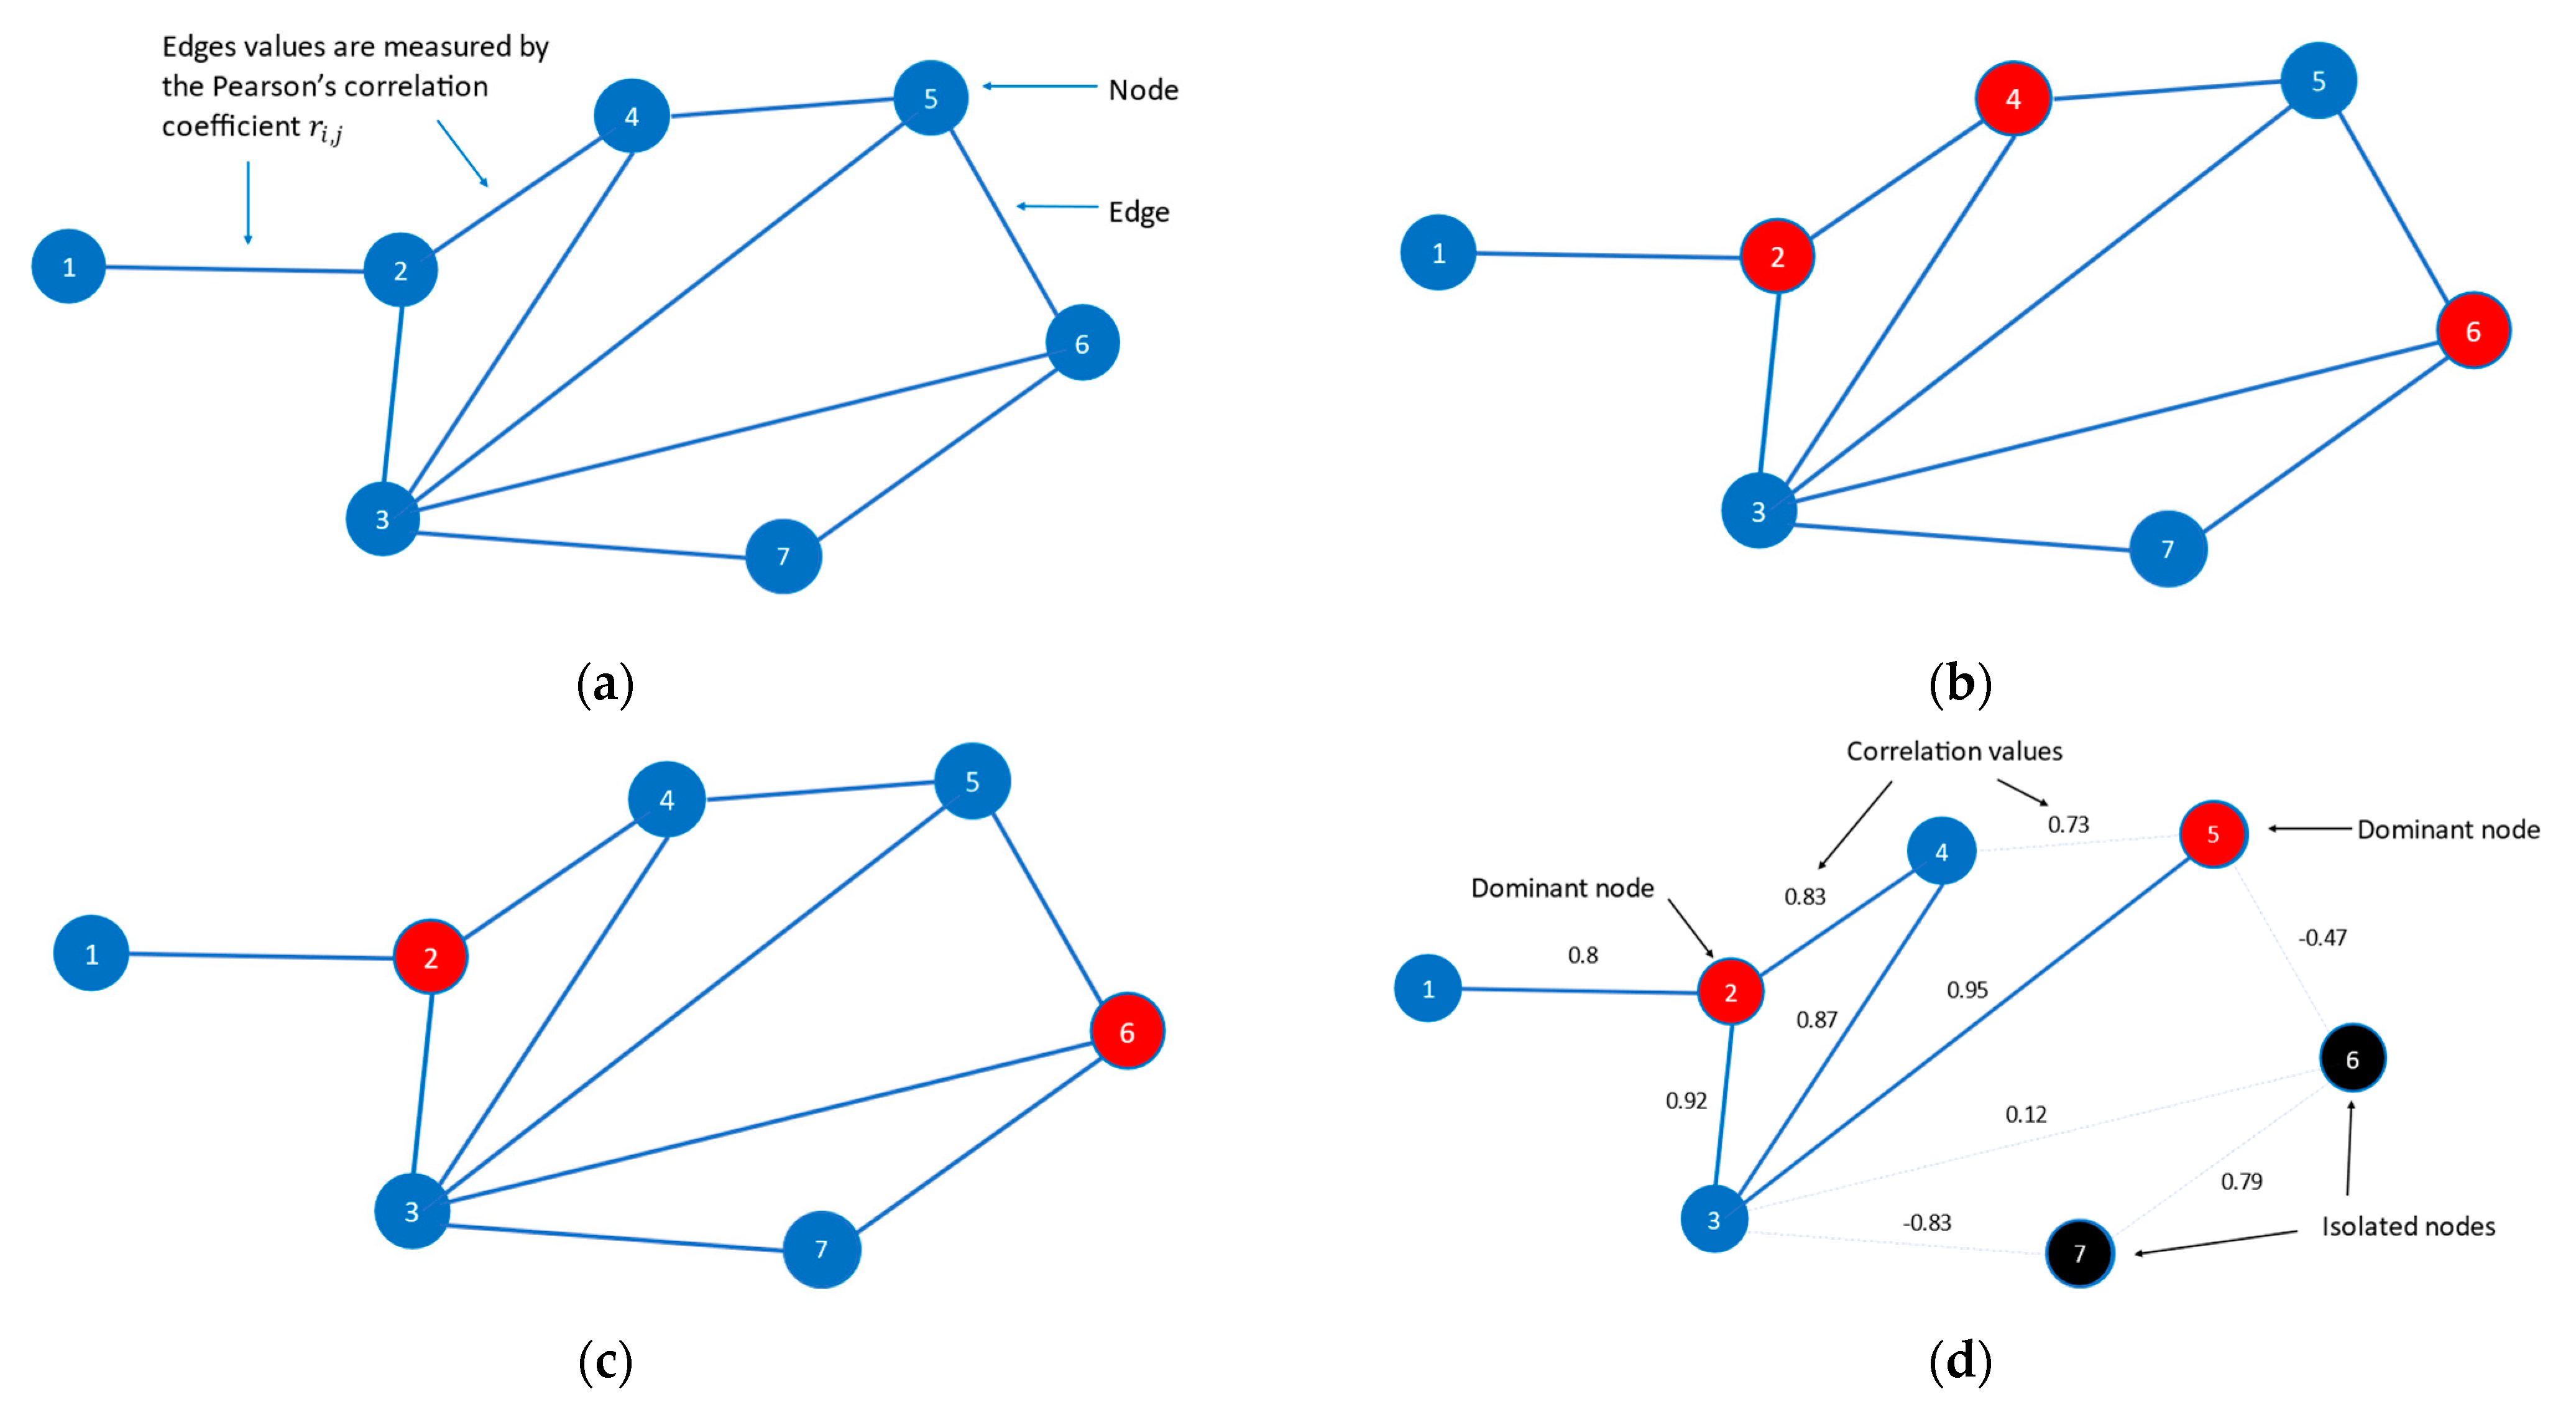
Graph/network: A graph G = (V, E) consists of a set of nodes V and a set of edges E through which the nodes are connected (i.e., an edge ei,j E links the nodes i and j V). As already mentioned, each edge ei,j E connecting the nodes i and j carries a value that is measured by the Pearson’s correlation coefficient (Figure 2a). This parameter measures the temporal similarity between the nodes i and j. In addition, the neighborhood Bi of node i is defined as the set of the nodes associated with node i, i.e., .
Isolated node: A node i V is called isolated when there is no edge linking it to the rest of the network.
Interconnected node: A node i V is called interconnected when it is linked to at least one other node in the network through an edge. In its initial configuration, the network of the current research is complete (there is an edge linking any pair of nodes, and thus, no isolated node exists).
Dominating set: A Dominating Set DS ⊆ V is a subset of the network interconnected nodes, which carries the following property: every node i that does not belong to the DS is linked to at least one DS node j through an edge ei,j, i.e., (Figure 2b).
For each of the n nodes of the network, a DS membership binary parameter xi, i = 1, 2, ..., n, is considered to symbolize its DS membership status, such that
Formula (3) is the mathematical expression of the DS concept:
An interconnected node i has to be either a node of the DS or adjacent (i.e., connected) to at least one such node. Yet, this does not constitute a mutually exclusive relationship; there might be nodes that verify both circumstances (Figure 2b). Furthermore, if a node i is interconnected, it is impossible to be neither a DS node nor linked to at least one node of the DS. Should the edges in a network indicate high similarity, the domination attribute has an intriguing effect: the behavior of the entire network can be effectively represented by the behavior of the DS (since the edges signify similarity, each member of the DS represents the behavior of its neighbors, and finally, the DS as a whole represents the entire network).
Minimum Dominating Set: The Minimum Dominating Set (MDS) is the DS with the smallest cardinality.
The identification of the Minimum Dominating Set (MDS) is achieved by applying condition (4) while adhering to the constraints specified in condition (3) (Figure 2c).
Given that at the epicenter of the current research lies the temporal similarity between the nodes, the MDS falls short of serving such an aim due to a built-in feature. In a correlation-based network, as is the case here, the edges do not necessarily represent similarity. Taking into consideration that the edges’ correlation values range in the interval [−1, 1], they may denote high positive, high negative, or no temporal similarity between nodes. To address this limitation, the MDS algorithm is modified according to Papadimitriou et al. (2014). Edges with low correlation values should not be considered in the MDS calculation process. The modification introduces an additional step before identifying the Minimum Dominating Set (MDS): the imposition of a threshold on the edges’ correlation values. This process eliminates all edges with values below the specified threshold level. As a result, the network may now exhibit two key features due to the imposition of the threshold: (a) it is no longer complete, and (b) isolated nodes may emerge due to the removal of edges (Figure 2d).
Threshold Minimum Dominating Set (T-MDS): The Threshold Minimum Dominating Set (T–MDS) algorithm involves two steps:
- Step 1:
- A threshold level is applied to the edges’ correlation values, resulting in the removal of edges with correlations lower than the specified threshold.
- Step 2:
- The MDS nodes are identified in the remaining network.
Except for the MDS set that comprises the dominant nodes, there is a likelihood that an additional set is also created; it contains the isolated nodes that emerged after the imposition of the threshold. The T-MDS consists of both of these sets14. Each dominant node represents a neighborhood; the latter consists of nodes interconnected to the dominant node. The nodes of a neighborhood may also be connected among themselves and/or simultaneously participate in multiple neighborhoods as well. Furthermore, they exhibit behavior similar to that of the dominant node, due to their high correlation evidenced by the surviving edge. In contrast, isolated nodes stand alone with no connections to other nodes in the network. Each of the isolated nodes displays an idiosyncratic and unique behavior that is distinct from any other node.
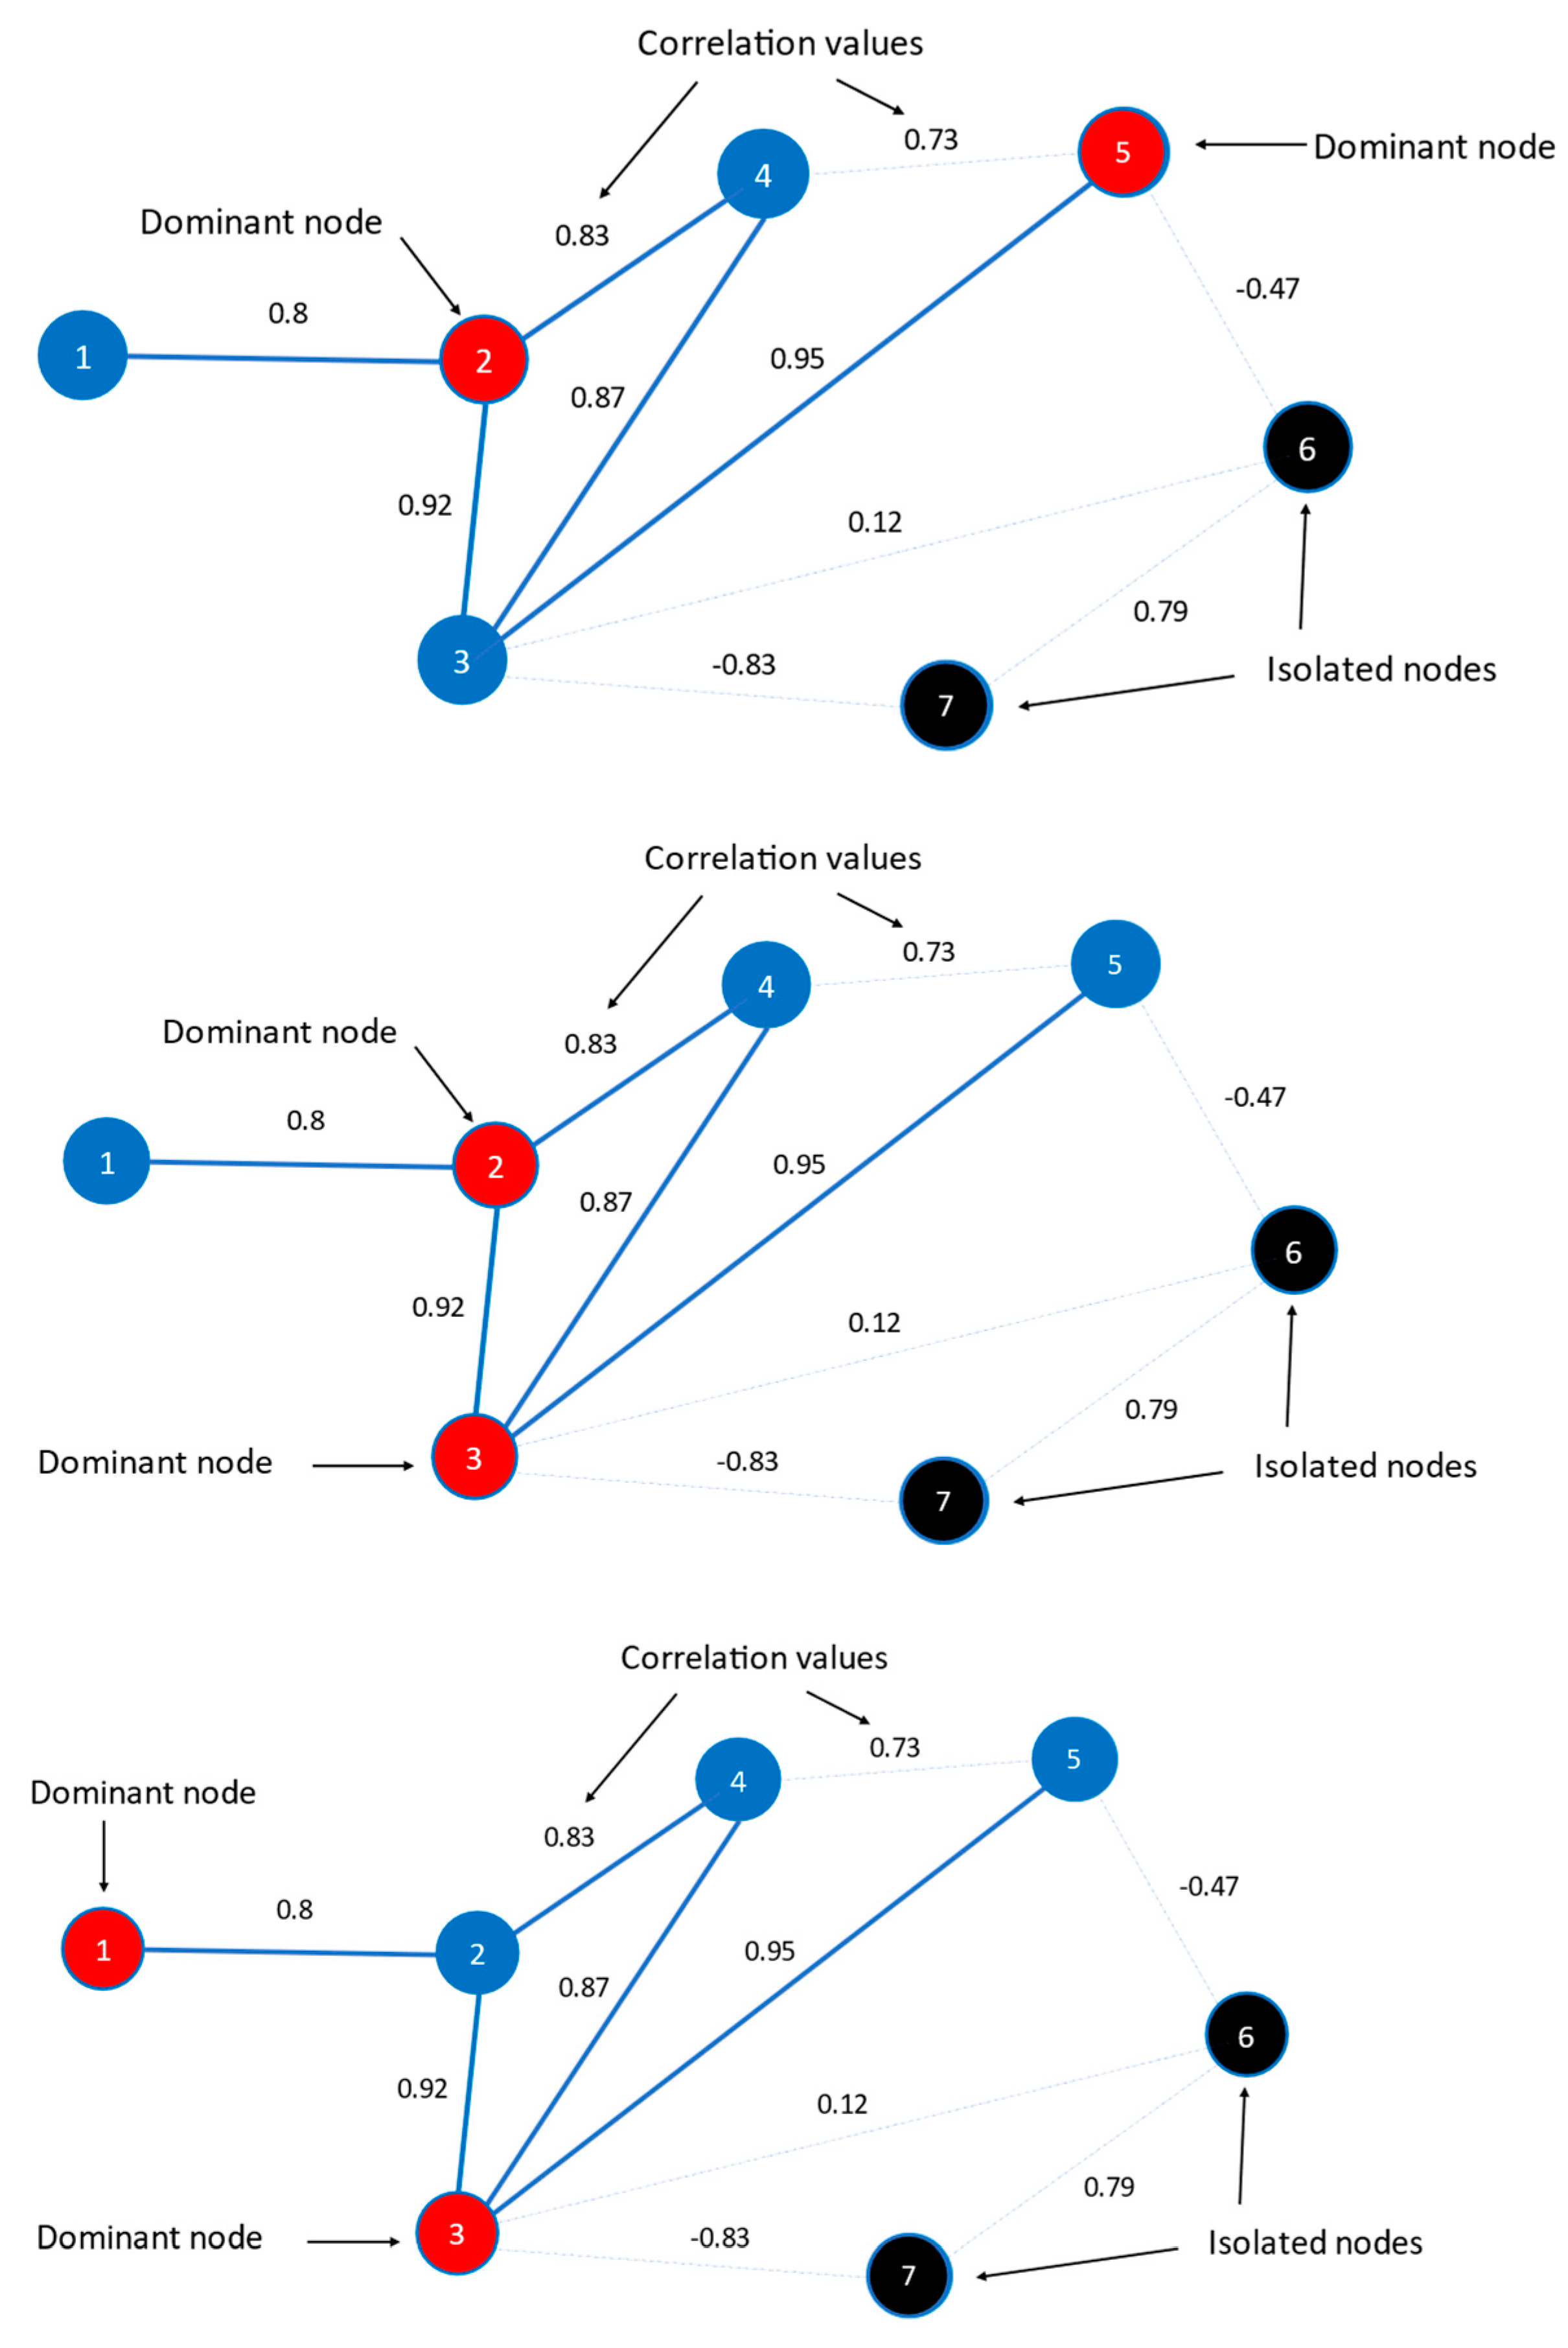
However, there is a challenge: the optimization algorithm used in T–MDS may yield multiple solutions. Unfortunately, there is no way algorithmically to control which specific case will arise (as shown in Figure 3). This inconsistency makes the T–MDS method unsuitable for temporal analysis.
To address this limitation, an enhancement was made within the T–MDS algorithm. The resulting variant is called Threshold Weighted Minimum Dominating Set (TW–MDS) (Papadimitriou et al. 2020, 2022). In this modified configuration, each node is assigned a weight wi according to formula (5).
The Threshold Weighted Minimum Dominating Set (TW–MDS) is determined by applying condition (5) subject to the constraints of condition (3). By incorporating node weights, the likelihood of multiple solutions arising from the optimization algorithm is effectively eliminated. Sufficiency is now guaranteed for temporal network analysis, as MDS generation remains consistent across different time periods. In the context of this research, each member state’s weight is inversely proportional to its 2021 Euro Super 95 (unleaded)/automotive gas oil (diesel) consumption measured in kt. Specifically, the higher a country’s consumption, the more it is promoted to be identified as a dominant node within the network (higher consumption means lower weight in a minimization problem).
The dynamics of the TW-MDS over time reveal valuable insights. An expanding Dominating Set suggests desynchronization among network entities. The network becomes less connected, necessitating additional dominant nodes to describe it. Conversely, a shrinking dominant node set indicates increased synchronization:: it points to a denser network that can be sufficiently described by fewer dominant nodes. The same principle applies to the set of isolated nodes.
Besides the TW-MDS method, the density dG, a graph-level metric, is also employed in the current analysis. It quantifies the degree of interconnection a network displays and is given by the formula:
Et measures the cardinality of the set of the edges15 after the thresholding step, and v is the number of the network nodes. A density value of 1 corresponds to a complete network, where all possible edges are realized. Conversely, a density of 0 indicates a disconnected network, where all nodes are isolated.
We deem that the two metrics described, the TW-MDS and the density, complement each other. Density is a standard metric used in networks that measures the relative multitude of the edges; the higher the density is, the more interconnected the nodes are. It is a fundamental network metric that yields a reliable general figure about the network’s overall state. Yet, it does not reveal whether the network is connected or not, nor does it show how the network is internally organized and thus the connection relations among the nodes (e.g., which nodes share common characteristics), as there might be networks that display exactly the same density, yet with different topologies. The TW-MDS is a more specialized tool; it reaches a deeper analysis level and provides accurate information concerning the neighborhoods that are formed. It displays the members and the dominant node of each neighborhood, the nodes left isolated, and whether the network is connected or broken up into several components. The TW-MDS metrics are quite important in the present study, as they shed light—except for the synchronization phenomenon—on the way that the nodes are clustered and consequently on the network topology arrangement. This way, a clear image of the behavior and the relations among specific nodes is formed. This approach could complement the existing tools used in network analysis.
3. Results and Discussion
For each of the variables under examination, six networks are constructed: one for each year from 2017 to 2022. The TW-MDS algorithm is applied to all six networks, while the density metric is simultaneously calculated for each of the six networks. The choice of threshold significantly impacts the network structure. Adjusting the threshold, the number of remaining edges is controlled, which in turn affects the number of dominant and isolated nodes and ultimately influences the size of the TW-MDS. When a high threshold is imposed, numerous edges are eliminated as the similarity criterion is strict. Conversely, a low threshold results in more edges surviving the thresholding step, which may compromise the similarity being examined. After testing a variety of alternative thresholds, we present the results from two threshold levels, 0.8 and 0.9. Given the topic examined16, we deem that these threshold levels offer a comprehensive depiction of the network’s evolution and the changes it undergoes over time. Moreover, strong relationships among the member states are better captured by the specific threshold levels. The results obtained from the network analysis with respect to each of the four variables are presented and discussed in Section 3.1, Section 3.2, Section 3.3 and Section 3.4. The temporal network structure for each of the examined variables and the corresponding graphical representation of these networks can be found in Figure A1, Figure A2, Figure A3 and Figure A4 (Appendix A).
3.1. Euro Super 95 (Gasoline) Prices Net of Taxes and Duties
The results concerning density and TW-MDS metrics for the 0.8 threshold level are displayed in Table 2. According to the metrics, the network exhibits its lowest density in 2017. However, from 2018 forward, the density increases to a great degree (it almost doubles) and continues to rise further until 2019. In 2020, the year of the pandemic outbreak, the density exhibits a slight decrease. In 2021, the network is fully interconnected, meaning that there is an edge linking any pair of nodes within the network, while in 2022, the density declines but still preserves a high value. Within all six years, there are either one or two dominant nodes in the network, while isolated nodes are observed only in the 2017 and 2022 networks (five isolated nodes and one isolated node, respectively). The network has undeniably shown a significant increase in connections in recent years, especially when compared to the connections observed in the first year under examination. This denotes that net gasoline prices of the member states follow the same direction over time, pointing to a network that becomes ever more synchronized (except 2022). This has an additional significance due to the relatively high threshold of 0.8 that we applied to the values of the edges (i.e., cross-correlations). Compared to 2017 and 2018, the member states exhibit increasingly similar behavior in later years.
The results for the 0.9 threshold level are also presented in Table 2. The pattern here, as expected, is similar to the aforementioned one. However, there is a noteworthy finding: the metrics in 2021 are almost identical for both the 0.8 and 0.9 levels. Regardless of the applied threshold, the network does not display any isolated node, while its density is preserved at a very high degree and the TW-MDS cardinality decreases at its lowest possible value. As was the case before, this finding is quite interesting considering the very high threshold that was implemented. Even in the 0.9 threshold level case, very few edges are removed from the network. In comparison to the previous years, the net gasoline prices move in tandem, denoting that the member states exhibit an almost identical behavior compared to all previous years. However, in 2022, the network does not preserve its high level of interconnectedness. The density drops to 0.57, and three isolated nodes are identified.
3.2. Euro Super 95 (Gasoline) Prices Inclusive of Taxes and Duties
All results with respect to the 0.8 and 0.9 thresholds are presented in Table 3. A quick overview of Table 3 suggests that, despite the different values, in general, there are no deviations from the patterns described in Section 3.1. For the 0.8 level, the density is as low as 0.35, and the TW-MDS consists of four dominant and three isolated nodes in 2017. Over time, all metrics are improved. However, in 2022, the density is halved from its absolute high in 2021, and two nodes are identified as isolated.
The trail followed in the 0.9 case is similar. In 2017, the density appears to be very low, and the TW-MDS counts three dominant and eleven isolated nodes. Despite the very high applied threshold, all metrics improve until 2021. On the contrary, the density in 2022 decreases steeply to almost a quarter of its previous value, and six nodes are identified as being isolated.
Comparing Table 2 and Table 3, it is clear that the implementation of taxes and duties on gasoline prices has a negative impact on price synchronization. Indeed, all metrics in Table 3 denote a network that is not as tight as in the case before the application of taxes and duties. The synchronization level is affected negatively across all years, except for the 2021 case. Especially in 2022, the impact is severe.
3.3. Diesel Prices Net of Taxes and Duties
Table 4 depicts the results for both threshold levels. More specifically, in 2017 for the 0.8 level, all results are better compared to those of gasoline; the density is much higher (0.66 versus 0.42), and there is one dominant and one isolated node as opposed to two and five, respectively (Table 2 and Table 4). In 2018, the metrics denote a quite dense network, indicating that the countries follow a path of common behavior in terms of the net diesel price evolution. Yet, in 2019, this path is discontinued. The density declines abruptly, and seven nodes are identified as isolated, meaning that the member states do not exhibit similar behaviors to the extent they did the previous year. The network state is reversed in 2020. The density hits almost its absolute high, and simultaneously, no isolated node is spotted. The same is true in 2021 as well. In 2022, although it declines, the density maintains a value of 0.81.
The same pattern holds for the 0.9 threshold. Between 2018 and 2019, there is a sharp contrast that is worth noting. The year 2019 is the year in which the network appears to be almost disconnected. The network density is just 0.06, nine nodes (over a third of the total) are identified as isolated and the dominant nodes are six. These findings emphasize the quite different behavior the member states demonstrate. Yet, in 2020 and more still in 2021, the situation is reversed. No isolated nodes are identified, and the density reaches almost its highest possible value. Despite the 0.9 threshold, the network in 2021 behaves as a cohesive whole due to the similar behavior that the member states exhibit. This does not hold in 2022, as the density drops to half, while the dominant and the isolated nodes are now three and two, respectively. The findings point to countries that do not manage to preserve the previous status in terms of their common behavior.
3.4. Diesel Prices Inclusive of Taxes and Duties
Reviewing Table 5 reveals that the patterns observed are more or less the same as the ones described in Section 3.3. Further, according to Table 4 and Table 5, the network constructed on the diesel price inclusive of taxes and duties contains fewer edges than the one based on the net price. This suggests that the imposition of taxes and duties on diesel prices has an adverse effect in what concerns the states’ similar behavior in terms of price evolution.
As was the case before (Section 3.3), there is a great difference between 2019 and 2021 in the 0.9 threshold incident. In 2019 almost half of the nodes (12 out of 26) are identified as isolated while the density of the network is 0.06, suggesting a network that suffers the loss of most of its edges. This is not true in 2021, as the network is almost complete. The density of 0.98, combined with the one dominant node and no isolated ones, indicates that the member states demonstrate a uniform behavior regarding the diesel price evolution. However, in 2022, the density declines from 0.98 to 0.3, and four nodes are recognized as isolated. The countries exhibit behaviors that are far from being fully aligned as was the case in 2021.
Based on the above results, some significant conclusions may be drawn:
- (a)
- In general, after 2017, both the gasoline and diesel prices in the EU have a similar evolution over time (except for 2019 in the case of diesel and 2022 in both fuel cases), as described by the metrics in Table 2, Table 3, Table 4 and Table 5. This interpretation is based on the metrics derived from the implementation of the 0.8 and 0.9 thresholds, which are rather high and strict.
- (b)
- The implementation of taxes and duties on fuels has a negative impact on the network synchronization regarding the strongly correlated upward and downward price co-movements. This is more evident in 2022, where the different fiscal policies applied in the member states lead to different trajectories in the evolution of fuel prices.
- (c)
- The case of diesel is somewhat different from that of gasoline and has two distinct features. The first one deals with the overall level of synchronization, which lies above the corresponding one of gasoline, as more edges are formed within the diesel networks. The second one has to do with the metrics in 2019, when they take a sharp turn for the worse. Given that the EU diesel consumption in 2019 remained stable compared to 2018 (data from the European Commission’s Energy website (Weekly Oil Bulletin (europa.eu)), it is rather unlikely that consumption influenced and caused the shift observed in 2019. It is also not possible that natural gas could have caused any turbulence in the diesel market (due to its role as an input in the refining process and simultaneously as a fuel that can be replaced with diesel in certain situations), as the 2019 prices for both household and non-household consumers are more or less at the same level as in 2018, according to the Eurostat natural gas price statistics. In the absence of any other event in 2019 that could potentially cause such a change in the metrics, it is possible that the observed sparser diesel network may point to different strategies of the oil companies across the EU in terms of profit margins.
- (d)
- Compared to the previous years, the high network density and the corresponding small TW-MDS size observed in 2021 for both fuels—whether net or including taxes and duties—reveals something quite interesting: the member states demonstrate a uniform behavior in terms of the price evolution, even for the remarkably high imposed threshold of 0.9. The specific status is more intense in the diesel network and seems to hold to a considerable extent also in 2020. This can be attributed to the pandemic outbreak that had a horizontal impact across all countries and the consequent measures imposed by governments, which acted in a coordinated manner to deal with the situation. The restriction of citizens’ movement and almost every human activity imposed in 2020 led to a dramatic decrease in fuel demand across all of Europe. In a way, the markets became equivalent to each other. All of the characteristics that shaped the market structures, and may have differentiated the individual European markets from each other in the previous years, were no longer in play, leading to a situation that in a sense could be described as “market homogeneity”. The same holds for 2021 as well. Several restrictions remained in place across the member states despite the recovery, since this was controlled and limited due to the fact that the economies recovered in a gradual and restrained way. At the same time, another factor that maintained the balance regarding the economies’ recovery was the ongoing supply disruptions that all countries suffered. However, the conditions in 2022 were different; the economies opened up at a full scale and reverted to the previous state, where the markets were characterized by features that were not common across all member states. At the same time, the eruption of war between Russia and Ukraine and the consequent turmoil in the oil market did not affect all states to the same extent. These two events may provide an explanation for the deterioration in metrics in 2022 that is observed across all four tables above. It seems that the pandemic outbreak and the Russo-Ukrainian war affected the fuel price co-movements across Europe, but in different directions. The former pushed countries further towards similar behavior, while the latter acted in the opposite direction, reducing the high level of common behavior the countries had previously experienced.
- (e)
- The imposition of a strict threshold has an interesting consequence regarding the formation of neighborhoods. The member states that end up being neighbors display an almost identical behavior. Although it is not a general rule for all neighborhoods, some of the neighborhoods formed in 2017, 2018, 2019, and 2022 (after the 0.9 threshold application) are composed of countries that seem to be geographical neighbors, indicating a strong relationship between them and a common behavior in terms of price evolution17.
4. Conclusions
The present work aims to contribute to the literature related to the diesel and gasoline price movements in the European markets over time. Furthermore, we consider that this work could provide support and be useful to national and EU authorities and policymakers in the energy sector.
Despite the recent increasing trend in the transportation sector, which dictates a transition toward alternative fuels and more specifically electric vehicles, the vast majority of EU transportation is still powered by diesel and gasoline. The present study deals with the evolution of fuel prices in the European Union. More specifically, both the gasoline and diesel markets in the EU member states are examined for the six-year period 2017–2022. The research is conducted within a Complex Network context. It focuses on the changes that the network undergoes over time and whether the prices tend to move in the same direction as well as the extent to which this occurs. To serve the study objective, we build a network of the 26 European countries for each type of fuel and year. The nodes of the network represent the member states, while the edges reflect the similarity of the countries based on thresholded cross-correlations calculated on their price time series. Since the fuel prices depend—except for the crude oil prices—on national taxes and duties as well, the impact of the latter on the price co-movements across time is also examined.
The main findings of this research provide insights into fuel market dynamics. As expected, except for 2017, the level of co-movement of fuel prices is high. Comparing the gasoline and diesel networks, the latter carries more connections among its nodes. This finding suggests that the pattern of price co-movement is stronger in the diesel markets than in the gasoline ones. Additionally, it seems that the fuel taxation policy implemented by each member country does have an impact on the price co-movements. The findings provide evidence in favor of the negative effect that the implementation of taxes and duties has, as the cross-correlation values decrease as compared to these obtained from the net prices before tax. Moreover, the highest level of price co-movements is observed in a period of restrained economic activity (in 2020 and more still in 2021, that was triggered by the COVID-19 pandemic outbreak. As soon as the economies recovered, the level of price co-movement declined.
Our methodology approach, as inferred solely from the metrics presented in Table 2, Table 3, Table 4 and Table 5—specifically density, dominating nodes, isolated nodes, and interconnected nodes—is characterized by condensed information. In that sense, one may have a more-than-sufficient view of the entire network, yet information regarding its topology is limited. Obtaining deeper insights requires additional information and can be time-consuming, especially for networks with hundreds or thousands of nodes. In our study, alongside the metrics in Table 2, Table 3, Table 4 and Table 5, we leverage all supplementary information about the network topology derived from the TW-MDS approach. This additional insight is documented in Figure A1, Figure A2, Figure A3 and Figure A4 in Appendix A.
There are several prospective areas of research in the future that could be complementary to the present study. One such obvious area could be the effect that the EU prohibition of importing Russian diesel and other refined oil products which was imposed as of 5 February 2023 had on the European fuel price co-movements. Given that Russian oil imports dropped significantly in 2023, as estimated by Eurostat (article for EU imports of energy products), the shortfall is covered by other sources, such as the U.S., the Middle East, and Asia. This situation requires the different routing of the fuel import flows which—due to increased transportation costs—will eventually impact the markets18. It would be interesting to see whether this impact is symmetric for all EU member countries. Another potential direction for future research could be the effect of other crisis events—that led to either a sharp rise or a drastic fall in oil prices—on the European fuel price co-movements. In this case, it would be interesting to contrast the results of those studies to this one. Moreover, further investigation of various factors that significantly impact fuel product prices—such as location, market size, competition level, and inventory levels—could serve as a promising area for future research. A deeper analysis of the variations in fuel taxation policies across EU countries would also provide valuable insights. Additionally, investigating the impact of oil companies’ profit margins on fuel prices and their co-movements presents an intriguing research avenue. Lastly, an alternative path for research could be the investigation of whether there is a long-run memory of fuel prices in Europe.
Author Contributions
Conceptualization, T.P. and P.G.; methodology, F.G., T.P. and P.G.; software, F.G..; validation, F.G., T.P. and P.G.; formal analysis, F.G., T.P. and P.G.; investigation, F.G., T.P. and P.G.; data curation, F.G., T.P. and P.G.; writing—original draft preparation, F.G., T.P. and P.G.; writing—review and editing, F.G., T.P. and P.G.; visualization, F.G.; supervision, T.P. and P.G.; project administration, T.P. and P.G.; funding acquisition, no funding was received. All authors have read and agreed to the published version of the manuscript.
Funding
This research received no external funding.
Data Availability Statement
Data were obtained from the European Commission’s Energy website (Weekly Oil Bulletin), Weekly Oil Bulletin (europa.eu).
Conflicts of Interest
The authors declare no conflict of interest.
Appendix A
The subsequent figures19 visually depict the network’s evolution over time (threshold level of 0.9). The figures on the upper level of the page concern the networks built on prices net of taxes and duties. The networks constructed on prices that include taxes and duties are displayed on the lower level of the page. Figure A1 and Figure A2 are about gasoline prices, while Figure A3 and Figure A4 relate to diesel prices. The nodes depicted with green color are the dominant ones, while those depicted with red color carry the isolated status. The gray nodes are the interconnected ones20. The edges that link a dominant node to any other node are colored green. Finally, the edges that connect any two interconnected nodes (but not a dominant one) are colored gray.
Figure A1.
EU network of the gasoline prices net of taxes and duties (2017 panel (a), 2018 panel (b), 2019 panel (c)) and inclusive of taxes and duties (2017 panel (d), 2018 panel (e), 2019 panel (f)).
Figure A1.
EU network of the gasoline prices net of taxes and duties (2017 panel (a), 2018 panel (b), 2019 panel (c)) and inclusive of taxes and duties (2017 panel (d), 2018 panel (e), 2019 panel (f)).

Figure A2.
EU network of the gasoline prices net of taxes and duties (2020 panel (a), 2021 panel (b), 2022 panel (c)) and inclusive of taxes and duties (2020 panel (d), 2021 panel (e), 2022 panel (f)).
Figure A2.
EU network of the gasoline prices net of taxes and duties (2020 panel (a), 2021 panel (b), 2022 panel (c)) and inclusive of taxes and duties (2020 panel (d), 2021 panel (e), 2022 panel (f)).

Figure A3.
EU network of the diesel prices net of taxes and duties (2017 panel (a), 2018 panel (b), 2019 panel (c)) and inclusive of taxes and duties (2017 panel (d), 2018 panel (e), 2019 panel (f)).
Figure A3.
EU network of the diesel prices net of taxes and duties (2017 panel (a), 2018 panel (b), 2019 panel (c)) and inclusive of taxes and duties (2017 panel (d), 2018 panel (e), 2019 panel (f)).

Figure A4.
EU network of the diesel prices net of taxes and duties (2020 panel (a), 2021 panel (b), 2022 panel (c)) and inclusive of taxes and duties (2020 panel (d), 2021 panel (e), 2022 panel (f)).
Figure A4.
EU network of the diesel prices net of taxes and duties (2020 panel (a), 2021 panel (b), 2022 panel (c)) and inclusive of taxes and duties (2020 panel (d), 2021 panel (e), 2022 panel (f)).

| 1 | Several factors involved in the supply–demand interaction are production/exploration capacity, reserves, technological developments, refining capacity, distribution, geopolitical tensions, natural disasters, etc. |
| 2 | This was the case in March–April of 2020, just after the outbreak of the COVID-19 pandemic. Government-imposed restrictions on citizen movement resulted in reduced oil demand which, combined with inadequate storage capacity, contributed to the sharp decline in crude oil prices (Figure 1). |
| 3 | The six years mentioned are the ones on which the current research was conducted. |
| 4 | EU energy consumption data are available until 2021. |
| 5 | The law imposes the goal of making the EU carbon neutral by 2050 (while some emissions may continue to exist, they should be balanced through carbon capture mechanisms, such as soil and forest management). This commitment involves reducing the dependence on oil, within a reliable framework to ensure that the economic growth and social welfare are not jeopardized. Within this context, vehicles with internal combustion engines will continue to circulate. However, from 2035 onwards, it is obligatory for all new passenger cars and light commercial vehicles that enter the market to be zero-CO2-emitting vehicles, for the EU CO2 goal in 2050 to be met ((Regulation (EU) 2023/851 of the European Parliament and of the Council of 19 April 2023 amending Regulation (EU) 2019/631 as regards strengthening the CO2 emission performance standards for new passenger cars and new light commercial vehicles in line with the Union’s increased climate ambition (Text with EEA relevance) EUR-Lex-32023R0851-EN-EUR-Lex (europa.eu)). |
| 6 | The market share of electric vehicles—either BEVs (battery electric vehicles) or PHEVs (plug-in hybrid electric vehicles)—has been gradually increasing over the years, though is still low. According to data from the European Environment Agency, in 2022, only one out of five new car registrations in the EU is regarded an electric vehicle. |
| 7 | Downstream operations refer to the production and sale of finished products to consumers. In the oil industry, downstream products are those that come from the crude oil refining process, such as diesel and gasoline. |
| 8 | In their research, Gharib et al. (2021) study the impact of the COVID-19 pandemic on crude oil, diesel, and gasoline prices in 2020. They find that while diesel and gasoline prices are primarily driven by fundamental factors, crude oil prices encounter a negative bubble. |
| 9 | However, persistent supply disruptions continued to impact various sectors. |
| 10 | According to the U.S. Energy Information Administration, on average from the U.S. petroleum refineries, gasoline is produced with a yield of about 46.67% from crude oil, while diesel has an approximate yield of 29.98% (averaged over the 2017–2022 period). These yields fluctuate seasonally and geographically as refiners adapt their operations to meet varying fuel demands. |
| 11 | Malta, although it is a member state of the EU, is excluded from the dataset due to its policy on oil price stability at the pumps that was introduced in 2013. Owing to this policy, the oil prices did not fluctuate across long time periods in contrast to the international oil price fluctuations. Therefore, the presence of Malta in the dataset does not serve the purpose of the current research. The UK is also excluded from the dataset, as it withdrew from the EU in 2020. |
| 12 | As stated within the Weekly Oil Bulletin (europa.eu), “The prices communicated by the Member States are the prices most frequently charged, based on a weighted average”. |
| 13 | Due to the price fluctuations, it is plausible that not all edge values remain stable across time. |
| 14 | Given that each isolated node represents solely itself and thus is not represented by any other node, in a sense, it is a dominant node as well. However in the current research, in order for any confusion to be avoided, such nodes are described as isolated nodes. |
| 15 | The density calculation is directly affected by the threshold level. Although in its initial setup, the network of the current study is complete, after the threshold imposition on the edge values, several edges are removed from the network. Thus, Et counts the edges that survived the thresholding step. |
| 16 | See also the penultimate paragraph in “Introduction” where it is stated that “…at large, prices in both the diesel and gasoline markets are expected to move in the same direction”. |
| 17 | All relevant detailed results are available upon request. |
| 18 | This fact brings to the surface the challenges related to security of supply risks that might emerge, due to the persistent high import dependency of the European Union on crude oil and petroleum products over time, according to the Eurostat data for energy import dependency. Although this dependency decreased in 2021, it still remains at elevated levels. This fact becomes even more important under the consideration that a significant portion of the European Union’s imported oil originates from geopolitically unstable regions, including countries like Libya, Iraq, and Russia. |
| 19 | The graphs were created using the Open Graph Viz Platform Gephi (https://gephi.org, accessed on 21 November 2023). |
| 20 | A dominant node is by definition an interconnected one. However, in the visual network representation, it is colored green in order to be distinguished from the rest of the interconnected nodes. |
References
- Akhmedjonov, Alisher, and Chi Keung Lau. 2012. Do energy prices converge across Russian regions? Economic Modelling 29: 1623–31. [Google Scholar] [CrossRef]
- Apergis, Nicholas, and Grigorios Vouzavalis. 2018. Asymmetric pass through of oil prices to gasoline prices: Evidence from a new country sample. Energy Policy 114: 519–28. [Google Scholar] [CrossRef]
- Asane-Otoo, Emmanuel, and Bernhard C. Dannemann. 2022. Rockets and Feathers Revisited: Asymmetric Retail Gasoline Pricing in the Era of Market Transparency. Energy Journal 43: 103–22. [Google Scholar] [CrossRef]
- Bakhat, Mohcine, Jaume Rosselló, and Andreu Sansó. 2022. Price transmission between oil and gasoline and diesel: A new measure for evaluating time asymmetries. Energy Economics 106: 105766. [Google Scholar] [CrossRef]
- Bennett, Julie, Michael Owyang, and E. Katarina Vermann. 2021. Regional Gasoline Price Dynamics. Review 103: 3885398. [Google Scholar] [CrossRef]
- Bergantino, Angela S., Claudia Capozza, and Mario Intini. 2020. Empirical investigation of retail fuel pricing: The impact of spatial interaction, competition and territorial factors. Energy Economics 90: 104876. [Google Scholar] [CrossRef]
- Bettendorf, Leon, Stéphanie A. van der Geest, and Gerard H. Kuper. 2009. Do daily retail gasoline prices adjust asymmetrically? Journal of Applied Statistics 36: 385–97. [Google Scholar] [CrossRef]
- Bragoudakis, Zacharias, Stavros Degiannakis, and George Filis. 2020. Oil and pump prices: Testing their asymmetric relationship in a robust way. Energy Economics 88: 104755. [Google Scholar] [CrossRef]
- Brueckner, Markus, Haidi Hong, and Joaquin Vespignani. 2023. Regulation of Petrol and Diesel Prices and Their Effects on GDP Growth: Evidence from China. CAMA Working Paper 17/2023. Canberra: Centre for Applied Macroeconomic Analysis, Crawford School of Public Policy, The Australian National University. [Google Scholar]
- Cárdenas, Jeisson, Luis H. Gutiérrez, and Jesús Otero. 2017. Investigating diesel market integration in France: Evidence from micro data. Energy Economics 63: 314–21. [Google Scholar] [CrossRef]
- Chesnes, Matthew. 2016. Asymmetric Pass-Through in U.S. gasoline prices. Energy Journal 37: 153–80. [Google Scholar] [CrossRef]
- Diab, Sara, and Mohamad B. Karaki. 2023. Do increases in gasoline prices cause higher food prices? Energy Economics 127: 107066. [Google Scholar] [CrossRef]
- Dovern, Jonas, Johannes Frank, Alexander Glas, Lena Sophia Müller, and Daniel Perico Ortiz. 2023. Estimating pass-through rates for the 2022 tax reduction on fuel prices in Germany. Energy Economics 126: 106948. [Google Scholar] [CrossRef]
- Dreher, Axel, and Tim Krieger. 2008. Do prices for petroleum products converge in a unified Europe with non-harmonized tax rates? Energy Journal 29: 61–88. [Google Scholar] [CrossRef]
- Drolsbach, Chiara Patricia, Maximilian Maurice Gail, and Phil-Adrian Klotz. 2023. Pass-through of temporary fuel tax reductions: Evidence from Europe. Energy Policy 183: 113833. [Google Scholar] [CrossRef]
- Ederington, Louis H., Chitru S. Fernando, Thomas K. Lee, Scott C. Linn, and Huiming Zhang. 2021. The relation between petroleum product prices and crude oil prices. Energy Economics 94: 105079. [Google Scholar] [CrossRef]
- Gharib, Cheima, Salma Mefteh-Wali, Vanessa Serret, and Sami Ben Jabeur. 2021. Impact of COVID-19 pandemic on crude oil prices: Evidence from Econophysics approach. Resources Policy 74: 102392. [Google Scholar] [CrossRef]
- Holmes, Mark J., Jesús Otero, and Theodore Panagiotidis. 2021. Convergence in retail gasoline prices: Insights from Canadian cities. Annals of Regional Science 68: 1–22. [Google Scholar] [CrossRef]
- Ji, Qiang, and Ying Fan. 2016. Evolution of the world crude oil market integration: A graph theory analysis. Energy Economics 53: 90–100. [Google Scholar] [CrossRef]
- Karagiannis, Stelios, Yannis Panagopoulos, and Prodromos Vlamis. 2015. Are unleaded gasoline and diesel price adjustments symmetric? A comparison of the four largest EU retail fuel markets. Economic Modelling 48: 281–91. [Google Scholar] [CrossRef]
- Ke, Jian-yu “Fisher”, Martin Dresner, and Yuliang Yao. 2014. An empirical analysis of the impact of fuel costs on the level and distribution of manufacturing inventory in the United States. Transportation Journal 53: 5–25. [Google Scholar] [CrossRef]
- Kilian, Lutz, and Xiaoqing Zhou. 2022. The impact of rising oil prices on U.S. inflation and inflation expectations in 2020–23. Energy Economics 113: 106228. [Google Scholar] [CrossRef]
- Kpodar, Kangni, and Boya Liu. 2022. The distributional implications of the impact of fuel price increases on inflation. Energy Economics 108: 105909. [Google Scholar] [CrossRef]
- Kristoufek, Ladislav, and Petra Lunackova. 2015. Rockets and feathers meet Joseph: Reinvestigating the oil-gasoline asymmetry on the international markets. Energy Economics 49: 1–8. [Google Scholar] [CrossRef]
- Milewska, Beata, and Dariusz Milewski. 2022. Implications of Increasing Fuel Costs for Supply Chain Strategy. Energies 15: 6934. [Google Scholar] [CrossRef]
- Mundell, Robert A. 1961. A Theory of Optimum Currency Areas. The American Economic Review 51: 657–65. [Google Scholar]
- Mutascu, Mihai Ioan, Claudiu Tiberiu Albulescu, Nicholas Apergis, and Cosimo Magazzino. 2022. Do gasoline and diesel prices co-move? Evidence from the time–frequency domain. Environmental Science and Pollution Research 29: 68776–95. [Google Scholar] [CrossRef]
- Owyang, Michael T., and E. Katarina Vermann. 2014. Rockets and Feathers: Why Don’t Gasoline Prices Always Move in Sync with Oil Prices? St. Louis: Federal Reserve Bank of St. Louis Publications. Available online: https://www.stlouisfed.org/publications/regional-economist/october-2014/rockets-and-feathers-why-dont-gasoline-prices-always-move-in-sync-with-oil-prices (accessed on 5 April 2024).
- Papadimitriou, Theophilos, Periklis Gogas, and Fotios Gkatzoglou. 2020. The evolution of the cryptocurrencies market: A Complex Networks approach. Journal of Computational and Applied Mathematics 376: 112831. [Google Scholar] [CrossRef]
- Papadimitriou, Theophilos, Periklis Gogas, and Fotios Gkatzoglou. 2022. The Convergence Evolution in Europe from a Complex Networks Perspective. Journal of Risk and Financial Management 15: 457. [Google Scholar] [CrossRef]
- Papadimitriou, Theophilos, Periklis Gogas, Georgios Sarantitis, and Maria Matthaiou. 2014. Analysis of Network Topology Using the Threshold-Minimum Dominating Set. SSRN Electronic Journal. [Google Scholar] [CrossRef]
- Spiteri, Gianfranco, James Fielding, Michaela Diercke, Christine Campese, Vincent Enouf, Alexandre Gaymard, Antonino Bella, Paola Sognamiglio, Maria José Sierra Moros, Antonio Nicolau Riutort, and et al. 2020. First cases of coronavirus disease 2019 (COVID-19) in the WHO European Region, 24 January to 21 February 2020. Eurosurveillance 25: 1–6. [Google Scholar] [CrossRef]
- Suvankulov, Farrukh, Marco Chi Keung Lau, and Fatma Ogucu. 2012. Price regulation and relative price convergence: Evidence from the retail gasoline market in Canada. Energy Policy 40: 325–34. [Google Scholar] [CrossRef]
- Tiezzi, Silvia, and Stefano F. Verde. 2016. Differential demand response to gasoline taxes and gasoline prices in the U.S. Resource and Energy Economics 44: 71–91. [Google Scholar] [CrossRef]
- Walker, Nigel. 2023. Conflict in Ukraine: A Timeline (2014–Present). London: House of Commons Library. [Google Scholar]
- Wlazlowski, Szymon, Monica Giulietti, Jane Binner, and Costas Milas. 2009. Price dynamics in European petroleum markets. Energy Economics 31: 99–108. [Google Scholar] [CrossRef]
- Zingbagba, Mark, Rubens Nunes, and Muriel Fadairo. 2020. The impact of diesel price on upstream and downstream food prices: Evidence from São Paulo. Energy Economics 85: 104531. [Google Scholar] [CrossRef]
Figure 1.
Crude oil prices (data were obtained from the U.S. Energy Information Administration) and prices of diesel and Euro Super 95 (gasoline) net/inclusive of duties and taxes—EU27 weighted average (data were obtained from the Weekly Oil Bulletin of the European Commission’s Energy website). The red dashed line refers to the 27th of January 2020, the date that COVID-19 surveillance was implemented in the WHO European Region (Spiteri et al. 2020), while the black dashed line refers to the 24th of February 2022, the date that the Russo-Ukraine war erupted (Walker 2023).

Figure 2.
(a) Presentation of a graph paradigm, where each edge’s value is measured by the Pearson’s correlation coefficient . (b) A Dominating Set of the network (red nodes), (c) a Minimum Dominating Set of the network (red nodes), (d) a Threshold Minimum Dominating Set of the network (a threshold of 0.8 was implemented). The edges portrayed with dashed lines did not survive the thresholding step.

Figure 3.
A seven-node network with three possible Minimum Dominating Sets (a threshold of 0.8 was implemented).
Figure 3.
A seven-node network with three possible Minimum Dominating Sets (a threshold of 0.8 was implemented).


Table 1.
The 26 member states of the European Union in the dataset (alphabetical order).
| 1 | Austria | 14 | Ireland |
| 2 | Belgium | 15 | Italia |
| 3 | Bulgaria | 16 | Latvia |
| 4 | Croatia | 17 | Lithuania |
| 5 | Cyprus | 18 | Luxemburg |
| 6 | Czech Republic | 19 | Netherlands |
| 7 | Denmark | 20 | Poland |
| 8 | Estonia | 21 | Portugal |
| 9 | Finland | 22 | Romania |
| 10 | France | 23 | Slovakia |
| 11 | Germany | 24 | Slovenia |
| 12 | Greece | 25 | Spain |
| 13 | Hungary | 26 | Sweden |
Table 2.
Network metrics for 0.8 and 0.9 threshold levels on gasoline prices net of taxes and duties.
Table 2.
Network metrics for 0.8 and 0.9 threshold levels on gasoline prices net of taxes and duties.
| Metrics | 2017 | 2018 | 2019 | 2020 | 2021 | 2022 | ||
|---|---|---|---|---|---|---|---|---|
| threshold | 0.8 | Density | 0.42 | 0.81 | 0.92 | 0.87 | 1.00 | 0.82 |
| Dominant Nodes | 2 | 1 | 1 | 2 | 1 | 2 | ||
| Isolated Nodes | 5 | 0 | 0 | 0 | 0 | 1 | ||
| Interconnected Nodes | 21 | 26 | 26 | 26 | 26 | 25 | ||
| 0.9 | Density | 0.14 | 0.46 | 0.58 | 0.59 | 0.94 | 0.57 | |
| Dominant Nodes | 2 | 3 | 3 | 2 | 1 | 2 | ||
| Isolated Nodes | 10 | 1 | 0 | 1 | 0 | 3 | ||
| Interconnected Nodes | 16 | 25 | 26 | 25 | 26 | 23 |
Table 3.
Network metrics for 0.8 and 0.9 threshold levels on gasoline prices inclusive of taxes and duties.
Table 3.
Network metrics for 0.8 and 0.9 threshold levels on gasoline prices inclusive of taxes and duties.
| Metrics | 2017 | 2018 | 2019 | 2020 | 2021 | 2022 | ||
|---|---|---|---|---|---|---|---|---|
| threshold | 0.8 | Density | 0.35 | 0.78 | 0.86 | 0.82 | 1.00 | 0.56 |
| Dominant Nodes | 4 | 1 | 1 | 2 | 1 | 2 | ||
| Isolated Nodes | 3 | 0 | 0 | 0 | 0 | 2 | ||
| Interconnected Nodes | 23 | 26 | 26 | 26 | 26 | 24 | ||
| 0.9 | Density | 0.10 | 0.41 | 0.52 | 0.55 | 0.93 | 0.25 | |
| Dominant Nodes | 3 | 3 | 3 | 3 | 1 | 2 | ||
| Isolated Nodes | 11 | 1 | 0 | 1 | 0 | 6 | ||
| Interconnected Nodes | 15 | 25 | 26 | 25 | 25 | 20 |
Table 4.
Network metrics for 0.8 and 0.9 threshold levels on diesel prices net of taxes and duties.
| Metrics | 2017 | 2018 | 2019 | 2020 | 2021 | 2022 | ||
|---|---|---|---|---|---|---|---|---|
| threshold | 0.8 | Density | 0.66 | 0.95 | 0.30 | 0.99 | 1.00 | 0.81 |
| Dominant Nodes | 1 | 1 | 1 | 1 | 1 | 2 | ||
| Isolated Nodes | 1 | 0 | 7 | 0 | 0 | 1 | ||
| Interconnected Nodes | 25 | 26 | 19 | 26 | 26 | 25 | ||
| 0.9 | Density | 0.28 | 0.67 | 0.06 | 0.83 | 0.99 | 0.54 | |
| Dominant Nodes | 4 | 2 | 6 | 1 | 1 | 3 | ||
| Isolated Nodes | 6 | 1 | 9 | 0 | 0 | 2 | ||
| Interconnected Nodes | 20 | 25 | 17 | 26 | 26 | 24 |
Table 5.
Network metrics for 0.8 and 0.9 threshold levels on diesel prices inclusive of taxes and duties.
Table 5.
Network metrics for 0.8 and 0.9 threshold levels on diesel prices inclusive of taxes and duties.
| Metrics | 2017 | 2018 | 2019 | 2020 | 2021 | 2022 | ||
|---|---|---|---|---|---|---|---|---|
| threshold | 0.8 | Density | 0.62 | 0.96 | 0.28 | 0.95 | 1.00 | 0.67 |
| Dominant Nodes | 1 | 1 | 3 | 1 | 1 | 2 | ||
| Isolated Nodes | 2 | 0 | 6 | 0 | 0 | 1 | ||
| Interconnected Nodes | 24 | 26 | 20 | 26 | 26 | 25 | ||
| 0.9 | Density | 0.21 | 0.61 | 0.06 | 0.75 | 0.98 | 0.30 | |
| Dominant Nodes | 5 | 2 | 4 | 2 | 1 | 3 | ||
| Isolated Nodes | 5 | 1 | 12 | 0 | 0 | 4 | ||
| Interconnected Nodes | 21 | 25 | 14 | 26 | 26 | 22 |
Disclaimer/Publisher’s Note: The statements, opinions and data contained in all publications are solely those of the individual author(s) and contributor(s) and not of MDPI and/or the editor(s). MDPI and/or the editor(s) disclaim responsibility for any injury to people or property resulting from any ideas, methods, instructions or products referred to in the content. |
© 2024 by the authors. Licensee MDPI, Basel, Switzerland. This article is an open access article distributed under the terms and conditions of the Creative Commons Attribution (CC BY) license (https://creativecommons.org/licenses/by/4.0/).
Share and Cite
MDPI and ACS Style
Gkatzoglou, F.; Papadimitriou, T.; Gogas, P. Fuel Price Networks in the EU. Economies 2024, 12, 102. https://0-doi-org.brum.beds.ac.uk/10.3390/economies12050102
AMA Style
Gkatzoglou F, Papadimitriou T, Gogas P. Fuel Price Networks in the EU. Economies. 2024; 12(5):102. https://0-doi-org.brum.beds.ac.uk/10.3390/economies12050102
Chicago/Turabian StyleGkatzoglou, Fotios, Theophilos Papadimitriou, and Periklis Gogas. 2024. "Fuel Price Networks in the EU" Economies 12, no. 5: 102. https://0-doi-org.brum.beds.ac.uk/10.3390/economies12050102
Note that from the first issue of 2016, this journal uses article numbers instead of page numbers. See further details here.