
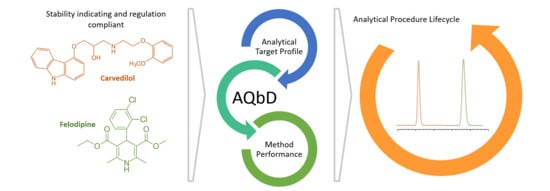
Stability-Indicating UPLC-PDA-QDa Methodology for Carvedilol and Felodipine in Fixed-Dose Combinations Using AQbD Principles

Abstract
:
1. Introduction
2. Materials and Methods
2.1. Chemicals and Reagents
2.2. Standards, Samples, and Excipients
2.3. Equipment
2.4. Method Validation
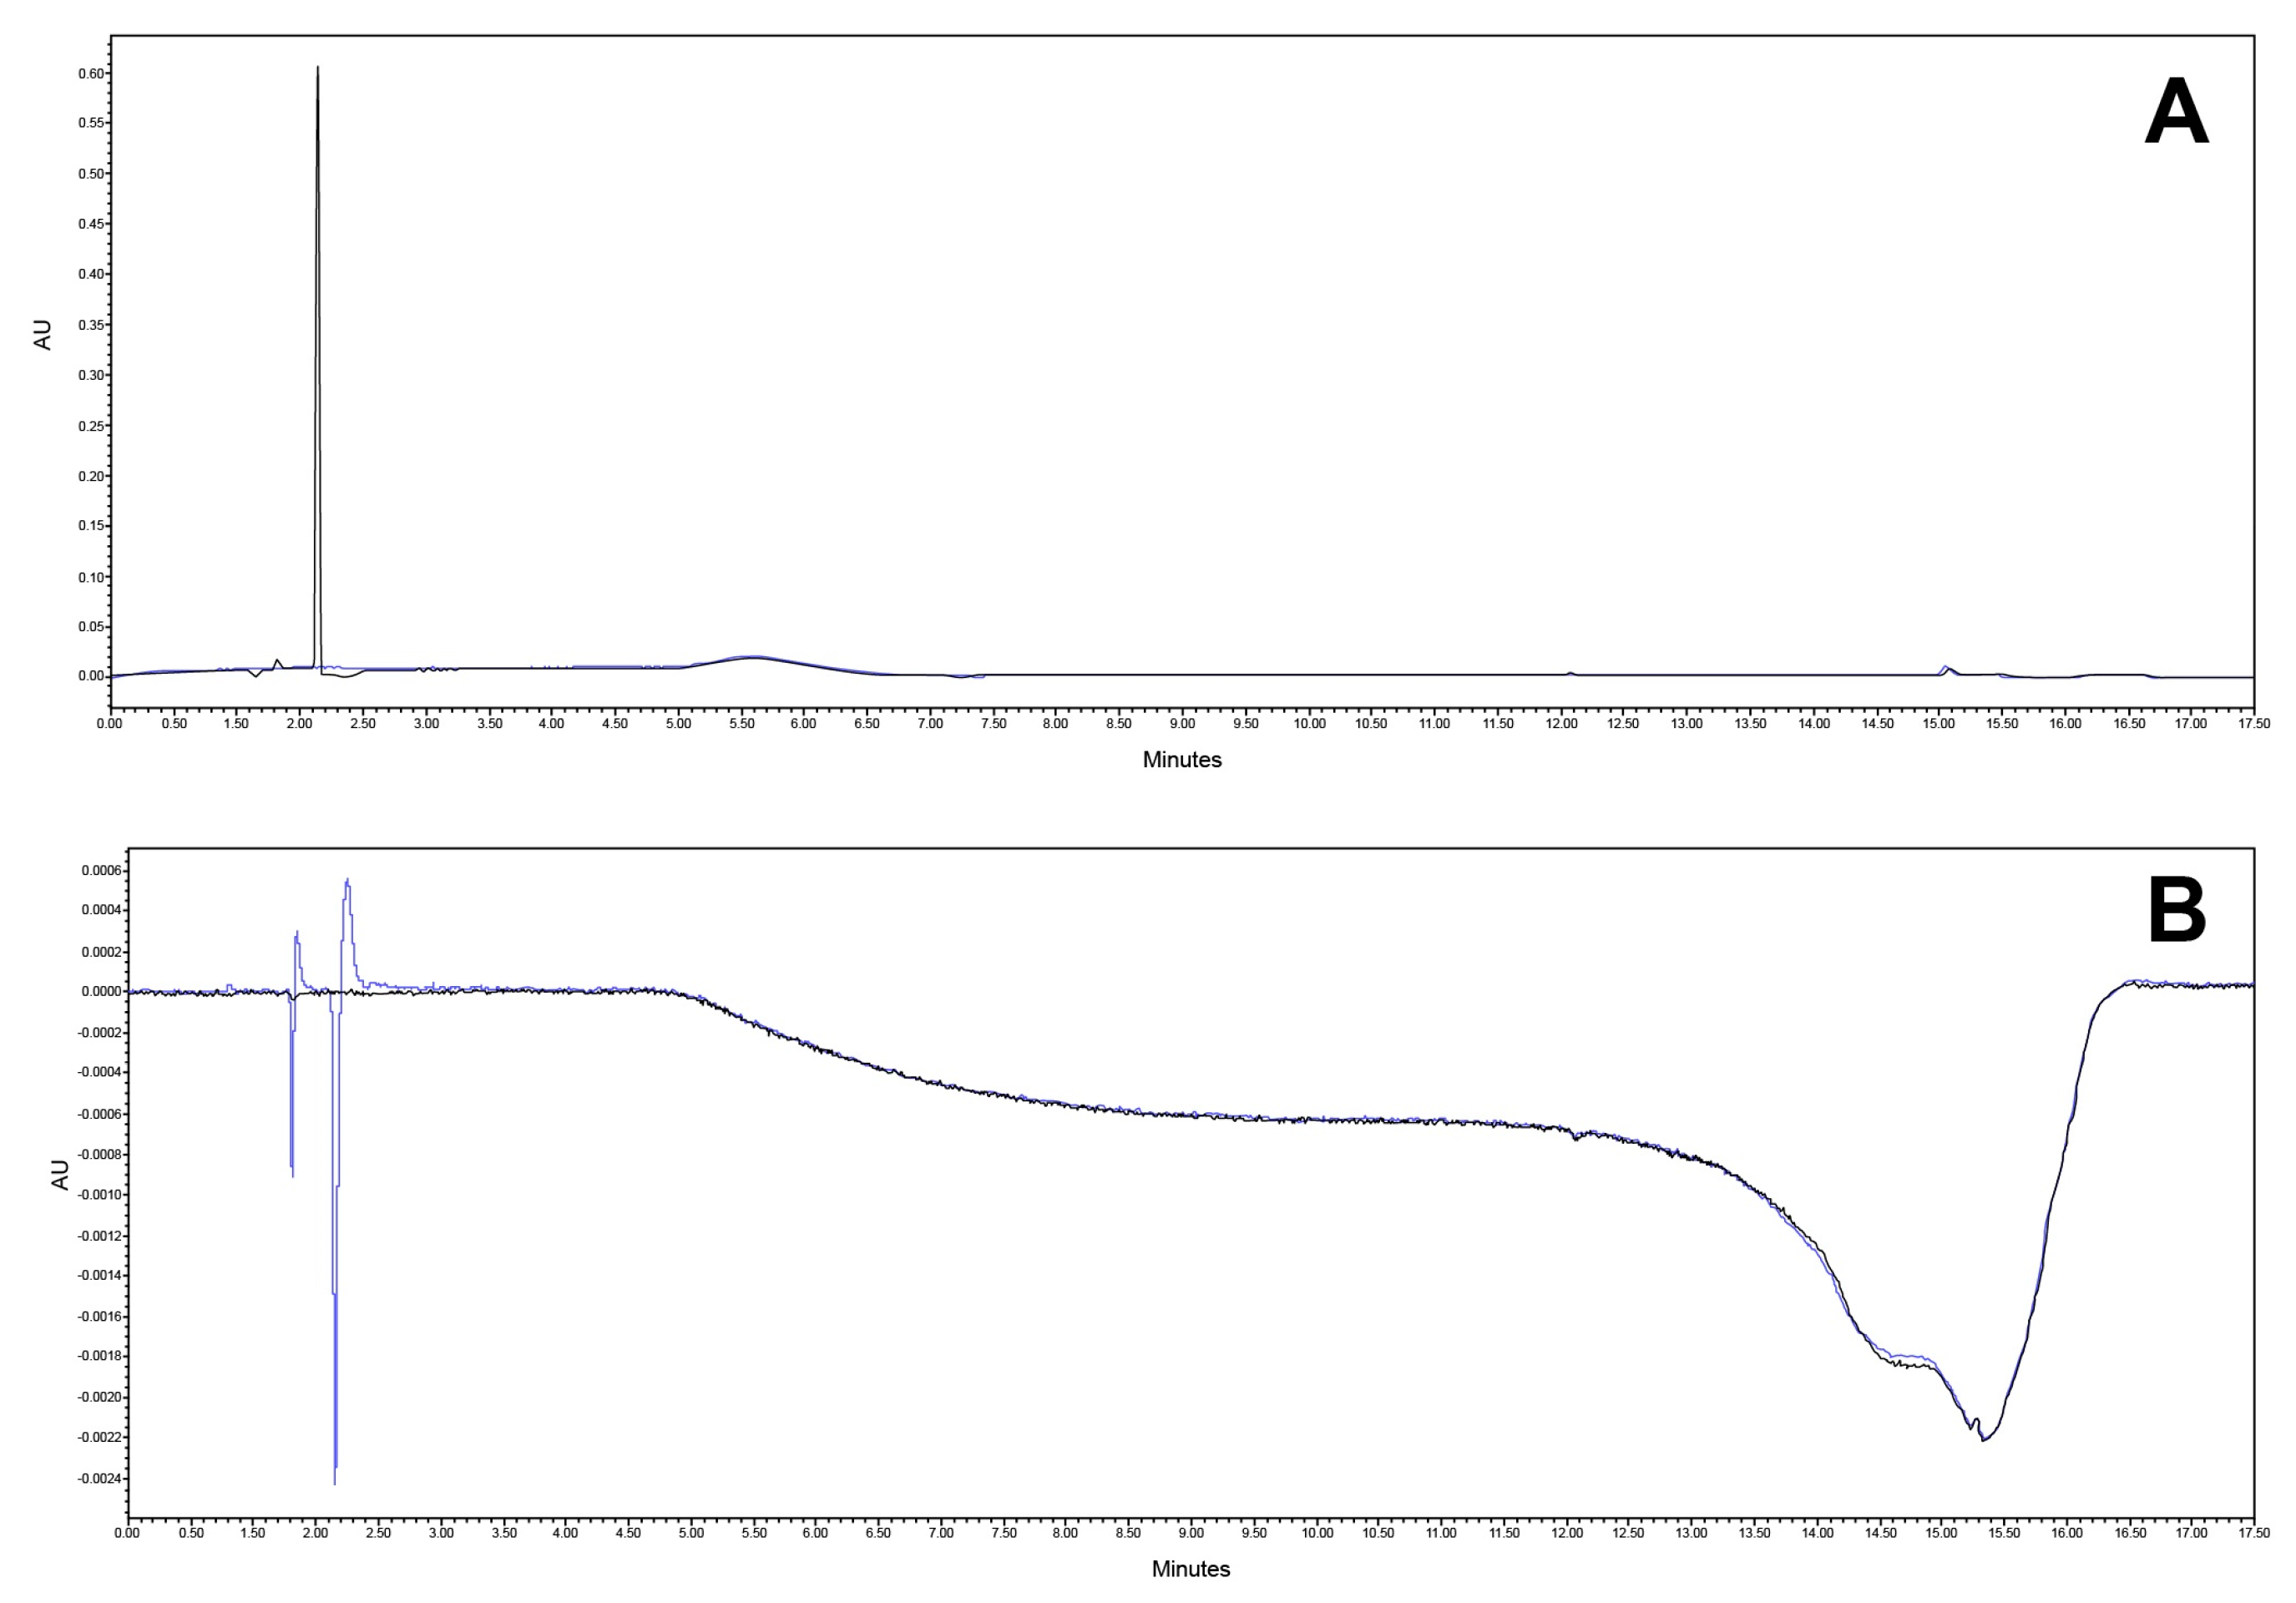
2.4.1. Specificity
2.4.2. Forced Degradation Studies
- Acid hydrolysis: exposure to 5.0 mL of hydrochloric acid (HCl) 1 N for 1 h;
- Alkaline hydrolysis: exposure to 5.0 mL of sodium hydroxide (NaOH) 1 N for 1 h;
- Oxidation: exposure to 2.5 mL of hydrogen peroxide (H2O2) 30% for 30 min;
- Thermolysis: exposure to heat (65 °C) in a steam bath for 1 h.
2.4.3. Linearity
2.4.4. Accuracy
2.4.5. Precision (Repeatability and Intermediate Precision)
2.4.6. Robustness
3. Results and Discussion
3.1. Method Development Using AQbD Principles
3.2. Validation of Analytical Method
3.2.1. Specificity and Forced Degradation Studies
3.2.2. Linearity, Accuracy, Precision Including Repeatability, and Intermediate Precision
3.2.3. Robustness
- Stability under refrigerated conditions (0 h n = 54, 72 h n = 6);
- Column temperature (39 °C n = 6, 38 °C n = 48, 37 °C n = 6);
- Flow rate (0.21 mL/min n = 6, 0.20 mL/min n = 48, 0.19 mL/min n = 6);
- pH of the mobile phase buffer (4.7 n = 6, 4.5 n = 48, 4.3 n = 6);
- Organic modifier concentration (92% n = 6, 90% n = 48, 88% n = 6).
3.3. Analytical Method Life Cycle
- Consistency in reagents: Manufacturers of key reagents, especially ammonium acetate buffer salt and chromatographic columns, remain the same throughout the analysis. This ensures that the quality and composition of these critical components remain constant, minimizing variability in the method response.
- Control ranges for analytical parameters: Control ranges for essential analytical parameters such as flow rate, pH, column temperature, and organic modifier percentage are established [55,56]. These ranges serve as bounds within which the method is expected to perform optimally. Any deviations from these control ranges can serve as indication points for potential issues or necessary adjustments.
- Control charts for chromatographic features: Chromatographic features, such as peak shape, retention time, and signal intensity, are recorded and monitored using control charts during day-to-day operations [56]. These charts provide a visual representation of the method’s performance over time, allowing for the timely detection of any unexpected variations or anomalies in the methodology. By promptly identifying such deviations, appropriate corrective actions can be taken to maintain the integrity and reliability of the analytical method.
4. Conclusions
Supplementary Materials
Author Contributions
Funding
Data Availability Statement
Acknowledgments
Conflicts of Interest
Abbreviations
| API | Active Pharmaceutical Ingredient |
| AQbD | Analytical Quality by Design |
| ATP | Analytical Target Profile |
| CAV | Carvedilol |
| CMeAs | Critical Method Attributes |
| CMePs | Critical Method Parameters |
| FDA | United States Food and Drug Administration |
| FDC | Fixed-Dose Combination |
| FLP | Felodipine |
| HPLC | High-Performance Liquid Chromatography |
| ICH | International Council of Harmonization |
| MS | Mass Spectrometry |
| OOS | Out of Specification |
| OOT | Out of Trend |
| PDA | Photo Diode Array |
| QbD | Quality by Design |
| QC | Quality Control |
| QDa | Single Quadrupole Mass Detector from Waters Corp. |
| QRM | Quality Risk Management |
| QTPP | Quality Target Product Profile |
| RT | Retention Time |
| UPLC | Ultra-Performance Liquid Chromatography |
| USP | United States Pharmacopoeia |
| UV | Ultraviolet |
References
- Ginsburg, G.S.; Phillips, K.A. Precision medicine: From science to value. Health Aff. 2018, 37, 694–701. [Google Scholar] [CrossRef] [PubMed]
- Tucker, G.; DeSilva, B.; Dressman, J.; Ito, M.; Kumamoto, T.; Mager, D.; Mahler, H.C.; Maitland-van der Zee, A.H.; Pauletti, G.M.; Sasaki, H.; et al. Current Challenges and Potential Opportunities for the Pharmaceutical Sciences to Make Global Impact: An FIP Perspective. J. Pharm. Sci. 2016, 105, 2489–2497. [Google Scholar] [CrossRef] [PubMed]
- Xu, Q. Advancing USP compendial methods for fixed dose combinations: A case study of metoprolol tartrate and hydrochlorothiazide tablets. J. Pharm. Anal. 2019, 9, 77–82. [Google Scholar] [CrossRef] [PubMed]
- USP43-NF38. 〈2〉 Oral Drug Products—Product Quality Tests. Available online: https://online.uspnf.com/uspnf/document/1_GUID-DA161518-EC27-4647-AACD-29D28F2A4E92_5_en-US?source=Search%20Results&highlight=Product%20test (accessed on 29 January 2022).
- United States Pharmacopoeia. 〈621〉. Chromatography. Available online: https://online.uspnf.com/uspnf/document/1_GUID-6C3DF8B8-D12E-4253-A0E7-6855670CDB7B_1_en-US?source= (accessed on 20 January 2021).
- International Coucil of Harmonisation. (Concept Paper) Q14: Analytical Procedure Development and Revision of Q2(R1) Analytical Validation; International Council of Harmonization: Geneva, Switzerland, 2023. [Google Scholar]
- International Council for Harmonisation Validation of Analytical Procedures Q2(R2). Available online: https://www.ema.europa.eu/en/documents/scientific-guideline/ich-guideline-q2r2-validation-analytical-procedures-step-2b_en.pdf (accessed on 25 October 2022).
- Santos, L.; Behnam, D.; Clydewyn, A.; Clark, J. USP Monograph Modernization Initiative. Available online: https://www.americanpharmaceuticalreview.com/Featured-Articles/173161-USP-Monograph-Modernization-Initiative/ (accessed on 20 January 2022).
- Leonetti, G.; Egan, C.G. Use of carvedilol in hypertension: An update. Vasc. Health Risk Manag. 2012, 307, 1578. [Google Scholar] [CrossRef] [PubMed]
- Zendaoui, A.; Lachance, D.; Roussel, É.; Couet, J.; Arsenault, M. Usefulness of Carvedilol in the Treatment of Chronic Aortic Valve Regurgitation. Circ. Hear. Fail. 2011, 4, 207–213. [Google Scholar] [CrossRef]
- Keating, G.M.; Jarvis, B. Carvedilol: A review of its use in chronic heart failure. Drugs 2003, 63, 1697–1741. [Google Scholar] [CrossRef] [PubMed]
- Haria, M.; Plosker, G.L.; Markham, A. Felodipine/metoprolol: A review of the fixed dose controlled release formulation in the management of essential hypertension. Drugs 2000, 59, 141–157. [Google Scholar] [CrossRef] [PubMed]
- Collste, P.; Danielsson, M.; Elmfeldt, D.; Feleke, E.; Gelin, A.; Hedner, T.; Rydén, L. Long Term Experience of Felodipine in Combination with β-Blockade and Diuretics in Refractory Hypertension. Drugs 1985, 29, 124–130. [Google Scholar] [CrossRef] [PubMed]
- Leon, M.B.; Rosing, D.R.; Bonow, R.O.; Epstein, S.E. Combination therapy with calcium-channel blockers and beta blockers for chronic stable angina pectoris. Am. J. Cardiol. 1985, 55, B69–B80. [Google Scholar] [CrossRef]
- Panella, C.; Ferretti, R.; Casulli, A.; Cirilli, R. Temperature and eluent composition effects on enantiomer separation of carvedilol by high-performance liquid chromatography on immobilized amylose-based chiral stationary phases. J. Pharm. Anal. 2019, 9, 324–331. [Google Scholar] [CrossRef]
- Li, J.; Wang, L.; Wang, S.; Chen, M.; Gu, E.; Hu, G.; Ge, R. Simultaneous quantification of carvedilol and its metabolites in rat plasma by ultra performance liquid chromatography tandem mass spectrometry and pharmacokinetic application. J. Chromatogr. B 2015, 974, 138–146. [Google Scholar] [CrossRef] [PubMed]
- Yilmaz, B.; Arslan, S. HPLC/Fluorometric Detection of Carvedilol in Real Human Plasma Samples Using Liquid–Liquid Extraction. J. Chromatogr. Sci. 2016, 54, 413–418. [Google Scholar] [CrossRef] [PubMed]
- Kaplan, K.; Gürkan Polat, T.; Duman, O.; Tunç, S. Development of a simple, rapid, accurate, and sensitive method for carvedilol analysis in human blood serum by reversed phase-high performance liquid chromatography with diode array detector. J. Liq. Chromatogr. Relat. Technol. 2018, 41, 532–543. [Google Scholar] [CrossRef]
- Walash, M.; Belal, F.; El-Enany, N.; Zayed, S. Micellar liquid chromatographic determination of felodipine in tablets and human plasma with fluorescence detection: Application to stability studies and content uniformity testing. Anal. Methods 2014, 6, 3401. [Google Scholar] [CrossRef]
- Albu, F.; Sora, I.; Tache, F.; David, V.; Medvedovici, A. On-Line SPE on Restricted Access Adsorbent for HPLC-MS/MS Analysis of Felodipine in Plasma Samples. Anal. Lett. 2010, 43, 1330–1343. [Google Scholar] [CrossRef]
- Patre, N.G.; Patil, S.S. Development and Validation of Stability Indicating Assay Method for Determination of Felodipine in Tablet Dosage Form. Int. J. Pharm. Sci. Drug Res. 2018, 10, 268–273. [Google Scholar] [CrossRef]
- Salunkhe, N.H.; Jadhav, N.R.; Bhinge, S.D. Validated RP-HPLC method for quantification of felodipine in rabbit plasma: Application in a bioequivalence study. Ann. Pharm. Françaises 2019, 77, 15–27. [Google Scholar] [CrossRef]
- Al-Adl, S.M.; Abdel-Aziz, L.M.; Mohamed, M.A.M. HPLC Determination of Carvedilol, Candesartan Cilexetil and Hydrochlorothiazide in Their Bulk and Tablet Dosage Forms. Anal. Chem. Lett. 2017, 7, 188–200. [Google Scholar] [CrossRef]
- Taha, E.A.; Fouad, M.M.; Attia, A.K.; Yousef, Z.M. RP-HPLC method development and validation for simultaneous estimation of ramipril and felodipine. Eur. J. Chem. 2019, 10, 113–117. [Google Scholar] [CrossRef]
- European Medicine Agency. QbD: A Global Implementation Perspective The EU Perspective. Available online: https://www.ema.europa.eu/en/documents/presentation/presentation-quality-design-global-implementation-perspective-european-union-perspective-riccardo_en.pdf (accessed on 2 April 2024).
- European Medicine Agency Q8, Q9, Q10 Questions and Answers|Enhanced Reader. Available online: https://www.ema.europa.eu/en/documents/scientific-guideline/ich-guideline-q8-q9-q10-questions-answers-volume-4_en.pdf (accessed on 1 April 2024).
- Reid, G.L.; Cheng, G.; Fortin, D.T.; Harwood, J.W.; Morgado, J.E.; Wang, J.; Xue, G. Reversed-phase liquid chromatographic method development in an analytical quality by design framework. J. Liq. Chromatogr. Relat. Technol. 2013, 36, 2612–2638. [Google Scholar] [CrossRef]
- Moreira, C.d.S.; Lourenço, F.R. Development and optimization of a stability-indicating chromatographic method for verapamil hydrochloride and its impurities in tablets using an analytical quality by design (AQbD) approach. Microchem. J. 2020, 154, 104610. [Google Scholar] [CrossRef]
- International Council of Harmonization. ICH Guideline Q9 on Quality Risk Management; International Council of Harmonization: Geneva, Switzerland, 2014; Volume 44, pp. 1–20. [Google Scholar]
- International Coucil of Harmonisation. Guideline Q10 on Pharmaceutical Quality System; International Coucil of Harmonisation: Geneva, Switzerland, 2015; Volume 44. [Google Scholar]
- International Coucil of Harmonisation. Guideline Q8 (R2) Pharmaceutical Development; International Coucil of Harmonisation: Geneva, Switzerland, 2009; Volume 8. [Google Scholar]
- Analytical Quality by Design (AQbD) in Pharmaceutical Development | American Pharmaceutical Review—The Review of American Pharmaceutical Business & Technology. Available online: https://www.americanpharmaceuticalreview.com/Featured-Articles/144191-Analytical-Quality-by-Design-AQbD-in-Pharmaceutical-Development/ (accessed on 2 March 2021).
- Kochling, J.; Wu, W.; Hua, Y.; Guan, Q.; Castaneda-Merced, J. A platform analytical quality by design (AQbD) approach for multiple UHPLC-UV and UHPLC-MS methods development for protein analysis. J. Pharm. Biomed. Anal. 2016, 125, 130–139. [Google Scholar] [CrossRef] [PubMed]
- Ramalingam, P.; Jahnavi, B. QbD Considerations for Analytical Development; Elsevier Inc.: Amsterdam, The Netherlands, 2019; ISBN 9780128157992. [Google Scholar]
- Žigart, N.; Časar, Z. Development of a Stability-Indicating Analytical Method for Determination of Venetoclax Using AQbD Principles. ACS Omega 2020, 5, 17726–17742. [Google Scholar] [CrossRef]
- Tome, T.; Žigart, N.; Časar, Z.; Obreza, A. Development and Optimization of Liquid Chromatography Analytical Methods by Using AQbD Principles: Overview and Recent Advances. Org. Process Res. Dev. 2019, 23, 1784–1802. [Google Scholar] [CrossRef]
- Guiraldelli, A. USP Case Study: Stability-Indicating Method Development using AQbD Concepts: AQbD Workflow and MODR Validation. 2021. Available online: https://www.youtube.com/watch?v=ZoYBTeTJmm4 (accessed on 3 March 2021).
- Otašević, B.; Šljivić, J.; Protić, A.; Maljurić, N.; Malenović, A.; Zečević, M. Comparison of AQbD and grid point search methodology in the development of micellar HPLC method for the analysis of cilazapril and hydrochlorothiazide dosage form stability. Microchem. J. 2019, 145, 655–663. [Google Scholar] [CrossRef]
- Fukuda, I.M.; Pinto, C.F.F.; Moreira, C.D.S.; Saviano, A.M.; Lourenço, F.R. Design of experiments (DoE) applied to pharmaceutical and analytical quality by design (QbD). Braz. J. Pharm. Sci. 2018, 54, 1–16. [Google Scholar] [CrossRef]
- Verch, T.; Campa, C.; Chéry, C.C.; Frenkel, R.; Graul, T.; Jaya, N.; Nakhle, B.; Springall, J.; Starkey, J.; Wypych, J.; et al. Analytical Quality by Design, Life Cycle Management, and Method Control. AAPS J. 2022, 24, 34. [Google Scholar] [CrossRef]
- Volta e Sousa, L.; Gonçalves, R.; Menezes, J.C.; Ramos, A. Analytical Method Lifecycle Management in Pharmaceutical Industry: A Review. AAPS PharmSciTech 2021, 22, 128. [Google Scholar] [CrossRef]
- Ermer, J.; Aguiar, D.; Boden, A.; Ding, B.; Obeng, D.; Rose, M.; Vokrot, J. Lifecycle management in pharmaceutical analysis: How to establish an efficient and relevant continued performance monitoring program. J. Pharm. Biomed. Anal. 2020, 181, 113051. [Google Scholar] [CrossRef]
- International Conference of Harmonization Technical and Regulatory Considerations for Pharmaceutical Product Life Cycle Management Q12. Available online: https://database.ich.org/sites/default/files/Q12_Guideline_Step4_2019_1119.pdf (accessed on 25 October 2022).
- USP-NF 〈1220〉. Analytical Procedure Life Cycle. Available online: https://online.uspnf.com/uspnf/document/1_GUID-35D7E47E-65E5-49B7-B4CC-4D96FA230821_2_en-US?source=Quick%20Search&highlight=1220 (accessed on 18 January 2022).
- Parr, M.K.; Schmidt, A.H. Life cycle management of analytical methods. J. Pharm. Biomed. Anal. 2018, 147, 506–517. [Google Scholar] [CrossRef]
- Watson, S. Applying QbD Principles to Analytical Development. Available online: https://www.pharm-int.com/wp-content/uploads/2021/08/Applying-QbD-Principles-to-Analytical-Development_Article.pdf (accessed on 3 March 2021).
- U.S. Food and Drug Administration. ICH Q1A (R2) Stability Testing of new Drug Substances and Products; U.S. Food and Drug Administration: Silver Spring, MD, USA, 2003.
- U.S. Food and Drug Administration. ORL Laboratory Manual Volume II Methods, Method Verification and Validation; U.S. Food and Drug Administration: Silver Spring, MD, USA, 2020.
- United States Pharmacopoeia. 〈2〉 Oral Drug Products—Product Quality Tests. Available online: https://online.uspnf.com/uspnf/document/1_GUID-DA161518-EC27-4647-AACD-29D28F2A4E92_5_en-US?source=Search%20Results&highlight=stability%20indicating (accessed on 3 March 2021).
- What Is the Difference between a T3 Trifunctional Column and a C18 Trifunctional Column?—WKB73010—Waters. Available online: https://support.waters.com/KB_Chem/Columns/WKB73010_What_is_the_difference_between_a_T3_trifunctional_column_and_a_C18_trifunctional_column (accessed on 21 October 2021).
- Ajan, P.G.; Rohith, T.; Santosh, P.; Mantelingu, K.; Rangappa, K.S.; Kumara, M.N. Rapid, Highly Efficient and Stability Indicating Rp-Uplc Method for The Quantitative Determination of Potential Impurities of Carvedilol Active Pharmaceutical Ingredient. Int. J. Pharm. Pharm. Sci. 2014, 6, 214–220. [Google Scholar]
- Chander, C.P.; Raju, B.; Sulthana, A.; Srinivas, R. LC–ESI–MS/MS study of carvedilol and its stress degradation products. Anal. Methods 2013, 5, 4330. [Google Scholar] [CrossRef]
- Abolghasem, J.; Mohammad, H.; Nasrin, S. Non-Aqueous Electromigration Analysis of Some Degradation Products of Carvedilol. Iran J. Pharm. Res. 2014, 13, 471–486. [Google Scholar]
- Samba Siva Rao, L.; Madhavan, P.; Vanitha, K. Prakash Development and validation of stability indicating method for the quantitative determination of carvedilol and its related impurities in pharmaceutical dosage forms using RP HPLC. J. Chem. Pharm. Res. 2015, 7, 144–154. [Google Scholar]
- Montgomery, D.C. Introduction to Statistical Quality Control, 7th ed.; John Wiley & Sons Ltd.: Hoboken, NJ, USA, 2012; ISBN 978-1-118-14681-1. [Google Scholar]
- Maziarz, M.; Rainville, P.; Naughton, S. Continued Performance Verification of Analytical Procedures Using Control Charts of Empower Chromatography Data Software; Milford: London, UK, 2019. [Google Scholar]


| Component | mg | % |
|---|---|---|
| Carvedilol | 25 | 12.5 |
| Felodipine | 10 | 5 |
| Tabletosse® 100 | 110 | 55 |
| Avicel® PH102 | 45 | 22.5 |
| Explotab® | 8 | 4 |
| Magnesium stearate | 2 | 1 |
| Dosage form | 200 | 100 |
| ATP Element | Target | Requirement Reference |
|---|---|---|
| Chromatographic features | ||
| Tailing factor | <2 | [5,49] |
| Resolution | >2 | [49] |
| Capacity factor (k′) | >2 | [49] |
| Peak purity | Acceptable | [49,50] |
| Plate count | >20,000 | [49] |
| Validation parameters | ||
| Linearity and range | R2 ≥ 0.995 70–130% of the test concentration | [7,49] |
| Specificity | Absence of interference | [7,49] |
| Accuracy | 97.0–103.0% recovery within the established range | [7,49] |
| Repeatability | RSD less than or equal to 2.0% | [7,49] |
| Intermediate precision | Complies with repeatability and is not significantly different | [7,49] |
| Robustness | Not statistically different | [6,7] |
| Screening Phase | Optimization Phase | ||||
|---|---|---|---|---|---|
| Mobile Phase Buffer | Analytical Column | Organic Modifier | Column Temperature (°C) | Flow (mL/min) | Organic Modifier (%) |
| (A) (B) (C) (D) | Acetonitrile Methanol | 25 30 35 45 | 0.2 0.3 0.4 | 85 90 95 |
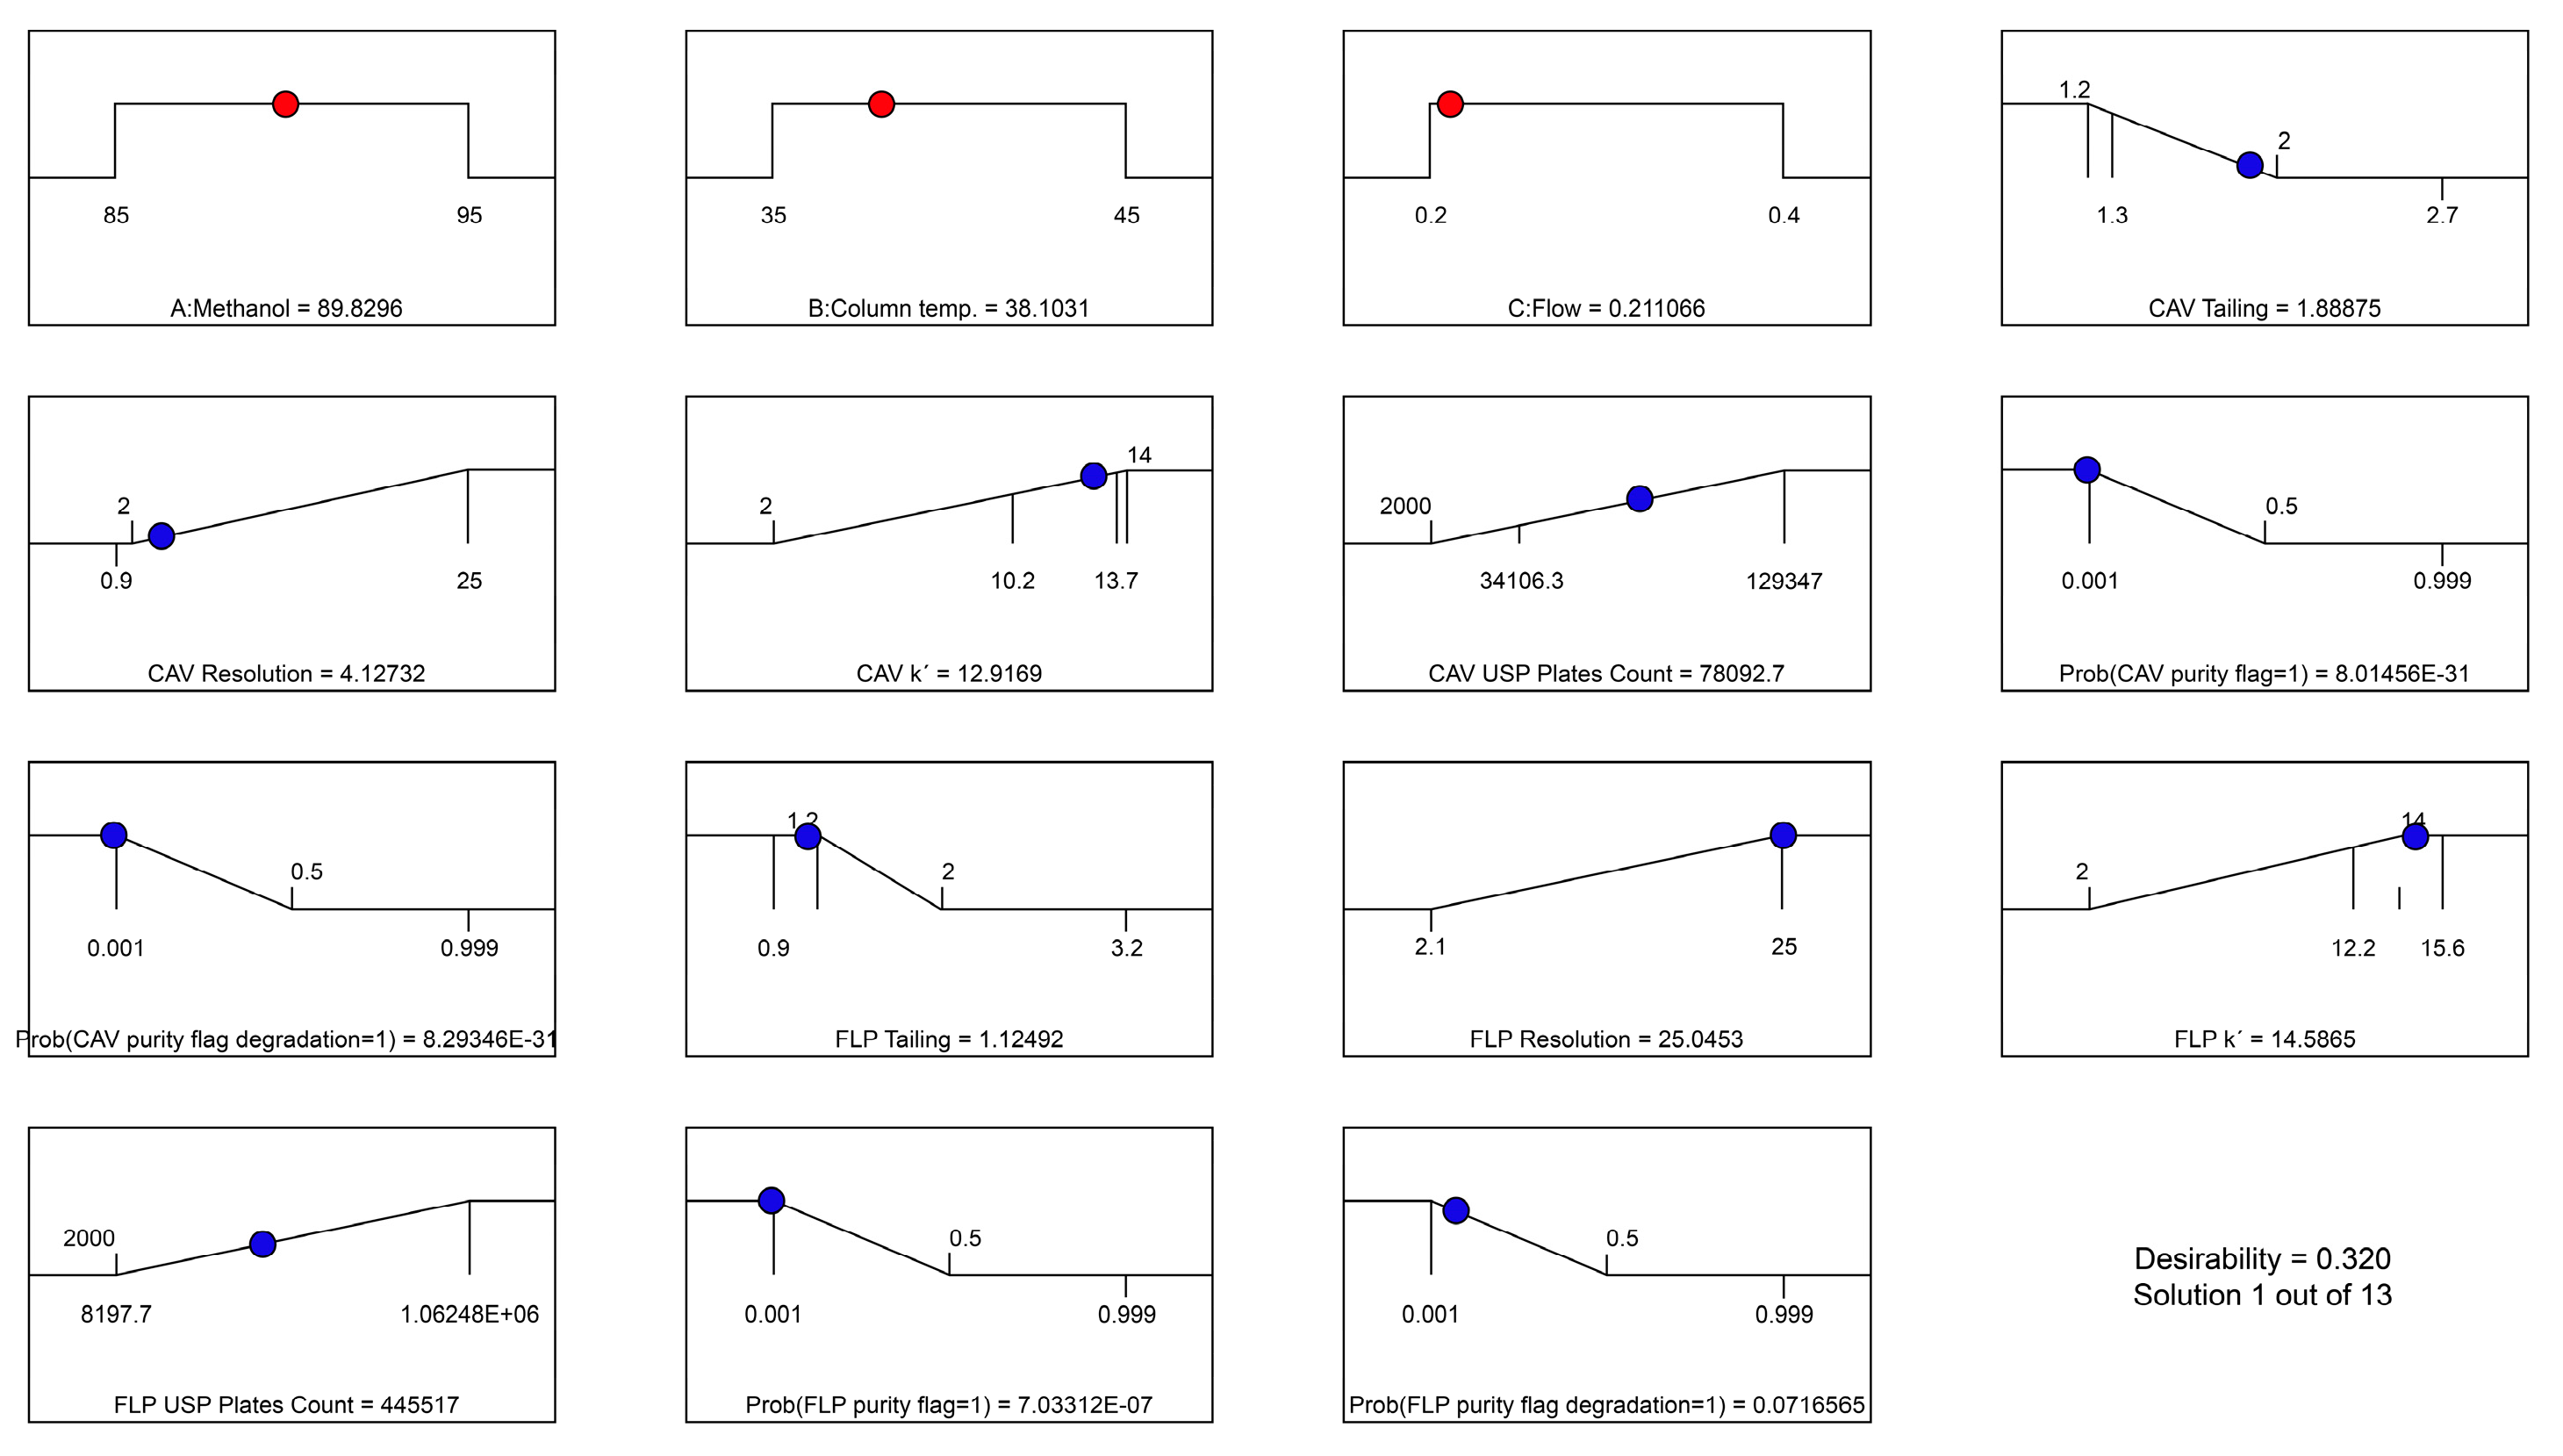
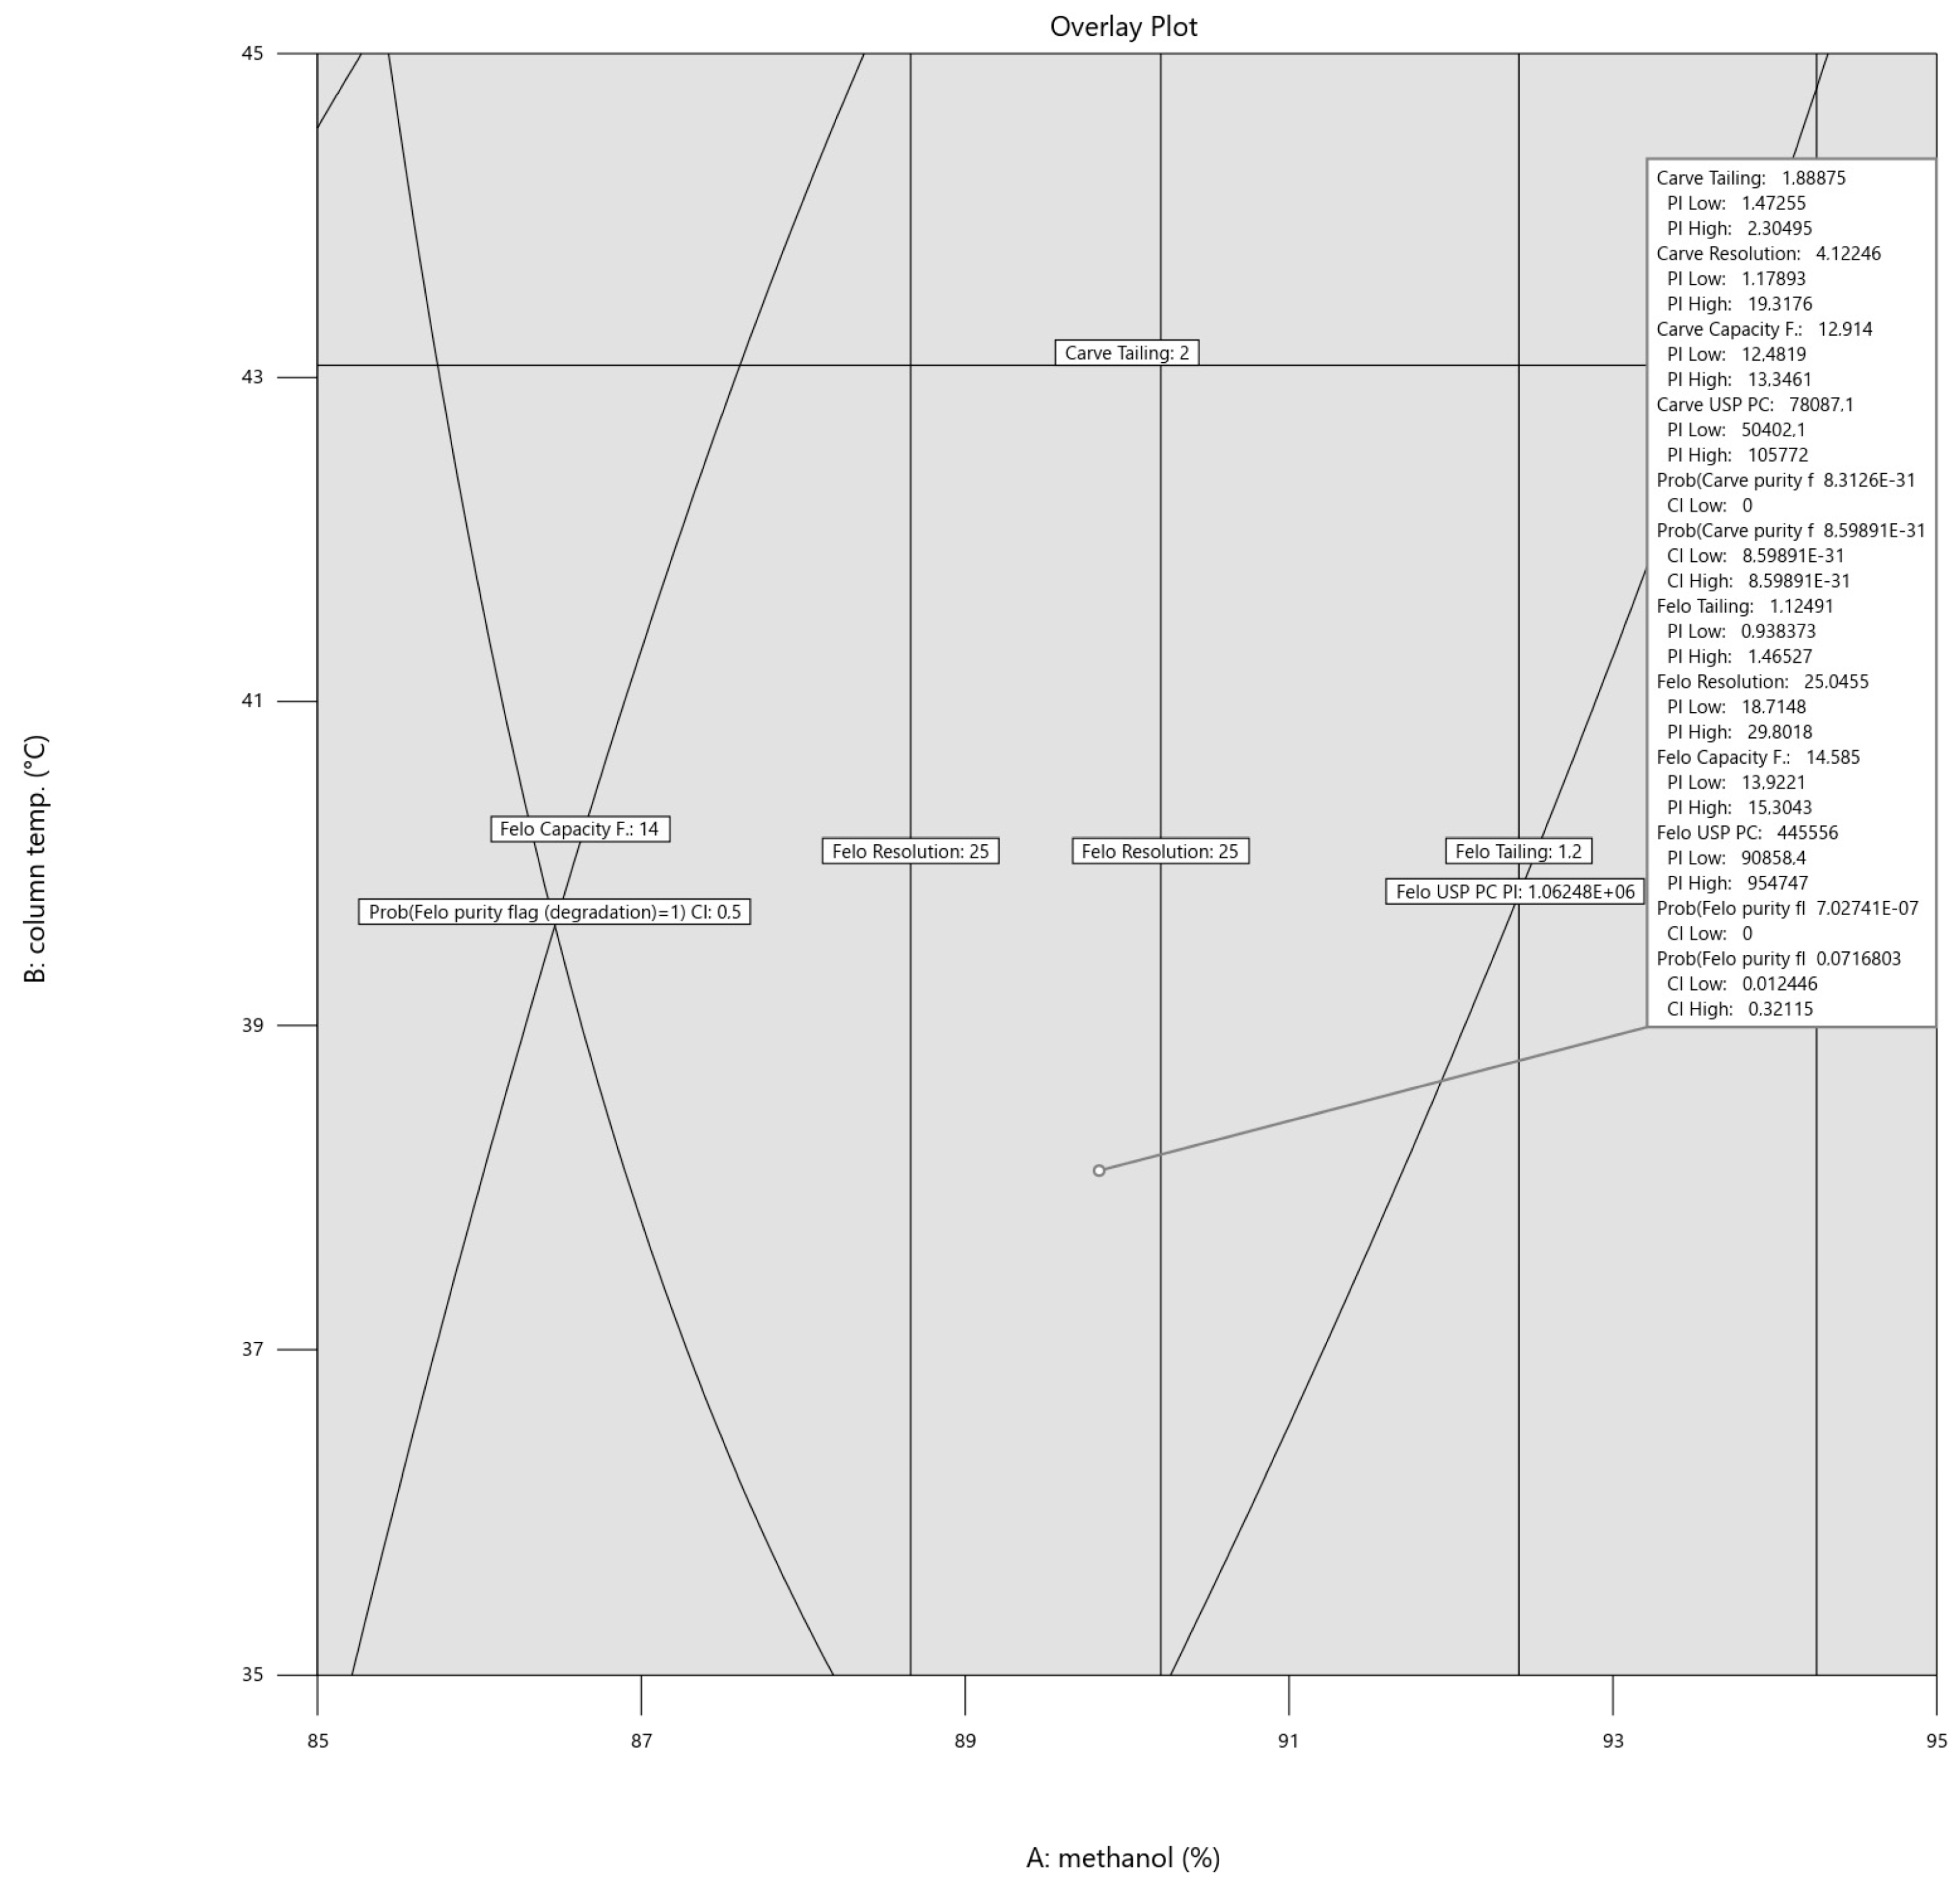
| Name | Goal | Lower Limit | Upper Limit | Importance | |
|---|---|---|---|---|---|
| A: Methanol | is in range | 85 | 95 | 3 | |
| B: Column temp | is in range | 35 | 45 | 3 | |
| C: Flow | is in range | 0.2 | 0.4 | 3 | |
| CAV | Tailing | minimize | 1.2 | 2 | 4 |
| Resolution | minimize | 2 | 25 | 2 | |
| Capacity F. | maximize | 2 | 14 | 3 | |
| USP Plates | maximize | 2000 | 129,347 | 1 | |
| Prob(purity flag = 1) | minimize | 0.001 | 0.5 | 5 | |
| Prob(purity flag (degradation) = 1) | minimize | 0.001 | 0.5 | 3 | |
| FLP | Tailing | maximize | 1.2 | 2 | 4 |
| Resolution | maximize | 2.1 | 25 | 3 | |
| Capacity F. | minimize | 2 | 14 | 3 | |
| USP Plates | maximize | 2000 | 106,248 × 106 | 1 | |
| Prob(purity flag = 1) | minimize | 0.001 | 0.5 | 5 | |
| Prob(purity flag (degradation) = 1) | minimize | 0.001 | 0.5 | 3 | |
| API | Factor | Predicted Mean | Std Dev | 95% CI Low for Mean | 95% CI High for Mean |
|---|---|---|---|---|---|
| CAV | Tailing | 1.89 | 0.24 | 1.77 | 2.01 |
| Resolution | 4.63 | 3.04 | 2.83 | 8.96 | |
| Capacity F. | 13.19 | 0.24 | 12.98 | 13.39 | |
| USP Plates | 78,471 | 16,123 | 72,062 | 84,880 | |
| Prob(purity flag = 1) | 0.00 | 0.00 | 0.00 | n.a. | |
| Prob(purity flag (degradation) = 1) | 0.00 | 0.00 | 0.00 | 0.00 | |
| FLP | Tailing | 1.12 | 0.11 | 1.05 | 1.22 |
| Resolution | 25.03 | 3.00 | 23.12 | 26.69 | |
| Capacity F. | 14.72 | 0.02 | 14.44 | 15.01 | |
| USP Plates | 441,865 | 249,963 | 303,993 | 608,324 | |
| Prob(purity flag = 1) | 0.00 | 0.00 | 0.00 | n.a. | |
| Prob(purity flag (degradation) = 1) | 0.07 | 0.26 | 0.01 | 0.42 |
| Flow | 0.2 mL/min |
| Injection volume | 1 µL |
| Organic modifier (B) | Methanol |
| Column | Acquity HSS T3 1.8 um 2.1 × 100 mm |
| Column temperature | 38 °C |
| Gradient | t = 0 min, 10% B; t = 3 min, 10% B; t = 13.5 min, 90% B; t = 14.5 min, 10% B; t = 16.5 min, 10% B |
| Wavelength | 240 nm CAV and 362 nm FLP |
| Conditions | CAV | FLP |
|---|---|---|
| % of Degradation | % of Degradation | |
| Control | 0.6 ± 0.2 | 0.3 ± 0.1 |
| Acid hydrolysis | 1.1 ± 0.6 | 1.2 ± 0.3 |
| Basic hydrolysis | 7.1 ± 3.0 | 8.1 ± 5.2 |
| Oxidation | 91.8 ± 9.7 | 15.6 ± 2.0 |
| Thermolysis | 15.2 ± 3.2 | 10.4 ± 6.2 |
| Percent of Target (%) | CAV | FLP | ||
|---|---|---|---|---|
| Average (%) | RSD (%) | Average (%) | RSD (%) | |
| 70% | 98.9 | 0.3 | 100.2 | 0.2 |
| 100% | 98.9 | 1.3 | 100.7 | 0.9 |
| 130% | 97.8 | 0.7 | 100.2 | 0.4 |
| Parameter | CAV | FLP | ||
|---|---|---|---|---|
| Analyst I | Analyst II | Analyst I | Analyst II | |
| Mean | 100.35 | 100.81 | 100.45 | 99.17 |
| SD | 0.91 | 0.59 | 1.35 | 1.25 |
| RSD | 0.91 | 0.59 | 1.35 | 1.26 |
| SEM | 0.37 | 0.24 | 0.55 | 0.51 |
| n | 6 | 6 | 6 | 6 |
| p value | 0.325 | 0.121 | ||
| API | Source | df | Sig. |
|---|---|---|---|
| CAV | Stability | 1 | 0.462 |
| Column Temperature | 2 | 0.753 | |
| Flow rate | 2 | 0.538 | |
| pH | 2 | 0.620 | |
| Gradient composition | 2 | 0.724 | |
| Error | 50 | ||
| Total | 60 | ||
| FLP | Stability | 1 | 0.983 |
| Column Temperature | 2 | 0.998 | |
| Flow rate | 2 | 0.996 | |
| pH | 2 | 0.988 | |
| Gradient composition | 2 | 0.985 | |
| Error | 50 | ||
| Total | 60 |
Disclaimer/Publisher’s Note: The statements, opinions and data contained in all publications are solely those of the individual author(s) and contributor(s) and not of MDPI and/or the editor(s). MDPI and/or the editor(s) disclaim responsibility for any injury to people or property resulting from any ideas, methods, instructions or products referred to in the content. |
© 2024 by the authors. Licensee MDPI, Basel, Switzerland. This article is an open access article distributed under the terms and conditions of the Creative Commons Attribution (CC BY) license (https://creativecommons.org/licenses/by/4.0/).
Share and Cite
Afonso Urich, J.A.; Marko, V.; Boehm, K.; Lara Garcia, R.A.; Fedorko, A.; Salar-Behzadi, S.; Jeremic, D. Stability-Indicating UPLC-PDA-QDa Methodology for Carvedilol and Felodipine in Fixed-Dose Combinations Using AQbD Principles. Sci. Pharm. 2024, 92, 22. https://0-doi-org.brum.beds.ac.uk/10.3390/scipharm92020022
Afonso Urich JA, Marko V, Boehm K, Lara Garcia RA, Fedorko A, Salar-Behzadi S, Jeremic D. Stability-Indicating UPLC-PDA-QDa Methodology for Carvedilol and Felodipine in Fixed-Dose Combinations Using AQbD Principles. Scientia Pharmaceutica. 2024; 92(2):22. https://0-doi-org.brum.beds.ac.uk/10.3390/scipharm92020022
Chicago/Turabian StyleAfonso Urich, Jesús Alberto, Viktoria Marko, Katharina Boehm, Raymar Andreina Lara Garcia, Anna Fedorko, Sharareh Salar-Behzadi, and Dalibor Jeremic. 2024. "Stability-Indicating UPLC-PDA-QDa Methodology for Carvedilol and Felodipine in Fixed-Dose Combinations Using AQbD Principles" Scientia Pharmaceutica 92, no. 2: 22. https://0-doi-org.brum.beds.ac.uk/10.3390/scipharm92020022