Article

Energy Management in a Super-Tanker Powered by Solar, Wind, Hydrogen and Boil-Off Gas for Saving CO2 Emissions

by
Michael E. Stamatakis
,
Erofili E. Stamataki
,
Anastasios P. Stamelos
and
Maria G. Ioannides
*
School of Electrical and Computer Engineering, National Technical University of Athens, 15773 Athens, Greece
*
Author to whom correspondence should be addressed.
Submission received: 8 March 2024 / Revised: 14 April 2024 / Accepted: 16 April 2024 / Published: 19 April 2024
(This article belongs to the Special Issue Design and Control of Smart Renewable Energy Systems)

Abstract

:
In terms of energy generation and consumption, ships are autonomous isolated systems, with power demands varying according to the type of ship: passenger or commercial. The power supply in modern ships is based on thermal engines-generators, which use fossil fuels, marine diesel oil (MDO) and liquefied natural gas (LNG). The continuous operation of thermal engines on ships during cruises results in increased emissions of polluting gases, mainly CO/CO2. The combination of renewable energy sources (REs) and triple-fuel diesel engines (TFDEs) can reduce CO/CO2 emissions, resulting in a “greener” interaction between ships and the ecosystem. This work presents a new control method for balancing the power generation and the load demands of a ship equipped with TFDEs, fuel cells (FCs), and REs, based on a real and accurate model of a super-tanker and simulation of its operation in real cruise conditions. The new TFDE technology engines are capable of using different fuels (marine diesel oil, heavy fuel oil and liquified natural gas), producing the power required for ship operation, as well as using compositions of other fuels based on diesel, aiming to reduce the polluting gases produced. The energy management system (EMS) of a ship is designed and implemented in the structure of a finite state machine (FSM), using the logical design of transitions from state to state. The results demonstrate that further reductions in fossil fuel consumption as well as CO2 emissions are possible if ship power generation is combined with FC units that consume hydrogen as fuel. The hydrogen is produced locally on the ship through electrolysis using the electric power generated by the on-board renewable energy sources (REs) using photovoltaic systems (PVs) and wind energy conversion turbines (WECs).

1. Introduction

Power requirements are increasing as people’s needs and living standards are progressively increasing in the modern world. This forces the investigation of new energy sources, which on the one hand will not be exhausted in the near future and on the other hand shall not affect the ecological balance of the ecosystem due to the resulting pollution.
Renewable energy sources (REs) are eco-friendly energy producers, using photovoltaic systems (PVs), wind energy conversion turbines (WECs), etc., thus reducing greenhouse gas emissions. The latter established REs as an important technology bundle for environmentally friendly energy production. REs have evolved into an important technological field in recent decades, offering energy to meet the demands of many electrical grids, replacing fossil fuels [1]. Wind and solar energy generation units operate stochastically in time and therefore require the support of energy storage systems before the power generated is allocated to the overall consumption network [2,3]. Economic studies (cost analysis) and energy policies aim to increase the use of REs in the overall power generation balance [4]. It is expected that REs, as well as other alternative energy production technologies, will provide a significant amount of electricity generation, reducing fossil fuel consumption [5,6].
In terms of energy production and consumption, ships are autonomous and isolated systems, with power requirements varying according to the type of ship: passenger or commercial. The power supply in modern ships is based on thermal engines-generators, which use fossil fuels, diesel or liquefied natural gas (LNG). The continuous operation of thermal engines on ships results in increased emissions of polluting gases, mainly CO/CO2.
An LNG super-tanker is a ship with a specialized LNG cargo control system for the transport of liquefied natural gas at temperatures close to the vaporization temperature of −163 °C. Despite the insulation of tankers, which are designed to limit the entry of external heat, any small amount of heat will produce a small amount of out-gassing. This is the natural exhaust gas, called boil-off gas (BoG), which must be removed in order to maintain internal tank pressure.
Liquefied natural gas (LNG) replaces marine diesel oil (MDO) in energy production, reducing gas emissions to the environment [7]. In addition to the use of MDO for ship propulsion, solar energy systems with storage capabilities in battery grids as well as the use of alternative fuels have been proposed [8,9]. The distribution of generated energy is controlled on ships by the energy management system (EMS) [10,11]. Regarding the ecological pollution caused by fossil fuels, studies reveal that their use leads to an increase in the temperature of the planet, which is known as the ‘greenhouse effect’, affects port cities as well [12]. The significant reduction of pollutant gases with the combined utilization of REs and fossil fuel engines, including LNG and MDO, was demonstrated in [10].
Future ship and port designs focus on electricity management techniques using smart grids and the use of different fuel MDOs combined with hybrid energy sources, including REs, fuel cells, and shore-based energy storage and supply units [13].
In addition to the aforementioned technologies, hydrogen production and combustion technologies have played an important role in recent years [14]. Hydrogen (H2) is a gas that can be produced by many methods, such as fossil fuels, biomass or electrolysis, using energy generated from REs, etc. [15]. Important issues refer to the storage of hydrogen, as well as its combustion, for the purpose of energy production [16]. Hydrogen is highly flammable and can become explosive in mixtures with atmospheric oxygen. Modern technologies enable storage in tanks in sufficiently large volumes and high pressures (hundreds of bars). Because of its low energy per volume unit, hydrogen is generally stored as a compressed gas or in liquid form for practical applications. Hydrogen becomes liquid at 20 °K. A volume of liquid hydrogen weighs only 10% compared to the same volume of gasoline. Careful handling is obviously required at such low temperatures. For it to serve as a practical fuel, the transport of hydrogen must be highly compressed to minimize its storage volume. Typical hydrogen storage pressures range from 138 to 350 bars. Existing hydrogen production technologies typically produce hydrogen gas at atmospheric pressure of up to 25 bars. Mechanical compression is then required to raise the gas pressure to levels required for almost all practical applications. Unfortunately, this compression process entails an additional cost for the compression equipment [17].
The risks associated with using hydrogen are of the same magnitude as when using gasoline or natural gas. Safety precautions when using hydrogen in home and industrial applications are similar to those required for natural gas [17,18]. The safety advantages of hydrogen are high diffusion speed, low brightness of flame, lack of production of toxic gases during combustion, and complete lack of toxicity [17]. Hydrogen diffuses quickly without allowing a flammable concentration to build up. Hydrogen can be used safely without releasing CO/CO2. Hydrogen, like natural gas, can cause an explosion through a leak, but without causing poisoning. Hydrogen fires flash and float due to the buoyancy of the gas in the air, whereas liquid fuel fires intensify combustion on surfaces and produce toxic gases.
Natural gas can produce carbon monoxide when it burns. Hydrogen is somewhat more difficult to ignite with heat than natural gas, but is more easily ignited by electric sparks [15,17]. The safety advantages of H2 are partially offset by the wide combustion of the hydrogen mixture (4 to 75 vol %) compared to natural gas (5 to 15 vol %). Hydrogen combustion can be controlled through fuel cells (FCs), which have evolved significantly over the last decades, yielding significant amounts of power, ranging from kilowatts to several megawatts, depending on the type and technology of the FC [18,19,20]. FC technologies are as follows: proton exchange membrane (PEMFC), direct methanol (DMFC), phosphoric acid (PAFC), molten carbonate (MCFC), and solid oxide (SOFC) [21,22,23]. The operating temperatures as well as the application conditions of these types of fuel cells differ. The types of MCFC and SOFC are suitable technologies for the generation of up to several megawatts. Therefore, FC technologies can replace conventional fuel engines when the aim is to reduce emissions of gaseous pollutants [24].
One barrier to the development of FC propulsion in ships is the production and transportation of hydrogen H2. However, it can be assumed that H2 is available on ships in the form of pure H2. Some of the main issues are the technical requirements for FC installation onboard, power system integration, control, and safety-related regulations [21,22,23]. Fuel cells can become an important source of energy for ships due to their high efficiency and for the protection of the marine environment. But they have the disadvantage of a short life span. The evaluation of the size of the H2 energy storage system to be installed in a hybrid FC ship to extend the lifetime of the FCs must take into account ship performance and durability [25]. For safety improvement, the collision avoidance of ships with hydrogen FCs must comply with the constraints of the Convention on the International Regulations for Preventing Collisions at Sea (COLREGS) [26], while also maintaining feasible trajectories [27].
To achieve the fault-free operation of shipboard hybrid electric power systems, other problems related to generated power quality under disturbances are faced by an emergency prevention control system based on controlled parameter forecasting [28].
The combination of renewable energy sources (REs) with triple-fuel diesel engines (TFDEs) can reduce CO2 emissions, resulting in a “greener” interaction between ships and the ecosystem. The main issue to consider is that a ship has increased power requirements for normal operation, depending on its type and application (from hundreds of kilowatts to several megawatts), according to its dimensions and capacity. Targeting a substantial contribution of REs and FCs, several REs units should be installed that will jointly cover a significant part of the energy needs for the production of hydrogen, which in turn will become the fuel of the FCs. Scaling and integration of REs and H2 necessitate the use of a simulation model to calculate power demands and weigh the fuel needed under different cruise conditions. The simulation model for hybrid ships’ systems must use approaches for the dispatch and commitment of energy sources to the requested power load demands of the ship, as these vary in time, resulting in balance for power management. Due to the high energy requirements of a ship, REs and FCs cannot solely meet the energy demands. In order to cover ship energy demands, an energy management system assigns the ship’s load requirements to the energy-generating units (TFDEs and fuel cells) by controlling the connection and disconnection of the available resources in time.
Previous works on hybrid ships with fuel cells technology focus on FC installation and operation, including the key issues of technical requirements for their installation onboard, control and performance of the ship’s hybrid power system [24], the study of shipboard H2 storage [25], maintaining feasible ship trajectories [27] and safety regulations for shipboard hydrogen facilities [24]. The problem of reducing CO2 emissions when replacing diesel and liquefied gas fuels with hydrogen, and specifically in the case of producing an equivalent amount of energy needed to cover the electrical load demands of big LNG cargo tankers, has not yet been fully explored.
Our work introduces a new architecture for using fuel cells and hydrogen as a fuel through electrolysis. At the same time, this new architecture introduces solar energy and wind energy to produce electricity, which in turn will be used to produce hydrogen without the need to supply the hydrogen production unit with another fuel from another power source. In this way, additional fuel savings are achieved: on the one hand, by supplying the tanker with hydrogen to reach its itinerary and, on the other, by supplying the hydrogen production unit with renewable sources of solar and wind energy.
The ultimate aim is to estimate the CO2 reduction amounts that would have been produced by conventional diesel engines without fuel cells. In addition, our work emphasizes the use of new technologies in new super-tankers, carrying LNG fuels and using boil-off gas (BoG) from the cargo, both those under construction and the existing ones that can be retrofitted.
In the present work, we propose the modernization of an LNG super-tanker, with energy requirements mainly for the propulsion engines and storage and handling of cargo gas. Specifically, we considered that a significant amount of electrical energy is required for the propulsion motors, for charging and discharging the liquefied gas and for maintaining the LNG cargo charge at the correct temperature and pressure levels.
By introducing REs and FCs into the ships’ energy system, we intend to reduce fuel costs and gas emissions. Our work presents a new model for the integration of REs and FCs into a ship’s energy system, saving fuel and reducing operating costs for navigation and CO2 gas emissions. The model uses technical parameters for a real super-tanker ship and external data according to specified time-varying power load demands. The model evaluates the time-varying operation of a ship in terms of power load demands, incorporating a combined operation of thermal engines (TFDE) and FCs. In addition, the simulation reveals the ability of FCs to undertake significant levels of electrical loads, thus balancing the capital cost of their installation in ships. The model uses accurate data of a ship’s power demands and directs the assignment of loads to the available power resources onboard. Other types and sizes of REs and FCs can also be incorporated into this model for future expansion. This is possible since all modules embedded in the model are implemented as independent modules and functions.
The management and distribution of power sources to meet load demands considers the reduction of CO2 emissions. The programmable structure of the EMS uses a finite state machine (FSM) concept according to a ship’s type and application. Using our simulation model, we evaluated the performance according to a ship’s requirements for controlling EMS states and transitions. Following the EMS decision algorithm proposed for energy management, we achieved fuel savings and CO2 emission reduction.
Section 2 presents the structure and interoperability of the ship’s modules. Section 3 presents the structure of the control system, the EMS model, and the description of its states and transitions. Section 4 implements four scenarios, defining cruise conditions and performance simulation. Section 5 and Section 6 summarize and discuss the results from the four scenarios, draw conclusions, and highlight further model expansion.

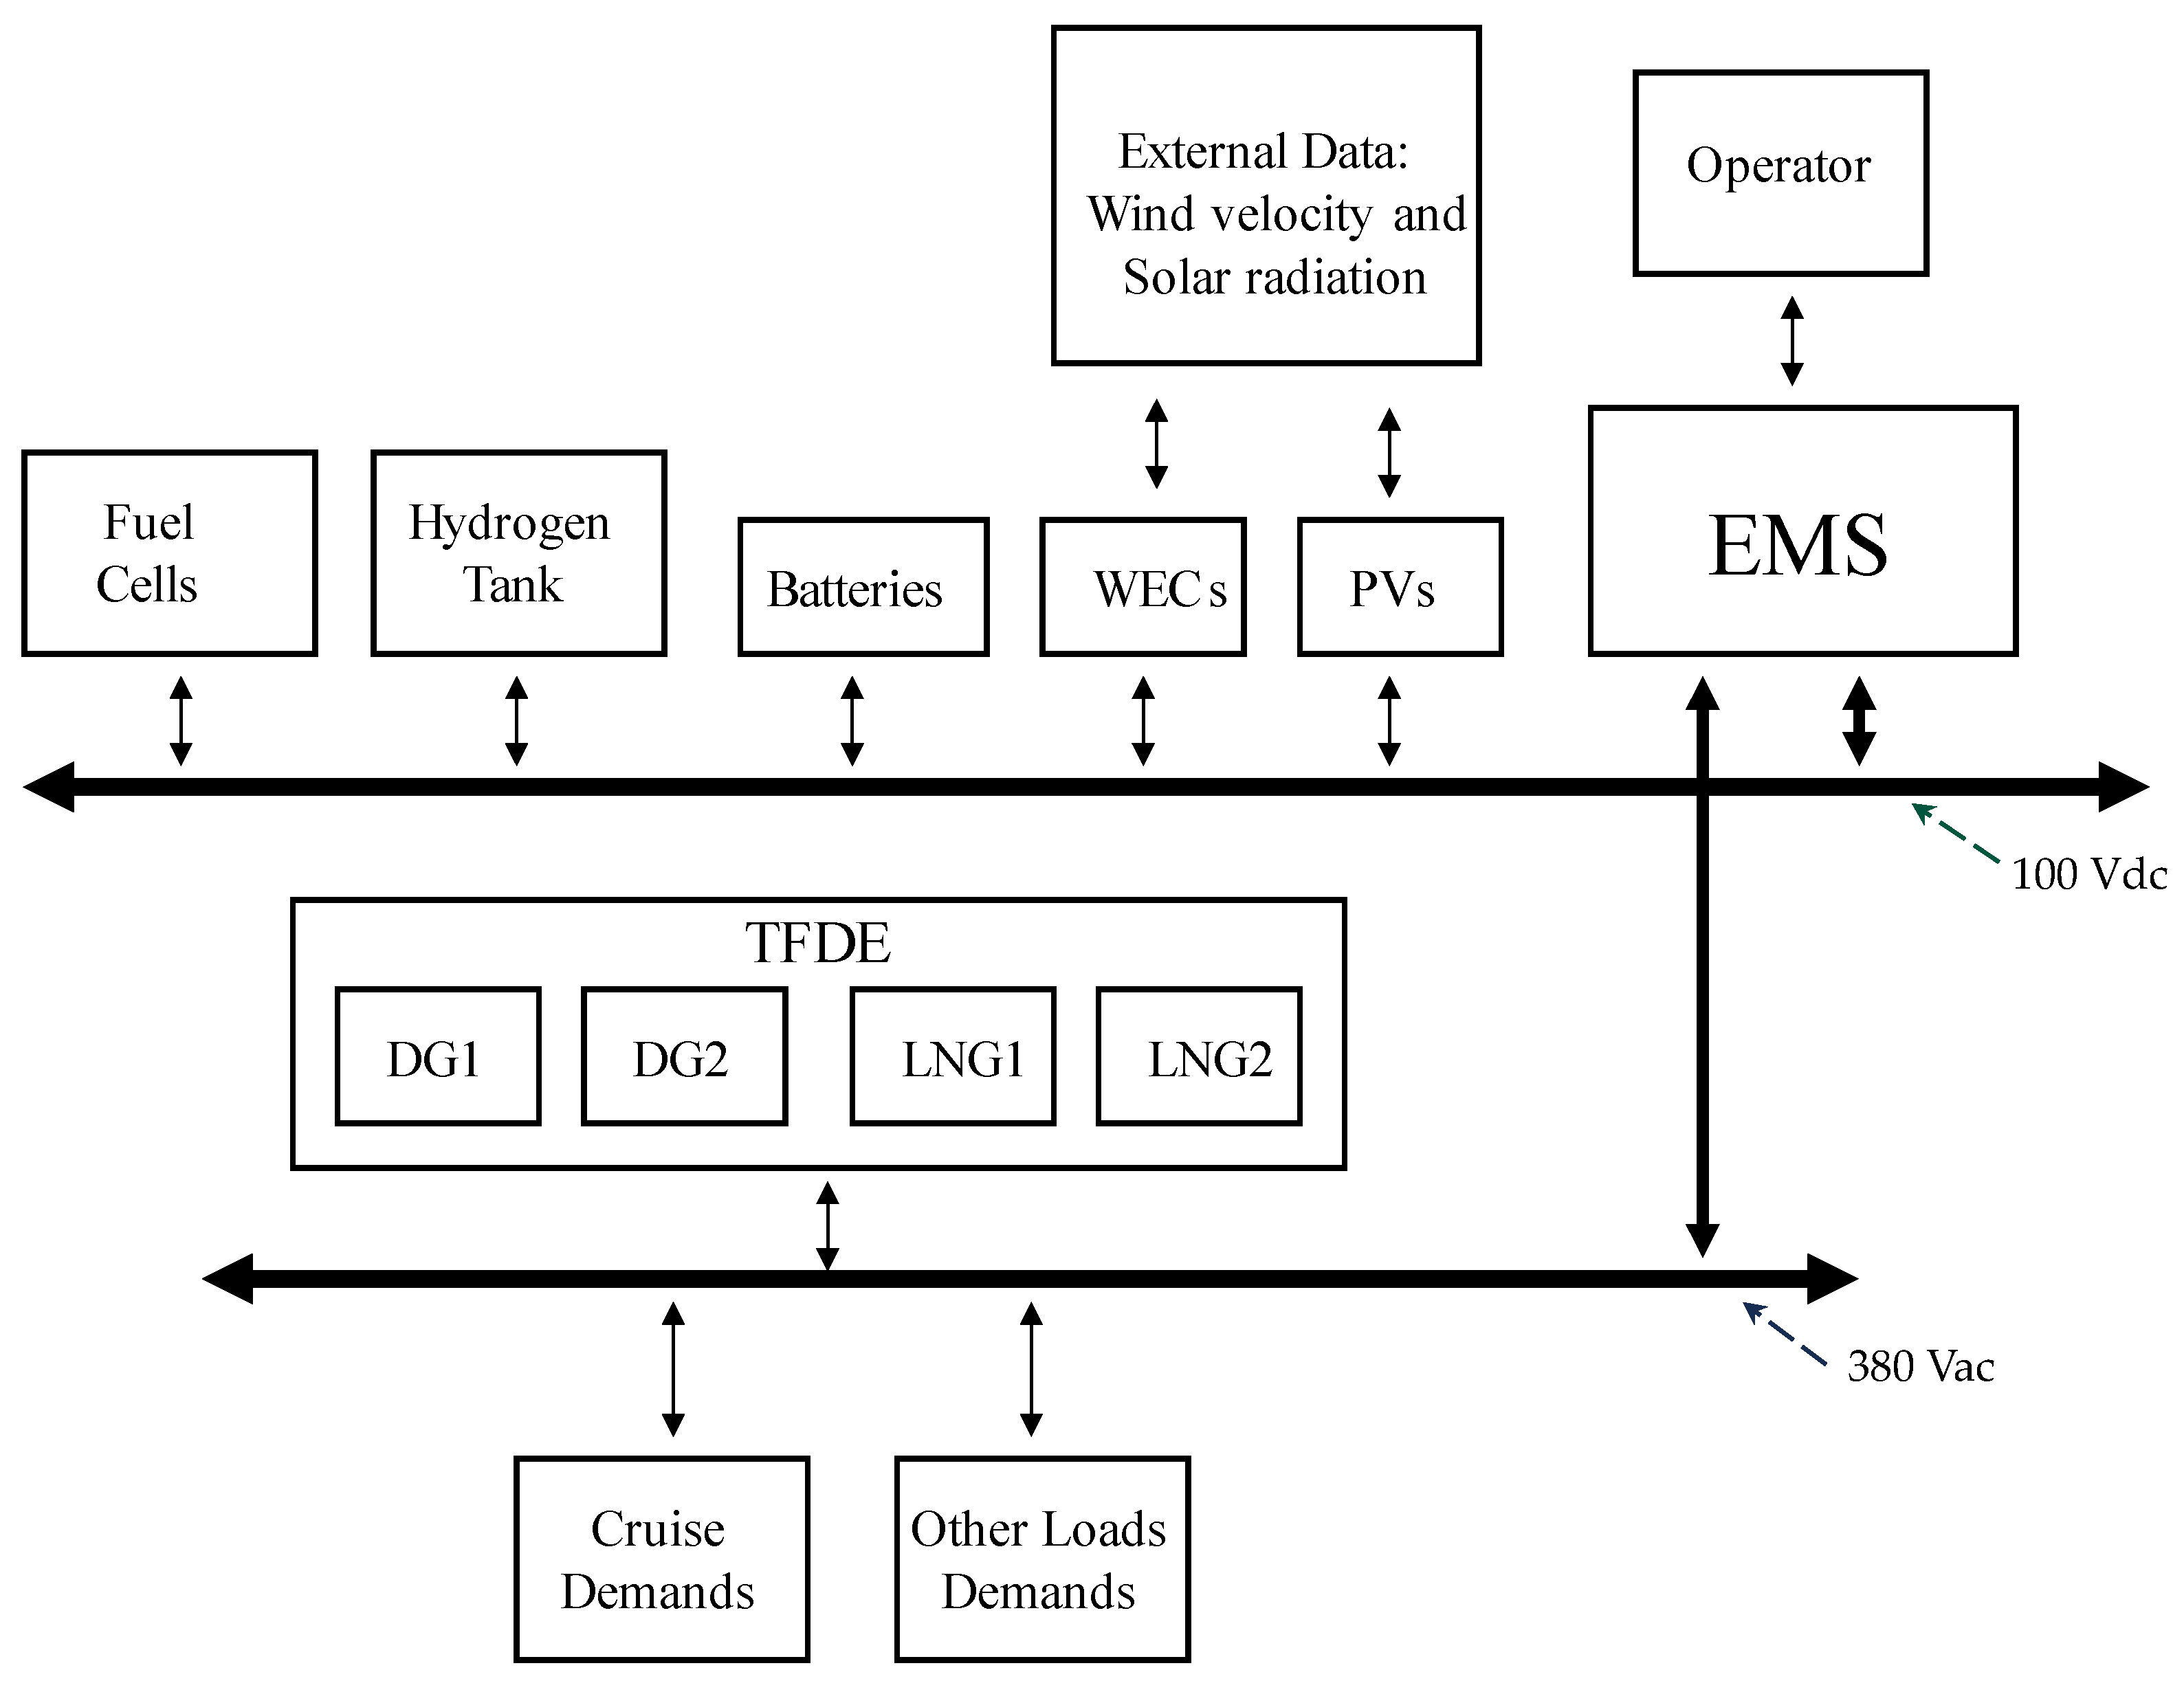
2. Ship Energy System

Ships with LNG engines use the BoG from cargo tanks as fuel for the propulsion system. Thus, LNG carriers are powered by BoG, alongside heavy fuel oil and diesel engines, known as triple-fuel diesel engines (TFDEs). A TFDE accepts both liquid and gaseous fuels in its different subsystems in parallel and without limiting power generation. When the TFDE is in ‘gas mode’, the air–fuel mixture is fed to the cylinders during the intake cycle, while when the TFDE is in ‘diesel mode’, MDO is fed to the cylinders at the end of the compression cycle.
Thus, the TFDE runs on natural gas, light fuel oil, and heavy residual fuel oils. Switching between fuels takes place during operation, without loss of power or speed. Depending on the manufacturing technology, the fuel switching operation for the engine can be done in predefined and permitted transition stages: from ‘gas mode’ to ‘diesel mode’ without any time limit, while the reverse transition may require a period of inactive time determined by the manufacturer. TFDE technology engines have the same level of power output, regardless of the fuel used and drive combustion subsystems [29].
The total cargo capacity is divided into independent horizontal tanks below the ship’s decks, at a maximum pressure of 4.20 bars and a minimum temperature of 163 °C. When using BoG gas from the LNG cargo to generate power, the engines increase their fuel consumption, but still have lower operating costs than conventional steam turbines. Electric generators power the ship’s electrical grid and electric motors for propulsion, at variable speeds, depending on propulsion system options. Gas loading or unloading equipment for the BoG and fueling system consists of pumps for gas fuel supply, compressors, heaters, vaporizers and a cargo liquefaction unit.
The ship’s energy system consists of thermal generation units based on TFDEs and FCs. The ship’s energy management is implemented by the EMS, which controls the distribution of power between generation and load demands during different time periods and under different operating conditions. Thus, the EMS, depending on the detected load states, dynamically switches to available options and achieves power balance with respect to time when power resources and load demands vary. In addition, the EMS controls the levels of hydrogen production through the electrolysis process (hydrogen tank), offering to this unit the power produced by the ship’s REs. Hydrogen is produced keeping the hydrogen tank fill level in balance, aiming to provide sufficient amounts of hydrogen flow to the fuel cells. Therefore, in this ship’s energy system, REs are used exclusively for the production of hydrogen, without any involvement in meeting other electrical load demands.
Figure 1 shows the energy control system of a ship with the EMS, power generating units (PVs, WECs, FCs, batteries) and electrical loads (propulsion motors, pumps, compressors, elevators, lights, fans, heating–cooling, air conditioning, cabins, etc.).
An estimation of the time-varying electrical loads with two propulsion motors is shown in Figure 2. Depending on the cruise conditions, the second propulsion motor can be connected or remain disconnected from the propulsion system. It is estimated that cruise demands for propulsion represent about 90% of the ship’s total electrical loads, while other electrical equipment requires about 10% of the total electrical loads.
Figure 2 shows the typical power demands for the operation of an LNG carrier. The operation is related to the power consumption for lighting, pumps, engine function, etc. The values of the total power are typical and are based on the scale of a tanker of such size. Eventually, power demands could increase in the case of a vessel bigger in size and capacity. Figure 2 has been designed with precision; it shows a cycle of 24 h for the average consumption.
The photovoltaic panels (PVs) have been distributed on three decks of the ship. Thus, three different sun luminance conditions are used by the model, based on solar radiation data, corresponding to each deck (left–right–center). The inverters step up the dc voltage produced by PVs to a constant voltage of 100 Vdc for use in the charging interface for the battery grid and then produce hydrogen from the electrolysis unit through the discharging interface. Solar radiation levels are periodically modified on a daily/hourly basis depending on the months of the year [6], geographical navigation coordinates, longitude and latitude and, consequently, depend on the ship’s navigation routes [10,30], as shown in Figure 3.
The simulation of WECs uses a common wind speed record for all decks, because during ship cruises, wind speeds are affected by geographic zones and day or season conditions. External data files provide information on wind speed and solar radiation levels. The ship’s operator can select according to the weather, wind and solar radiation conditions through different scenarios, allowing for different simulation conditions and evaluating the performance for the overall system. The ship’s energy management implemented by the EMS uses intelligent techniques that select the optimal power distribution of generating units to cover load demands [30,31].
Power generated by the REs is supplied to the hydrogen production unit, which, based on the available power resources and the storage capacity of the hydrogen tank, produces the hydrogen quotas required for combustion by the FCs, while keeping the hydrogen storage levels almost constant in the tank. Hydrogen production units operate in parallel with dc voltage supply of 1 V each [23,32,33,34]. The hydrogen production system consists of 100 parallel units, and the hydrogen produced is stored in the hydrogen storage tank of 20 ton capacity. Collectively, electric units require approximately 39 KW to produce 1 kg of hydrogen [35,36,37,38].
Fuel cells (FCs) are autonomous units that, based on the conditions and the quantity of hydrogen available to them, produce electricity, which is dispatched to the EMS for the management of the ship’s energy demands. The maximum power generated by the fuel cells for the installed units is up to 3.5 MWs [23]. From 1 Kg of hydrogen, they generate around 39 KWs [39]. A grid of 20 units of 175 KWs each is used to achieve the maximum power levels [21,23].
The model correlates the simulation process with selected cruise scenarios in order to assess (a) cruise conditions and required ship power, (b) predict fuel consumption and gas emissions, (c) optimally manage the production of electric power and (d) manage available resources in time. The software was implemented using Matlab [40]. All model entities are defined as standalone code functions. These functions are called during the simulation process in time, based on numerical calculations, returning numerical results for each simulated operating time point. The simulation process is controlled by the operator, who defines the simulation periods for running each scenario. Additional parameters and data are provided to the model using external data files.

3. Energy Management Control System of the Ship

3.1. Definitions, Input and Output Variables

The EMS controls the operation of the ship’s power generation system units—PVs, WECs, LNGs, DGs, FCs and the battery grid—in time, with direct commands cutting in or cutting off the generation units and the loads [41,42]. The EMS is designed and implemented as a finite state machine (FSM) [10]. The FSM structure consists of a finite number of states in which the system remains at any period of time. The FSM transitions from one state to another occur when the control logic receives changed input variables. Thus, the FSM is defined by its states and the input variables that trigger the transitions [43,44,45].
To model a ship’s systems and subsystems, the FSM selects operating conditions from state transitions. However, for our system, the FSM is complex enough to define all possible transitions; at each step, each element can be instructed to remain in current operating condition or change its operating level [46]. The EMS receives the input variables (Table 1), connects or disconnects the functions of the output units, and upon completion of the call returns the output variables (Table 2).

3.2. The Mathematical Model

The mathematical model of the EMS is implemented by an FSM structure, which monitors a ship’s power demand and generation using all available resources. Available power resources include the installed thermal engines TFDE (DG1, DG2, LNG1, LNG2) and the FCs. The modeling of PVs and WECs is based on published reports [6,47,48,49] and of hydrogen tanks as stand-alone subsystems [23].
Electrical energy requirements are satisfied by defining the levels and conditions for transition decisions between finite states. Thus, the EMS power distribution system controls transitions in the current state, activating or deactivating the appropriate units from the available power generation sources.
For the realization of the EMS, we identified 20 finite states, which are described in Section 3.3. The mathematical model of the system controlled according to these 20 finite states must determine the power generation according to the load requirements and is given in Equations (1)–(18). For reasons of simplicity of the model, we omit the use of the finite state index j = 1, …, 20 in each of the following equations. Thus, for each finite state j = 1, 2, …, 20, Equations (1)–(18) constitute the mathematical model.
The power produced by each of the diesel generators DG1 and DG2 is given by the equation:
Pd = ηd∙ Cf ∙ F
where 0 < ηd < 1 is the efficiency factor, Cf is the fuel factor and F is the fuel volume provided to the generator. Using Equation (1), we derive the equations for DG1 and DG2, using subscripts 1 and 2, as Pd1 and Pd2, respectively. Then, for DG1 and DG2, we write the power balance for the power requested and supplied to the system:
Pd1 = Pd1r ≤ Pd1max
Pd2 = Pd2r ≤ Pd2max
The power provided by each of the liquified gas generators LNG1 and LNG2 is given by Equation (4):
Pg = ηg ∙ Cg ∙ Fg
where 0 < ηg < 1 is the efficiency factor, Cg is the fuel factor and Fg is the fuel volume provided to the LNG generator. Power balance for requested power Pg1r and Pg2r from LNG1 and LNG2 generators, Pg1 and Pg2, respectively, is:
Pg1 = Pg1r ≤ Pg1max
Pg2 = Pg2r ≤ Pg2max
The subscript ‘max’ denotes the maximum limits of the equipment according to the manufacturer’s data.
The power generated by wind turbines is given by Equation (7):
Pw = 1/2 ∙ ηw ∙ Cp ∙ ρ ∙ Sw ∙ V3
where 0 < ηw < 1 is the wind generator efficiency factor, 0.4 < Cp < 0.593 is the power coefficient according to Betz law, ρ = 1 kg/m3 is the air density, Sw is the cross section of the wind turbine (m2) and V3 is the wind velocity at 3rd power [50].
The power produced by the PV system is given by the equation:
PPV = ηPV ∙ SPV ∙ Rad
where 0 < ηpv < 1 is the efficiency of the solar panels, Spv is the surface of each solar panel (m2) and Rad is the solar luminosity (W/m2).
The amount of hydrogen produced by electrolysis is given by Equation (9):
Hm = ηH ∙ Phydro
where Hm is the hydrogen mass produced (in Kg), 0 < ηH < 1 is the efficiency of the electrolysis process and Phydro is the power supplied for electrolysis (W). Because the power provided for the operation of the electrolysis units Phydro and for the production of hydrogen comes exclusively from the ship’s REs, photovoltaics PPV and wind PW,
Phydro = PPV + PW
The power produced by the FC generator is given by Equation (11):
PFC = ηFC ∙ CFC ∙ FFC
where 0 < ηFC < 1 is the efficiency factor of the FC generator, CFC is the fuel factor and FFC defines the mass of the fuel, hydrogen, provided to the FC generator. Power balance for the power requested, PFCr, from the FC generator is:
PFC = PFCr ≤ PFCmax
The battery equations relate the power required to discharge the batteries Pbr, and the power offered for charging Pbc as well as the current state of charging SoC:
Pbr = PL − PPV − PW
Pbc = PPV + PW − PL
SoC = PL/PT
where state of charging SoC is 0 < SoC < 1 and PL is the total charging capacity.
The power for the loads’ demand is:
P L = k = 1 n P k < P Lmax
where Pk is the load of each of the k electrical load installations and drive systems, such as propulsion, pumps, compressors, heaters, vaporizers, lighting, etc., and k = 1, 2, …, n.
The total power generated PT is defined by Equation (17):
PT = Pd1 + Pd2 + Pg1 + Pg2 + PFC + PS
where PS is the amount of electrical power reserve, which is not needed and can be consumed as excess power (spare), [6].
The power balance in the system is expressed by Equation (18):
PT = PL

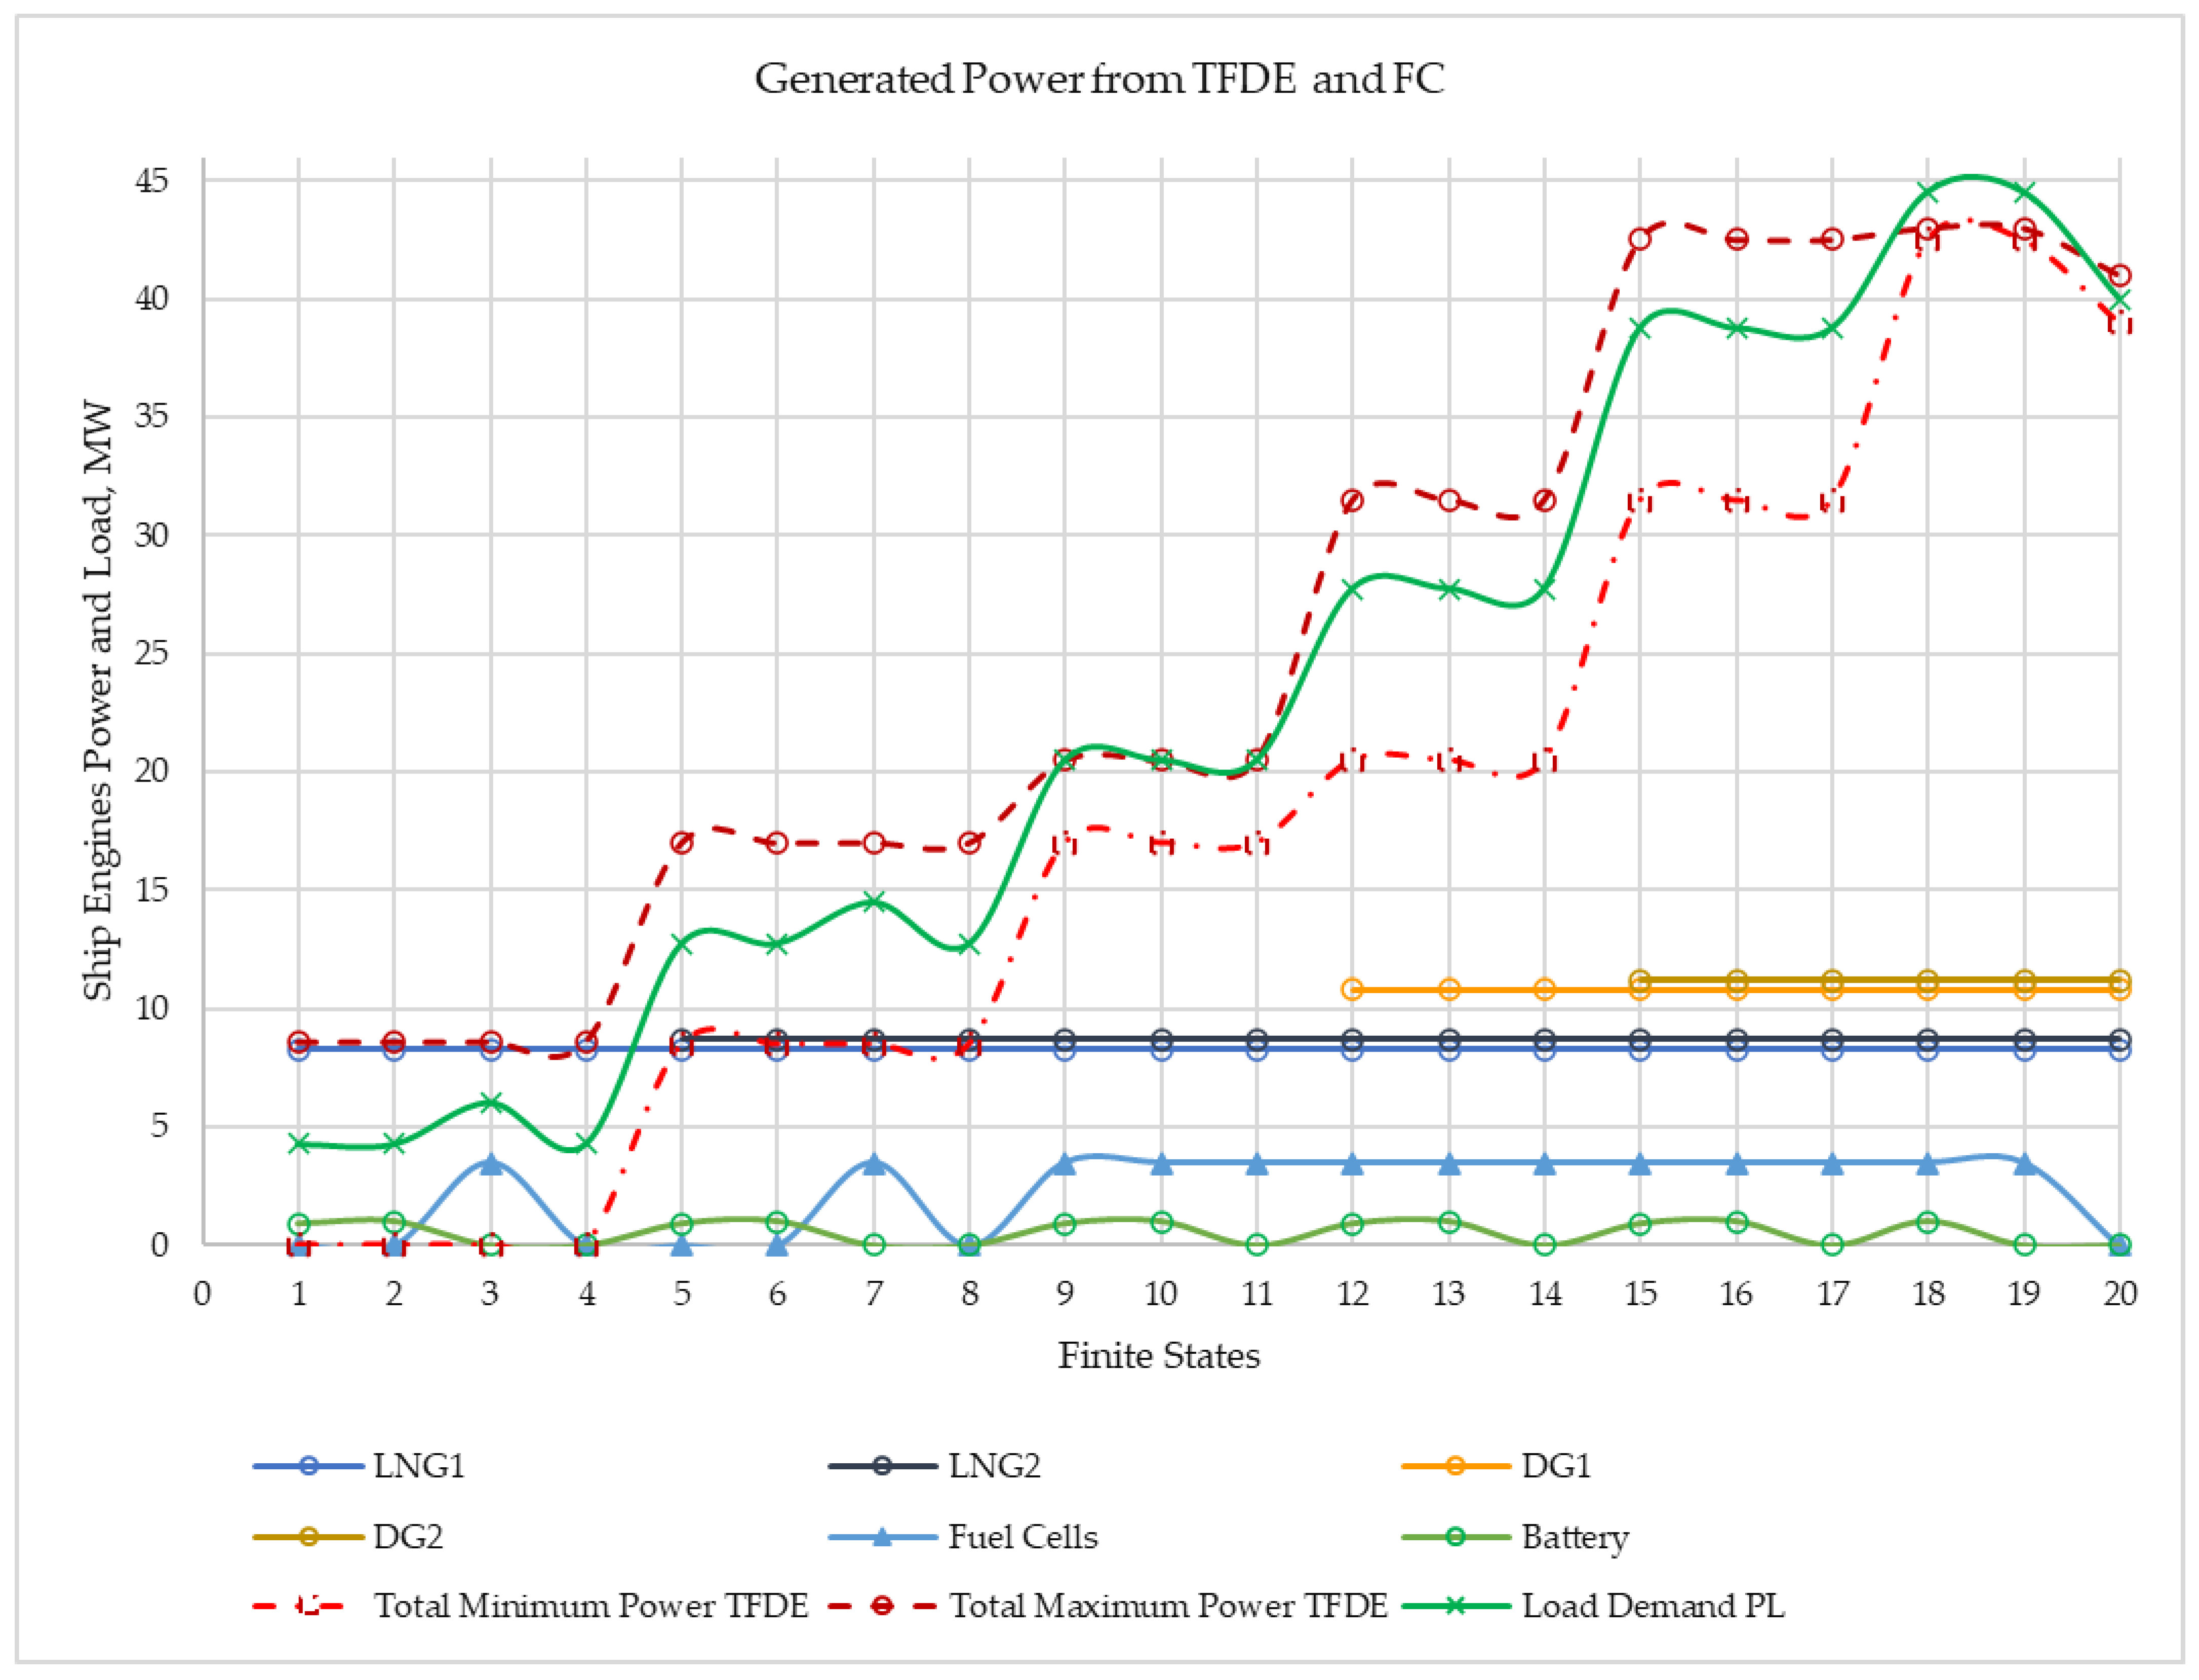
3.3. The Finite States and Transitions

Ships are autonomous and isolated energy entities that meet their power demands from the thermal engines already installed onboard (TFDE technology using diesel–HF–LNG). The addition of REs for the production of hydrogen and the use of FCs does not aim to completely replace the existing power generation system of the ship, but works as an auxiliary to it, with the aim of reducing the pollutants produced by the use of MDO. It becomes clear that since the amounts of energy produced by “green energy sources” are not sufficient, the excess power of loads is covered by activating the already existing thermal engines using MDO or other fuel.
The input and output variables related to the transition conditions are defined in Table 1 and Table 2, respectively. The description of the decision-making finite states and the conditions for transition between states are presented in Table 3. The EMS transitions between finite states are based on the management of power generation decisions as they arise from varying load demands in time, as described in Table 3. The transition between states is made according to defined logical conditions, based on the level of load demands and the available power generated.
The organization of a finite state machine can handle the load demands in terms of energy consumption levels and transfer them to the existing structures of the autonomous power generating system in order to cover them. The strategy of making decisions is connected with reduced production of polluted exhaust gases and with reduced pollution. For this reason, it is proposed that LNG engines consume the boil-off gas (BoG) and combine it with renewable energy sources that power the fuel cells for the purpose of electrolysis. It is obvious that with other available sources of power generation, the decisions and commands for the load covering could be made by another “finite state machine”. In our study, a specific example that demonstrates the operation of the EMS is presented in Table 3 and is shown in Figure 4.
The state transitions and the logical design that selects the next state at each step are presented in Table 3. Table 3 shows the necessary and sufficient conditions for the operation of the tanker driving system, based on the mathematical model from Equations (1)–(18). The FSM model is logically designed; however, it is necessary to define the profile for each operating state of the system. In each operating mode, the electric load demand and the power supply by the generators to meet it are defined.
  • Observing the states of the generating units, the EMS assigns the ship’s power demands to the LNG1 generator as first priority.
  • The EMS allocates the additional power requirements to the LNG1 and LNG2 generators.
  • The EMS allocates the power requirements that overcome the two LNGs’ ratings to the FC generator.
  • In a situation where power requirements exceed the capacity of LNG1, LNG2 and FC, the EMS directs the remaining load demand to the system’s diesel generators, DG1 and DG2. The activation by the EMS of DG1 and DG2 is the last priority for power coverage; due to the fuel used (MDO), they are the ship’s most polluting generators in terms of CO2 emissions.
The logical design of the transitions of finite states from State 1 to State 4 is shown in the flow chart of Scheme 1. The same logical design is applied to the next four groups of states: State 5 to State 8, State 9 to State 11, State 12 to State 14 and State 15 to State 17. The logical design involves the charging of the battery unit and the activation of the fuel cell unit.
Through the simulated cruise scenarios described in Section 4, it is shown that the ship’s power demands are dispatched towards the LNG and FC units. However, the use of FCs may be limited by the hydrogen requirements for their operation. The hydrogen production unit uses the power produced by PVs and WECs for electrolysis through the charged batteries’ grid. In case the batteries’ grid that provides the required dc voltage is deactivated, it is possible to supply the dc power directly from the REs, PVs and WECs to the hydrogen production unit, due to the dc level of voltage resulting from the PVs, without any need for conversion (see also Figure 1).
In practice, energy management by the EMS is implemented using programmable logic controllers (PLCs) scaled for industrial applications, which allow automated finite state transitions. PLCs are devices capable of performing industrial control, offering digital operation and control for any environment and type of power distribution. The introduction of new algorithms for EMS operation can be evaluated using the installed firmware on top of the PLC device. An EMS algorithm can be modified on the fly, switching to an alternative operating mode, as the ship’s power requirements and operating conditions are modified over time. The PLC can automatically disconnect fuel cells from the ship’s power distribution system, allowing for steady state operation based on the installed TFDE thermal engines. This feature supports fast debugging of the power distribution system when abnormal conditions occur during operation, allowing for the isolation of malfunctions in the power subsystems. Recent use of PLCs for remote control has been introduced in relevant research projects and publications [51,52].
Based on the initial design for the construction of the ship at the shipyard, it can be stated that the power load demands of the ship are met exclusively by the TFDEs DG1, DG2, LNG1 and LNG2. Consequently, the use of FCs has an additional and complementary role in power balance (Equations (1)–(18)).
Transitions from state to state are defined and aim to increase the use of FCs, contributing to the reduction of emitted pollutants. The FSM performs the transitions, taking into account the current conditions for power demand. In addition to FCs, it gradually activates the ship’s existing thermal engines: it prefers LNG generators and ends up using DG1 and DG2 only in cases where the required amount of power cannot be generated by the joint operation of FC units and LNG engines.
Thresholds for making state-to-state transition were set by simulation procedures during the model development phases, using a tuning process over simulated results, with the constraint to reduce the use of DGs. If this is not possible, then the EMS fully activates all the DGs on the ship. The results from the simulation based on the conditions for the cruise scenarios studied are presented in Section 4.

3.4. Study Case of the LNG Cargo Tanker Energy Generation System

The ship studied in the four scenarios from Section 4 is an LNG cargo tanker. The simulation scenarios used numerical data from a commercial LNG cargo tanker with a displacement of 120,000 tons, length 360 m, width 65 m, displacement depth of 28 m and 3 decks, offering a total area of 7000 m2 for the installation of 500 PV units with solar panels of 14 m2 each. This type of ship has four TFDE technology engines, which can deliver a total of 39 MW of power at full load.
The technical information of TFDE, diesel and LNG engines is presented in Table 4 [10,29]. The PV panels are organized in three sections above the decks (center, left and right rear decks). The technical information of the PV system is summarized in Table 5 [10]. The RE system uses vertical-axis WECs, capable of operating at a large range of wind speeds, without rotational and structural problems due to increased stresses over their axes, which could result in reduced operation in windy conditions. The technical data of the WECs are shown in Table 6 [10].
For simulation, we consider variable solar radiation levels on a daily periodic basis that also depend on the seasons of the year and on the longitude and latitude of the ship’s cruise [53]. The photovoltaic panels are distributed over three decks of the ship; based on the placement of the photovoltaic systems, three different solar radiation profiles are required for each deck. The photovoltaic panels are installed slightly inclined with respect to the surfaces of the ship’s decks, at an angle of 30°. Solar irradiance records provide detailed information on solar irradiance according to the orientation and placement of ships’ decks on cruise routes. A plot of electric power yield from solar radiation is shown in Figure 3. Typical nanocrystalline PV panels, as well as vertical-axis WECs for offshore applications, are shown in [10,54].
WECs are designed with vertical support axes and ensure continuous operation for a wide range of wind intensities [54]. It should be noted that the aerodynamic drag introduced during the construction of the ship does not significantly change its sailing capability and therefore does not significantly affect the fuel consumption to ensure a constant speed. The simulation model for WECs uses a common wind speed record for all decks, since wind levels are mainly influenced by geographic zones during the ship’s cruise.
There are various types of electrolyzers, for example, the alkaline electrolyzer, which is one of the oldest methods of electrolysis. This method requires a liquid electrolyte solution and produces hydrogen in a cell with an anode, cathode and membrane [55,56]. The power generated by the ship’s REs (PVs and WECs) is supplied to the hydrogen production unit applying the electrolysis process for the production of H2. The hydrogen production units operate at a constant dc voltage of 1 V each. It should be noted that 100 electrolysis units are capable of producing a maximum amount of 125 Kg of hydrogen in one hour, and each of them is supplied with a power of 30 KW. Table 7 shows the technical specifications of the hydrogen production unit [29]. The FC power units consume the hydrogen that is produced and stored in a 20-ton storage tank (hydrogen tank). The FCs with a maximum hydrogen consumption of 120 Kg can produce a maximum power of 3.5 MW. The technical data are shown in Table 8 [29].
A number of batteries are connected (stacked) to form a battery grid, allowing for a charging interface at 100 V dc [57]. The discharge interface directed to the hydrogen production unit operates at the same voltage level without the involvement of inverters. The total charging capacity of the battery grid set is 200,000 Ah. The technical data for the battery storage system are shown in Table 9 [10].
It must be explained that in each step of the simulation the EMS gives the command for covering the load requests from the available power generation sources that exist onboard. The transit states occur in each time step as pre-defined by the user of the model. The FSM is a finite state machine with completed states, as per definition. More specifically, the finite states of the EMS are 20. A detailed explanation of all finite states of the EMS is provided in Table 3. The debugging of the functions has been performed in detail based on the implementation of the power demand requests, specifically for each state and for the control of command for covering them depending on the availability of power production sources. The total balance based on the control of each state should satisfy the condition of power demands.
Table 3 shows the details of the logical design of 20 finite states. Figure 4 shows details of the study case of the tanker with the technical specifications presented in Section 3.4, in Table 4, Table 5, Table 6, Table 7, Table 8 and Table 9, and according to the logical design of states and transitions from Table 3.

4. Cruise Scenarios

During the presented simulation procedures, four scenarios were studied. The activation and deactivation of power sources and fuels used during the four cruise scenarios are shown in Table 10.
Scenario 1: 24 h stable cruise conditions that maintain a nearly constant course (constant speed and sailing direction) for a large part of the route, such as during open sea or ocean passages. The RE units (PVs and WECs) and FCs are disabled (OFF), so the ship relies solely on the installed TFDEs (DG1, DG2, LNG1, LNG2), which are enabled (ON).
Scenario 2: The same cruise conditions as in Scenario 1 are maintained. The FC and RE units (PVs and WECs) are enabled (ON), and the ship receives energy from the installed TFDEs (DG1, DG2, LNG1, LNG2) and from the FCs. The DGs receive MDO and the LNGs receive BoG as fuel.
Scenario 3: The same cruise conditions are maintained as in Scenarios 1 and 2. The FCs in this scenario remain activated (ON). The difference from Scenario 2, however, is that all the ship’s TFDEs use BoG LNG fuel exclusively, replacing the use of MDO by the DGs. This is possible given the TFDE technology of the ship’s engines.
Scenario 4: The same cruise conditions are maintained as in Scenarios 1–3. In this case, the simulation is performed with the model that we developed in the context of our previous work [10]. No FC unit was available in the technology of the ship from [10]. The tanker operation is based on the use of the installed engines (DG1, DG2, LNG), which are enabled (ON), and the use of external RE units (PVs and WECs), which are also enabled (ON). The DGs use MDO and the LNGs use BoG. The energy generated by REs (PVs and WECs) meets the load demands. In order to be able to directly compare the results with those of Scenarios 1–3, the internal engines were upgraded to the power output levels presented in Section 3.3. The same was applied for the power produced by PVs and WECs, at the same levels and dimensions as in Scenarios 2–3.
Scenarios 1–2 are intended to demonstrate the use of FCs in reducing gas emissions. Scenario 3 exploits the use of the TFDE technology of the ship’s engines for “greener” power generation onboard, since all installed engines exclusively use BoG LNG fuel, and shows the differences in operation from Scenario 2. Scenario 4 aims to compare the fuel consumption and emissions performance with previous published work [10], which used only RE generating units, PVs and WECs to meet the load demand, but no FC unit was installed.
In this study, using TFDE technology engines and FC units, the RE units (PVs and WECs) exclusively provide their generated power for the hydrogen production process. The hydrogen is intended for combustion and energy production by the FC units. The simulation models the power output amounts from the FC units, aiming to maintain the hydrogen fuel storage tank at an almost constant level. Therefore, the power output from the FC units will approach its nominal value when the hydrogen levels in the tank are stable so that they can supply the required power.
The four scenarios have been extended until 25 h for one fully completed round of all the cycles of consumption in a fully completed 24 h duration. The power demands are executed in a periodical way for 24 h. The power demands for the 25th hour are retrieved by using the power demands for the 1st hour of operation to show the periodicity of the demands.

4.1. Scenario 1: Constant Cruise Conditions with Only the TFDE in MDO and BoG Mode, RE and FC Units Are Disabled

In Scenario 1, we calculate cruise conditions, keeping the ship’s speed almost constant, set at 80% of its maximum. This sailing condition is translated into an almost constant power demand, initially set at 22.5 MW, or at an average of 20.96 MW, due to variations in the ship’s load according to the time variation of operation of other parts of the ship.
In this scenario, the operation of the ship is based solely on the use of its TFDE technology engines (DG1, DG2, LNG1, LNG2) without the use of REs (PVs and WECs), the hydrogen production unit, and the FCs. The fuel used for DG1–DG2 is diesel, heavy fuel oil or MDO, while BoG LNG is used for LNG1 and LNG2 engines, as shown in Table 4.
The results for Scenario 1 are presented in Figure 5 and in Table 11, Table 12 and Table 13 and illustrate the power demands and the power produced by the generating units, the fuel consumption and the CO2 emissions, respectively.
From the results obtained, we can see that the EMS covers the average power demands by activating LNG1 and LNG2 at their maximum power of 8.5 MW + 8.5 MW = 17 MW, resulting in a power coverage of 81.11% of the total load demands, since LNG engines are preferred to be used in comparison with diesel engines as they produce lower CO2 emissions. For the additional power requirements exceeding the LNGs’ maximum capacity, the EMS activates DG1 to produce 3.96 MW or 18.89% of total demands.
The results of fuel consumption during the four scenarios are in shown Table 12. From the results, it appears that 75.22% of the CO2 emissions are caused by LNG1–LNG2 and 24.78% by DG1 (Table 13).

4.2. Scenario 2: Constant Cruise Conditions with TFDEs in MDO and BoG Mode, FC and RE Units Are Enabled

In Scenario 2, the same cruise conditions as in Scenario 1 are maintained. In this scenario, the operation of the ship is based on the use of TFDEs (DG1, DG2, LNG1, LNG2) and FCs. The fuel used for DG1–DG2 is diesel, heavy fuel oil, or MDO, while BoG is used for the LNG1 and LNG2 engines. The FCs use the hydrogen produced by the electrolysis process in the hydrogen production unit, which is supplied with energy provided by REs (PVs and WECs). The fuels used are shown in Table 10. The results for Scenario 2 are presented in Figure 6 and Table 11, Table 12 and Table 13 and illustrate the required power versus time and the energy generated by the power units, the fuel consumption and the CO2 emissions, respectively.
From the results obtained, we see that the EMS covers the average power demands activating LNG1–LNG2 at their maximum power of 8.5 MW + 8.5 MW = 17 MW, resulting in a power coverage rate of 81.11% of the total load demands. For additional power requirements exceeding the LNGs’ maximum capacity, the EMS activates DG1 to produce 2.9 MW or 13.84% of total demands and FCs to produce 0.91 MW or 4.34% of the total load demands. From the results, it is shown that 79.60% of the CO2 emissions are caused by LNG1–LNG2, 20.24% by DG1 and 0.17% by FCs (Table 13).

4.3. Scenario 3: Constant Cruise Conditions with TFDEs in BoG LNG Mode, FC and RE Units Are Enabled

Scenario 3 takes advantage of the TFDEs, so the engines use a common fuel, the BoG LNG, available from the tanker’s cargo. In this case, none of the installed engines use MDO as fuel. In this scenario, the ship’s operation is based on the use of its TFDEs (DG1, DG2, LNG1, LNG2) and FCs. The FCs use the hydrogen produced by electrolysis in the hydrogen production unit, which is supplied with the energy provided to it exclusively by REs (PV and WECs), as shown in Table 10.
The results for Scenario 3 are presented in Figure 7 and Table 11, Table 12 and Table 13 and illustrate the required power versus time and the power produced by power generating units, the fuels consumed and the emission of CO2, respectively.
From the results obtained, we can see that the EMS covers power demands activating the LNG1 and LNG2 engines at their maximum power of 17 MW as well as DG1, which in this scenario uses BoG LNG as fuel, resulting in 17 + 2.9 = 19.9 MW, with a total power coverage of 94.94% of the total demands. For additional power requirements exceeding power capacity, the EMS activates FCs to generate 0.91 MWs or 4.34% of the total demands. From the simulation results, it can be seen that 14.39% + 85.43% = 99.82% of the CO2 emissions are caused by LNG1, LNG2 and DG1, while only 0.18% is produced by the FCs (Table 13).
Indeed, in Scenarios 2 and 3, the fuel cells power the ship between hours 15 and 17 only. This happens due to the tank filling level of the hydrogen tanks. For all the scenarios, it was used as a primary condition to fill the tank to 50% capacity, the total tank capacity being 20,000 Kg. The resulting power output of the fuel cells takes into account the level of hydrogen in the hydrogen tank and changes in power demands, with the target of keeping the hydrogen level in the tank stable. In the time durations referred to in Scenarios 2 and 3, the contribution of fuel cells reaches the maximum because the hydrogen tanks are filled up to a high level, while also using high power from the renewable energy sources. In the rest of the hours, the contribution of fuel cells is not zero, but it is low.

4.4. Scenario 4: Constant Cruise Conditions with Internal Engines DG1, DG2 in MDO Mode and LNG in BoG Mode, RE Units Are Enabled

In Scenario 4, we keep the same cruise conditions as in all three previous scenarios. In this scenario, we use the simulation model we developed in the context of a previous work [10]. This simulation model describes a ship with three installed engines, DG1, DG2 and LNG, but without FCs. The ship model uses additional REs in the form of PV panels and WECs only, without any use of FC units or other renewable energy sources. In order to compare the results with those of Scenarios 1–3, using the model [10], ship engines as well as the REs and the battery grid have been upgraded to the same levels as those used in the current work (Table 4, Table 5 and Table 6 and 9).
Thus, DG1 and DG2 use MDO fuel and have been upgraded to maximum generation ratings of 11 MW each. The LNG engine uses BoG fuel and has been upgraded to a maximum power of 17 MW. Thus, all engines in the previous model [10] can generate 39 MW in full capacity, the same capacity as used in the current model. The number of PV panels is set to 500 and the number of WECs is set at 500 units, with exactly the same functional and technical characteristics as in [10]. The battery grid is specified with a maximum capacity of 200,000 Ah, as in the current model. The results for Scenario 4 are presented in Figure 8, Figure 9 and Figure 10 and Table 11, Table 12 and Table 13 and illustrate the required power versus time, the power generated by power units, the fuels consumed and the CO2 emissions, respectively.
Figure 8 shows the results from Scenario 4 regarding the ship’s power generation and consumption during a full day (24 h): the load demand and the power generated by DG1, DG2, LNG, PVs, WECs and batteries. Figure 9 shows the detailed results from Scenario 4 regarding the ship’s power generation and consumption during the first two hours of the day, corresponding to very low luminance: the load demand and the power generated by DG1, DG2, LNG, PVs, WECs and batteries. Figure 10 shows the detailed results from Scenario 4 regarding the ship’s power generation and consumption from 11:00 to 17:00 h, which correspond to daytime high solar luminance: the load demand and the power generated by DG1, DG2, LNG, PVs, WECs and batteries.
Figure 9 and Figure 10 show the details of Figure 8 from 0.1 to 1.8 h and from 11.00 to 17.30 h, respectively.
From the results obtained, we see that the EMS covers the power load demands activating the LNG with BoG at its maximum power level and DG1, using MDO fuel, with a power coverage rate of 81.11% and 5.92% of the total load demand, respectively. For additional power requirements, the EMS uses PVs and WECs to generate 5.73% and 0.62% of the total load demands, respectively. The power from the battery grid through the discharge interface covers 8.68% of the total demands. From the results, it appears that 81.34% of the CO2 emissions are caused by LNG and 18.66% by DG1.

5. Discussion of Results

In Section 4, four scenarios were studied:
(1)
normal ship cruise using MDO- and BoG LNG-fueled TFDEs without FCs and without REs;
(2)
normal ship cruise using MDO- and BoG LNG-fueled engines and with H2 from FCs;
(3)
normal ship cruise with TFDEs using BoG LNG fuel with H2 from FCs; and
(4)
normal ship cruise using MDO and BoG LNG-fueled engines and generating units PVs and WECs, but without H2.
A comparison of the results from the four scenarios under these alternatives can be deduced from Table 11, Table 12 and Table 13 and is summarized in Table 14 and Table 15, showing the reduction in fuel consumption and the emission reduction rates from comparing the transition from scenarios 1→2, 2→3 and 3→4.
Switching from Scenario 1 to Scenario 2, we observe a 22.57% reduction in MDO consumption by engine DG1 and a consequent 22.57% reduction in CO2 emissions. This is due to the use, in Scenario 2, of FC units, which took over part of the power load demand, which in Scenario 1 was covered exclusively by DG1. The LNG1 and LNG2 engines maintained their BoG LNG fuel consumption, and consequently the same gas pollutant emissions are due to them, because in both scenarios they are constantly operating at their maximum power outputs. Specific handling is achieved by selection of finite states from the EMS, which prioritizes activation of the LNG1 and LNG2 engines, then activates the FC unit and finally the DG1 and DG2 engines that consume MDO as fuel, with the aim of reducing the pollutants produced. The total pollutant CO2 emission in Scenario 1 is 313.99 tons, which is reduced to 296.72 tons in Scenario 2 (Table 13).
Comparing Scenarios 2 and 3, we observe that TFDE technology engines accept the BoG LNG fuel for all subsystems while eliminating the use of MDO as fuel. This results in an increase in the amount of fuel consumption required for DG1 by a factor of 6.7% (Table 14) compared to the previous scenario to maintain the same power output (due to lower fuel factor efficiency of BoG LNG fuel compared to MDO). The BoG LNG fuel reduces pollution and leads to a 33.77% reduction in CO2 from the engines DG1–DG2 (Table 15). The other engines (LNG1–LNG2 and FCs) do not change either their required fuel consumption for operation or their corresponding gas emissions. Switching from Scenario 2 to Scenario 3, we observe a reduction in gas pollutants from a total of 296.72 tons to 276.39 tons (Table 13). In Scenarios 2 and 3, the EMS operates with the same state transitions to handle the load demands.
In Scenario 4, we use the ship model exclusively using DG1, DG2, LNG, PVs and WECs, without FCs and without hydrogen H2.
When comparing Scenarios 3 and 4, it should be noted that in Scenario 3, all the ship’s engines are TFDE technology and use only BoG LNG as fuel. In Scenario 4, the ship’s engines are traditional engines based on MDO (DG1–DG2) and BoG (LNG). In Scenario 4, no FC units are installed and a reduction in emissions is achieved through the use of the power generated from REs. In Scenario 3, REs are used exclusively to produce hydrogen, which is used as fuel by the installed FC units. Comparing Scenarios 3 and 4, we observe a reduction in the fuel consumption of the DG engines since they use MDO instead of BoG. However, despite the reduction of MDO as fuel in the ship model for Scenario 4, there is an increase in gas emissions at a rate of 33.65% over the total amount (Table 15). At the same generation level, the comparison shows that Scenario 3 produces 276.39 tons of CO2 emissions, while Scenario 4 produces 286.8 tons of CO2 (Table 13).
Therefore, our new model in Scenario 3 using FC units combined with the exclusive use of BoG LNG as fuel for TFDE technology ship engines proves to be the best choice in terms of gas emissions for the system.
The power demands of the ship are usually predetermined and known in advance during a cruise. Of course, power demands can change either when approaching ports or when weather conditions change. Changes in power generation conditions due to adverse weather conditions during a cruise can be considered by changing the simulation conditions from the corresponding configuration files (Figure 2). At this point, however, it should be noted that none of the scenarios we performed during the development and testing phases of the model required power levels that exceeded the maximum power capacity that can be produced by the installed ship’s engines. New emerging technologies are using the Internet of Things (IoT) for the remote control and monitoring of electric motors that drive the propellors of a ship [58,59].
Based on the model presented, it is possible to change the meteorological data according to weather conditions by varying the sun’s irradiance and wind speed levels from configuration files [60]. Therefore, such a change of configuration files has a direct impact on the amounts of energy produced by REs. In case the weather conditions during cruise are unfavorable, the amount of power generated from the REs is significantly decreased, so the coverage of the power balance is taken over by the installed thermal engines of the ship through the state transitions of the EMS. As already mentioned, the EMS bases its operation on actual conditions (power generation–load power demands) and changes dynamically over time, choosing the corresponding state to meet load demand.
However, the model offers the ability to change the number of installed subsystems, introducing different control conditions and boundaries on ships of other dimensions. This slightly modifies the results of the simulation. A reduction of PVs and WECs to 200 units (instead of 500 units used by the model presented) increases CO2 emissions at 278.88 tons from 276.39 tons in Scenario 3 (Table 14), while the average power from the FC units is also reduced to an average of 0.7 MW from 0.91 MW in Scenarios 2 and 3 (Table 12).
Because our research is on a very new topic, we found very few related publications and equivalent systems’ studies by searching databases. Additionally, either the ship type does not match, the ship sizes are not comparable, or the installed generators and equipment are not similar.
In our research, the ship studied in Section 4 is an LNG cargo tanker. The numerical data are from a commercial LNG cargo tanker with a displacement of 120,000 tons, length 360 m, width 65 m, displacement depth of 28 m and 3 decks, offering a total area of 7000 m2 for the installation of 500 PV units with solar panels of 14 m2 each. This type of ship has four TFDE technology engines, which can deliver a total power of 39 MW at full load.
However, we selected the following two studies [61,62], which are discussed below.
In study [61], it is assumed that diesel generators are replaced with hydrogen proton exchange membrane fuel cells in a general cargo ship. This is a medium-sized general cargo ship that travels in the Mediterranean, Marmara and Black Sea. This kind of ship is estimated at 43% of the total global navy [63]. The ship specifications are as follows: weight 10,300 tons, length 128 m, beam 18 m, depth 9.7 m and draught 7.6 m. It is equipped with a main diesel engine of 2500 kW at 750 rpm and a diesel generator of 2220 kW at 800 rpm. The fuel types are heavy fuel oil (HFO) and marine diesel oil (MDO).
Voyage data and ship specifications are used to calculate the effect of replacing diesel machines with FCs on CO2 emissions. The calculations show that by using hydrogen FCs instead of diesel generators on this ship, there is a 37.4% reduction in CO2 emissions. For a 15-year lifetime, hydrogen fuel expenses are computed at $260,981, or $1.99/h, while MDO fuel expenses are $206,435, or $1.57/h. Thus, such a total replacement of diesel engines at $1.57/h by fuel cells at $1.99/h does not save fuel costs.
In study [62], to reduce the environmental impact, hybrid systems with fuel cells and battery packs are considered as an alternative to diesel propulsion ships. An equivalent vessel for voyages between the Croatian ports of Split and Resnik in the Adriatic Sea, in total 54 nautical miles, with a hybrid propulsion system with FC and battery and with a power system control, is being studied on existing vessels equipped with two diesel engines with 300 kW electric power. The results show that the equivalent hybrid power system consists of a 300 kW electrical power FC stack, with a 424 kWh battery and state of charge between 20% and 87%, a hydrogen tank of 7200 L holding 284.7 kg at a pressure of 700 bar, which is compared to the system without FCs that consumes 1524 kg of diesel and generates 4886 kg of CO2.
As mentioned above, our tanker is much bigger than the ships studied in [61,62]. A reliable comparison is made in Table 15 between Scenarios 1, 2 and 3 for the tanker with FCs and Scenario 4 for the tanker without FCs. The results show that the best solution is described in Scenario 3 and is obtained from the transition from Scenario 2 to Scenario 3.
Our paper does not aim to present the fuel cell technology with extensive and plenty of different chemical bases. The purpose is the use of fuel cells due to their “cleanliness” as a fuel and their capacity to reduce the production of polluted exhaust gases. The results from the use of fuel cells are countable and of significant importance, and their contribution is clearly stated in terms of reduced CO2 levels. The final results from the above comparisons show that the cost of hydrogen, the supply infrastructure and safety issues are problems for the wide adoption of FC systems [64].

6. Conclusions and Future Work

This work presented a simulation environment combining TFDE technology power generation with renewable energy sources and fuel cells on an LNG cargo super-tanker. Power requirements for tanker operation include electrical loads (propulsion motors, lighting, pumps, compressors, evaporators, heating, cooling, elevators, etc.) as functions that vary consumption levels according to operating time points. In addition, the contribution of fuel cells, renewable energy sources, PV panels, WEC modules and batteries does not limit the extension of the model, as other types of RE units and FC technologies can be autonomously added to the existing model. REs are implemented as functions that return the power levels produced for each operating point, taking into account the conditions of solar radiation and wind speed during the simulation period, adapted to the ship’s navigation in a geographical area. The power generated by REs is supplied exclusively to the hydrogen production unit and used for the production of H2, which is the fuel for the installed FC units. The combustion of hydrogen is free of CO2 emissions.
Simulation scenarios reveal a significant reduction in CO2 emissions, also accompanied by zero levels of MDO fuel consumption based on TFDE technology engines. The reduction in CO2 emissions comes mainly from the reduction in MDO fuel consumption. This is, on the one hand, achieved by the use of TFDE technology engines, which allow all installed power subsystems to exclusively use BoG LNG fuel, preventing the use of MDO. On the other hand, this is achieved through the transitions of EMS states, which give priority to operation with LNGs in combination with FC units, while activating DGs only in case the power requirements cannot be met through other alternatives.
From the scenarios with the FC system disabled using the MDO-fueled engines, the ship’s power demands are covered by the installed thermal engines, while the use of FC units saves costs and reduces emissions, making a ship’s cruise environment-friendly. Different energy management algorithms and policies can be evaluated in the EMS operation, investigating the results achieved regarding fuel costs.
Simulation also reveals that an important limitation for the design and operation of the system is the ship’s dimensions (super-tanker), which restrict the number of PV and WEC systems installed on decks. This limitation also exists in the size of the tanks and the required safety conditions for the storage and combustion of hydrogen gas. A reduction of REs in terms of PV units at a factor of 60%, without modifying any other characteristics over the same cruise scenarios, leads to a lower utilization of FC units and consequently a lower reduction in CO2 emissions. This reveals that even if fewer FC units are used (due to installation costs and area limitations), a significant gain in terms of fuel savings and CO2 emissions can be achieved. The simulation also highlights the importance of the electrolysis units and the size of the hydrogen storage tank.
We conclude that the field of RE usage for the production of hydrogen as well as FC units for the production of clean power is inexhaustible and can contribute significantly to the electrical energy requirements of a super-tanker, as ships offer sufficient space to accommodate new RE systems on decks and storage tanks in their interiors, especially on large super-tankers. On the other hand, by utilizing the technology of FC units, ships significantly take advantage of their operation by minimizing fossil fuel consumption and, consequently, CO2 emissions.
In addition, we recommend the retrofitting of LNG ships, in addition to the introduction of REs and the replacement of existing diesel engines with TFDE technology engines, as this contributes to fuel cost savings for MDO and at the same time leads to a reduction in CO2 emissions. The purpose of this is to design and build new ships with reduced CO2 emissions.
Our paper aims to show that exhaust gases are finally reduced. Other impacts of renewable sources’ technologies, involving their material construction issues related to the specific effects of the manufacturing and disposal of solar panels, wind turbines, and fuel cells, with their contribution to polluting the environment, are not an aim of this paper. This is a new emerging area of research, which is not focused only on the involvement of RES for electric energy generation, but also highlights several drawbacks that prevent emerging applications of fuel cells in ships from further development, including the high investment costs associated with using noble metals, aging behavior and the short lifespan of fuel cells and hydrogen production units [65]. Disposal of solar panels and wind turbines will cause environmental pollution regardless of whether they are installed onshore or onboard a ship, and this issue needs attention and future work [25].

Author Contributions

Conceptualization, M.E.S. and M.G.I.; methodology, M.E.S.; software, M.E.S.; validation, M.G.I.; investigation, M.E.S.; resources, E.E.S.; writing—original draft preparation, M.E.S.; writing—review and editing, A.P.S.; supervision, M.G.I. All authors have read and agreed to the published version of the manuscript.

Funding

This research received no external funding.

Data Availability Statement

Data is contained within the article.

Conflicts of Interest

The authors declare no conflicts of interest.

References

  1. Moriarty, P.; Honnery, D. Can renewable energy power the future? Energy Policy 2016, 93, 3–7. [Google Scholar] [CrossRef]
  2. Junlarkan, S.; Diewvilai, R.; Audomvongseree, K. Stochastic Modelling of Renewable Energy Sources for Capacity Credit Evaluation. Energies 2022, 15, 5103. [Google Scholar] [CrossRef]
  3. Papazis, S.A.; Ioannides, M.G.; Fotilas, P.N. An information system for the multiple criteria assessment of renewable energy power plants. Wind. Eng. 2000, 24, 81–99. [Google Scholar] [CrossRef]
  4. Verbruggen, A.; Fischedick, M.; Moomaw, W.; Weir, T.; Nadai, A.; Nilsson, L.; Nyboer, J.; Sathaye, J. Renewal energy costs, potentials, barriers: Conceptual Issues. Energy Policy 2010, 38, 850–861. [Google Scholar] [CrossRef]
  5. York, R.; Bell, S.E. Energy transitions or additions? Why a transition from fossil fuels requires more than the growth of renewable energy. Energy Res. Soc. Sci. 2019, 51, 40–43. [Google Scholar] [CrossRef]
  6. Papazis, S.A. Integrated Economic Optimization of Hybrid Thermosolar Concentrating System Based on Exact Mathematical Method. Energies 2022, 15, 7019. [Google Scholar] [CrossRef]
  7. Liu, M.; Wu, D. A new fresh water generation system under high vacuum degrees intensified by LNG cryogenic energy. Energy Procedia 2019, 158, 726–732. [Google Scholar] [CrossRef]
  8. Arefin, A.; Nabi, N.; Akram, W.; Islam, M.T.; Chowdhury, W. A Review of Liquefied Natural Gas as Fuels for Fuel Engines: Opportunities, Challenges and Responses. Energies 2020, 13, 6127. [Google Scholar] [CrossRef]
  9. Frantzis, C.; Zannis, T.; Savva, P.G.; Yfantis, E.A. A Review on Experimental Studies Investigating the Effect of Hydrogen Supplementation in CI Diesel Engines—The Case of HYMAR. Energies 2022, 15, 5709. [Google Scholar] [CrossRef]
  10. Stamatakis, M.E.; Ioannides, M.G. State Transitions Logical Design for Hybrid Energy Generation with Renewable Energy Sources in LNG Ship. Energies 2021, 14, 7803. [Google Scholar] [CrossRef]
  11. Yuan, Y.; Wang, J.; Yan, X.; Li, Q.; Long, T. A Design and Experimental investigation of a large-scale solar energy/diesel generator powered hybrid ship. Energy 2018, 165, 965–978. [Google Scholar] [CrossRef]
  12. Yigit, K.; Acarkan, B. A new electrical energy management approach for ships using mixed energy sources to ensure sustainable port cities. Sustain. Cities Soc. 2018, 40, 126–135. [Google Scholar] [CrossRef]
  13. Zhao, R.; Xu, L.; Su, X.; Feng, S.; Li, C.; Tan, Q.; Wang, Z. A numerical Experimental Study of Marine Hydrogen-Natural Gas-Diesel Tri Fuel Engines. Pol. Marit. Res. 2020, 27, 80–90. [Google Scholar] [CrossRef]
  14. Edwards, P.P.; Kuznetsov, V.L.; David, W.I.F. Hydrogen Energy. Philos. Trans. R. Soc. A. 2007, 365, 1043–1056. [Google Scholar] [CrossRef] [PubMed]
  15. Gregoire Padro, C.E.; Lau, F. Advances in Hydrogen Energy; Springer: New York, NY, USA, 31 July 2000; ISBN 978-0-306-46429-4. [Google Scholar] [CrossRef]
  16. Weiming, L.; Jiekang, W.; Jinjian, C.; Yunshou, M.; Shengyu, C. Capacity Allocation Optimization Framework for Hydrogen Integrated Energy System Considering Hydrogen Trading and Long-Term Hydrogen Storage. IEEE Access 2023, 11, 15772–15787. [Google Scholar] [CrossRef]
  17. Crimes, C.A.; Varghess, O.K.; Ranjan, S. Light, Water, Hydrogen: The Solar Generation of Hydrogen by Water Photoelectrolysis; Springer Science & Business Media LLC: New York, NY, USA, 2008; ISBN 978-0-387-33198-0. [Google Scholar]
  18. Buttner, W.J.; Post, M.B.; Burgess, R.; Rivkin, C. An overview of Hydrogen Safety Sensors and Requirements. Int. J. Hydrog. Energy 2011, 36, 2462–2470. [Google Scholar] [CrossRef]
  19. Garland, N.L.; Papageorgopoulos, D.C.; Stanford, J.M. Hydrogen and fuel cell technology: Progress, challenges, and future directions. Energy Procedia 2012, 28, 2–11. [Google Scholar] [CrossRef]
  20. Maheshwari, K.; Sharma, S.; Sharma, A.; Vermna, S. Fuel Cell and Its Applications: A Review. Int. J. Eng. Res. Technol. (IJERT) 2018, 7, 6. [Google Scholar]
  21. Larminie, J.; Dicks, A. Fuell Cell Systems Explained, 2nd ed.; Wiley: Hoboken, NJ, USA, 2013; ISBN 978-1-118-87833-0. [Google Scholar]
  22. Zhang, X.; Li, P.; Ren, J.; Feng, H.; Mal, C.; Hou, Z. Progress in the application of hydrogen fuel cells. E3S Web Conf. 2019, 118, 01058. [Google Scholar] [CrossRef]
  23. EG&G Technical Services, Inc. Fuel Cell Handbook, 7th ed.; U.S. Department of Energy, Office of Fossil Energy, National Energy Technology Laboratory: Morgantown, WV, USA, 2004. [Google Scholar]
  24. Shakeri, N.; Zadeh, M.; Bremnes Nielsen, J. Hydrogen Fuel Cells for Ship Electric Propulsion: Moving Toward Greener Ships. IEEE Electrif. Mag. 2020, 8, 27–43. [Google Scholar] [CrossRef]
  25. Zhang, Z.; Guan, C.; Liu, Z. Real-Time Optimization Energy Management Strategy for Fuel Cell Hybrid Ships Considering Power Sources Degradation. IEEE Access 2020, 8, 87046–87059. [Google Scholar] [CrossRef]
  26. International Maritime Organization IMO. Available online: https://www.imo.org/en/About/Conventions/Pages/COLREG.aspx (accessed on 3 March 2024).
  27. Wang, Z. Intelligent Dynamic Collision Avoidance Strategy of Hydrogen Fuel Cell Unmanned Ship via Improved Fusion Dynamic Window Method. IEEE Access 2023, 11, 69971–69988. [Google Scholar] [CrossRef]
  28. Tierielnyk, S.; Lukovtsev, V. Emergency Prevention Control as a Means of Power Quality Improvement in a Shipboard Hybrid Electric Power System. Energies 2024, 17, 398. [Google Scholar] [CrossRef]
  29. Babicz, J. Wärtsilä Encyclopedia of Ship Technology, 2nd ed.; Baobab Naval Consultancy: Helsinki, Finland, 2015. [Google Scholar]
  30. Lee, K.; Shin, D.; Yoo, D.; Choi, H.; Kim, H. Hybrid photovoltaic/diesel green ship operating in standalone and grid-connected mode–Experimental Investigation. Energy 2013, 49, 475–483. [Google Scholar] [CrossRef]
  31. Papazis, S.A.; Bakos, G.C. Generalized model of economic dispatch optimization as an educational tool for management of energy systems. Adv. Electr. Comput. Eng. 2021, 21, 2, 75–86. [Google Scholar] [CrossRef]
  32. Harrison, K.W.; Remick, R.; Martin, G.D.; Hoskin, A. Hydrogen Production: Fundamentals and Case Study Summaries; No. NREL/CP-550-47302; National Renewable Energy Laboratory (NREL): Golden, CO, USA, 2010. [Google Scholar]
  33. Jain, K.; Jain, K. Hydrogen Fuel Cell: A Review of different types of fuel Cells with Emphasis on PEM fuel cells and Catalysts used in the PEM fuel cell. Int. J. All Res. Educ. Sci. Methods 2021, 9, 1012–1025. [Google Scholar]
  34. Felseghi, R.; Carcadea, E.; Raboaca, M.; Trufin, C.; Filote, C. Hydrogen Fuel Cell Technology for the Sustainable Future of Stationary Applications. Energies 2019, 12, 4593. [Google Scholar] [CrossRef]
  35. Kalamaras, C.M.; Efstathiou, A.M. Hydrogen Production Technologies: Current State and Future Developments. Hindawi Publ. Corp. Conf. Pap. Energy 2013, 2013, 690627. [Google Scholar] [CrossRef]
  36. Ahmad Kamaroddin, M.F.; Sabli, N.; Tuan Abdullah, T.A.; Siajam, S.I.; Abdullah, L.C.; Abdul Jalil, A.; Ahmad, A. Membrane-Based Electrolysis for Hydrogen Production: A Review. Membranes 2021, 11, 810. [Google Scholar] [CrossRef]
  37. Riis, T.; Hagen, E.F.; Vie, P.J.S.; Ulleberg, Ø. Hydrogen Production and Storage; R&D Priorities and Gaps; OECD/IEA Publications: Paris, France, 2006; Available online: https://www.iea.org/reports/hydrogen-production-and-storage (accessed on 2 March 2024).
  38. El-Shafie, M.; Kambara, S.; Hayakawa, Y. Hydrogen Production Technologies Overview. J. Power Energy Eng. 2019, 7, 107–154. [Google Scholar] [CrossRef]
  39. Fuel Cell Consumption Online Calculator. Available online: https://marine-service-noord.com/en/products/alternative-fuels-and-technologies/hydrogen/how-much-hydrogen-do-i-need/ (accessed on 3 March 2024).
  40. Mathworks. Available online: https://uk.mathworks.com/help/physmod/sps/specialized-power-systems.html?s_tid=CRUX_lftnav (accessed on 15 December 2022).
  41. Ioannides, M.G.; Papadopoulos, P.J. Speed and power factor controller for AC adjustable speed drives. IEEE Trans. Energy Convers. 1991, 6, 469–475. [Google Scholar] [CrossRef]
  42. Ioannides, M.G.; Papazis, S.A.; Ioannidou, F.G. Implementation of scalar control scheme for variable frequency induction motor actuator system. Sens. Actuators A Phys. 2003, 106, 306–309. [Google Scholar] [CrossRef]
  43. Ducange, P.; Marcelloni, F.; Antonelli, M. A Novel Approach Based on Finite-State Machines with Fuzzy Transitions for Nonintrusive Home Appliance Monitoring. IEEE Trans. Ind. Inform. 2014, 10, 1185–1197. [Google Scholar] [CrossRef]
  44. Davis, J.; Reese, R.B. Finite State Machine Datapath Design, Optimization, and Implementation; Springer Nature: Cham, Switzerland, 2007. [Google Scholar] [CrossRef]
  45. Kapus-Kolar, M. Three Generalizations to a Generic Integrated Test Generation Method for Finite State Machines. Comput. J. 2009, 52, 599–625. [Google Scholar] [CrossRef]
  46. Ioannides, M.G. State space formulation and transient stability of the double output asynchronous generator. IEEE Trans. Energy Convers. 1993, 8, 732–738. [Google Scholar] [CrossRef] [PubMed]
  47. Vernados, P.G.; Katiniotis, I.M.; Ioannides, M.G. Development of an experimental investigation procedure on double fed electric machine-based actuator for wind power systems. Sens. Actuators A Phys. 2003, 106, 302–305. [Google Scholar] [CrossRef]
  48. Stamelos, A.P.; Papoutsidakis, A.; Vikentios, V.; Papazis, S.A.; Ioannides, M.G. Experimental Educational System of AC Electric Drives with Internet of Things. In Proceedings of the XXIII International Conference on Electrical Machines ICEM 2018, Alexandroupoli, Greece, 3–6 September 2018; pp. 1497–1502. [Google Scholar] [CrossRef]
  49. Ioannides, M.G.; Tegopoulos, J.A. Optimal Efficiency Slip-Power Recovery Drive. IEEE Trans. Energy Convers. 1988, 3, 342–348. [Google Scholar] [CrossRef] [PubMed]
  50. Ioannides, M.G.; Tuduce, R.; Cristea, P.-D.; Papazis, S.A. Wind power generating systems based on double output induction machine: Considerations about control techniques. In Proceedings of the 20th International Conference on Systems, Signals and Image Processing (IWSSIP 2013), Bucharest, Romania, 7–9 July 2013; pp. 103–107. [Google Scholar] [CrossRef]
  51. Ioannides, M.G.; Koukoutsis, E.B.; Stamelos, A.P.; Papazis, S.A.; Stamataki, E.E.; Papoutsidakis, A.; Vikentios, V.; Apostolakis, N.; Stamatakis, M.E. Design and operation of Internet of Things-based monitoring control system for induction machines. Energies 2023, 16, 3049. [Google Scholar] [CrossRef]
  52. Ioannides, M.G.; Stamelos, A.P.; Papazis, S.A.; Stamataki, E.E.; Stamatakis, M.E. Internet of Things-Based Control of Induction Machines: Specifics of Electric Drives and Wind Energy Conversion Systems. Energies 2024, 17, 645. [Google Scholar] [CrossRef]
  53. Zhu, Y.; Zhou, S.; Feng, Y.; Hu, Z.; Yuan, L. Influences of solar energy on the energy efficiency design index for new building ships. Int. J. Hydrog. Energy 2017, 42, 19389–19394. [Google Scholar] [CrossRef]
  54. 54Energy. Available online: https://54energy.net/collections/wind-energy (accessed on 3 March 2024).
  55. Electrolyzer. Available online: https://www.iberdrola.com/sustainability/electrolyzer (accessed on 3 March 2024).
  56. US Department of Energy, Hydrogen Program. Home | Hydrogen Program. Available online: https://www.hydrogen.energy.gov/home (accessed on 1 March 2024).
  57. Trainer, T. Some Problems in storing renewable energy. Energy Policy 2017, 110, 386–393. [Google Scholar] [CrossRef]
  58. Ioannides, M.G.; Stamelos, A.; Papazis, S.A.; Papoutsidakis, A.; Vikentios, V.; Apostolakis, N. IoT monitoring system for applications with renewable energy generation and electric drives. Renew. Energ. Power Qual. J. 2021, 19, 565–570. [Google Scholar] [CrossRef]
  59. Stamelos, A.P.; Papazis, S.A.; Papoutsidakis, A.; Ioannides, M.G.; Stamatakis, M.E.; Stamataki, E.E. Internet of Things-Based Control of Induction Machines. Encyclopedia 2024. Available online: https://encyclopedia.pub/entry/55117 (accessed on 29 February 2024).
  60. Solar Irradiance Calculations. 2023. Available online: https://re.jrc.ec.europa.eu/pvg_tools/en/tools.html (accessed on 30 June 2023).
  61. Inal, O.B.; Zincir, B.; Dere, C.; Charpentier, J.-F. Hydrogen Fuel Cell as an Electric Generator: A Case Study for a General Cargo Ship. J. Mar. Sci. Eng 2024, 12, 432. [Google Scholar] [CrossRef]
  62. Penga, J.; Vidović, T.; Radica, G.; Penga, Ž. Analysis of Hybrid Ship Machinery System with Proton Exchange Membrane Fuel Cells and Battery Pack. Appl. Sci. 2024, 14, 2878. [Google Scholar] [CrossRef]
  63. Gray, N.; McDonagh, S.; O’Shea, R.; Smyth, B.; Murphy, J.D. Decarbonizing ships, planes and trucks: An analysis of suitable low-carbon fuels for the maritime, aviation and haulage sector. Adv. Appl. Energy 2021, 1, 10008. [Google Scholar] [CrossRef]
  64. Handbook for Hydrogen-Fuelled Vessels. Available online: https://www.dnv.com/maritime/publications/handbook-forhydrogen-fuelled-vessels-download (accessed on 25 March 2024).
  65. Ngando Ebba, J.D.; Camara, M.B.; Doumbia, M.L.; Dakyo, B.; Song-Manguelle, J. Large-Scale Hydrogen Production Systems Using Marine Renewable Energies: State-of-the-Art. Energies 2024, 17, 130. [Google Scholar] [CrossRef]
Figure 1. A ship’s energy control system with EMS, TFDE, PVs, WEC units, hydrogen tanks, fuel cells, batteries, cruise demands, and other load demands.
Electronics 13 01567 g001
Figure 2. Estimated ship load demands during a 24 h period.
Electronics 13 01567 g002
Figure 3. Typical power levels generated from PVs and WEC units.
Electronics 13 01567 g003
Figure 4. Activation and deactivation of TFDE generators, fuel cell unit and battery unit according to the load demand PL. Maximum and minimum limits of operation of FC and TFDE are shown.
Electronics 13 01567 g004
Scheme 1. Flowchart of transitions from State 1 to State 4 during LNG1 ON.
Electronics 13 01567 sch001
Figure 5. Scenario 1. Ship power generation and consumption during a full day. DG1, DG2 and LNG2 are disabled. Load demands (blue), DG1 (orange), DG2 (yellow), LNG1 (purple), LNG2 (light green) and fuel cell (light blue).
Electronics 13 01567 g005
Figure 6. Scenario 2. Ship power generation and consumption during a full day. Load demands (blue), DG1 (orange), DG2 (yellow), LNG1 (purple), LNG2 (light green) and fuel cell (light blue).
Electronics 13 01567 g006
Figure 7. Scenario 3. Ship power generation and consumption during a full day. The values of LNG1 are low. Load demands (blue), DG1 (orange), DG2 (yellow), LNG1 (purple), LNG2 (light green) and fuel cell (light blue).
Electronics 13 01567 g007
Figure 8. Scenario 4. Ship power generation and consumption during a full day (24 h). Load demands (blue), DG1 (purple), DG2 (light green), LNG (light blue), PV (orange), Wind Generator (yellow) and battery (red).
Electronics 13 01567 g008
Figure 9. Scenario 4. Ship power generation and consumption during the first two hours of the day. Load demands (blue), DG1 (purple), DG2 (light green), LNG (light blue), PV (orange), Wind Generator (yellow) and battery (red).
Electronics 13 01567 g009
Figure 10. Scenario 4. (Ship power generation and consumption from 11:00 to 17:00 h. Load demand (blue), DG1 (purple), DG2 (light green), LNG (light blue), PV (orange), WEC (yellow) and battery (red).
Electronics 13 01567 g010
Table 1. Input variables to the EMS (nomenclature and role).
SymbolsInput VariablesRole in the System
PLP_DemandsPower of ship load demands (W)
PPVP_pvPower provided by PV systems (W)
PWP_windPower provided by wind generators (W)
Pd1P_diesel1_retPower provided by DG1 (TFDE) (W)
Pd2P_diesel2_retPower provided by DG2 (TFDE) (W)
Pg1P_gas3_retPower provided by LNG1 (TFDE) (W)
Pg2P_gas4_retPower provided by LNG2 (TFDE) (W)
PFCP_fc5_retPower provided by fuel cell generator (W)
Pd1maxeng1_PmaxMaximum power permitted for DG1 (TFDE) (W)
Pd2maxeng2_PmaxMaximum power permitted for DG2 (TFDE) (W)
Pg1maxeng3_PmaxMaximum power permitted for LNG1 (TFDE) (W)
Pg2maxeng4_PmaxMaximum power permitted for LNG2 (TFDE) (W)
PFCmaxEng5_PmaxMaximum power permitted for fuel cell generator (W)
SoCSOCBatteries’ state of charge (0 < SoC < 1)
Table 2. Output variables of the EMS (nomenclature and role).
SymbolsOutput VariablesRole in the System
EMSCEMS_StateEMS control state
Pd1rP_diesel1_reqPower required from DG1 (TFDE) (W)
Pd2rP_diesel2_reqPower required from DG2 (TFDE) (W)
Pg3rP_gas3_reqPower required from LNG1 (TFDE) (W)
Pg4rP_gas4_reqPower required from LNG2 (TFDE) (W)
PFCrP_fc5_reqPower required from fuel cells generator (W)
PbrPconsPower required from batteries discharged (W)
PbcPchPower offered for charging batteries (W)
PhydroP_hydroPower offered for hydrogen production (W)
PSP_spareSystem spare power (W)
Table 3. The EMS finite states and transitions.
Finite StatesConditions for Transitions between Finite StatesDescription of Finite States
1LNG1 is activated.
LNG2, DG1 and DG2 are deactivated.
0 < PL ≤ Pg1max
Battery is enabled and SOC < 0.95
EMS enters at this state when ship demands are less than power generated from LNG1 generator.
Residual power from LNG1 is supplying the batteries charging.
20 < PL ≤ Pg1max
Battery is enabled and SOC ≥ 0.95
EMS enters at this state when ship demands are less than power generated from LNG1 generator.
Residual power from LNG1 is considered spare (SOC ≥ 0.95).
30 < PL ≤ Pg1max
Battery is disabled.
FC unit is enabled.
EMS enters at this state when ship demands are less than power generated from LNG1.
Residual power from LNG1 is directed to the hydrogen production unit.
The FC unit is enabled.
40 < PL ≤ Pg1max
Battery is disabled.
FC unit is disabled.
EMS enters at this state when ship demands are less than power generated from LNG1.
Residual power is considered spare.
Batteries and FC unit are disabled.
5LNG1 and LNG2 are activated.
DG1 and DG2 are deactivated.
Pg1max ≤ PL ≤ Pg1max + Pg2max
Battery is enabled and SOC < 0.95
EMS enters at this state when ship demands are less than power generated from LNG1 and LNG2 generators
Residual power from LNG1 and LNG2 generators is supplying the batteries charging.
6Pg1max ≤ PL ≤ Pg1max + Pg2max
Battery is enabled and SOC ≥ 0.95
EMS enters at this state when ship demands are less than power generated from LNG1 and LNG2 generators.
Residual power is considered to be spare (SOC ≥ 0.95)
7Pg1max ≤ PL ≤ Pg1max + Pg2max
Battery is disabled.
FC is enabled.
EMS enters at this state when ship demands are less than power generated from LNG1 and LNG2 generators.
Residual power is supplying the hydrogen production unit.
FC unit is enabled.
8Pg1max ≤ PL ≤ Pg1max + Pg2max
Battery is disabled.
FC is disabled.
EMS enters at this state when ship demands are less than power generated from LNG1 and LNG2.
Residual power is considered spare.
Batteries and FC unit are disabled.
9FC is activated. LNG1 and LNG2 are activated.
DG1 and DG2 are deactivated.
Pg1max + Pg2max ≤ PL ≤ Pg1max + Pg2max + PFCmax
Battery is enabled and SOC < 0.95
EMS enters at this state when ship demands are less than power generated from LNG1, LNG2 and FC generators.
Power from REs is supplying the batteries charging.
10Pg1max + Pg2max ≤ PL ≤ Pg1max + Pg2max + PFCmax
Battery is enabled and SOC ≥ 0.95
EMS enters at this state when ship demands are less than power generated from LNG1 and LNG2 and FC generators.
Power from REs is considered spare.
11Pg1max + Pg2max ≤ PL ≤ Pg1max + Pg2max + PFCmax
Battery is disabled.
EMS enters at this state when ship demands are less than power generated from LNG1, LNG2 and FC generators.
Power from REs supplies the Hydrogen Production Unit
12FC is activated. LNG1, LNG2 and DG1 are activated.
DG2 is deactivated.
Pg1max + Pg2max + PFCmax ≤ PL ≤ Pg1max + Pg2max + PFCmax + Pd1max
Battery is enabled and SOC < 0.95
EMS enters at this state when ship demands are less than power generated from LNG1, LNG2, FC and DG1 generators.
Power from REs is supplying the batteries charging.
13Pg1max + Pg2max + PFCmax ≤ PL ≤ Pg1max + Pg2max + PFCmax + Pd1max
Battery is enabled and SOC ≥ 0.95
EMS enters at this state when ship demands are less than power generated from LNG1, LNG2, FC and DG1 generators.
Power from REs is considered spare.
14Pg1max + Pg2max + PFCmax ≤ PL ≤ Pg1max + Pg2max + PFCmax + Pd1max
Battery is disabled.
EMS enters at this state when ship demands are less than power generated from LNG1, LNG2, FC and DG1 generators.
Power from REs is supplying the hydrogen production unit.
15FC is activated. LNG1, LNG2, DG1 and DG2 are activated.
Pg1max + Pg2max + PFCmax + Pd1max ≤ PL ≤ Pg1max + Pg2max + PFCmax + Pd1max + Pd2max
Battery is enabled and SOC < 0.95
EMS enters at this state when ship demands are less than power generated from LNG1, LNG2, FC, DG1 and DG2 generators.
Power from REs is supplying the batteries charging.
16Pg1max + Pg2max + PFCmax + Pd1max ≤ PL ≤ Pg1max + Pg2max + PFCmax + Pd1max + Pd2max
Battery is enabled and SOC ≥ 0.95
EMS enters at this state when ship demands are less than power generated from LNG1, LNG2, FC, DG1 and DG2 generators.
Power from REs is considered spare.
17Pg1max + Pg2max + PFCmax + Pd1max ≤ PL ≤ Pg1max + Pg2max + PFCmax + Pd1max + Pd2max
Battery is disabled.
EMS enters at this state when ship demands are less than power generated from LNG1, LNG2, FC, DG1 and DG2 generators.
Power from REs is supplying the hydrogen production unit.
18FC is activated. LNG1, LNG2, DG1 and DG2 are activated.
PL > Pg1max + Pg2max + PFCmax + Pd1max + Pd2max
Battery is enabled.
EMS enters at this state when ship demands overcome power generated from all ship generators.
Power from REs is directed to battery charging.
19PL > Pg1max + Pg2max + PFCmax + Pd1max + Pd2max
Battery is disabled. FC is enabled.
EMS enters at this state when ship demands overcome power generated from all ship generators.
Power from REs is directed to the hydrogen production unit.
20PL > Pg1max + Pg2max + PFCmax + Pd1max + Pd2max
Battery and FC are disabled.
EMS enters at this state when ship demands overcome power generated from all ship generators.
Selected loads are deactivated to lower the demand.
Power from REs is considered spare.
Table 4. TFDE diesel and LNG engines’ technical data.
Engine #1: Diesel Engine Generator DG1
Fuel Efficiency5000 W/L
Efficiency Factor0.7
Maximum Power11 MW
CO2 Emission2.9 Kg/L
Engine #2: Diesel Engine Generator DG2
Fuel Efficiency6000 W/L
Efficiency Factor0.85
Maximum Power11 MW
CO2 Emission3.1 Kg/L
Engine #3: Gas Engine LNG1
Fuel Efficiency4000 W/L
Efficiency Factor0.82
Maximum Power8.5 MW
CO2 Emission1.8 Kg/L
Engine #4: Gas Engine LNG2
Fuel Efficiency4000 W/L
Efficiency Factor0.8
Maximum Power8.5 MW
CO2 Emission1.8 Kg/L
Table 5. Technical data of PV panels.
Number of Systems’ Panels500
Panel Surface14 m2
Efficiency Factor0.75
Maximum Power of PV Panel7 KW
Table 6. Technical data of wind generators WECs.
Number of Wind Generators500
Rotor Diameter1 m
Efficiency Factor0.7
Rated Power of Generator1 KW
Table 7. Technical data of the hydrogen production unit.
Fuel Efficiency39,000 W/Kg
Efficiency Factor1.0
Hydrogen Tank Mass20,000 Kg
CO2 Emission0.1 Kg/Kg
Table 8. Technical data of fuel cell (FC) generators.
Fuel Efficiency39,000 W/Kg
Efficiency Factor0.85
Maximum Power3.5 MW
CO2 Emission0.001 Kg/Kg
Table 9. Technical data of the battery storage system.
Total Charging Capacitance200,000 Ah
Charging/Discharging Interface Voltage100 V dc
Charging/Discharging Efficiency Factor0.85
Table 10. Activation (ON) and deactivation (OFF) of generating units and fuels used during the four cruise scenarios.
Generating UnitsScenario 1Scenario 2Scenario 3Scenario 4
StateFuelStateFuelStateFuelStateFuel
PVsOFF-ON-ON-ON-
WECsOFF-ON-ON-ON-
DGsONMDOONMDOONBoGONMDO
LNGsONBoGONBoGONBoGONBoG
FCsOFF-ONH2ONH2--
Table 11. Results of the four cruise scenarios: energy during 24 h and average power.
Generating Units Scenario 1Scenario 2Scenario 3Scenario 4
Energy
MWh
Average Power Energy
MWh
Average Power Energy
MWh
Average Power Energy
MWh
Average Power
MW%MW%MW%MW%
PVs00 30.161.2 30.161.2 30.161.25.73
WECs00 3.260.13 3.260.13 3.260.130.62
DGs99.843.9618.8972.672.913.8472.6719.994.9431.21.245.92
LNGs4251781.114251781.114254251781.11
FC00 22.950.914.3422.950.914.34---
Batteries Discharging00 24.160.964.5824.160.964.5845.611.828.68
Batteries Charging00 −20.76−0.81−3.86−20.76−0.81−3.86−11.21−0.43−2.05
Total
Generated
524.8420.96100.00524.0220.96100.00524.0220.96100.00524.0220.96100.00
Table 12. Results of the four cruise scenarios: fuel consumption.
Generating UnitsScenario 1Scenario 2Scenario 3Scenario 4
ValueAverage ValueValueAverage ValueValueAverage ValueValueAverage Value
DGs26.81 m31.07 m3/h20.76 m30.83 m3/h22.15 m30.88 m3/h8.92 m30.35 m3/h
LNGs131.24 m35.24 m3/h131.24 m35.24 m3/h131.24 m35.24 m3/h129.6 m35.18 m3/h
FC0 0 0.69 ton0.02 ton/h0.69 ton0.02 ton/h00
Table 13. Results of the four cruise scenarios: CO2 emissions.
Generating UnitsScenario 1Scenario 2Scenario 3Scenario 4
Value,
ton
Average ValueValue,
ton
Average ValueValue, tonAverage ValueValue, tonAverage Value
ton/h%ton/h%ton/h%ton/h%
DGs77.753.1124.7860.212.4020.2439.881.5914.3953.52.1418.66
LNGs236.249.4475.22236.249.4479.60236.249.4485.43233.39.3381.34
FC000.000.270.020.170.270.020.18000.00
Total313.9912.55100.00296.7211.86100.00276.3911.05100.00286.811.47100.00
Table 14. Reduction of fuel consumption by switching the scenarios.
Generating UnitsReduction of Fuel Consumption (%)
Scenario 1→2Scenario 2→3Scenario 3→4
DGs−22.57%+6.7%−59.73%
LNGs0%0%−1.25%
FC100%0%-
Table 15. Reduction of CO2 emissions by switching the scenarios.
Generating UnitsReduction of CO2 Emissions (%)
Scenario 1→2Scenario 2→3Scenario 3→4
DGs−22.57%−33.77%33.65%
LNGs0%0%−1.25%
FC100%0%-
Disclaimer/Publisher’s Note: The statements, opinions and data contained in all publications are solely those of the individual author(s) and contributor(s) and not of MDPI and/or the editor(s). MDPI and/or the editor(s) disclaim responsibility for any injury to people or property resulting from any ideas, methods, instructions or products referred to in the content.

