
The Comminution of Chert Gravel by Microwave Irradiation


Civil Engineering Department, Sami Shamoon College of Engineering, Jabotinsky 84, Ashdod 77245, Israel
*
Author to whom correspondence should be addressed.
Resources 2024, 13(5), 63; https://0-doi-org.brum.beds.ac.uk/10.3390/resources13050063
Submission received: 12 January 2024
/
Revised: 15 April 2024
/
Accepted: 24 April 2024
/
Published: 26 April 2024
Abstract
:Chert, a by-product rock of sand quarrying, has historically posed economic challenges for aggregate production, resulting in significant “waste” accumulation in quarries. Our study investigates the effect of microwave irradiation on the mechanical properties of chert gravel, a mineralogically homogenous material composed of fine quartz grains. The results, which demonstrate that increased irradiation time leads to a substantial decrease in chert gravel strength (by a factor of 4–6 for 2.5 min of irradiation), underscore the potential impact of this research on comminution processes. With quenching altering the fractional content of the samples after the crushing test, reducing the Gravel-to-Sand ratio, this study is driven by the promising potential of crushed chert gravel as a pivotal aggregate within the concrete and asphalt industries, offering a practical solution to their material needs. The urgent need to rehabilitate previously utilized quarry areas, offering an environmentally beneficial solution for which we all should be responsible, motivated the present study.
1. Introduction
1.1. The State of the Art
It is widely recognized that comminution processes, encompassing crushing and grinding, represent the most energy-intensive procedures, constituting over fifty percent of the total energy consumption in mineral industries [1]. Reviewing various ore pre-treatment methods such as thermal, chemical, electric, magnetic, ultrasonic, and bio-milling, microwave irradiation stands out for its significant energy savings and improved comminution efficiency [1,2,3,4].
Recent advancements in microwave heating have piqued researchers’ interest. This process provides an environmentally friendly and cost-efficient means of enhancing manufacturing quality. By exploring the microwave heating process, materials, and parameters, its superiority over traditional methods has been demonstrated [5]. For example, microwave heating provides a notable advantage: uniform and selective heating, a rarity in conventional methods [6,7,8]. Notably, it facilitates expedited heating rates attributable to the lack of direct physical contact between the heating source and the material undergoing heating, concurrently diminishing both time and energy expenditure, which is extremely important because it is environmentally friendly [5,9]. The data presented in [10] highlight the prospective use of microwave energy in various mineral treatment and metal recovery procedures, including heating, drying, grinding, leaching, roasting, smelting, carbothermic reduction of oxide minerals, pre-treatment of refractory gold concentrate or ore, spent carbon regeneration, and waste management. It has been established that beyond a certain threshold, power density has a minimal impact on irradiation time and energy consumption [11]. It was noted that larger crystals demand less time and energy for significant alterations in the mineral state [12]. This result is consistent with that of a validated numerical study [13], where it was observed that ores characterized by a larger average grain diameter can achieve greater energy efficiency. It is also aligned with those of [14], who showed that the breakage function depended on the particle size and that the grindability increased significantly due to microwave pre-treatment. The polarization of minerals exposed to microwaves causes a rise in internal friction, noticeable through the increase in temperatures [15,16], leading to a difference in thermal expansion among different minerals and the formation of cracks. It was shown that the rock degradation effect is achieved when the temperature range on the rock surface is 50–600 °C (with most rocks in the range of 100–300 °C) [17,18]. It was suggested that fractures form along the boundaries between grains, which can enhance mineral liberation [19,20].
Minerals are categorized into three primary responses to microwaves based on their affinity for microwave absorption: (1) low-loss materials permit microwaves to pass through without being absorbed; (2) no-loss materials reflect microwaves with minimal energy absorption; (3) high-loss materials, typically dielectrics, fully absorb microwaves [5,21]. The extent of a substance’s energy absorption is dictated by its dielectric losses. When exposed to alternating electric fields, polarized materials release thermal energy, elucidating the intricate relationship between dielectric properties and energy transfer mechanisms in microwave heating processes. It was noted that quartz shows a weak response to microwave irradiation [22,23]. Examining microcrack growth in galena and calcite ore particles under microwave irradiation indicated that mineral shape predominantly impacts microcrack quantity but not their growth behavior [24]. Numerous studies have explored the effect of temperature increase on rock properties [11,12,22], including static and dynamic mechanical properties, e.g., strength, elastic modulus, elastic wave velocity [25,26,27,28,29,30,31,32,33,34], fracture toughness, porosity, and micro-fracturing [34,35,36,37,38,39,40]. Studies on basalt revealed significant microcrack differences based on power levels and distances from the antenna, with longer exposures leading to more severe cracks [41]. Subjecting granite samples to microwave treatment significantly reduced the peak and average cutting forces (~10% reduction in average cutting force from untreated to irradiated parts) [42]. It was demonstrated that the resulting temperature and stress level vary strongly depending on the input microwave irradiation parameters [43]. Extensive laboratory experiments [44] performed with three types of rocks (norite, granite, and basalt) showed that tensile and uniaxial compressive strengths experienced a reduction with prolonged exposure time and higher power levels of microwave irradiation. It was demonstrated that stress and damage increased with higher power density, resulting in lower sample strength, while reducing exposure time (for a given energy input) leads to more significant strength reductions [8,11]. This conclusion is consistent with the results presented in [45], where it was shown that the tensile strength of granite and cement mortar decreased in proportion to the duration of microwave pre-treatment. Additionally, under the same irradiation conditions, samples with a higher compressive-to-tensile-strength ratio exhibited greater temperatures and, hence, more damage [46]. Moreover, it was noted that the uniaxial compressive strength, Brazilian tensile strength, and point load strength decreased with prolonged microwave irradiation time, with the decrease rate positively correlated to the power level. In addition, the reduction in mechanical strength for a specific power level was shown to be similar to a linear relationship with irradiation time [20].
All the above-noted studies were conducted on a laboratory scale. The only successful study that presented a scale-pilot assemblage capable of working with a productivity of up to 150 t/h was described in [47,48]. Their results indicated that comminution advantages could be achieved at irradiation doses lower than previously assumed. This allows high throughput with low irradiation power and paves the way for further use of microwave ore processing.
The analysis of the present state of the art shows that irradiation’s effect on quartz’s properties has been studied in single-grained quartz or in cases where the quartz grains were surrounded by a matrix of other minerals (e.g., in the case of granite rock). The response of single-grain quartz to irradiation was much lower than that of different minerals. In the case of the multimineral matrix, the focus was on minerals that showed a significant response to the applied irradiation. Therefore, the present paper delineates the features of multi-grain quartz rock (chert)’s reaction to microwave irradiation.
1.2. Geological Setup and Occurrence of Chert Gravel
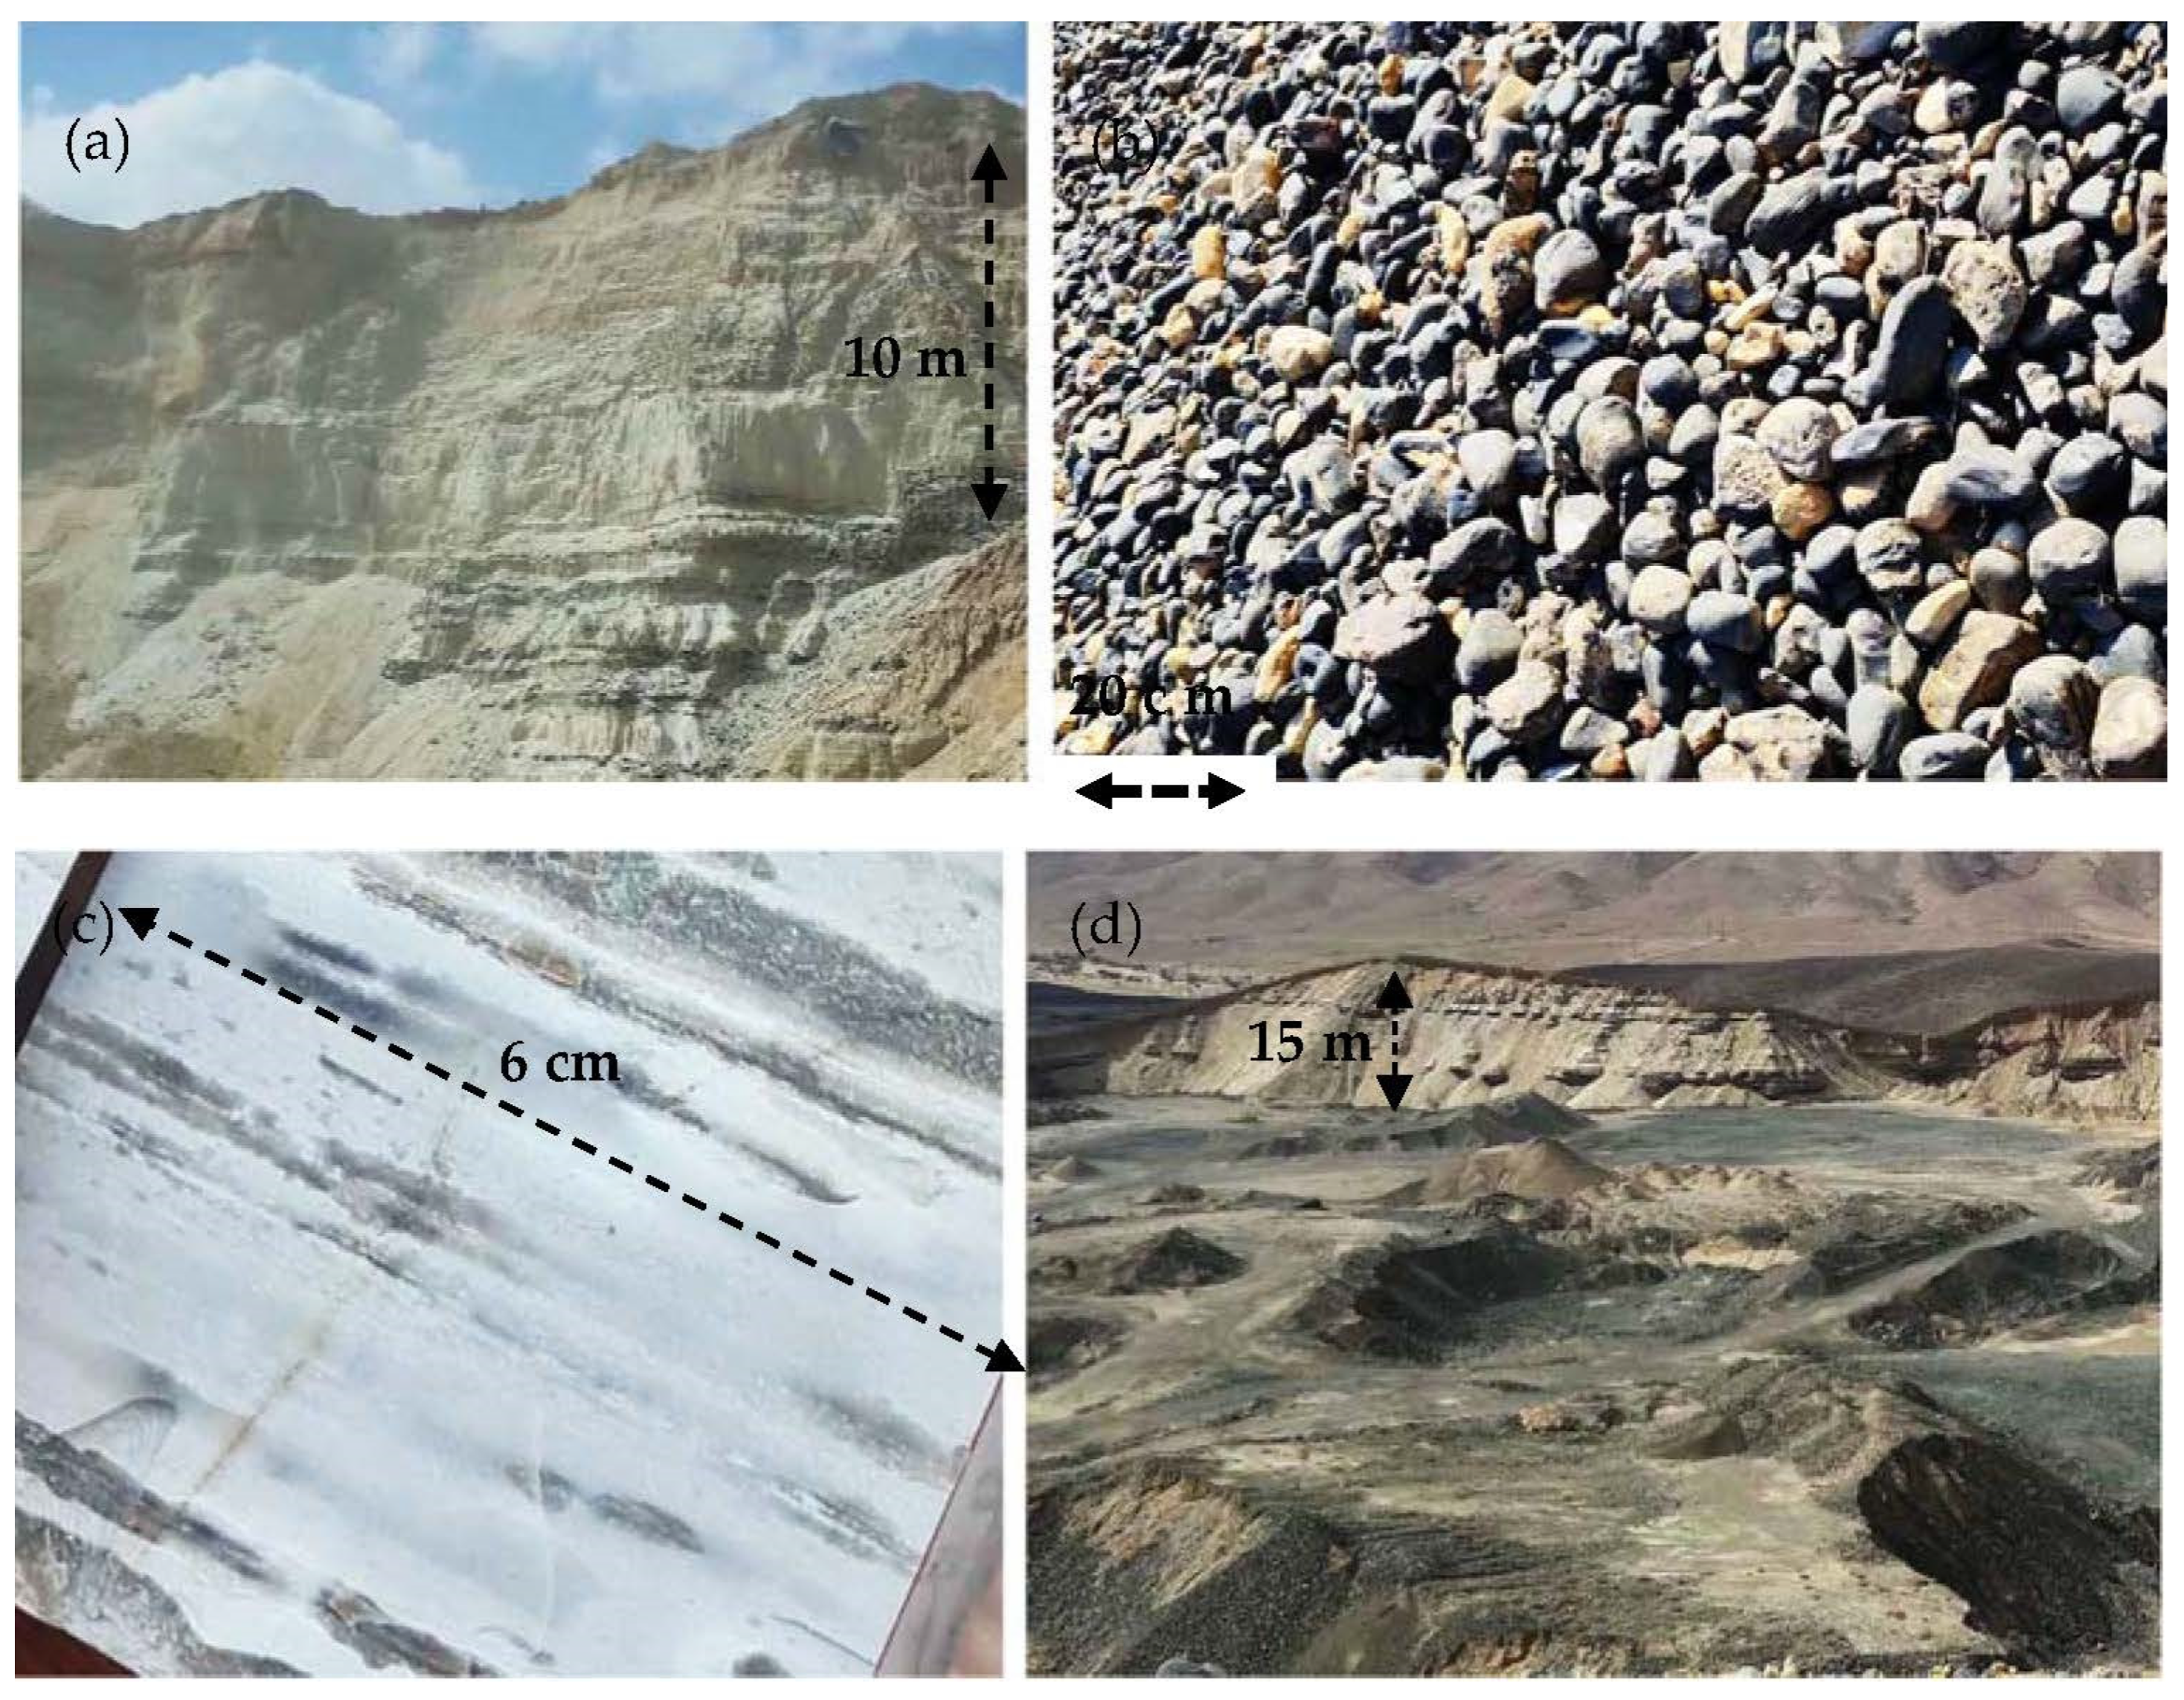
The sand deposits in the Rotem Plain are the largest and most stable natural source of sand for the needs of Israel’s construction and paving industry in recent years. The rock in the region belongs to the Rotem Formation of the Hazeva group from the Miocene stage. The overall thickness of the Rotem Formation reaches 1100 m [49,50,51,52], while the sand deposit is up to 70 m. Figure 1 shows the fragment of the geological map of the region [53], where the zone of sand quarries is marked in green. Based on visual assessment, the average content of chert gravel in the sand deposit is around 40% of the quarry volume [51]. It appears in layers 0.2 m to 1 m thick or randomly distributed within the geological section of sand (Figure 2a). The chert gravel in the region is mainly “imported chert” [50]. It is mineralogically relatively homogenous and consists of fine quartz grains [54] occasionally coated with white carbonate material. The gravel typically ranges from 5 cm to 20 cm (Figure 2b) and is characterized by a dark, stripped appearance (Figure 2c) and high abrasiveness.
Attempts to use ordinary technologies for aggregate production from chert have been economically unsuccessful, resulting in significant chert “waste” accumulation estimated at 20 million tons, the reserves covering vast quarry areas (Figure 2d).
2. Methods
2.1. Heating and Sample Types
Chert gravel samples were exposed to microwave radiation from a microwave oven (Model EM823A2GU-6563, Midea Group, Beijiaozhen, Foshan, China) operating at a frequency of 2.45 GHz and a maximum power of 900 W. Microwave treatment durations included 1, 1.5, 2, and 2.5 min, under the following specified conditions:
A. Dried samples were heated followed by cooling at room temperature;
B. Same as in A. except the samples were additionally quenched (hereafter “shock” for simplicity) by immersing the sample in water (at room temperature) just after removing it from the microwave oven;
C. Same as in A, but the sample surface was wet before the irradiation application;
D. Same as in B, the sample surface was wet before the irradiation application.
The weight of each sample varied between 130 and 150 g, with a maximum sample size of 50 mm. Figure 3 shows a gravel sample after the irradiation procedure.
2.2. Strength Assessment
Point load tests comprehensively described in [55] were carried out to estimate the corresponding index strength of the samples with uneven shapes. The observations were conducted using the MATEST instrument (Figure 4a). The point load strength index ‘Is’ is generally used for the strength characterization of samples with irregular shapes (Figure 4b). It was calculated according to [56] as follows:
where ‘Is’ is the point load strength index (MPa), P is the point load force that causes the sample failure (kN), and D is the sample thickness in the direction of load application (in mm). To adjust the value of the point load strength index to the values of samples with a standard thickness (diameter) (50 mm), the following expression is used [56]:
where is the point load strength index (MPa) for the sample of standard thickness (50 mm).
2.3. Crushing Test
A typical crushing study was carried out to understand microwave irradiation’s effect on the fragmentation of chert gravel (BRITISH STANDARD 812-112, 1990). After the samples cooled (Section 2.1, A–D), they were placed into a steel cylinder (Figure 5a) and loaded using a steel plunger. The cylinder, plunger, and base plate were made of special alloy steel with a hardness of 650 (HV) (57.8 HRC) and protected against corrosion. The cylinder’s internal diameter was 150 (mm), height was 130 (mm), and weight was 16.5 (kg) (48-D0510). The loading was conducted using the Matest compression machine (MATEST S.P.A TREVOLO 24048) at a rate of 0.05 (mm/s) up to the maximum applied force of 300 (kN) using strain control. Figure 5b shows the assemblage for the crushing inside the compression machine. Based on our initial findings, when the sample deformed excessively, surpassing 40% of its original height, it resulted in a significant level of fragmentation, reaching approximately 80% of the fine sand fraction, particularly noticeable in the upper portion of the sample. This fine fraction formed a compacted layer at the sample’s top, inhibiting the crushing of the aggregate beneath it. Therefore, each experiment terminated when the sample’s deformation reached 40% of its original height.
2.4. Sieving Test
After the crushing test, the aggregate samples were graded based on the Unified Soil Classification System (USCS) method. The USCS system categorizes all soils and aggregates into four primary groups (gravel, sand, mud, and clay) and their combinations based on particle distribution, particle percentage, plasticity properties, and other parameters. Mineral aggregates used in asphalt and concrete mixes are classified as coarse or fine. For instance, index GW means well-graded gravel, a coarse-aggregate example, while index SW means well-graded sand, which belongs to a fine aggregate. The set of sieves used for the observation conforms to the American current ISO 3310-1:2016 [57] and ISO 565:1990 [58] standards, namely, 25 mm, 19 mm, 12.5 mm, 9.5 mm, 4.75 mm, 2.36 mm, 1.18 mm, 600 µm, 300 µm, 150 µm, and 75 µm.
3. Results
3.1. Results of Temperature Measurements
Figure 6 shows the temperature measurement results at the end of irradiation employment as a function of time. Table 1 presents the results in table form.
The temperature difference (between sets A and D) appears negligible within 1–1.5 min. However, over an irradiation time of 1.5–2 min, the slope of the “wet” curves noticeably decreases, becoming less than that of the “dry” curves. Such changes cause the final temperature for “wet” curves to be lower than for “dry” curves by approximately 15–20 °C. The consistency of the results in both pairs of data sets, A–B for “dry” conditions and C–D for “wet” conditions, is noteworthy.
3.2. Results of the Crushing Test
Figure 7 shows typical load–deformation curves of gravel under the standard crushing condition. All curves are characterized by two main parts: a. the applied load is 0–150 kN; b. the applied load ranges from 150 to 300 kN. Stage “a” is characterized by load drops and a low slope of curves, while the curves at stage “b” are smoother than at stage “a”, and their slope is higher. Our preliminary study showed that 150 kN is the load needed for course gravel crushing, beyond which there are no unfractured coarse gravel pieces within the loading steel cylinder (Section 2.3). Moreover, this load range corresponds to the values of gravel strength observed in our previous study by the uniaxial compression and Schmidt hammer methods [54]. Our analysis showed that an increase in load above 150 kN causes a decrease in gravel size and increases the percentage of the sand fraction (0.075–4.75 mm).
The application of the quenching procedure caused the crushing of gravels under less final deformation and with a significant deformation gradient, especially when the dry surface gravel was irradiated and then quenched (orange curves in Figure 7, Type B samples—Section 2.3). The load–deformation curves for type D samples (yellow curves in Figure 7, the wet-surface samples processed by irradiation and quenching) are close to or below the orange ones for all irradiation times under a load higher than 100–150 MPa. The yellow-type curves under a load higher than 150 MPa are higher than those for samples not quenched. A load below 100–150 MPa corresponds to gravel’s preliminary or initial fracturing. Beyond this load level, the deformation curves for all studied samples are much smoother than below it (lack of significant stress drops), meaning no extensive fractures are created. Note the absence of orange and yellow curves (B- and D-type samples) below the curves of unquenched samples at a load of more than 150 MPa. Under a load below 150 MPa, the difference between the orange and yellow curves is probably due to partial lubrication of sample surfaces (in the case of D-type samples) by a water film at the wet surface. It is seen that the blue and purple curves (A- and C-type samples, to which the quenching procedure was not applied) are below the orange and yellow curves for all irradiation times when the load level is higher than 150 MPa.
The analysis of sample deformation shows that the quenching application fundamentally affects the deformation behavior, significantly decreasing the final deformation values of the crushing test. Deformation energy (the area under the curve of deformation) is minor for the A-type samples (the orange curve). The effect of wet surfaces before irradiation application is insignificant.
Figure 8 presents the measurement results of the point load strength index versus the microwave irradiation time.
Table 2 presents the values of the point load strength index in table form.
An analysis of Figure 8 and Table 2 shows that after 1 min of microwave irradiation of dry chert gravel, the value of the point load strength index is lower than that of the sample to which irradiation was not applied (Is(50) = 12.5 MPa [38]). At the same time, it is more significant for dry samples than for the corresponding samples with a wet surface. An increase in irradiation time (from 1 to 2.5 min) causes a substantial decrease in the strength of gravel by 1.3–2.13 times. Note that the strength of samples after the quenching procedure is 1.45–1.75 times lower than that of samples to which the quenching was not applied. In addition, the strength index of dry samples after irradiation is higher than that of the samples whose surface was wet before irradiation.
3.3. Results of the Sieve Analysis
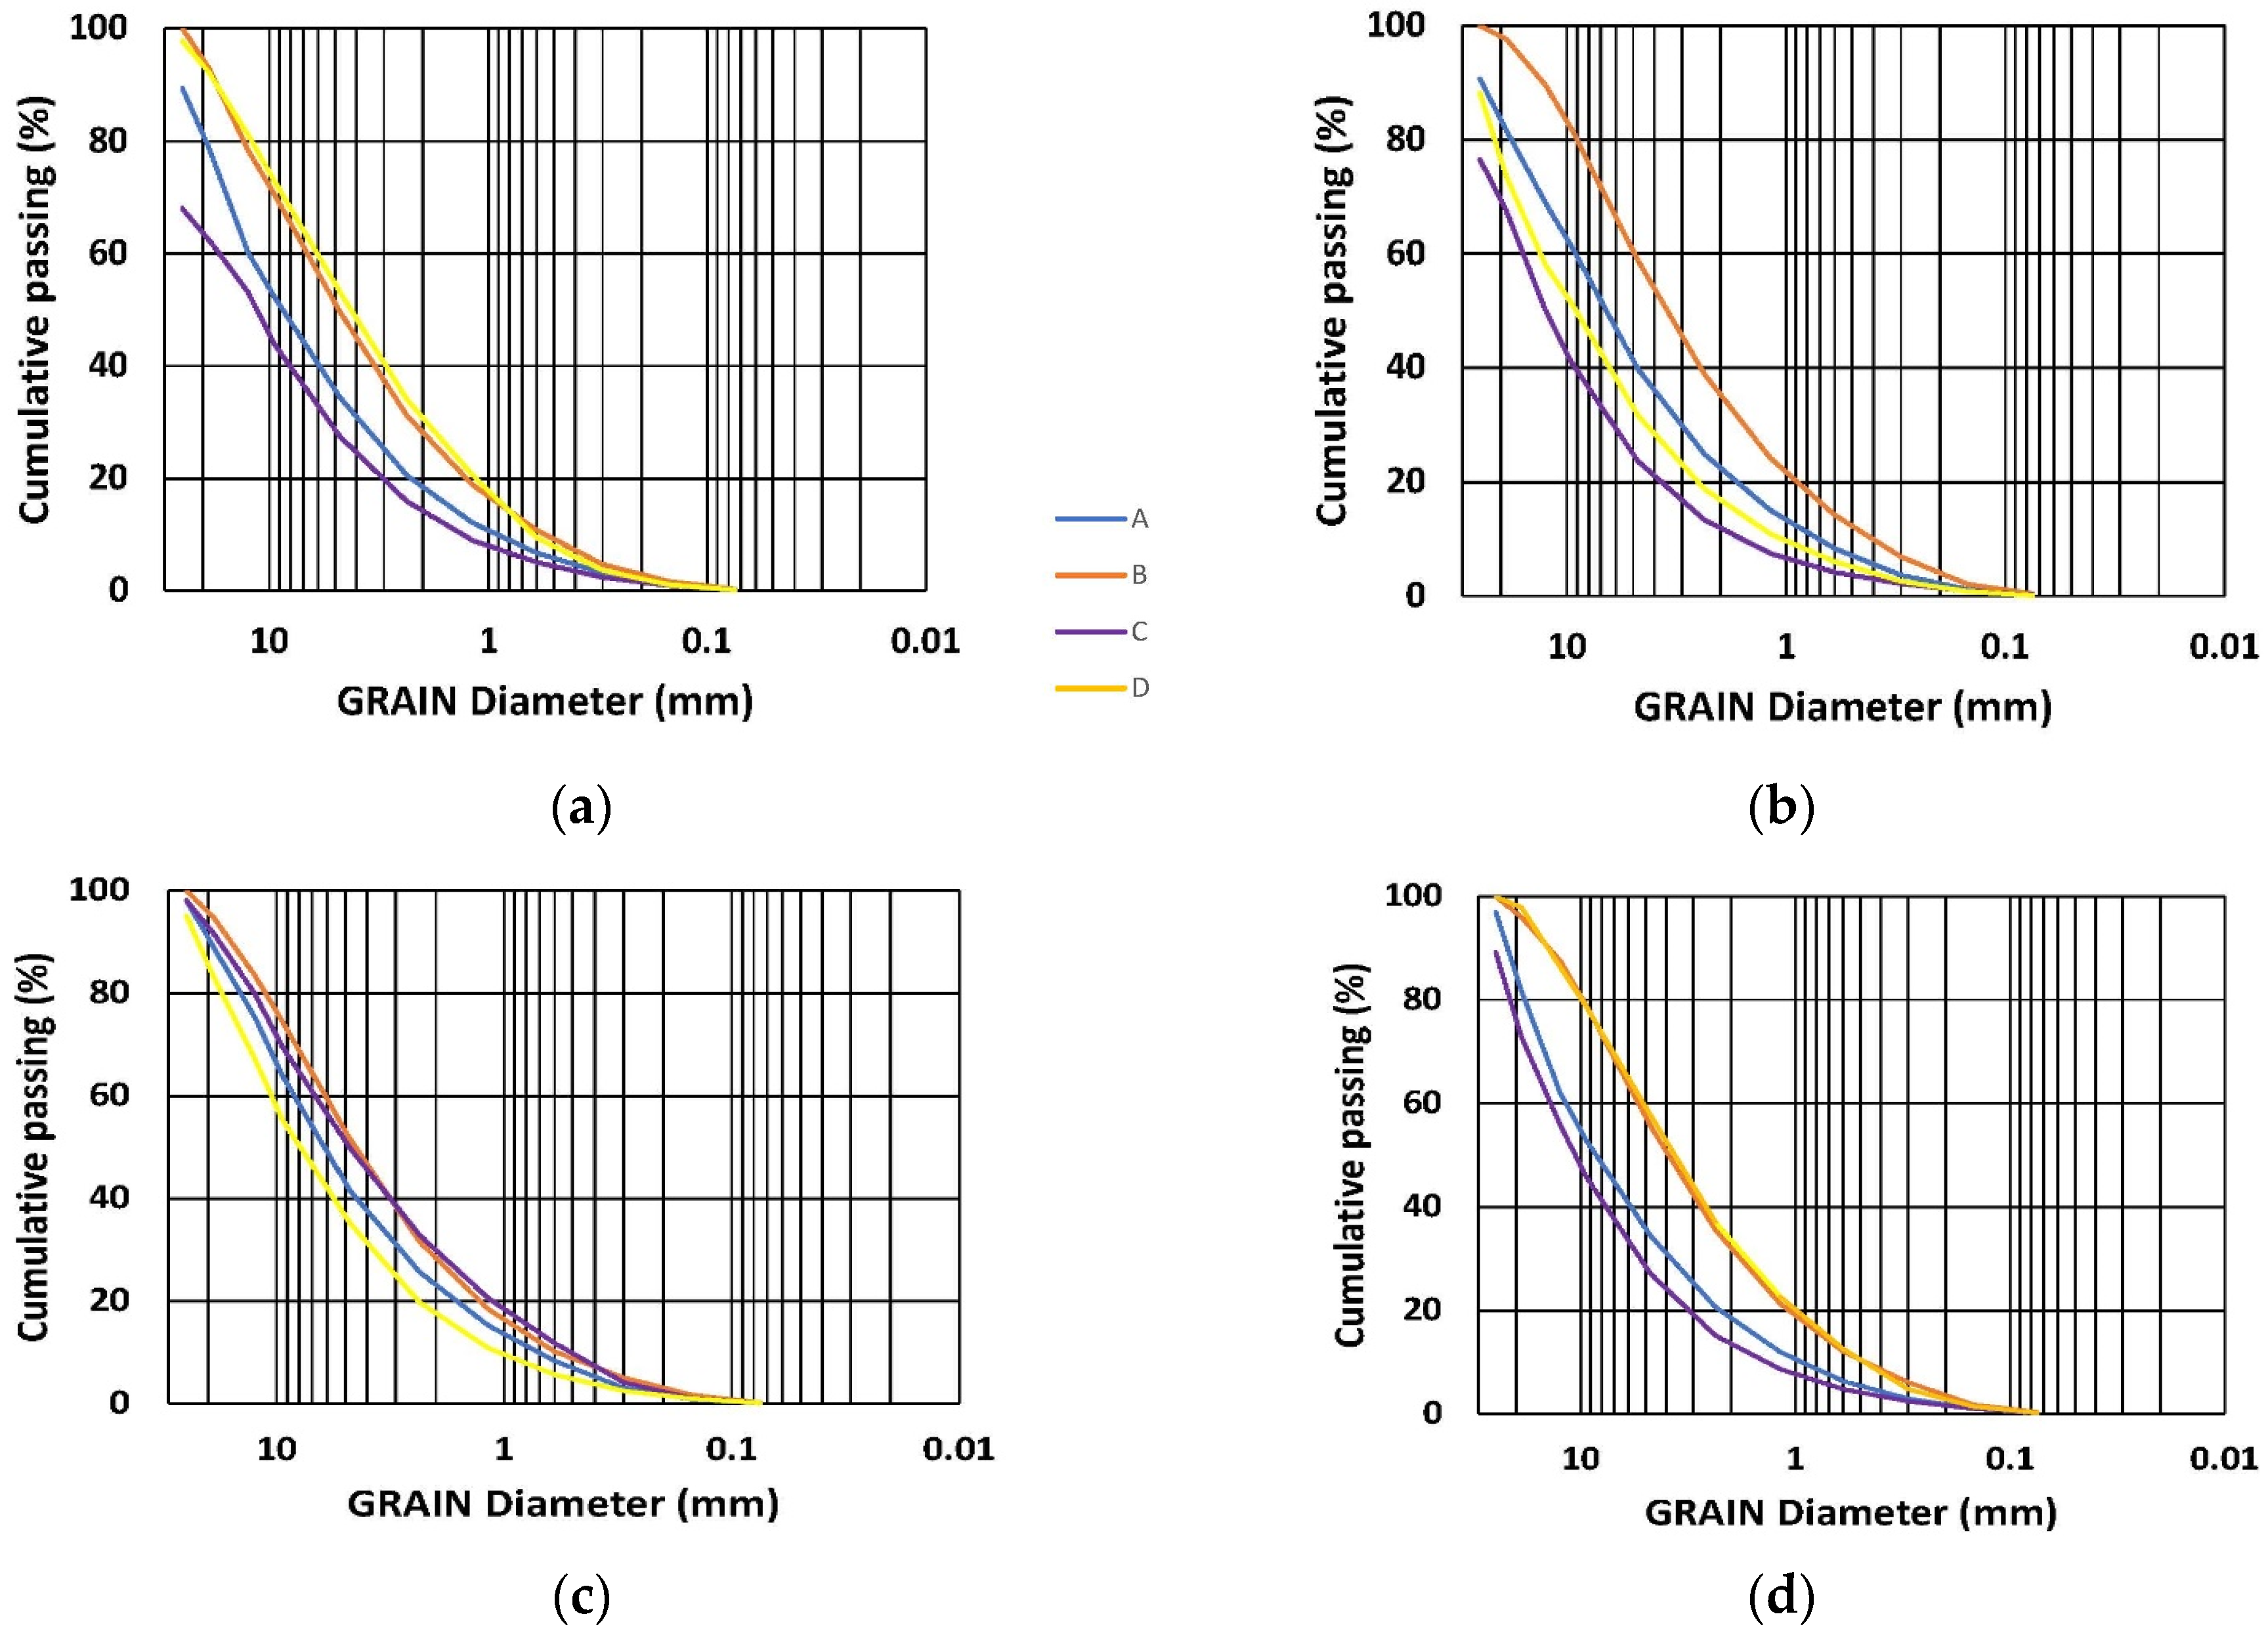
Figure 9 shows a series of grain distribution curves. Table 3 shows the quantitative grain distribution of the crushing test results.
Based on the information/data shown in Figure 9 and Table 3, the following should be emphasized here:
A-type samples: A comparison of the grain size ratio between the A-type samples and the samples to which irradiation was not applied shows that the minimal irradiation dose (1 min) significantly changed the Gravel/Sand (G/S) ratio from about 3 to about 2. The decrease in the relative percentage of the coarsest fraction is worth noting, from about 30% to about 20%. An increase in irradiation time from 1 to 2.5 min does not affect the value of the G/S ratio or the relative percentage of three fractions within the gravel category. The UCSC index for the entire irradiation range is unchangeable—GW and is the same as for the non-irradiated samples.
B-type samples: It is seen that the G/S ratio is ~1 (a factor of 2 below that of the samples to which quenching was not applied: A-type). Note the decrease in the percentage of the coarsest gravel fraction and the increase in the finest gravel fraction. The increase in the irradiation time (from 1 to 2.5 min) does not change this result. In comparison with the A-type results, it can be seen that the effect of quenching is much more essential than the effect of an increase in the irradiation time. The UCSC index for the entire irradiation range is GW or SW, while both fractions’ percentages are similar.
C-type samples: The G/S ratio is ~3, and the relative percentage of three gravel fractions is similar to the results observed for the samples to which the radiation was not applied. This result indicates that an essential part of the irradiation energy was lost when the samples’ surface was dried. Note the decrease in the percentage of the coarsest gravel fractions and the increase in the finest gravel fraction. The increase in the irradiation time (from 1 min to 2.5 min) essentially does not change this result. In comparison with the A-type results, it can be seen that quenching is much more essential than the effect of the increase in irradiation time. The UCSC index for the entire irradiation range is unchangeable—GW is the same as for the non-irradiated samples.
D-type samples: The G/S ratio is ~1–2, and the relative percentage of three gravel fractions varies from the range of A-, B-, and C-type samples. A variation in grain size distribution was noted for the C-type samples, implying ambiguity in the irradiation effect and instability in crushing test results. The UCSC index for the entire irradiation range is GW or SW.
4. Discussion
The analysis of the experiments’ results shows that despite quartz’s weak response to microwave irradiation noted in [11,22,23], this method can significantly weaken chert gravel (Table 2). The mean temperature on the sample surface (Table 1) aligns with the values presented in [17,18] for a significant number of rocks.
Dipolar polarization, ionic conduction, and interfacial polarization are essential mechanisms driving the temperature rise in dielectric materials, including rocks [5]. When exposed to an alternating electric field, material polarization releases thermal energy, and when it reaches a specific limit, it induces microcracks. However, since quartz grains’ response to microwave irradiation is weak, the considerable decrease in their strength cannot be explained by the appearance of thermal stress alone.
It can be assumed that the piezoelectric properties of the quartz grains accidentally oriented in the chert matrix can affect the damage process. Let us consider a specific calculation as an example to assess the frequency of vibrations induced by microwave radiation. Our previous study [54] shows that the grain size of chert grains is less than 1–10 µm (5 µm in average). The primary vibration mode is identified by the grain size being half the wavelength λ ≈ 2.5 µm. The speed of sound in quartz is c = 5800 m/s. From this, we can calculate the frequency f = c/λ ≈ 2.3 GHz. This value is very close to the microwave frequency applied to the samples and causes the resonance deformation of accidentally oriented quartz grains. The presence of element impurities (Ca, Ba, S, and F) in the chert matrix appears negligible, accounting for less than 1% [54]. Hence, their effect on the matrix disintegration seems to be minor.
Examining the behavior of sample deformation reveals that the quenching process fundamentally impacts deformation behavior, leading to a notable reduction in the final deformation values during the crushing test. Specifically, the deformation energy, represented by the area under the deformation curve, is the lowest for the B-type samples (illustrated by the orange curve—Figure 8). This finding agrees with the findings discussed in [59,60,61], highlighting the significant impact of the quenching cooling process on strength and elastic properties. Namely, the thermal stress induced by the temperature disparity between the rock and the coolant widens existing cracks, initiates new ones, and damages the rock’s internal structure. An analysis of Table 3 shows that the utilization of quenching causes a significant increase in the number of cracks and, hence, a rise in the sand fraction (a decrease in the Gravel-to-Sand ratio) due to the crushing test.
Wetting the samples’ surface before irradiation does not cause significant changes in the irradiation or quenching results. This is consistent with our previous observation [50], which demonstrated that the values of chert porosity and water absorption are meager (0.34% and 0.13%, respectively).
5. Conclusions
Our results show that an increase in irradiation time decreases the strength of chert gravel, which is similar to previous results, e.g., [8,11,20,42,43,44].
After the irradiation test, the quenching application changed the fractional content of the crushed samples, decreasing the Gravel-to-Sand ratio.
The present study used relatively small specimens of chert gravel (130–150 g, with a maximum sample size of ≤50 mm). Future investigations will be devoted to studying the effect of irradiation on samples of bigger sizes and masses.
Due to its abrasive nature, chert gravel is often overlooked in the concrete and asphalt industry, causing machinery wear. Yet, its high density, low water absorption, and cost-effectiveness, stemming from sand quarrying by-products, offer promise. This study showcases microwave irradiation as a breakthrough for gravel comminution, potentially integrating it into industry and geotechnical engineering. Future research will focus on effective gravel fracturing methods and assessing the resulting aggregate’s suitability for concrete and asphalt, emphasizing sustainable practices and land use remediation. Embracing crushed chert gravel meets industry needs and aids in the environmentally beneficial repurposing of sand quarrying waste and former quarry sites.
Author Contributions
Conceptualization, M.T. and V.F.; methodology, M.T. and V.F.; software, M.T.; validation, M.T. and V.F.; formal analysis, M.T.; investigation, M.T. and V.F.; resources, V.F.; data curation, V.F.; writing—original draft preparation, M.T. and V.F.; writing—review and editing, V.F.; visualization, M.T.; supervision, V.F.; project administration, V.F. All authors have read and agreed to the published version of the manuscript.
Funding
This research was funded by the Ministry of Energy of Israel, grant number 3-18116/221-17-21. V.F. acknowledges the support from the European Union’s Horizon 2020 research and innovation program under the Marie Sklodowska-Curie RISE project EffectFact, grant agreement no. 101008140.
Data Availability Statement
All data generated and analyzed during this study are included in the article.
Conflicts of Interest
The authors declare no conflicts of interest.
References
- Somani, A.; Nandi, T.K.; Pal, S.K.; Majumder, A.K. Pre-treatment of rocks prior to comminution—A critical review of present practices. Int. J. Min. Sci. Technol. 2017, 27, 339–348. [Google Scholar] [CrossRef]
- Adewuyi, S.; Ahmed, H. Methods of Ore Pretreatment for Comminution Energy Reduction. Minerals 2020, 10, 423. [Google Scholar] [CrossRef]
- Jones, D.A.; Kingman, S.W.; Whittles, D.N.; Lowndes, I.S. The influence of microwave energy delivery method on strength reduction in ore samples. Chem. Eng. Process. 2007, 46, 291–299. [Google Scholar] [CrossRef]
- Bradshaw, S.; Louw, W.; van der Merwe, C.; Reader, H.; Kingman, S.; Celuch, M.; Kijewska, W. Techno-Economic Considerations in the Commercial Microwave Processing of Mineral Ores. J. Microw. Power Electromagn. Energy 2005, 40, 228–240. [Google Scholar] [CrossRef] [PubMed]
- Zhang, S.; Qiu, Q.; Zeng, C.; Paik, K.-W.; He, P.; Zhang, S. A review on the heating mechanism, materials and heating parameters of microwave hybrid heated joining technique. J. Manuf. Process. 2024, 116, 176–191. [Google Scholar] [CrossRef]
- Zhang, S.; Zhou, H.; Ding, T.; Long, W.; Zhong, S.; Paik, K.-W.; He, P.; Zhang, S. Impact of embedded susceptor mass and exposure time on morphological and property alterations in SAC305 joints using microwave hybrid heating. Mater. Lett. 2024, 357, 135736. [Google Scholar] [CrossRef]
- Zhang, S.; Zhou, H.; Ding, T.; Long, W.; Zhong, S.; Paik, K.-W.; He, P.; Zhang, S. Effect of microwave hybrid susceptors on the interface morphology, mechanical properties and fracture morphology of Cu/nano-Sn-3.0Ag-0.5Cu/Cu joints. J. Mater. Res. Technol. 2024, 28, 1743–1751. [Google Scholar] [CrossRef]
- Zhang, S.; Zhang, S.; Zhou, H.; Paik, K.-W.; Ding, T.; Long, W.; Zhong, S.; He, P. Preparation and characterization of Sn-3.0Ag-0.5Cu nano-solder paste and assessment of the reliability of joints fabricated by microwave hybrid heating. Mater. Charact. 2024, 207, 113512. [Google Scholar] [CrossRef]
- Lovas, M.; Znamenáčková, I.; Zubrik, A.; Kováčová, M.; Dolinská, S. The Application of Microwave Energy in Mineral Processing—A Review. Acta Montan. Slovaca 2011, 16, 137–148. [Google Scholar]
- Koleini, S.M.J.; Barani, K. Microwave Heating Applications in Mineral Processing. In The Development and Application of Microwave Heating; InTech: Houston, TX, USA, 2012; ch4; pp. 79–104. [Google Scholar] [CrossRef]
- Bai, G.; Sun, Q.; Jia, H.; Ge, Z.; Tang, L.; Xue, S. Mechanical responses of igneous rocks to microwave irradiation: A review. Acta Geophys. 2022, 70, 1183–1192. [Google Scholar] [CrossRef]
- Qin, L.; Dai, J. Meso-mechanics simulation analysis of microwave-assisted mineral liberation. Frat. Integrità Strutt. 2015, 34, 543–553. [Google Scholar] [CrossRef]
- Shadi, A.; Samea, P.; Rabiei, M.; Ghoreishi-Madiseh, S.A. Energy Efficiency of Microwave-Induced Heating of Crushed Rocks/Ores. Minerals 2023, 13, 924. [Google Scholar] [CrossRef]
- Kumar, P.; Sahoo, B.K.; De, S.; Kar, D.D.; Chakraborty, S.; Meikap, B.C. Iron ore grindability improvement by microwave pre-treatment. J. Ind. Eng. Chem. 2010, 16, 805–812. [Google Scholar] [CrossRef]
- Li, Q.; Li, X.; Yin, T. Effect of microwave heating on fracture behavior of granite: An experimental investigation. Eng. Fract. Mech. 2021, 250, 107758. [Google Scholar] [CrossRef]
- Kafashi, S.; Kuhar, L.; Bóna, A.; Nikoloski, A.N. Review of Fracturing Techniques (Microwaves, High-Voltage Pulses, and Cryogenic Fluids) for Application as Access Creation Method in Low-Permeability Hard Rocks for Potential in situ Metal Recovery. Miner. Process. Extr. Metall. Rev. 2023, 1–16. [Google Scholar] [CrossRef]
- Adewuyi, S.; Ahmed, H. Grinding Behavior of Microwave-Irradiated Mining Waste. Energies 2021, 14, 3991. [Google Scholar] [CrossRef]
- Zheng, Y.L.; Ma, Z.J.; Yang, S.Q.; Zhao, X.B.; He, L.; Li, J.C. A microwave fracturability index (MFI) of hard igneous rocks. Int. J. Rock Mech. Min. Sci. 2021, 138, 104566. [Google Scholar] [CrossRef]
- Xu, T.; Yuan, Y.; Heap, M.J.; Zhou, G.-L.; Perer, M.S.A.; Ranjith, P.G. Microwave-assisted damage and fracturing of hard rocks and its implications for effective mineral resources recovery. Miner. Eng. 2021, 160, 106663. [Google Scholar] [CrossRef]
- Lu, G.M.; Feng, X.-T.; Li, Y.-H.; Hassani, F.; Zhang, X. Experimental Investigation on the Effects of Microwave Treatment on Basalt Heating, Mechanical Strength, and Fragmentation. Rock Mech. Rock Eng. 2019, 52, 2535–2549. [Google Scholar] [CrossRef]
- Wei, W.; Shao, Z.; Zhang, Y.; Qiao, R.; Gao, J. Fundamentals and applications of microwave energy in rock and concrete processing—A review. Appl. Therm. Eng. 2019, 157, 113751. [Google Scholar] [CrossRef]
- Zheng, Y.L.; Zhao, X.B.; Zhao, Q.H.; Li, J.C.; Zhang, Q.B. Dielectric properties of hard rock minerals and implications for microwave-assisted rock fracturing. Geomech. Geophys. Geo-Energy Geo-Resour. 2020, 6, 22. [Google Scholar] [CrossRef]
- Gao, F.; Shao, Y.; Zhou, K. Analysis of Microwave Thermal Stress Fracture Characteristics and Size Effect of Sandstone under Microwave Heating. Energies 2020, 13, 3614. [Google Scholar] [CrossRef]
- Qin, L.; Dai, J. Analysis on the growth of different shapes of mineral microcracks in the microwave field. Frat. Integrità Strutt. 2016, 37, 342–351. [Google Scholar] [CrossRef]
- Chen, Y.; Wang, S.; Ni, J.; Azzam, R.; Fernandez-Steeger, T.M. An experimental study of the mechanical properties of granite after high-temperature exposure based on mineral characteristics. Eng. Geol. 2017, 220, 234–242. [Google Scholar] [CrossRef]
- Peng, J.; Rong, G.; Cai, M.; Yao, M.; Zhou, C. Physical and mechanical behaviors of a thermal-damaged coarse marble under uniaxial compression. Eng. Geol. 2016, 200, 88–93. [Google Scholar] [CrossRef]
- Zhang, Q.; Li, X.; Bai, B.; Hu, H. The shear behavior of sandstone joints under different fluid and temperature conditions. Eng. Geol. 2019, 257, 105143. [Google Scholar] [CrossRef]
- Lü, C.; Sun, Q.; Zhang, W.; Geng, J.; Qi, Y.; Lu, L. The effect of high temperature on tensile strength of sandstone. Appl. Therm. Eng. 2017, 111, 573–579. [Google Scholar] [CrossRef]
- Wang, P.; Xu, J.; Fang, X.; Wen, M.; Zheng, G.; Wang, P. Dynamic splitting tensile behaviors of red-sandstone subjected to repeated thermal shocks: Deterioration and micro-mechanism. Eng. Geol. 2017, 223, 1–10. [Google Scholar] [CrossRef]
- Wang, P.; Xu, J.; Liu, S.; Wang, H. Dynamic mechanical properties and deterioration of red-sandstone subjected to repeated thermal shocks. Eng. Geol. 2016, 212, 44–52. [Google Scholar] [CrossRef]
- Yin, T.; Li, Q.; Li, X. Experimental investigation on mode I fracture characteristics of granite after cyclic heating and cooling treatments. Eng. Fract. Mech. 2019, 222, 106740. [Google Scholar] [CrossRef]
- Sun, Q.; Zhang, W.; Zhu, Y.; Huang, Z. Effect of High Temperatures on the Thermal Properties of Granite. Rock Mech. Rock Eng. 2019, 52, 2691–2699. [Google Scholar] [CrossRef]
- Sun, H.; Sun, Q.; Deng, W.; Zhang, W.; Lü, C. Temperature effect on microstructure and P-wave propagation in Linyi sandstone. Appl. Therm. Eng. 2017, 115, 913–922. [Google Scholar] [CrossRef]
- Mahanta, B.; Singh, T.N.; Ranjith, P.G. Influence of thermal treatment on mode I fracture toughness of certain Indian rocks. Eng. Geol. 2016, 210, 103–114. [Google Scholar] [CrossRef]
- Zuo, J.; Li, Y.; Zhang, X.; Zhao, Z.; Wang, T. The effects of thermal treatments on the subcritical crack growth of Pingdingshan sandstone at elevated high temperatures. Rock Mech. Rock Eng. 2018, 51, 3439–3454. [Google Scholar] [CrossRef]
- Yin, T.; Wu, Y.; Li, Q.; Wang, C.; Wu, B. Determination of double-K fracture toughness parameters of thermally treated granite using notched semi-circular bending specimen. Eng. Fract. Mech. 2019, 226, 106865. [Google Scholar] [CrossRef]
- Sun, Q.; Zhang, Y. Combined effects of salt, cyclic wetting and drying cycles on the physical and mechanical properties of sandstone. Eng. Geol. 2019, 248, 70–79. [Google Scholar] [CrossRef]
- Borinaga-Trevino, R.; Orbe, A.; Norambuena-Contreras, J.; Canales, J. Effect of microwave heating damage on the electrical, thermal and mechanical properties of fibre-reinforced cement mortars. Constr. Build. Mater. 2018, 186, 31–41. [Google Scholar] [CrossRef]
- Yin, T.; Wang, P.; Li, X.; Wu, B.; Tao, M.; Shu, R. Determination of Dynamic Flexural Tensile Strength of Thermally Treated Laurentian Granite Using Semi-Circular Specimens. Rock Mech. Rock Eng. 2016, 49, 3887–3898. [Google Scholar] [CrossRef]
- Wang, P.; Yin, T.; Li, X.; Zhang, S.; Bai, L. Dynamic Properties of Thermally Treated Granite Subjected to Cyclic Impact Loading. Rock Mech. Rock Eng. 2019, 52, 991–1010. [Google Scholar] [CrossRef]
- Teimoori, K.; Hassani, F.; Sasmito, A.P.; Ghoreishi-Madiseh, S.A. Experimental investigations of microwave effects on rock breakage using SEM analysis. In Proceedings of the 17th International Conference on Microwave and High-Frequency Heating, Valencia, Spain, 9–12 September 2019. [Google Scholar] [CrossRef]
- Hartlieb, P.; Grafe, P.H. Experimental Study on Microwave Assisted Hard Rock Cutting of Granite. BHM 2017, 162, 77–81. [Google Scholar] [CrossRef]
- Teimoori, K.; Cooper, R. Multiphysics study of microwave irradiation effects on rock breakage system. Int. J. Rock Mech. Min. Sci. 2021, 140, 104586. [Google Scholar] [CrossRef]
- Hassani, F.; Nekoovaght, P.M.; Gharib, N. The influence of microwave irradiation on rocks for microwave-assisted underground excavation. J. Rock Mech. Geotech. Eng. 2015, 8, 1–15. [Google Scholar] [CrossRef]
- Kim, S.; Santamarina, J.K. Rock Crushing using Microwave Pre-treatment. In Proceedings of the Geo-Chicago 2016 Session: D53/Modeling and Simulations, Part II, Chicago, IL, USA, 14–18 August 2016; Available online: https://ascelibrary.org/doi/10.1061/9780784480151.071 (accessed on 1 January 2023).
- Jones, D.A.; Kingman, S.W.; Whittles, D.N.; Lowndes, I.S. Understanding microwave assisted breakage. Miner. Eng. 2005, 18, 659–669. [Google Scholar] [CrossRef]
- Buttress, A.J.; Katrib, J.; Jones, D.A.; Batchelor, A.R.; Craig, D.A.; Royal, T.A.; Dodds, C.; Kingman, S.W. Towards large scale microwave treatment of ores: Part 1—Basis of design, construction and commissioning. Miner. Eng. 2017, 109, 169–183. [Google Scholar] [CrossRef]
- Batchelor, A.R.; Buttress, A.J.; Jones, D.A.; Katrib, J.; Way, D.; Chenje, T.; Stoll, D.; Dodds, C.; Kingman, S.W. Towards large scale microwave treatment of ores: Part 2—Metallurgical testing. Miner. Eng. 2017, 111, 5–24. [Google Scholar] [CrossRef]
- Shahar, Y. The Hazeva Formation in the Oron-Ef’e syncline. Isr. J. Earth Sci. 1973, 22, 31–49. [Google Scholar]
- Calvo, R.; Bartov, Y. Hazeva Group, southern Israel: New observations, and their implications for its stratigraphy, paleogeography, and tectonic-sedimentary regime. Isr. J. Earth Sci. 2001, 50, 71–99. [Google Scholar] [CrossRef]
- Shirav, M.; Shiloni, I.; Minster, Z. Sands from Mishor Rotem Region; Report GSI 11/97, Geological Survey of Israel, The Ministry of National Infrastructure, 30 Malkhe Israel St., 95501 Jerusalem, 1997. Available online: https://www.gov.il/BlobFolder/reports/reports-1997/he/report_1997_Shirav-M-Mishor-Rotem-Sands-Volumetric-Computations-Based-Boreholes-GSI-20-1997.pdf (accessed on 1 January 2023). (In Hebrew)
- Shahar, J. Note on stratigraphic relations of Zefa, Hazeva, and Hufeira formations in southern Israel. Isr. J. Earth Sci. 2008, 57, 33–34. [Google Scholar] [CrossRef]
- Roded, R. Geological Map of Israel, Dimona, Sheet 19-I, 1:50,000; Israel Geological Survey: Jerusalem, Israel, 2009.
- Tzibulsky, M.; Frid, V. Features of the properties of chert gravels. Minerals 2023, 13, 455. [Google Scholar] [CrossRef]
- Wang, M.; Xu, W.; Chen, D.; Li, J.; Mu, H.; Mi, J.; Wu, Y. Summary of the Transformational Relationship between Point Load Strength Index and Uniaxial Compressive Strength of Rocks. Sustainability 2022, 14, 12456. [Google Scholar] [CrossRef]
- Franklin, J.A. Suggested method for determining point load strength. Int. J. Rock Mech. Min. Sci. Geomech. Abstr. 1985, 22, 51–60. [Google Scholar] [CrossRef]
- ISO 3310-1:2016; Technical Requirements and Testing. Part 1: Test Sieves of Metal Wire Cloth. International Organization for Standardization: Geneva, Switzerland, 2016.
- ISO 565:1990; Metal Wire Cloth, Perforated Metal Plate and Electroformed Sheet. Nominal Sizes of Openings. International Organization for Standardization: Geneva, Switzerland, 1990.
- Srinivasan, V.; Haseeb Hasainar, T.N. Singh Experimental study on failure and fracturing attributes of granite after thermal treatments with different cooling conditions. Eng. Geol. 2022, 310, 106867. [Google Scholar] [CrossRef]
- Shao, S.; Ranjith, P.G.; Wasantha, P.B.; Chen, K. Experimental and numerical studies on the mechanical behavior of Australian Strathbogie granite at high temperatures: An application to geothermal energy. Geothermics 2015, 54, 96–108. [Google Scholar] [CrossRef]
- Yin, Q.; Wu, J.; Jiang, Z.; Zhu, C.; Su, H.; Jing, H.; Gu, X. Investigating the effect of water quenching cycles on mechanical behaviors for granites after conventional triaxial compression. Geomech. Geophys. Geo-Energy Geo-Resour. 2022, 8, 77. [Google Scholar] [CrossRef]
Figure 1.
(a) The geological map of the Rotem Plain region, where the zone of the sand quarries is marked in green [53]; (b) the legend for the geological map.
Figure 1.
(a) The geological map of the Rotem Plain region, where the zone of the sand quarries is marked in green [53]; (b) the legend for the geological map.

Figure 2.
Four photographs of the chert rocks. (a) A typical view of a sand quarry slope with noticeable layers of chert gravel; (b) chert gravel of different sizes from 5 to 20 cm; (c) a typical stripped texture of chert gravel; (d) the photograph of the landfill of the sand quarries covered with vast reserves of chert gravel.

Figure 3.
A sample of chert gravel after irradiation. Subjecting the sample to irradiation for 1–2.5 min did not result in crushing or any visible alteration in its shape.
Figure 3.
A sample of chert gravel after irradiation. Subjecting the sample to irradiation for 1–2.5 min did not result in crushing or any visible alteration in its shape.

Figure 4.
The point load test. (a) A sample of chert gravel before point loading; (b) a typical view of the sample of chert gravel damaged by point loading.
Figure 4.
The point load test. (a) A sample of chert gravel before point loading; (b) a typical view of the sample of chert gravel damaged by point loading.

Figure 5.
The crushing test. (a) The samples of chert gravel inside the crushing cylinder; (b) the photograph of the assemblage of the crushing test.
Figure 5.
The crushing test. (a) The samples of chert gravel inside the crushing cylinder; (b) the photograph of the assemblage of the crushing test.

Figure 6.
The results of temperature measurement at the end of the microwave irradiation test. The blue and orange curves show the temperature measurement results of samples dried before the test (A and B types, respectively, Section 2.1). The purple and yellow curves show the temperature measurement results for the samples with a “wet surface” before irradiation (C and D types, respectively, Section 2.1).

Figure 7.
Typical curves of gravel crushing. (a–d) are for 1, 1.5, 2, and 2.5 min of irradiation, respectively. The blue and orange curves display the results for samples with a dry surface before irradiation (A and B, respectively, Section 2.1). The purple and yellow curves are the measurement results of samples with a “wet surface” at the beginning of irradiation (C and D, respectively, Section 2.1). The orange and yellow curves show results for samples to which the quenching procedure was applied.

Figure 8.
The results of observation of point load strength index (MPa) vs. the time of microwave irradiation (min). The blue and orange curves display the results of measuring the temperature of dry samples at the beginning of the test (A and B, respectively, Section 2.1). The purple and yellow curves are the measurement results of samples with a “wet surface” at the beginning of irradiation (C and D, respectively, Section 2.1). Note that the orange and yellow curves show results for samples to which the quenching procedure was applied.

Figure 9.
Typical grain distribution curves of gravel after the crushing tests. (a–d) show the curves for 1, 1.5, 2, and 2.5 min of gravel irradiation, respectively. The blue and orange curves display the results for samples with a dry surface at the beginning of the test (A and B in Section 2.1, respectively). The purple and yellow curves are the measurement results of samples with a “wet surface” at the beginning of irradiation (C and D in Section 2.1, respectively). The orange and yellow curves show results for samples to which the quenching procedure was applied.


Table 1.
The temperature values at the surface of the sample under study at the end of microwave irradiation (see Section 2.1 for the “A–D” descriptions).
Table 1.
The temperature values at the surface of the sample under study at the end of microwave irradiation (see Section 2.1 for the “A–D” descriptions).
| Time | A | B | C | D |
|---|---|---|---|---|
| (min) | (°C) | |||
| 1 | 90.02 | 95.0 | 98.42 | 85.82 |
| 1.5 | 131.14 | 130.18 | 135.66 | 133.02 |
| 2 | 164.58 | 161.98 | 154.48 | 155.96 |
| 2.5 | 190.24 | 197.6 | 176.78 | 174.22 |
Table 2.
The values of the point load index after irradiation tests for A–D type samples (Section 2.1). Subscript 50 means that the results were normalized for the samples’ diameter 50 mm.
Table 2.
The values of the point load index after irradiation tests for A–D type samples (Section 2.1). Subscript 50 means that the results were normalized for the samples’ diameter 50 mm.
| Time | Is(50)-A | Is(50)-B | Is(50)-C | Is(50)-D |
|---|---|---|---|---|
| (min) | (MPa) | |||
| 1 | 7.219 | 5.860 | 5.728 | 4.576 |
| 1.5 | 6.941 | 4.559 | 5.109 | 4.001 |
| 2 | 5.119 | 3.913 | 4.615 | 3.407 |
| 2.5 | 3.969 | 2.752 | 4.359 | 2.485 |
Table 3.
Sieve analysis results of the chert samples after the crushing test.
| Time | Percent Pass after Crushing Test | Percent Pass in the Range of Gravel Fraction | USCS Index * | |||
|---|---|---|---|---|---|---|
| Gravel | Sand | |||||
| >4.75 | 4.75–0.075 | 9–25 | 12.5–19 | 4.75–12.5 | ||
| min | mm | |||||
| A: Irradiation of sample with dry surface (quenching not applied) | ||||||
| 1 | 65.7 | 34.3 | 21.00 | 19.0 | 25.7 | GW |
| 1.5 | 60.2 | 39.6 | 18.3 | 12.8 | 29.1 | GW |
| 2 | 58.6 | 41.3 | 11 | 13.6 | 34 | GW |
| 2.5 | 65.6 | 34.3 | 18.3 | 19.8 | 27.5 | GW |
| B: Irradiation of sample with dry surface (quenching applied) | ||||||
| 1 | 50.5 | 49.5 | 6.9 | 14.8 | 28.8 | GW/SW |
| 1.5 | 41.2 | 58.8 | 2.3 | 8.1 | 30.7 | SW |
| 2 | 48.5 | 51.5 | 5.2 | 11.2 | 32.1 | GW/SW |
| 2.5 | 44.5 | 55.6 | 4.0 | 8.5 | 31.9 | SW |
| C: Irradiation of sample with wet surface (quenching not applied) | ||||||
| 1 | 72.6 | 27.4 | 37.5 | 9.4 | 25.7 | GW |
| 1.5 | 76.4 | 23.6 | 32.4 | 17.7 | 26.3 | GW |
| 2 | 50.3 | 49.5 | 8.3 | 11.8 | 30.2 | GW |
| 2.5 | 72.9 | 27.1 | 27.1 | 17.1 | 28.7 | GW |
| D: Irradiation of sample with wet surface (quenching applied) | ||||||
| 1 | 46.9 | 53 | 7.7 | 11.3 | 27.9 | SW |
| 1.5 | 68.4 | 31.6 | 26.3 | 15.8 | 26.3 | GW |
| 2 | 64.8 | 35.2 | 16.4 | 16.1 | 32.1 | GW |
| 2.5 | 42.3 | 57.7 | 2.0 | 11.6 | 28.5 | SW |
| The typical grain size content of the chert sample to which irradiation was not applied | ||||||
| 0 | 76.6 | 23.4 | 33.8 | 15.4 | 27.4 | GW |
* GW—well-graded gravel; SW—well-graded sand.
Disclaimer/Publisher’s Note: The statements, opinions and data contained in all publications are solely those of the individual author(s) and contributor(s) and not of MDPI and/or the editor(s). MDPI and/or the editor(s) disclaim responsibility for any injury to people or property resulting from any ideas, methods, instructions or products referred to in the content. |
© 2024 by the authors. Licensee MDPI, Basel, Switzerland. This article is an open access article distributed under the terms and conditions of the Creative Commons Attribution (CC BY) license (https://creativecommons.org/licenses/by/4.0/).
Share and Cite
MDPI and ACS Style
Tzibulsky, M.; Frid, V. The Comminution of Chert Gravel by Microwave Irradiation. Resources 2024, 13, 63. https://0-doi-org.brum.beds.ac.uk/10.3390/resources13050063
AMA Style
Tzibulsky M, Frid V. The Comminution of Chert Gravel by Microwave Irradiation. Resources. 2024; 13(5):63. https://0-doi-org.brum.beds.ac.uk/10.3390/resources13050063
Chicago/Turabian StyleTzibulsky, Mark, and Vladimir Frid. 2024. "The Comminution of Chert Gravel by Microwave Irradiation" Resources 13, no. 5: 63. https://0-doi-org.brum.beds.ac.uk/10.3390/resources13050063
Note that from the first issue of 2016, this journal uses article numbers instead of page numbers. See further details here.