
The Human Phospholipase B-II Precursor (HPLBII-P) in Urine as a Novel Biomarker of Glomerular Activity in COVID-19 and Diabetes Mellitus

 , , , and
Abstract
:1. Introduction
2. Material and Methods
Statistics
3. Results
3.1. HPLBII-P in the Kidney
3.2. HPLBII-P in the Urine of Patients with COVID-19
3.3. HPLBII-P in patients with Diabetes Mellitus
4. Discussion
Supplementary Materials
Author Contributions
Funding
Institutional Review Board Statement
Informed Consent Statement
Data Availability Statement
Conflicts of Interest
References
- Xu, S.; Zhao, L.; Larsson, A.; Venge, P. The identification of a phospholipase B precursor in human neutrophils. FEBS J. 2009, 276, 175–186. [Google Scholar] [CrossRef]
- Xu, S.; Cai, L.; Zhao, L.; Douhan-Håkansson, L.; Kristjánsson, G.; Pauksen, K.; Venge, P. Tissue localization and the establishment of a sensitive immunoassay of the newly discovered human phospholipase B-precursor (PLB-P). J. Immunol. Methods 2010, 353, 71–77. [Google Scholar] [CrossRef]
- Castro Tejera, V.; Öhman, L.; Aabakken, L.; Fellström, B.; Hausken, T.; Hovde, Ø.; Hreinsson, J.P.; Lindberg, G.; Venge, P.; Simrén, M.; et al. Randomised clinical trial and meta-analysis: Mesalazine treatment in irritable bowel syndrome-effects on gastrointestinal symptoms and rectal biomarkers of immune activity. Aliment. Pharmacol. Ther. 2022, 56, 968–979. [Google Scholar] [CrossRef]
- Grubb, A. Diagnostic value of analysis of cystatin C and protein HC in biological fluids. Clin. Nephrol. 1992, 38 (Suppl. S1), S20–S27. [Google Scholar]
- Nguyen, M.T.; Devarajan, P. Biomarkers for the early detection of acute kidney injury. Pediatr. Nephrol. 2008, 23, 2151–2157. [Google Scholar] [CrossRef] [PubMed]
- Xu, S.Y.; Carlson, M.; Engström, A.; Garcia, R.; Peterson, C.G.B.; Venge, P. Purification and characterization of a human neutrophil lipocalin (HNL) from the secondary granules of human neutrophils. Scand. J. Clin. Lab. Investig. 1994, 54, 365–376. [Google Scholar] [CrossRef]
- Kjeldsen, L.; Sengelov, H.; Lollike, K.; Nielsen, M.H.; Borregaard, N. Isolation and characterization of gelatinase granules from human neutrophils. Blood 1994, 83, 1640–1649. [Google Scholar] [CrossRef]
- Kashani, K.; Al-Khafaji, A.; Ardiles, T.; Artigas, A.; Bagshaw, S.M.; Bell, M.; Bihorac, A.; Birkhahn, R.; Cely, C.M.; Chawla, L.S.; et al. Discovery and validation of cell cycle arrest biomarkers in human acute kidney injury. Crit. Care 2013, 17, R25. [Google Scholar] [CrossRef] [PubMed]
- Shetty, A.A.; Tawhari, I.; Safar-Boueri, L.; Seif, N.; Alahmadi, A.; Gargiulo, R.; Aggarwal, V.; Usman, I.; Kisselev, S.; Gharavi, A.G.; et al. COVID-19–Associated Glomerular Disease. J. Am. Soc. Nephrol. 2021, 32, 33–40. [Google Scholar] [CrossRef]
- Bülow Anderberg, S.; Lipcsey, M.; Hultström, M.; Eriksson, A.K.; Venge, P.; Frithiof, R.; Uppsala Intensive Care COVID-19 Research Group. Systemic Human Neutrophil Lipocalin Associates with Severe Acute Kidney Injury in SARS-CoV-2 Pneumonia. J. Clin. Med. 2021, 10, 4144. [Google Scholar] [CrossRef]
- Luther, T.; Bülow-Anderberg, S.; Larsson, A.; Rubertsson, S.; Lipcsey, M.; Frithiof, R.; Hultström, M. COVID-19 patients in intensive care develop predominantly oliguric acute kidney injury. Acta Anaesthesiol. Scand. 2021, 65, 364–372. [Google Scholar] [CrossRef] [PubMed]
- Khwaja, A. KDIGO Clinical Practice Guidelines for Acute Kidney Injury. Nephron Clin. Pract. 2012, 120, c179–c184. [Google Scholar] [CrossRef] [PubMed]
- Giasson, J.; Li, G.H.; Chen, Y. Neutrophil gelatinase-associated lipocalin (NGAL) as a new biomarker for non-acute kidney injury (AKI) diseases. Inflamm. Allergy Drug Targets 2011, 10, 272–282. [Google Scholar] [CrossRef] [PubMed]
- Żyłka, A.; Dumnicka, P.; Kuśnierz-Cabala, B.; Gala-Błądzińska, A.; Ceranowicz, P.; Kucharz, J.; Ząbek-Adamska, A.; Maziarz, B.; Drożdż, R.; Kuźniewski, M. Markers of Glomerular and Tubular Damage in the Early Stage of Kidney Disease in Type 2 Diabetic Patients. Mediat. Inflamm. 2018, 2018, 7659243. [Google Scholar] [CrossRef] [PubMed]
- Kapoula, G.V.; Kontou, P.I.; Bagos, P.G. Diagnostic Accuracy of Neutrophil Gelatinase-Associated Lipocalin for Predicting Early Diabetic Nephropathy in Patients with Type 1 and Type 2 Diabetes Mellitus: A Systematic Review and Meta-analysis. J. Appl. Lab. Med. 2019, 4, 78–94. [Google Scholar] [CrossRef] [PubMed]
- Damman, K.; van Veldhuisen, D.J.; Navis, G.; Voors, A.A.; Hillege, H.L. Urinary neutrophil gelatinase associated lipocalin (NGAL), a marker of tubular damage, is increased in patients with chronic heart failure. Eur. J. Heart Fail. 2008, 10, 997–1000. [Google Scholar] [CrossRef] [PubMed]
- Xu, K.; Shang, N.; Levitman, A.; Corker, A.; Kudose, S.; Yaeh, A.; Neupane, U.; Stevens, J.; Sampogna, R.; Mills, A.M.; et al. Elevated Neutrophil Gelatinase-Associated Lipocalin Is Associated with the Severity of Kidney Injury and Poor Prognosis of Patients With COVID-19. Kidney Int. Rep. 2021, 6, 2979–2992. [Google Scholar] [CrossRef] [PubMed]
- van Timmeren, M.M.; Bakker, S.J.L.; Vaidya, V.S.; Bailly, V.; Schuurs, T.A.; Damman, J.; Stegeman, C.A.; Bonventre, J.V.; van Goor, H. Tubular kidney injury molecule-1 in protein-overload nephropathy. Am. J. Physiol. Physiol. 2006, 291, F456–F464. [Google Scholar] [CrossRef] [PubMed]
- Abbate, M.; Rottoli, D.; Gianatti, A. COVID-19 Attacks the Kidney: Ultrastructural Evidence for the Presence of Virus in the Glomerular Epithelium. Nephron 2020, 144, 341–342. [Google Scholar] [CrossRef]
- Frithiof, R.; Bergqvist, A.; Jarhult, J.D.; Lipcsey, M.; Hultstrom, M. Presence of SARS-CoV-2 in urine is rare and not associated with acute kidney injury in critically ill COVID-19 patients. Crit. Care 2020, 24, 587. [Google Scholar] [CrossRef]
- Ripon, A.R.; Bhowmik, D.R.; Amin, M.T.; Hossain, M.S. Role of arachidonic cascade in COVID-19 infection: A review. Prostaglandins Other Lipid Mediat. 2021, 154, 106539. [Google Scholar] [CrossRef] [PubMed]
- Teixeira, S.; Borges, B.; Oliveira, V.; Carregosa, L.; Bastos, L.; Santos, I.; Jardim, A.; Melo, F.; Freitas, L.; Rodrigues, V.; et al. Insights into the antiviral activity of phospholipases A2 (PLA2s) from snake venoms. Int. J. Biol. Macromol. 2020, 164, 616–625. [Google Scholar] [CrossRef] [PubMed]
- Pavkov, M.E.; Collins, A.J.; Coresh, J.; Nelson, R.G. Kidney Disease in Diabetes; National Institute of Diabetes and Digestive and Kidney Diseases: Bethesda, MD, USA, August 2018.
- Pagtalunan, M.E.; Miller, P.L.; Jumping-Eagle, S.; Nelson, R.G.; Myers, B.D.; Rennke, H.G.; Coplon, N.S.; Sun, L.; Meyer, T.W. Podocyte loss and progressive glomerular injury in type II diabetes. J. Clin. Investig. 1997, 99, 342–348. [Google Scholar] [CrossRef] [PubMed]
- Weil, E.J.; Lemley, K.V.; Yee, B.; Lovato, T.; Richardson, M.; Myers, B.D.; Nelson, R.G. Podocyte Detachment in Type 2 Diabetic Nephropathy. Am. J. Nephrol. 2011, 33 (Suppl. S1), 21–24. [Google Scholar] [CrossRef] [PubMed]
- Reddy, G.R.; Kotlyarevska, K.; Ransom, R.F.; Menon, R.K. The podocyte and diabetes mellitus: Is the podocyte the key to the origins of diabetic nephropathy? Curr. Opin. Nephrol. Hypertens. 2008, 17, 32–36. [Google Scholar] [CrossRef] [PubMed]
- Kandasamy, Y.; Smith, R.; Lumbers, E.R.; Rudd, D. Nephrin—A biomarker of early glomerular injury. Biomark. Res. 2014, 2, 21. [Google Scholar] [CrossRef]
- Jana, S.; Mitra, P.; Roy, S. Proficient Novel Biomarkers Guide Early Detection of Acute Kidney Injury: A Review. Diseases 2022, 11, 8. [Google Scholar] [CrossRef]


| Biomarker Urine | No AKI Median (95% CI) | AKI Median (95% CI) | p-Value Mann-Whitney | Non-Diabetes Median (95% CI) | Diabetes Median (95% CI) | p-Value Mann-Whitney |
|---|---|---|---|---|---|---|
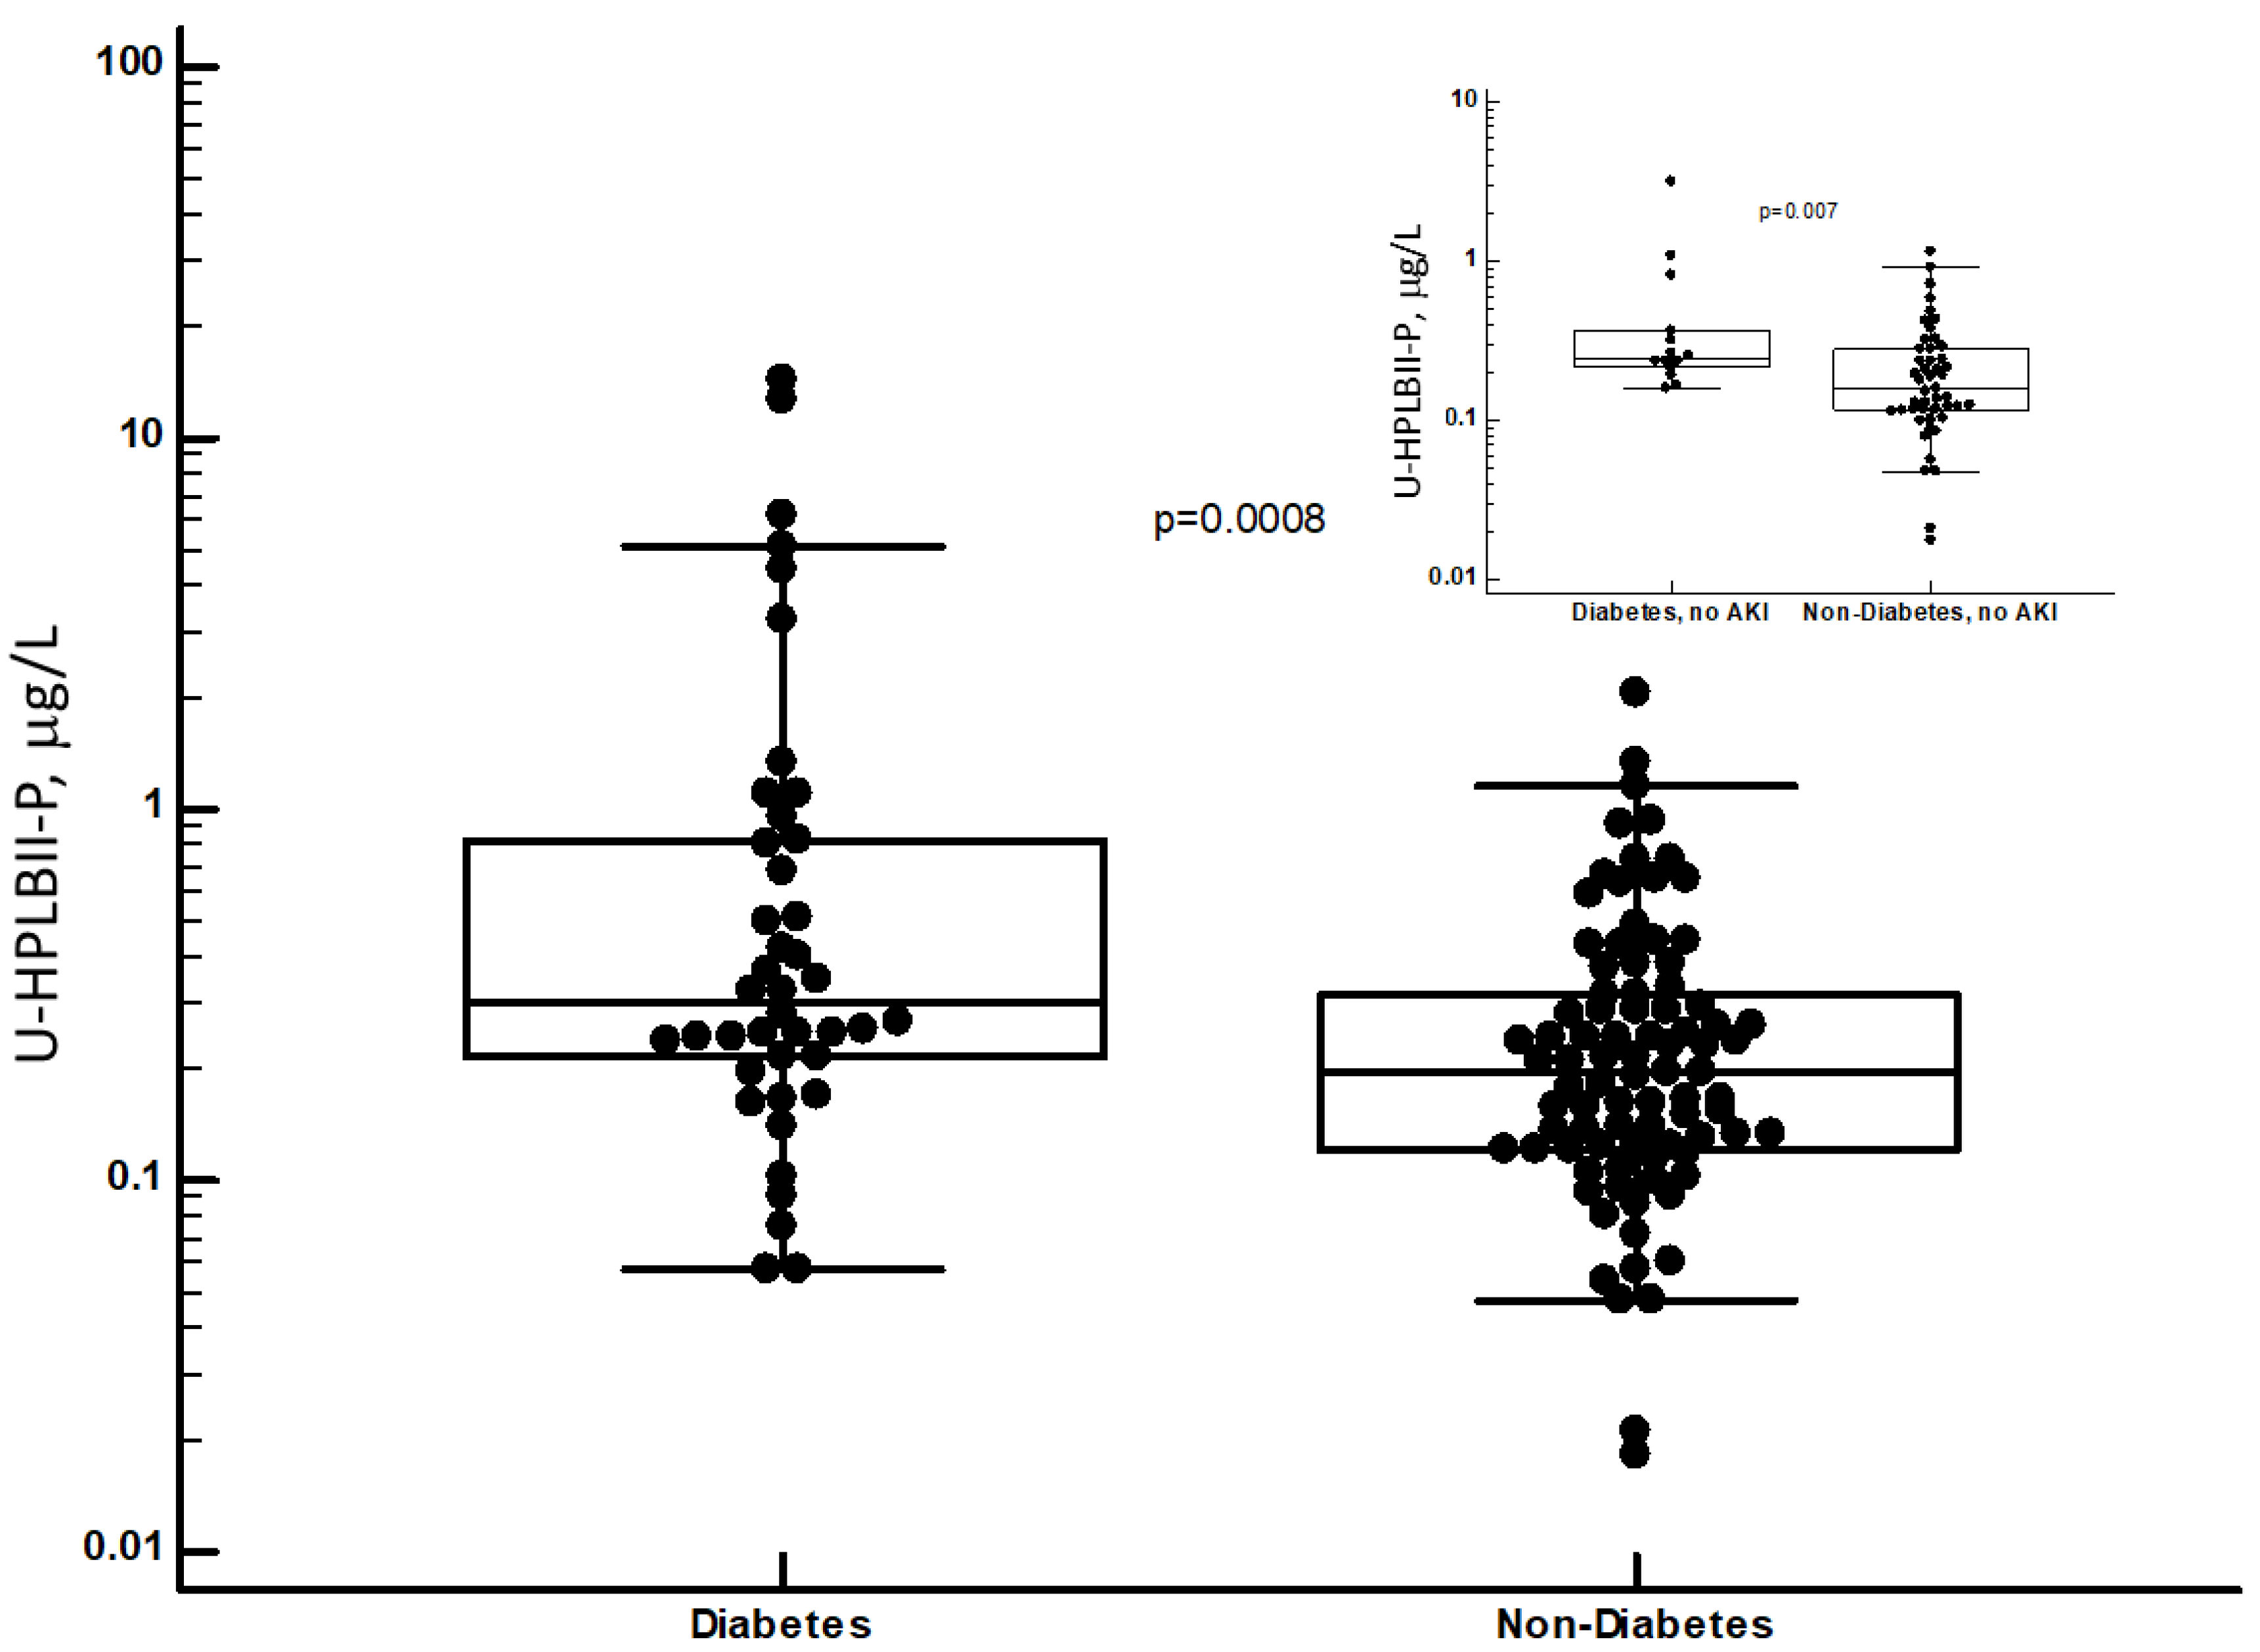
| HPLBII-P, mg/L | 0.19 (0.15–0.24) n = 62 | 0.25 (0.23–0.35) n = 67 | p = 0.019 | 0.19 (0.15–0.23) n = 88 | 0.28 (0.24–0.44) n = 41 | p = 0.0008 |
| HNL (763/8F), mg/L | 25 (20–39) n = 61 | 29 (20–54) n = 67 | Ns | 23 (16–35) n = 87 | 41 (24–99) n = 41 | p = 0.0056 |
| NGAL, mg/L | 45 (21–69) n = 19 | 42 (28–85) n = 29 | Ns | 35 (24–53) n = 36 | 112 (38–213) n = 12 | p = 0.007 |
| TIMP-2, ng/L | 3.7 (2.5–4.8) n = 19 | 4.4 (2.4–5.9) n = 30 | Ns | 4.2 (2.7–4.9) n = 36 | 4.1 (1.7–7.2) n = 13 | Ns |
| KIM-1, ng/L | 2.3 (1.6–5.2) n = 47 | 2.6 (1.6–3.1) n = 60 | Ns | 2.5 (1.9–3.2) n = 77 | 2.4 (1.3–4.7) n = 30 | Ns |
| Cystatin C, mg/L | 0.56 (0.42–0.83) n = 47 | 0.87 (0.58–1.01) n = 60 | Ns | 0.68 (0.53–0.91) n = 77 | 0.76 (0.42–1.46) n = 30 | Ns |
| Albumin, mg/L | 68 (50–112) n = 47 | 94 (58–130) n = 60 | Ns | 85 (59–130) n = 77 | 71 (42–111) n = 30 | Ns |
| Biomarker Serum | No AKI Median (95% CI) | AKI Median (95% CI) | p-Value Mann-Whitney | Non-Diabetes Median (95% CI) | Diabetes Median (95% CI) | p-Value Mann-Whitney |
| Cystatin C, mg/L | 0.98 (0.80–1.05) n = 33 | 1.19 (1.11–1.35) n = 47 | p = 0.0002 | 1.07 (0.99–1.12) n = 58 | 1.22 (1.06–1.80) n = 23 | p = 0.055 |
| Biomarker Urine | No AKI Median (95% CI) | AKI Median (95% CI) | p-Value Mann-Whitney | Non-Diabetes Median (95% CI) | Diabetes Median (95% CI) | p-Value Mann-Whitney |
|---|---|---|---|---|---|---|
| HPLBII-P/Crea mg/mmol | 0.016 (0.012–0.030) n = 32 | 0.041 (0.027–0.059 n = 41 | p = 0.002 | 0.025 (0.016–0.036) n = 54 | 0.049 (0.029–0.117) n = 19 | p = 0.008 |
| HNL (763/8F)/Crea mg/mmol | 2.0 (1.4–3.2) n = 33 | 3.3 (1.9–4.8) n = 41 | Ns | 2.1 (1.6–3.1) n = 54 | 5.9 (1.8–9.7) n = 20 | p = 0.007 |
| NGAL/Crea mg/mmol | 4.1 (2.3–10.2) n = 19 | 7.8 (4.7–12.1) n = 30 | Ns | 4.8 (2.7–7.0) n = 36 | 27.6 (9.6–121) n = 13 | p = 0.003 |
| TIMP-2/Crea ng/mmol | 0.45 (0.37–0.54) n = 19 | 0.50 (0.38–0.78) n = 30 | Ns | 0.46 (0.36–0.56) n = 36 | 0.53 (0.40–1.45) n = 13 | Ns |
| KIM-1/Crea ng/mmol | 0.32 (0.20–0.46) n = 33 | 0.28 (0.21–0.39) n = 41 | Ns | 0.31 (0.21–0.39) n = 55 | 0.23 (0.09–0.56) n = 19 | Ns |
| Cystatin C/Crea mg/mmol | 0.12 (0.06–0.16) n = 33 | 0.10 (0.08–0.15) n = 41 | Ns | 0.11 (0.08–0.13) n = 55 | 0.15 (0.05–0.34) n = 19 | Ns |
| Albumin/Crea mg/mmol | 12.6 (5.6–18.4) n = 33 | 13.6 (6.6–19.2) n = 41 | Ns | 12.6 (5.5–16.4) n = 55 | 14.6 (8.1–28.4) n = 19 | Ns |
| Biomarker Serum | No AKI Median (95% CI) | AKI Median (95% CI) | p-Value Mann-Whitney | Non-Diabetes Median (95% CI) | Diabetes Median (95% CI) | p-Value Mann-Whitney |
| Cystatin C, mg/L | 0.98 (0.80–1.05) n = 33 | 1.19 (1.11–1.35) n = 47 | p = 0.0002 | 1.07 (0.99–1.12) n = 58 | 1.22 (1.06–1.80) n = 23 | p = 0.055 |
Disclaimer/Publisher’s Note: The statements, opinions and data contained in all publications are solely those of the individual author(s) and contributor(s) and not of MDPI and/or the editor(s). MDPI and/or the editor(s) disclaim responsibility for any injury to people or property resulting from any ideas, methods, instructions or products referred to in the content. |
© 2024 by the authors. Licensee MDPI, Basel, Switzerland. This article is an open access article distributed under the terms and conditions of the Creative Commons Attribution (CC BY) license (https://creativecommons.org/licenses/by/4.0/).
Share and Cite
Xu, S.; Hultström, M.; Larsson, A.; Lipcsey, M.; Lindskog, C.; Bülow, S.; Frithiof, R.; Venge, P. The Human Phospholipase B-II Precursor (HPLBII-P) in Urine as a Novel Biomarker of Glomerular Activity in COVID-19 and Diabetes Mellitus. J. Clin. Med. 2024, 13, 2540. https://0-doi-org.brum.beds.ac.uk/10.3390/jcm13092540
Xu S, Hultström M, Larsson A, Lipcsey M, Lindskog C, Bülow S, Frithiof R, Venge P. The Human Phospholipase B-II Precursor (HPLBII-P) in Urine as a Novel Biomarker of Glomerular Activity in COVID-19 and Diabetes Mellitus. Journal of Clinical Medicine. 2024; 13(9):2540. https://0-doi-org.brum.beds.ac.uk/10.3390/jcm13092540
Chicago/Turabian StyleXu, Shengyuan, Michael Hultström, Anders Larsson, Miklos Lipcsey, Cecilia Lindskog, Sara Bülow, Robert Frithiof, and Per Venge. 2024. "The Human Phospholipase B-II Precursor (HPLBII-P) in Urine as a Novel Biomarker of Glomerular Activity in COVID-19 and Diabetes Mellitus" Journal of Clinical Medicine 13, no. 9: 2540. https://0-doi-org.brum.beds.ac.uk/10.3390/jcm13092540