miR29a and miR378b Influence CpG-Stimulated Dendritic Cells and Regulate cGAS/STING Pathway

1
College of Veterinary medicine, Nanjing Agricultural University, Wei gang 1, Nanjing 210095, China
2
National Reference Laboratory for Poultry Diseases, Animal Sciences Institute, National Agricultural Research Center, Islamabad 44000, Pakistan
3
College of Life Sciences, Nanjing Agricultural University, Wei gang 1, Nanjing 210095, China
*
Authors to whom correspondence should be addressed.
Vaccines 2019, 7(4), 197; https://0-doi-org.brum.beds.ac.uk/10.3390/vaccines7040197
Submission received: 12 September 2019
/
Revised: 8 November 2019
/
Accepted: 11 November 2019
/
Published: 26 November 2019
(This article belongs to the Section Veterinary Vaccines)
Abstract
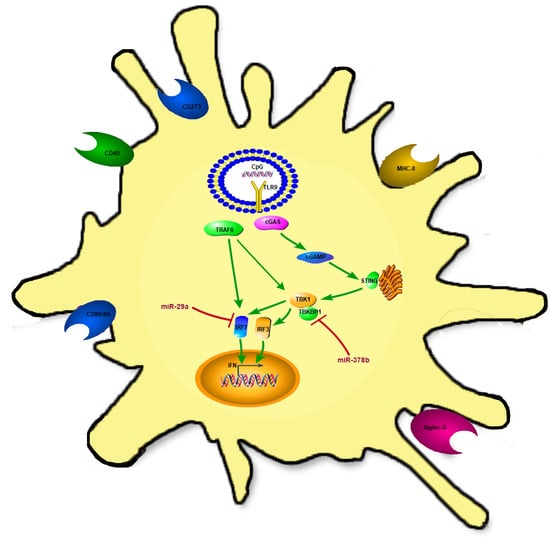
:The Cytosine–phosphate–guanosine (CpG) motif, which is specifically recognized intracellularly by dendritic cells (DCs), plays a crucial role in regulating the innate immune response. MicroRNAs (miRNAs) can strongly influence the antigen-presenting ability of DCs. In this study, we examine the action of miRNAs on CpG-stimulated and control DCs, as well as their effect on cyclic guanosine monophosphate-adenosine monophosphate (GMP–AMP) synthase (cGAS) and the stimulator of interferon genes (STING) signal pathway. Firstly, we selected miRNAs (miR-29a and miR-378b) based on expression in CpG-stimulated mouse bone marrow-derived dendritic cells (BMDCs). Secondly, we investigated the functions of miR-29a and miR-378b on CpG-stimulated and unstimulated BMDCs. The results showed that miR-29a and miR-378b increased expression of both the immunoregulatory DC surface markers (CD86 and CD40) and the immunosuppressive molecule CD273 by DCs. Thirdly, cytokine detection revealed that both miR-29a and miR-378b enhanced interferon-β (IFN-β) expression while suppressing tumor necrosis factor-α (TNF-α) production. Finally, our results suggest that miR-378b can bind TANK-binding kinase binding protein 1 (TBKBP1) to activate the cGAS/STING signaling pathway. By contrast, miR-29a targeted interferon regulatory factor 7 (IRF7) and promoted the expression of STING. Together, our results provide insight into the molecular mechanism of miRNA induction by CpG to regulate DC function.
1. Introduction
Dendritic cells (DCs) are the most important antigen-presenting cells (APCs) [1]. The ability of DCs to present antigens and initiate an immune response forms a link between the innate and the acquired immune system. This process is known as DC maturation, which is characterized by upregulating major histocompatibility complex class II (MHCII) and co-stimulatory molecules (CD80, CD86, and CD40). Unlike co-stimulatory molecules, DCs can be negatively regulated by recognition of co-inhibitory molecules (sialic-acid-binding immunoglobulin-like lectin-G (Siglec-G) and CD273), containing an immunoreceptor tyrosine-based inhibitory motif (ITIM). Siglec-G, a member of the Siglec family, contains ITIM intracellularly [2]. As a member of the immunoglobulin (Ig) superfamily, CD273 also contains ITIM in its cytoplasmic tail [3].
Cytosine–phosphate–guanosine (CpG) was first discovered when a small DNA from Bacillus Calmette–Guerin (BCG) was found to have the ability to induce type I interferon [4]. Since then, CpG motifs are widely used as an effective vaccine adjuvant, especially in mucosal immunity. As an important immunostimulatory molecule, CpG can increase the expression of IgA when administrated together with a virus, and it can alleviate the production of IgG [5]. Previous studies showed that CpG can bind to Toll-like receptor 9 (TLR9) and induce immune cells (DCs, B-cells, natural killer cells, and monocytes/macrophages) to initiate the immune response [6,7,8,9]. Recent studies showed that CpG DNA directly activates DCs by increasing the expression of MHCII and co-stimulatory molecules (CD40, CD80, and CD86), as well as cytokine secretion (Interleukin-6, Interleukin-12, tumor necrosis factor-α, and type I Interferon) [10,11]. The intracellular mechanism of CpG-activating DCs is still unclear, and a recent study found that the cyclic guanosine monophosphate-adenosine monophosphate (GMP–AMP) synthase/stimulator of interferon genes (cGAS/STING) pathway was an effective intracellular signal to activate DCs [12]. We hypothesize that CpG might activate the cyclic GMP–AMP synthase (cGAS) and stimulator of interferon genes (STING) pathway to boost the immune function of DCs.
MicroRNAs (miRNAs) bind to the 3′ untranslated regions (3′UTRs) of their target messenger RNA (mRNA), and negatively regulate their gene expression at the post-transcriptional level or protein synthesis [13]. However, less is known about the influence of miRNAs on control and CpG-stimulated DCs. Numerous studies identified that a large number of miRNAs can be induced by DNA viruses and influence the relevant immune signaling pathways [14,15,16]. miRNAs also influence the DC’s ability to present antigens and secrete cytokines [17]. Therefore, we tried to investigate whether the miRNAs which target the cytosolic DNA sensing pathway can influence the immune response of DCs. Thus, our purpose was to explore the miRNAs involved in the enhancement of CpG-mediated DC cytokine, co-stimulatory, and co-inhibitory molecule production. A previous study identified several differentially expressed microRNAs on DCs after CpG stimulation [18]. In the present study, we extend our search to explore the mechanism via which miRNAs influence the activity of CpG-induced DCs. Our data provide new insight into the underlying nature of miRNAs regulating the immune response of CpG-stimulated bone marrow-derived dendritic cells (BMDCs) in order to optimize potential therapeutic approaches.
2. Materials and Methods
2.1. Animals and Ethical Statement
Specific pathogen-free (SPF) 4–6 C57BL/6 wild-type mice of 4–6 weeks were used for each experiment (in total, about 60 mice were used). Mice were obtained from the Animal Research Center of Yang Zhou University and kept under pathogenic-free conditions for at least one week before experiment. This study was approved by the Ethical Committee of Animal Experiments (code number SYXK-Su 2011-0036) of the College of Veterinary Medicine, Nanjing Agricultural University. The care and the use of all animals were conducted in a strict environment according to the Animal Research Committee guidelines of the College of Veterinary Medicine, Nanjing Agricultural University.
2.2. miRNA Selection and Quantification
The miRNA selection was based on the expression of BMDCs influenced by CpG. Three upregulated and three downregulated miRNAs were selected from our previous microarray data [18] (Figure 1A,B). These miRNAs were isolated from the mouse genome and transfected into mouse BMDCs with X-tremeGENE HP DNA Transfection Reagent from Roche (Mannheim, Germany). Small RNAs were extracted by TRIZOL (Ambion). The miDETECT A Track miRNA qRT-PCR Starter kit purchased from RIBOBIO (Guangzhou, China) was used to perform reverse transcription and qPCR analysis according to the manufacturer’s instructions. 5S rRNA, purchased from RIBOBIO, was used as an internal control to normalize miRNA expression. The primers of six selected miRNAs are listed in Table 1. All experiments were performed in triplicate, and relative expression levels were calculated using the 2−∆∆Ct method [19].
2.3. In Silico miRNA Target Site Prediction
Target site prediction of our related miRNAs was based on the CpG DNA sensing pathway, target site conservation, and the thermodynamics of the miRNA–mRNA interaction. We used TargetScan and miRDB software to identify the target sites of our related miRNAs with the 3′UTR of genes encoding cytosolic DNA sensors. Furthermore, to narrow our search, we selected the miRNA–mRNA interactions that were predicted by more than one software (Figure S1, Supplementary Materials).
2.4. Cell Isolation, Culture, and Surface Marker Detection
Bone marrow-derived dendritic cells (BMDCs) were isolated from the femurs and tibias of four sacrificed 4–6-week-old wild-type C57BL/6 mice and treated with red-blood-cell lysing buffer (Beyotime) as described previously [20]. Briefly, bone marrow cells were flushed out and cultured in complete medium (Rosewell park memorial institute (RPMI) 1640 with 10% fetal bovine serum (FBS), 1% streptomycin and penicillin, 10 ng/mL recombinant granulocyte-macrophage colony-stimulating factor (GM-CSF) and interleukin-4 (IL-4)) and placed in six-well plates at 37 °C in 5% CO2. After six days, the non-adherent immature DCs (1 × 10⁶ cells/mL) were harvested and centrifuged to remove debris and dead cells, and then cultured in complete medium overnight. On the next day, cells were transfected with plasmids, miRNAs, and inhibitors and kept for 48 to 72 h for subsequent assays. All samples were transfected with X-tremeGENE HP DNA Transfection Reagent. Transferred cell samples (1 × 10⁶ cells) were washed twice with phosphate buffered saline (PBS) and incubated at 4 ℃ for 30 min with anti-mouse monoclonal antibodies. The antibodies used to detect surface markers are listed in Section 2.6. Finally, cells were analyzed using a Fluorescence-Activated Cell Sorter (FACS) (BD, FACSVerse) after two separate washes. FACS data were analyzed by FlowJo V10 software (FlowJo, China). At least 10,000 DCs were acquired per sample. All results were expressed as mean fluorescence intensity (MFI). HEK 293T cells were cultured in dulbecco’s modified eagle medium (DMEM) medium containing 10% Lonsa, 100 units/mL penicillin, and 100 g/mL streptomycin at 37 °C in 5% CO2, and used for luciferase reporter assays. Cells were transfected with lipofectamine2000 (Invitrogen).
2.5. Plasmids and miRNA Inhibitors
The expression vector for miRNAs was constructed based on the pSilencer4.1 vector (Invitrogen). Selected miRNAs were isolated from the mouse genome (we BLAST the sequence of pri-miRNA with the mouse genome, and then selected the flanking region from both sides of the pri-miRNA to design primers), amplified, and then cloned into pSilencer4.1 between the BamHI and HindIII sites (Figure S2, Supplementary Materials); the primers are listed in Table 2. The 3′UTRs of interferon regulatory factor 7 (IRF7) mRNA targets for miR-29a-5p and the 3′UTRs of TANK-binding kinase binding protein 1 (TBKBP1) mRNA targets for miR-378b were isolated from the mouse genome, amplified, and cloned into the pMIR-Report luciferase vector (Ambion, TX) between the SpaI and HindIII sites (Figure S3, Supplementary Materials); the primers are listed in Table 3. Mutations in the mRNA construct were generated by PCR-based site-directed mutagenesis. The sequence of IRF7 used in the luciferase experiments was changed from 5′–AAATCAG–3′ to 5′–GCTATCA–3′, and the sequence of TBKBP1 was changed from 5′–AAGTCCAA–3′ to 5′–GGTGTAGG–3′. The miRNA inhibitors were designed and purchased from RIBOBIO (Guangzhou, China). These inhibitors are chemically modified single-chain RNAs, which can be easily obtained and used in miRNA function analysis. Each 100 nM miRNA inhibitor (micrOFFTM mmu-miR-29a-5p inhibitor, micrOFFTM mmu-miR-378b inhibitor, and micrOFFTM inhibitor (negative control)) was transfected with X-tremeGENE HP DNA Transfection Reagent into BMDCs for 2 h, before CpG was added. After another 36–48 h, BMDCs were collected for phenotypic analysis with FACS.
Our study was based on the influence of overexpressed and inhibited miR-29a and miR-378b on unstimulated and CpG-stimulated DCs. Therefore, we divided our experimental samples into two different groups. In the first group, we used the pSilencer4.1 vector to overexpress these miRNAs, while, in the second group, we inhibited these miRNAs and examined their influence on unstimulated and CpG-stimulated DCs. CpG and polyinosinic:polycytidylic acid (Poly I:C) were used directly on DCs as a positive control in each group. Empty pSilencer4.1 and unrelated miRNAs were used as a negative control in the overexpression and inhibition group, respectively.
2.6. Reagents and Antibodies
RPMI 1640 and fetal bovine serum were bought from GIBCO (Beijing, China). Recombinant mouse granulocyte-macrophage colony-stimulating factor (GM-CSF) and IL-4 were purchased from Peprotech (Rocky Hill, CT, USA). CpG oligodeoxynucleotides of mouse (1018) phosophorothioated (class-B) [21] at the sites indicated by asterisks (5′–T*G*A*C*T*G*T*G*A*A*C*G*T*T*C*G*A*G*A*T*G*A) were purchased from Novus Biologicals (Centennial, USA). Poly I:C was purchased from Merck (Darmstadt, Germany). X-tremeGENE HP DNA Transfection Reagent was purchased from Roche (Mannheim, Germany). Lipofectamine2000 was obtained from Invitrogen (Shanghai, China). APC-conjugated monoclonal anti-mouse CD11c, PE-conjugated monoclonal anti-mouse CD40 (1C10), PE-conjugated monoclonal anti-mouse CD80 (Clone:16-10A1), PE-conjugated monoclonal anti-mouse CD86 (CloneGL1), APC-conjugated monoclonal anti-mouse MHC (major histocompatibility complex) class II (I-A/I-E) (Clone: M5/114.15.2), APC-conjugated monoclonal anti-mouse CD273 (B7-DC, PD-L2) Clone: TY25, and APC-conjugated monoclonal anti-mouse Siglec-G (Clone: SH2.1) were purchased from eBioscience (San Diego, CA, USA). To detect protein levels, antibodies against the cGAS/STING pathway, cGAS rabbit polyclonal (MB21D1), STING rabbit polyclonal (TMEM173), TANK-binding kinase (TBK1) rabbit polyclonal, signal transducer and activator of transcription 6 (STAT6) rabbit polyclonal (R639), p-STAT6 rabbit polyclonal (phospho-Y641), c-Jun N-terminal kinase 1/2/3 (JNK1/2/3) rabbit polyclonal (P184), p-JNK1/2/3 rabbit polyclonal (phosphor-T183/Y185), p38 rabbit polyclonal (T175), p-p38 rabbit polyclonal (phosphor-Y182), and glyceraldehyde 3-phosphate dehydrogenase (GAPDH) rabbit polyclonal were purchased from Bioworld (Nanjing, China), while IRF3 rabbit monoclonal (EPR2418Y), IRF7 rabbit monoclonal (EPR4718), and TNF receptor-associated factor 6 (TRAF6) rabbit polyclonal were purchased from Abcam (Shanghai, China). Horseradish peroxidase (HRP)-conjugated goat anti-rabbit and goat anti-mouse IgG were also obtained from Bioworld (Nanjing, China). All the antibodies, reagents, chemicals, peptides, recombinant proteins, vectors, inhibitors, commercial assay kits, and software used in this experiment are listed in Table S1, Supplementary Materials.
2.7. Quantitative Real-Time Reverse Transcriptase PCR
BMDCs were isolated from four sacrificed 4–6-week-old wild-type C57BL/6 mice, cultured and collected at 24 h or 48 h after treatment with CpG and miR-29a or miR-378b pSilencer4.1 expression plasmid and miRNA inhibitors. Total RNA was extracted with TRIZOL (Ambion) and used to synthesize complementary DNA (cDNA) with the miScript Reverse Transcriptase (Bio-Rad) according to the manufacturer’s protocol. Gene expression was measured by quantitative real-time PCR using gene-specific primers with QuantiTect SYBR Green PCR master mix (Qiagen). Gene expression was normalized to the internal control using GAPDH. Gene-specific primers are listed in Table 4. All experiments were performed in triplicate, and relative expression levels were calculated using the 2−∆∆Ct method [19].
2.8. Enzyme-Linked Immunosorbent Assay (ELISA)
The supernatant obtained from the culture of BMDCs was used to perform ELISA of cytokines. Concentrations of TNF-α, IFN-β, C-C motif chemokine ligand 20 (CCL20), and IL-12 in the supernatants were measured using ELISA kits (SenBeiJia Biological Technology Co., Ltd. Nanjing, China) according to the manufacturer’s instructions. The sensitivity of the assay was 25 ng/L for TNF-α, 2 ng/L for IL-12, 3 ng/L for IFN-β, and 5 ng/L for CCL20.
2.9. Western Blotting Analysis
BMDCs were isolated from six sacrificed mice and transfected with miRNA pSilencer4.1 expression plasmid and miRNA inhibitors, and then stimulated with CpG and poly I:C at 48 h. Cells were washed twice with ice-cold phosphate-buffered saline (PBS), and lysed with radio immunoprecipitation assay (RIPA) lysis buffer (Biosharp Life Sciences, Beijing, China) and 1% phenyl methyl sulfonyl fluoride (PMSF) protease inhibitor (Solarbio, Beijing, China) for 5 min on ice. Samples were electrophoresed on 10% SDS polyacrylamide gel and transferred to a polyvinylidene difluoride (PVDF) membrane (Biorad, Hercules, CA, USA). After blocking with 5% non-fat milk or 5% bovine serum albumin (BSA) in Tris-buffered saline (TBS) buffer containing 0.05% Tween-20, the membrane was incubated with respective primary antibodies, followed by HRP-conjugated secondary antibodies in the blocking reagent. After extensive washing with TBST, immune reactive bands were analyzed by film exposure after enhanced chemiluminescence (ECL) reaction (Millipore, Bedford, MA, USA). All bands from Western blot were analyzed with Image J software (San Diego, US) to verify the relative expression level.
2.10. Dual Luciferase Assay
The predicted target genes were isolated from the mouse genome, and mutations in the mRNAs construct were generated by PCR-based site-directed mutagenesis and cloned into pMIR-Report luciferase vector (Figure S3, Supplementary Materials); the primers are listed in Table 3. To determine the expression of targeted genes with related miRNAs, HEK 293T cells were seeded into a 24-well plate and transfected with 200 ng of various expression plasmids along with 200 ng of pMIR-Report luciferase plasmid; an empty plasmid was used as a control, and 50 ng of pRL-TK plasmid was used as a transfection control. Cells were lysed 48 h post transfection, and a luciferase assay was performed using the dual luciferase reporter assay kit Promega (Madison, WI, USA), according to the manufacturer’s protocol, on a Mudulud Single-tube multimode reader (Promega, Madison, WI, USA).
2.11. Statistical Analysis
The results were expressed as means ± SD and analyzed with GraphPad Prism v6.01 (San Diego, US). One-way analysis of variance (ANOVA) was employed to determine significant differences among multiple groups, followed by Tukey’s or Dunnett’s multiple comparison tests. Blank samples containing untransfected DCs were compared with positive controls (CpG and Poly I:C), while all other samples (miR-29a/miR-378b, CpG + miR-29a/miR-378b, inhibitors of miR-29a/miR-378b, and CpG + inhibitors of miR-29a/miR-378b) were compared with control groups (pSilencer4.1 and negative control for miRNA). Differences were considered to be statistically significant when p < 0.05. Statistical significance in the figures is indicated as follows: **** p < 0.0001, *** p < 0.001, ** p < 0.01, * p < 0.05; ns, not significant. Data were combined from at least three independent experiments unless otherwise stated.
3. Results
3.1. CpG Influences miRNAs Level in Bone Marrow-Derived Dendritic Cells (BMDCs)
In the present study, we focused on CpG-stimulated DC maturation and identification of the miRNAs that may influence CpG activity in BMDCs. We selected miRNAs with high and low expression levels in BMDCs after CpG stimulation based on our previous work [18] (Figure 1A). Compared with other studies [22], we found six miRNAs with altered expression in different populations of DCs. Among these commonly selected miRNAs, mmu-miR-29a, mmu-miR-222, and mmu-miR-361 increased, while mmu-miR-98, mmu-miR-196a-2, and mmu-miR-378b decreased in activity in DCs after CpG stimulation (Figure 1B). To confirm the previously obtained microarray data, we examined the expression of six miRNAs listed above, which were stimulated by CpG in mouse BMDCs. qPCR results showed that all miRNAs exhibited peak expression at 48 h, while miR-29a and miR-378b showed continuous increases in significance over various time intervals (Figure 1C). Therefore, we selected miR-29a and miR-378b for further experiments, and we constructed and verified their overexpression vector (Figure 1D) (Figure S2, Supplementary Materials). Moreover, we examined the suppressive effect of an miR-29a and miR-378b inhibitor. The results suggested that miR-29a slightly decreased in expression after inhibition, while miR-378b significantly decreased after inhibition compared to the negative control (Figure 1E). In addition, we found that mir378b was significantly elevated in CpG-stimulated DCs with miR-378b inhibition, but no change was observed in CpG-stimulated DCs with miR-378 overexpression (Figure 1D,E). These results suggest that expression of the selected miRNAs is consistent with our previous microarray data, and that miR-378b influences the activity of CpG on BMDCs.
3.2. miR-29a and miR-378b Regulate Co-Stimulatory Molecules of BMDCs
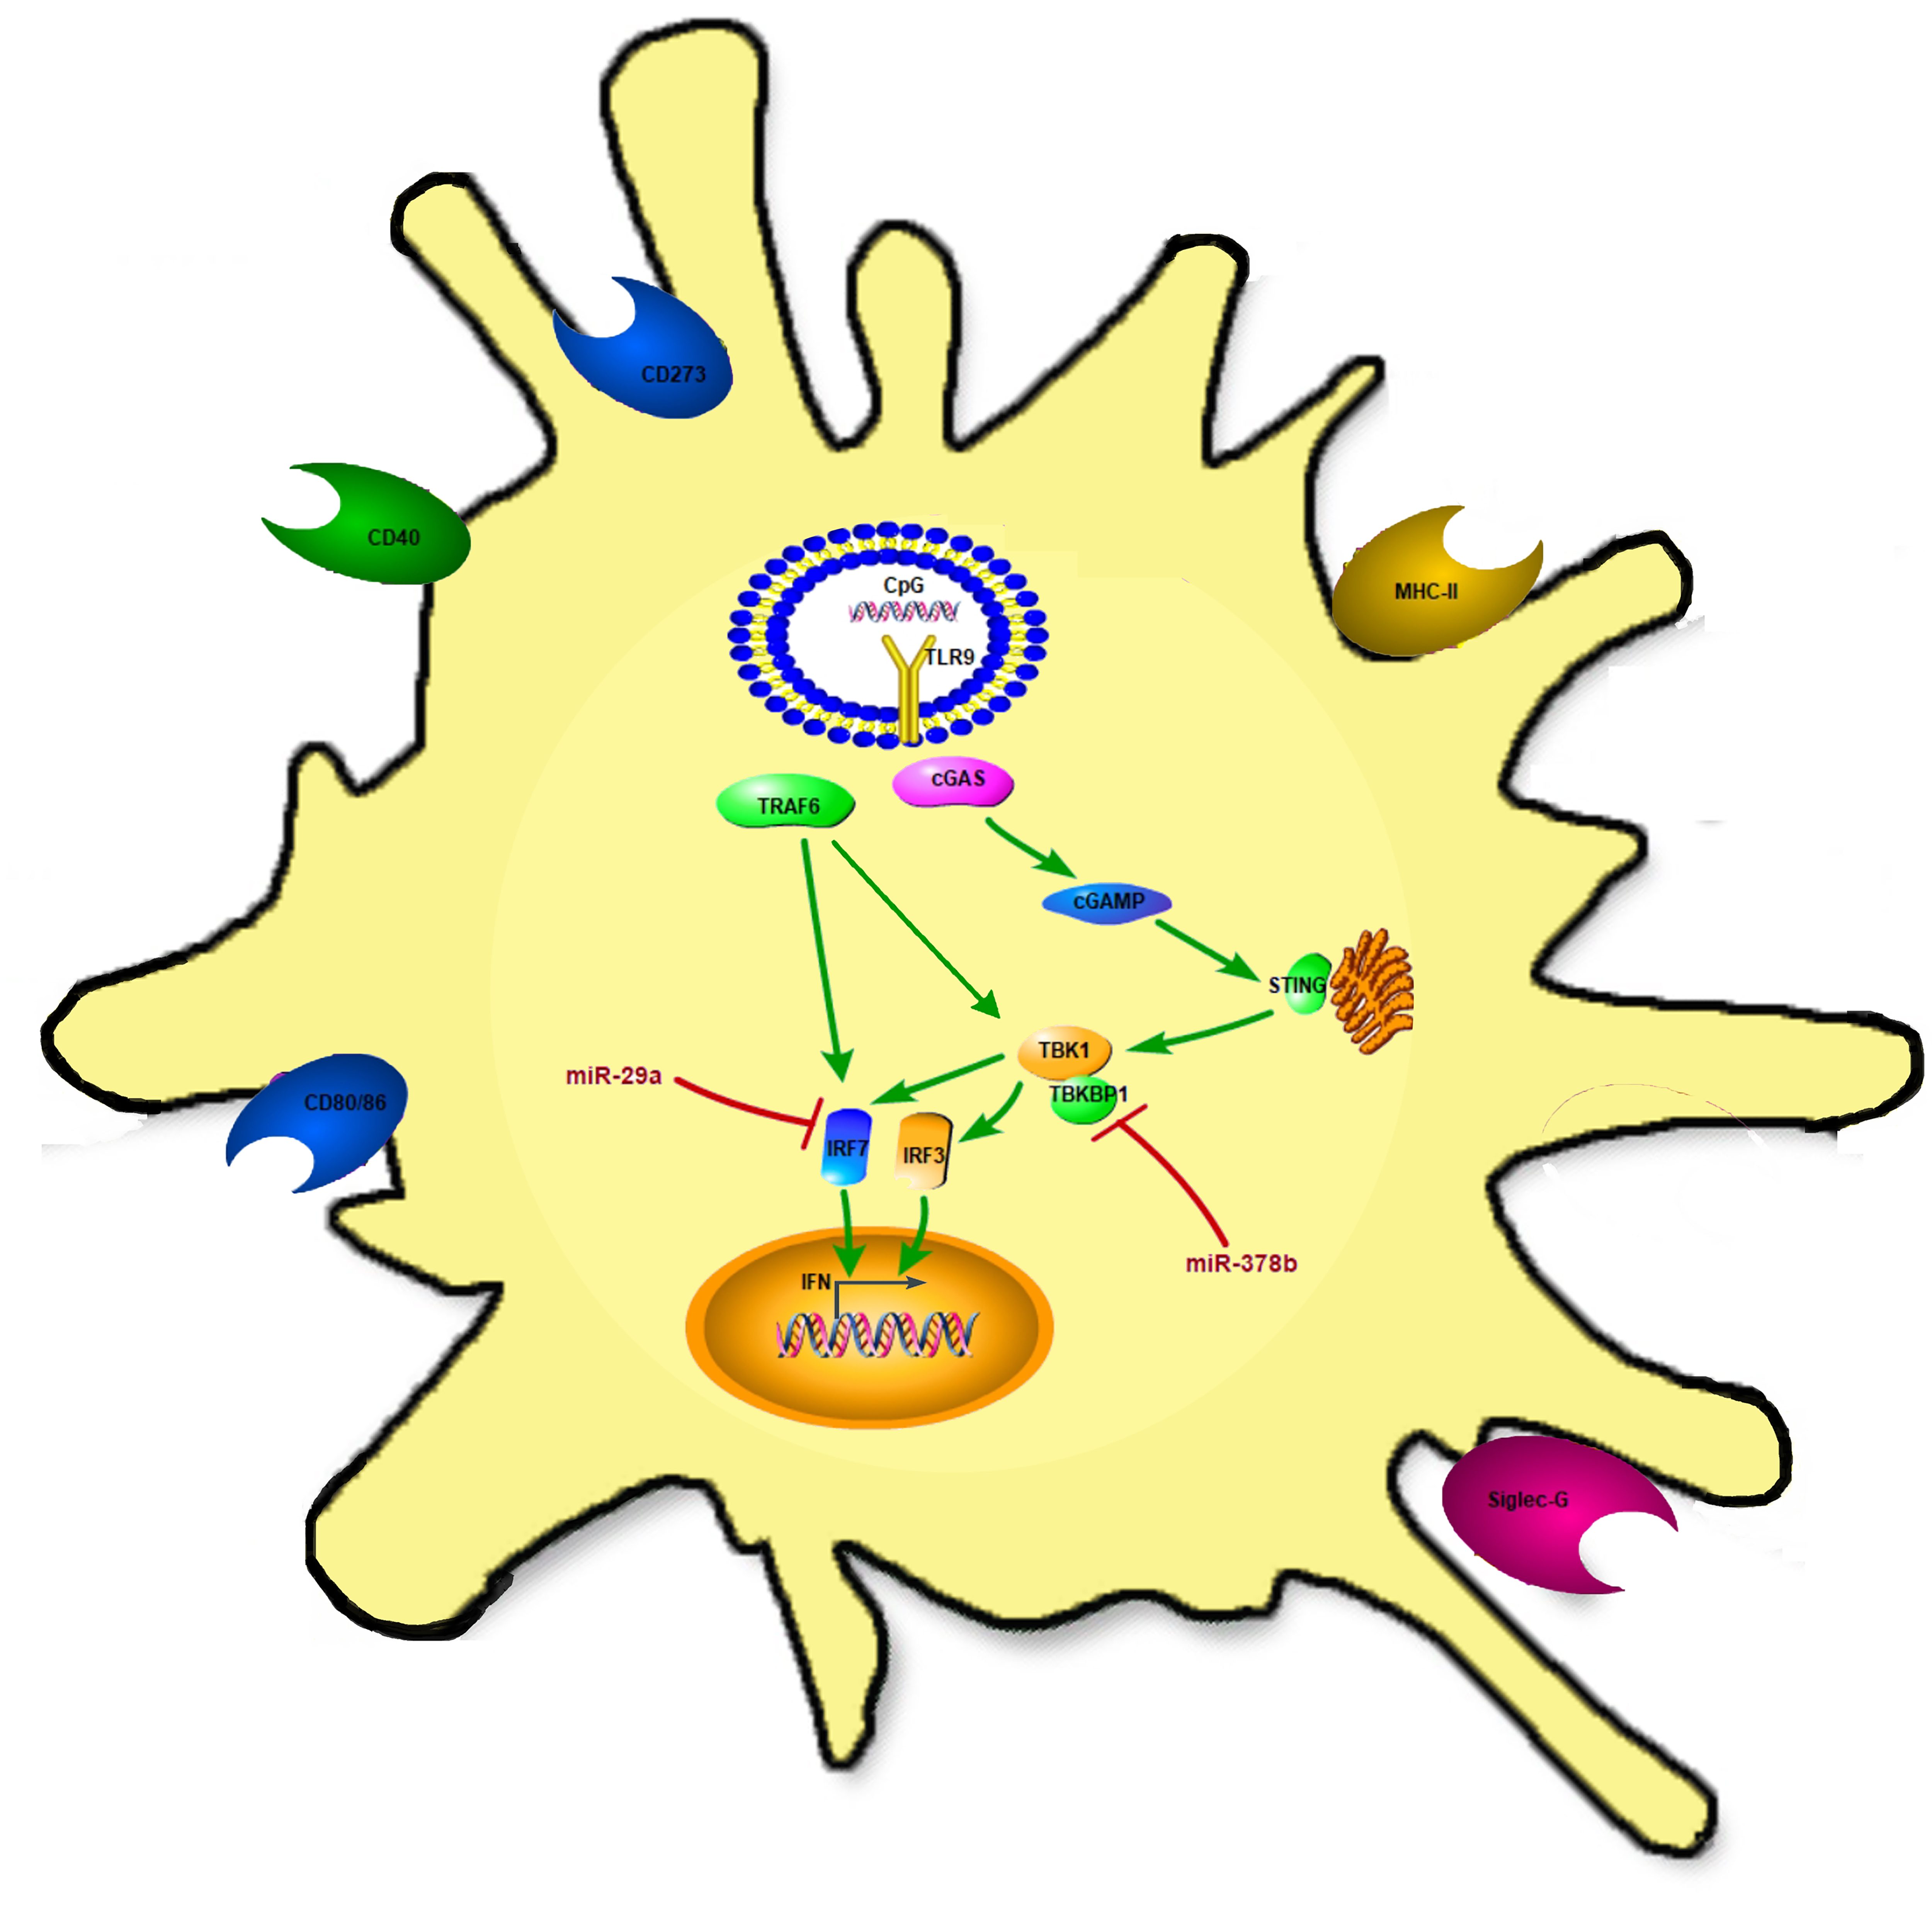
Consistent with previous research, the present study revealed that miRNAs can regulate the immune responses of DCs [18,20,23,24,25]. In this study, we examined phenotypic changes in CpG-stimulated or unstimulated DCs treated with miR-29a and miR-378b. Fluorescence-activated cell sorting (FACS) results for the surface marker MHCII showed that the mean fluorescence intensity (MFI) of MHCII was enhanced in DCs treated with miR-29a and CpG-stimulated DCs pretreated with overexpressed miR-29a compared to the control group (Figure 2A). In addition, CpG-stimulated DCs preincubated with miR-29a/miR-378b overexpression groups showed significantly reduced expression of CD80 compared with the control group (Figure 2C). Furthermore, the MFI values of CD86 and CD40 increased significantly in the miR-29a/miR-378b and CpG-stimulated miR-29a/miR-378b overexpression groups (Figure 2E,G). Compared with the CpG stimulation group, CpG-stimulated DCs treated with miR-29a/miR-378b inhibitor showed increased MFI for CD40 and CD86 (Figure 2F,H). In addition to the phenotypic alteration of BMDCs, morphological results also indicated that CpG stimulation could accelerate DC maturation. Interestingly, CpG-stimulated DCs preincubated with miR-378b negatively influenced DC maturation compared to those with miR-378b (Figure S4, Supplementary Materials). Together, our results indicate that the selected miRNAs increased co-stimulatory molecules (MHCII, CD40, and CD86) of BMDCs.
3.3. miR-29a and miR-378b Modulate the Immunosuppressive Molecules CD273 and Siglec-G in DCs
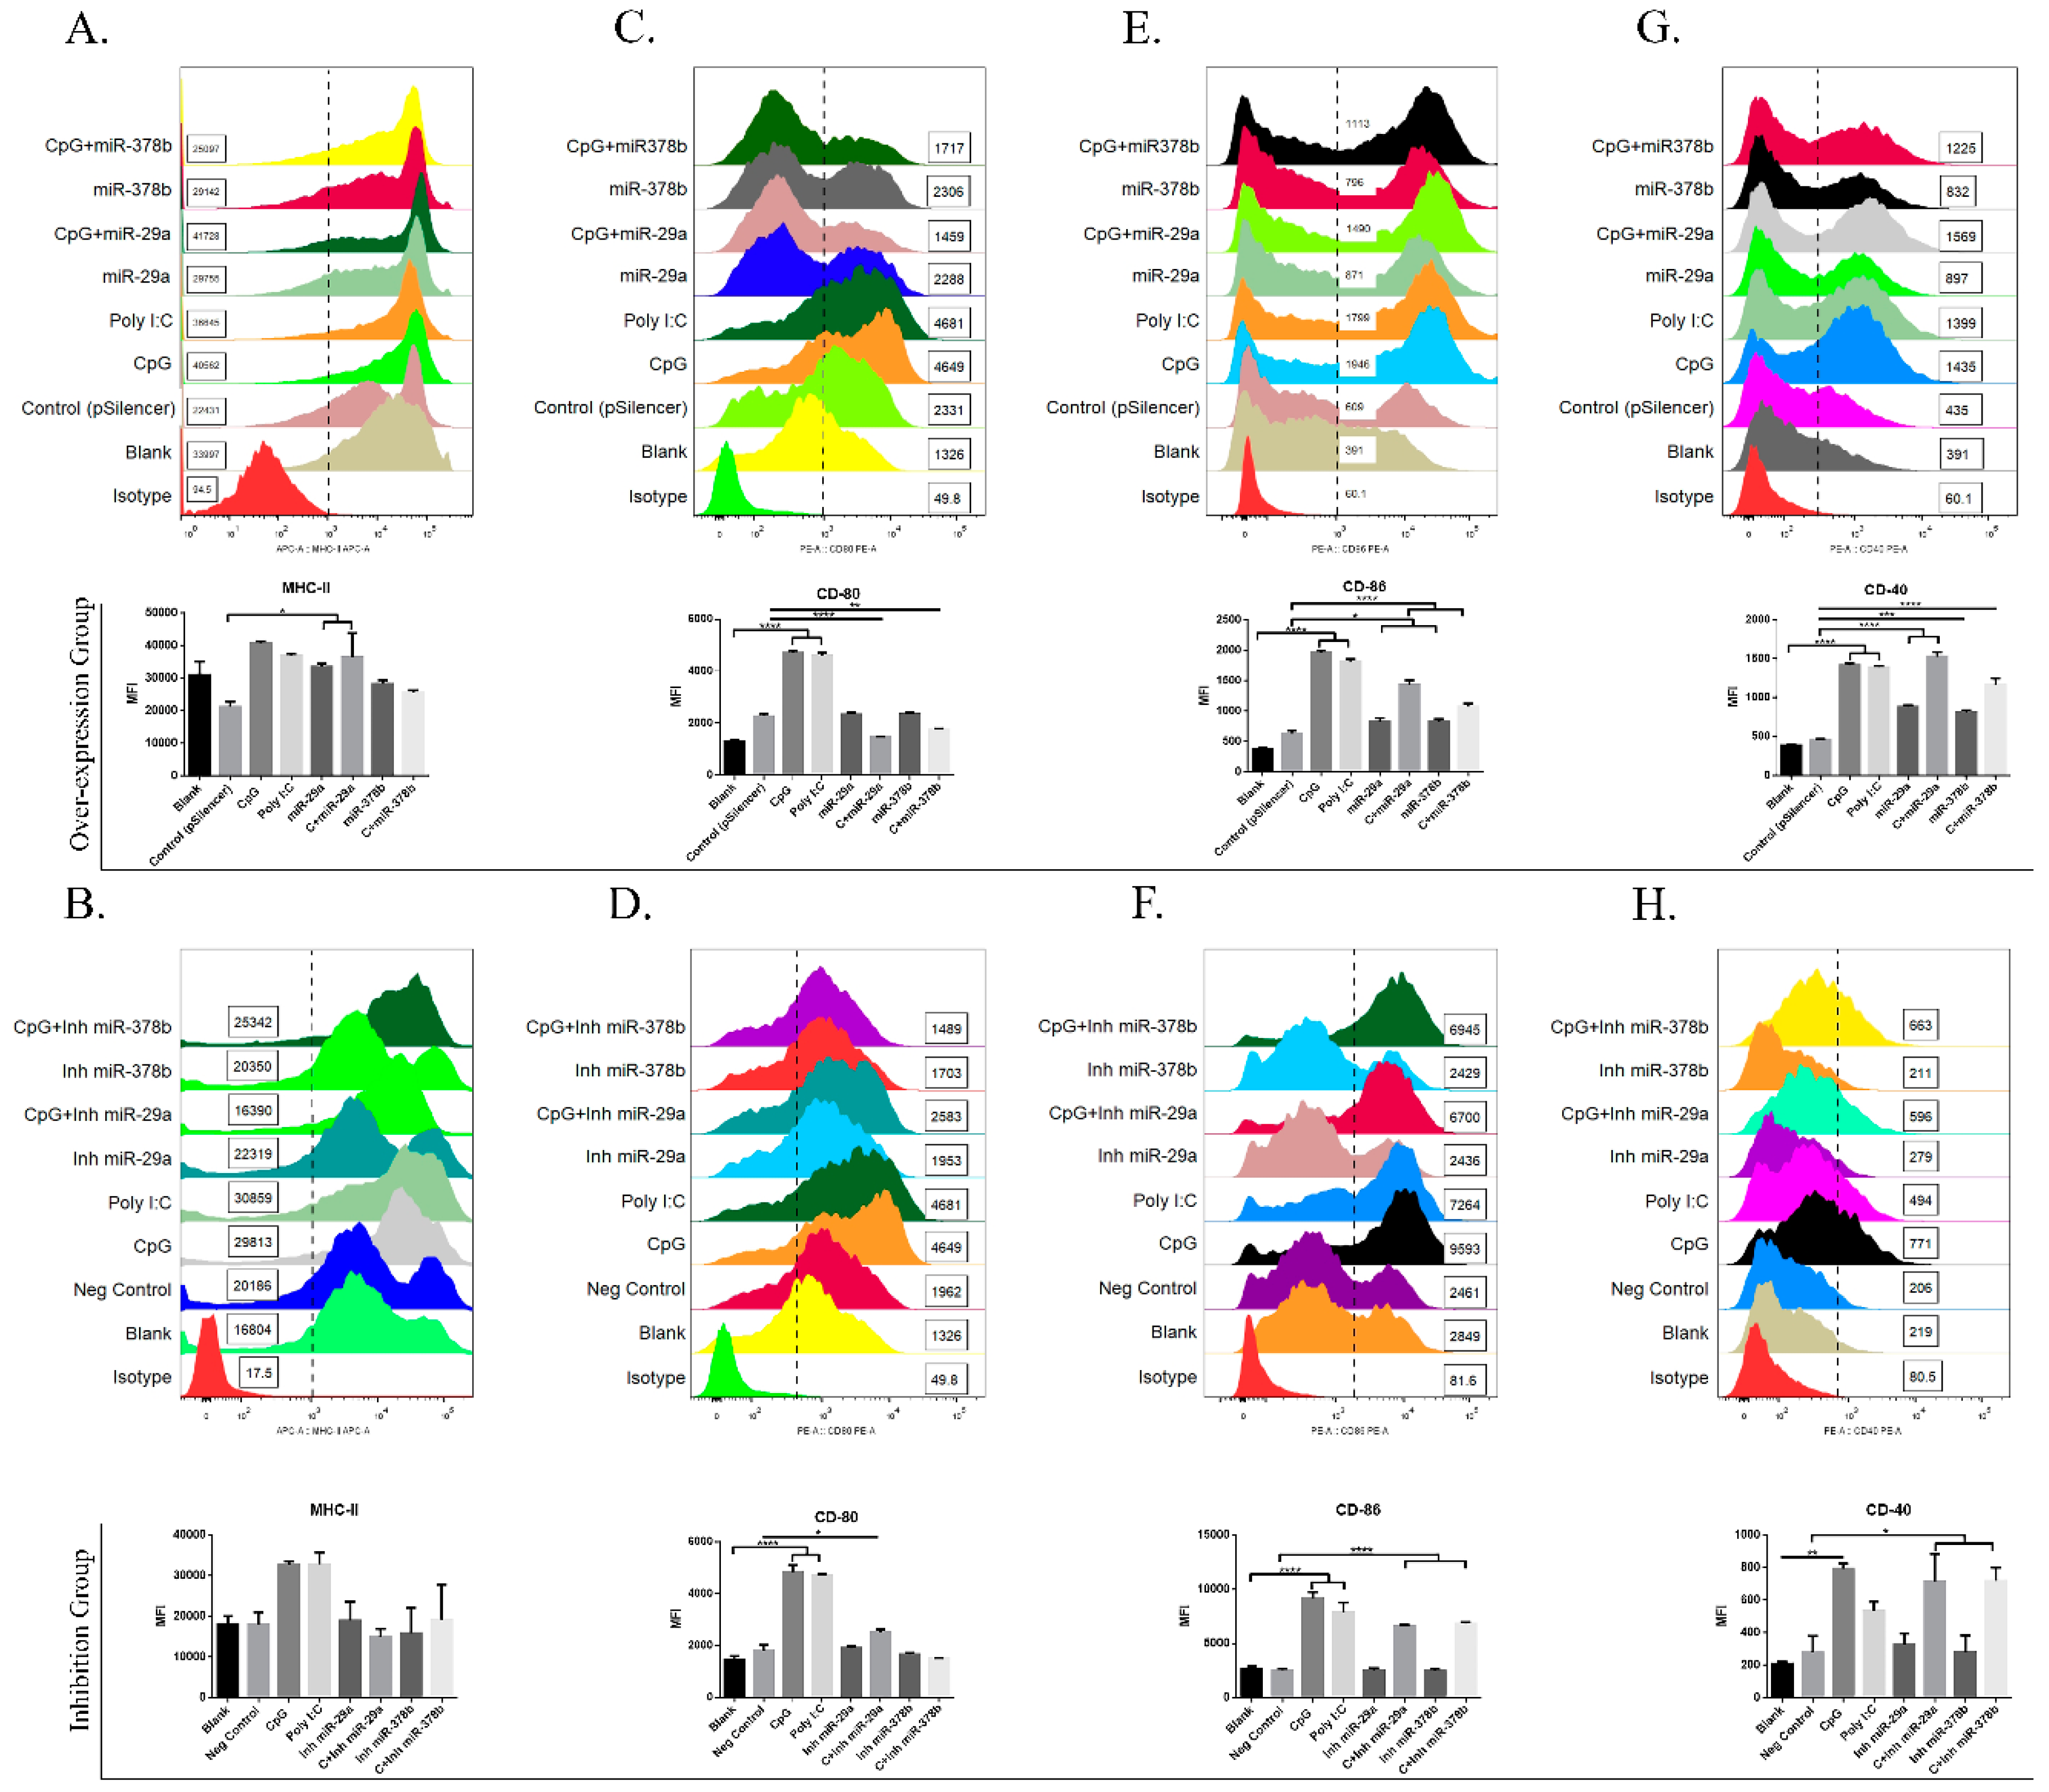
As CD273 and Siglec-G are well-known immunosuppressive molecules in DCs [2,3,26], we examined their phenotypic changes with overexpression or inhibition of miR-29 and miR-378b. The initial results showed that CD273 was significantly upregulated in DCs treated with miR-29a and CpG-stimulated DCs preincubated with miR-29a/miR-378b overexpression groups compared to the control group (Figure 3A). Moreover, Siglec-G was significantly downregulated in DCs treated with miR-29a/miR-378b and in CpG-stimulated DCs pretreated with miR-29a/miR-378b overexpression groups (Figure 3C). Meanwhile, the inhibitor groups did not show any significant changes in CD273 or Siglec-G (Figure 3B,D). These results suggest that miR-29a and miR-378b influence the immunosuppressive molecules of BMDCs.
3.4. miR-29a and miR-378b Influence the cGAS/STING Pathway
3.4.1. mRNA Analysis of cGAS/STING Pathway Changes Stimulated by miR-29a and miR-378b
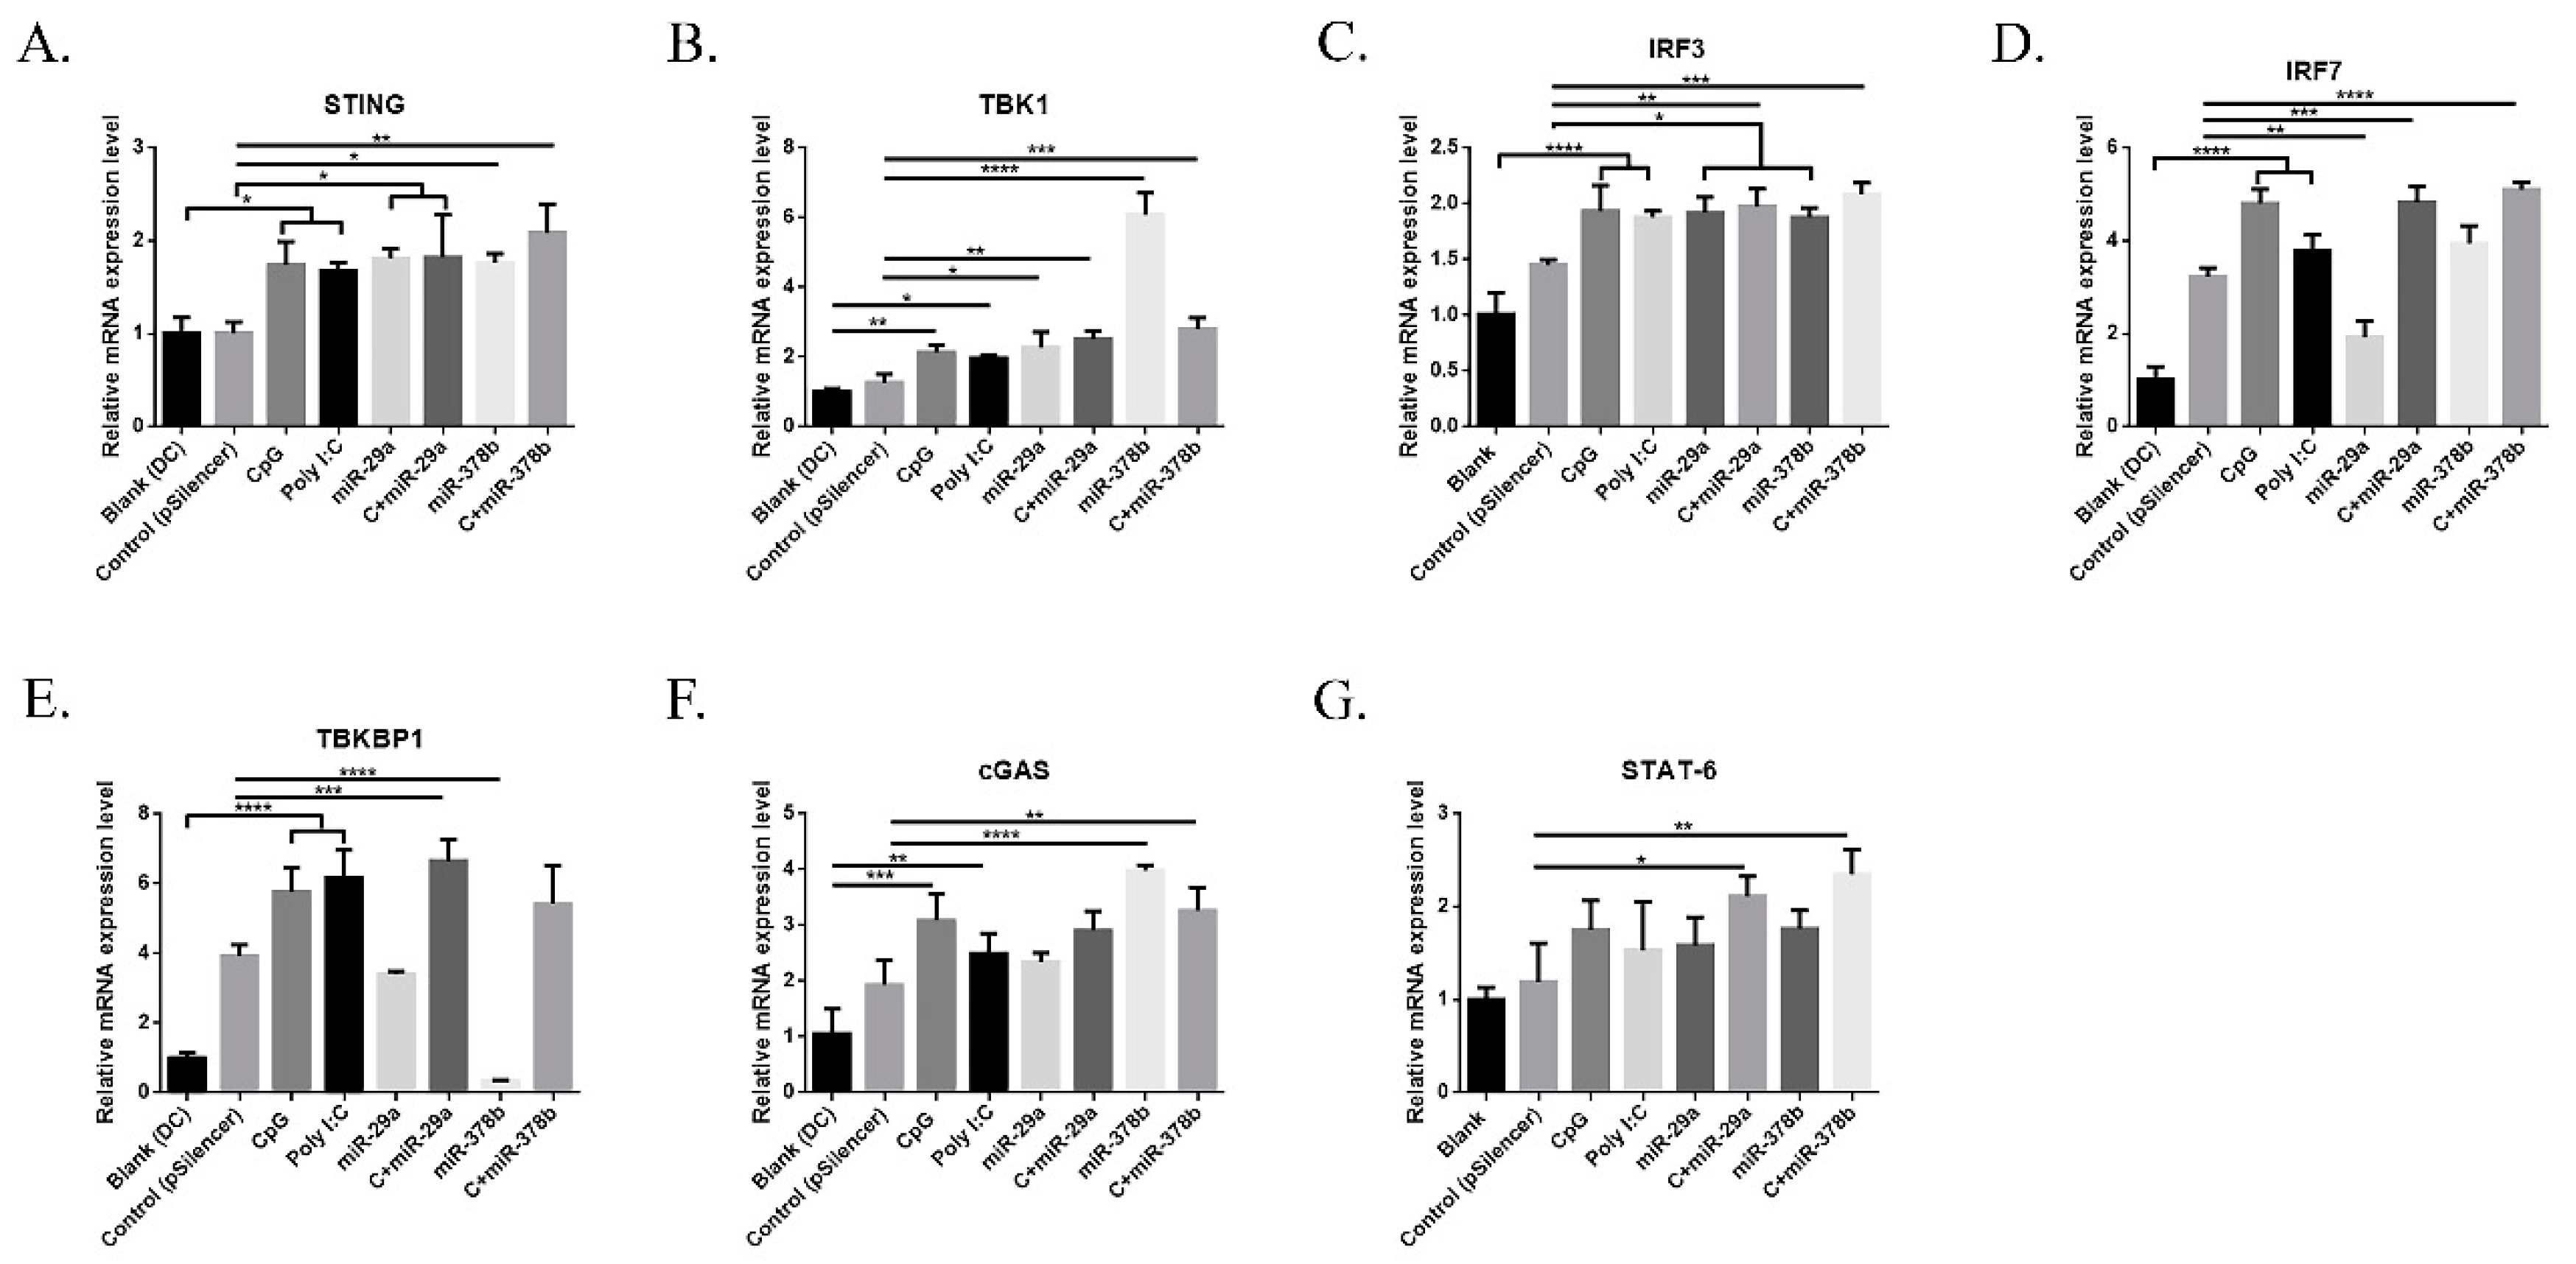
CpG is recognized by Toll-like receptor 9 (TLR9), a surface receptor that is expressed intracellularly by certain immune cells. The cGAS/STING pathway acts as a cytosolic DNA sensor, inducing type I IFN production [27]. In this study, we firstly investigated mRNA expression of the cGAS/STING pathway in miR-29a and miR-378b overexpression and inhibition groups. Initially, BMDCs treated with miR-29a/miR-378b showed significantly increased mRNA levels of STING, TBK1, and IRF3 (Figure 4A–C). Moreover, the mRNA level of IRF7 was reduced by 40% compared to pSilencer4.1 in the miR29a overexpression group (Figure 4D). miR-378b caused strong downregulation of TBKBP1 (Figure 4E), but caused upregulation of cGAS (Figure 4F). However, the inhibition of miR-29a and miR-378b did not lead to any significant change in the cGAS/STING pathway (Figure S5, Supplementary Materials). CpG-stimulated BMDCs pretreated with miR-29a showed significantly upregulated mRNA levels of IRF7 compared to the miR-29a group (Figure 4D), indicating that miR-29a might target IRF7. Interestingly, we also found that CpG-stimulated DCs preincubated with miR-378b exhibited significantly decreased expression of TBK1 but increased expression of TBKBP1 compared to miR-378b (Figure 4B,E). This finding indicates that miR-378b might bind with TBKBP1 to block TBK1 function, thereby influencing the cGAS/STING pathway in DCs.
3.4.2. cGAS/STING Pathway Regulatory Proteins Influenced by miR-29a and miR-378b
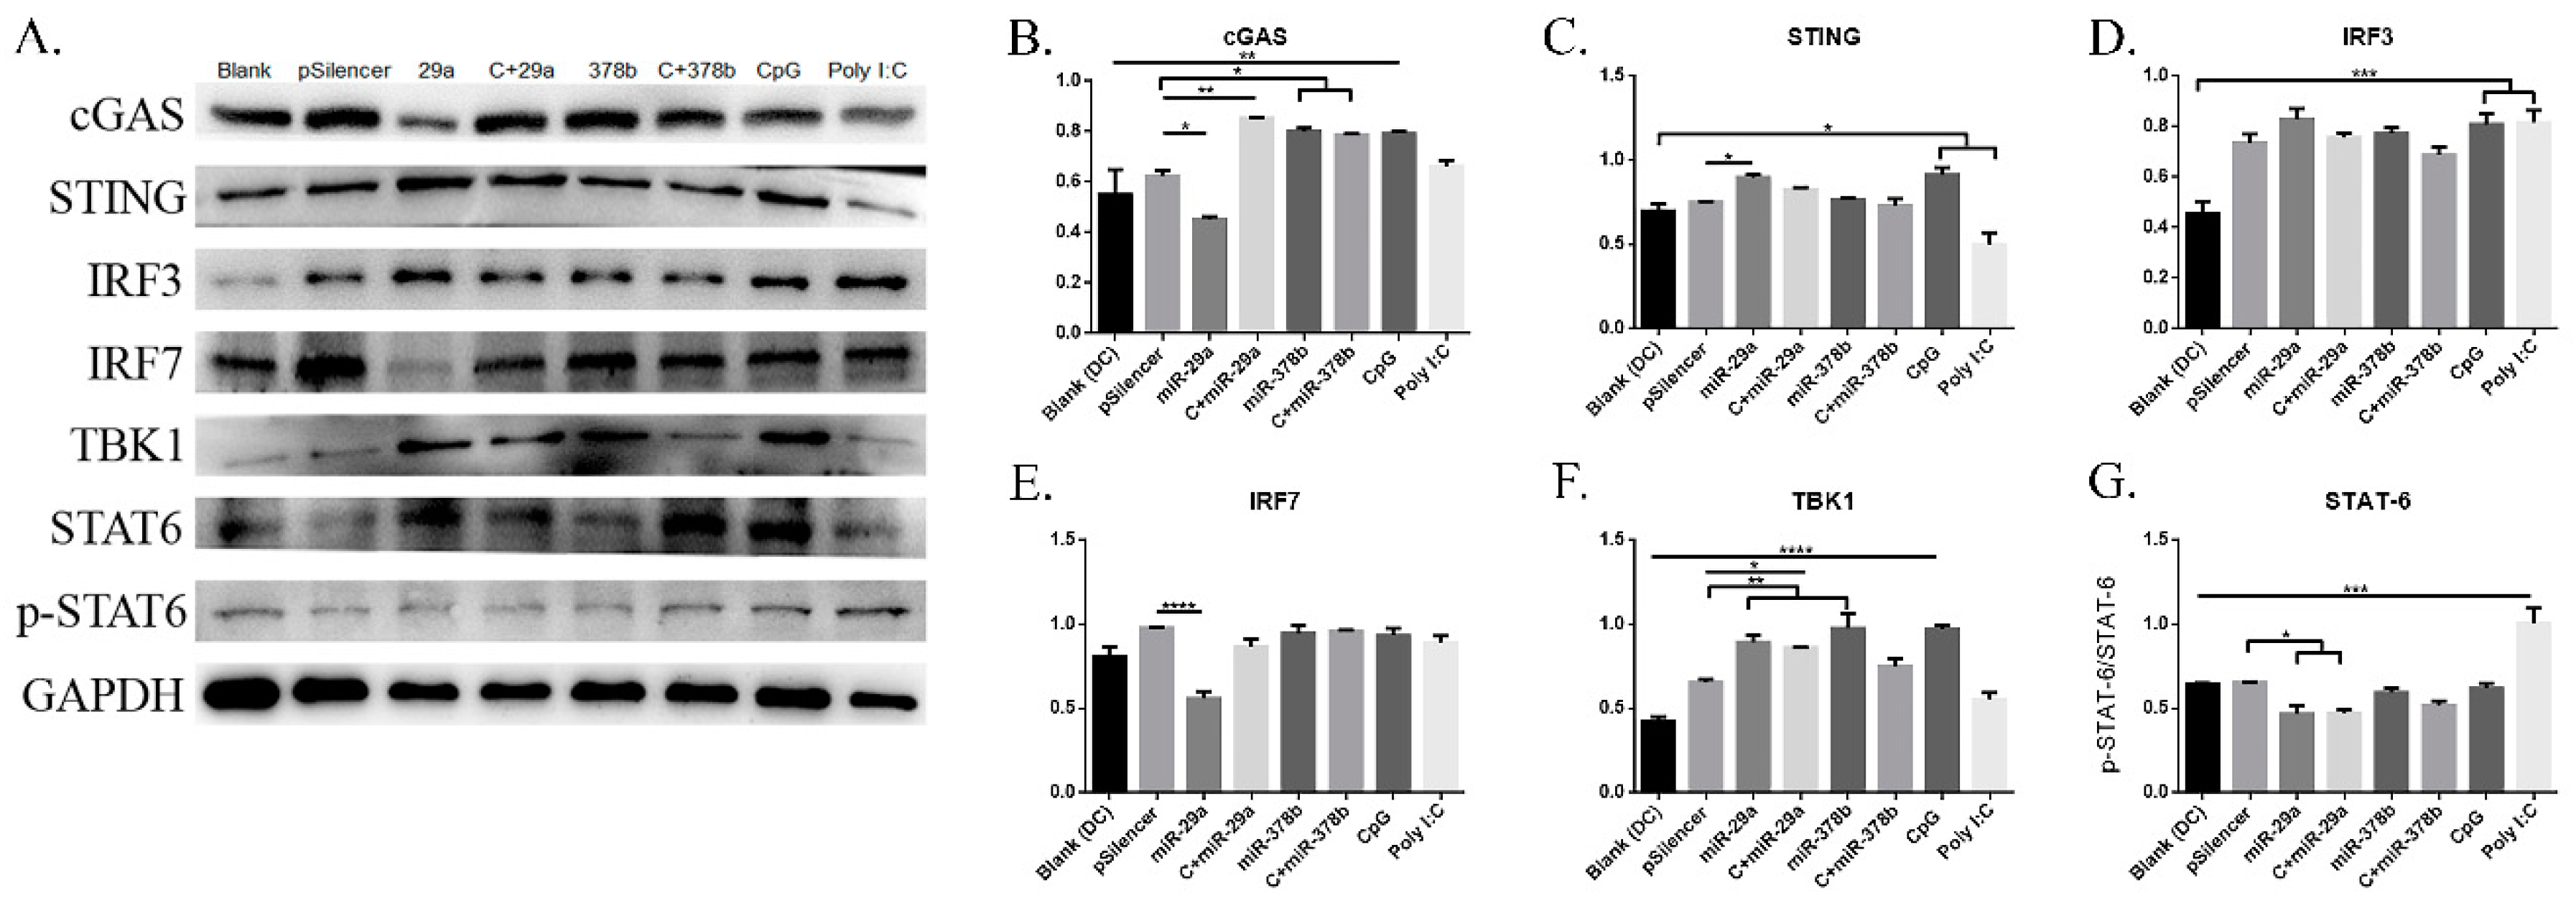
The experiment described above demonstrated that miR-29a and miR-378b could activate the cGAS/STING pathway at the mRNA level. Therefore, we continued to examine their effects on the cGAS/STING pathway at the protein level (Figure 5A) (Figure S6A,B, Supplementary Materials). We found that DCs treated with miR-29a showed significantly decreased protein levels of cGAS and STAT-6 (Figure 5B,G), but increased levels of STING and TBK1 (Figure 5C,F). Specifically, the protein level of IRF7 was reduced by 50% compared to pSilencer4.1 in the miR-29a overexpression group (Figure 5E). Moreover, CpG-stimulated DCs pretreated with miR-29a showed increased expression of cGAS and TBK1 (Figure 5B,F), but decreased expression of STAT-6 (Figure 5G). We also found that miR-378b significantly enhanced protein levels of cGAS and TBK1 (Figure 5B,F), consistent with the qPCR results. Finally, CpG-stimulated DCs preincubated with miR-378b showed highly elevated cGAS protein levels (Figure 5B). Together, these results suggest that IRF7 could be regulated by miR-29a, while TBK1 could be affected by miR-378b.
3.5. miR-29a and miR-378b Infliuence Mitogen-Activated Protein Kinase (MAPK) and TRAF6 Pathways in CpG-Stimulated BMDCs
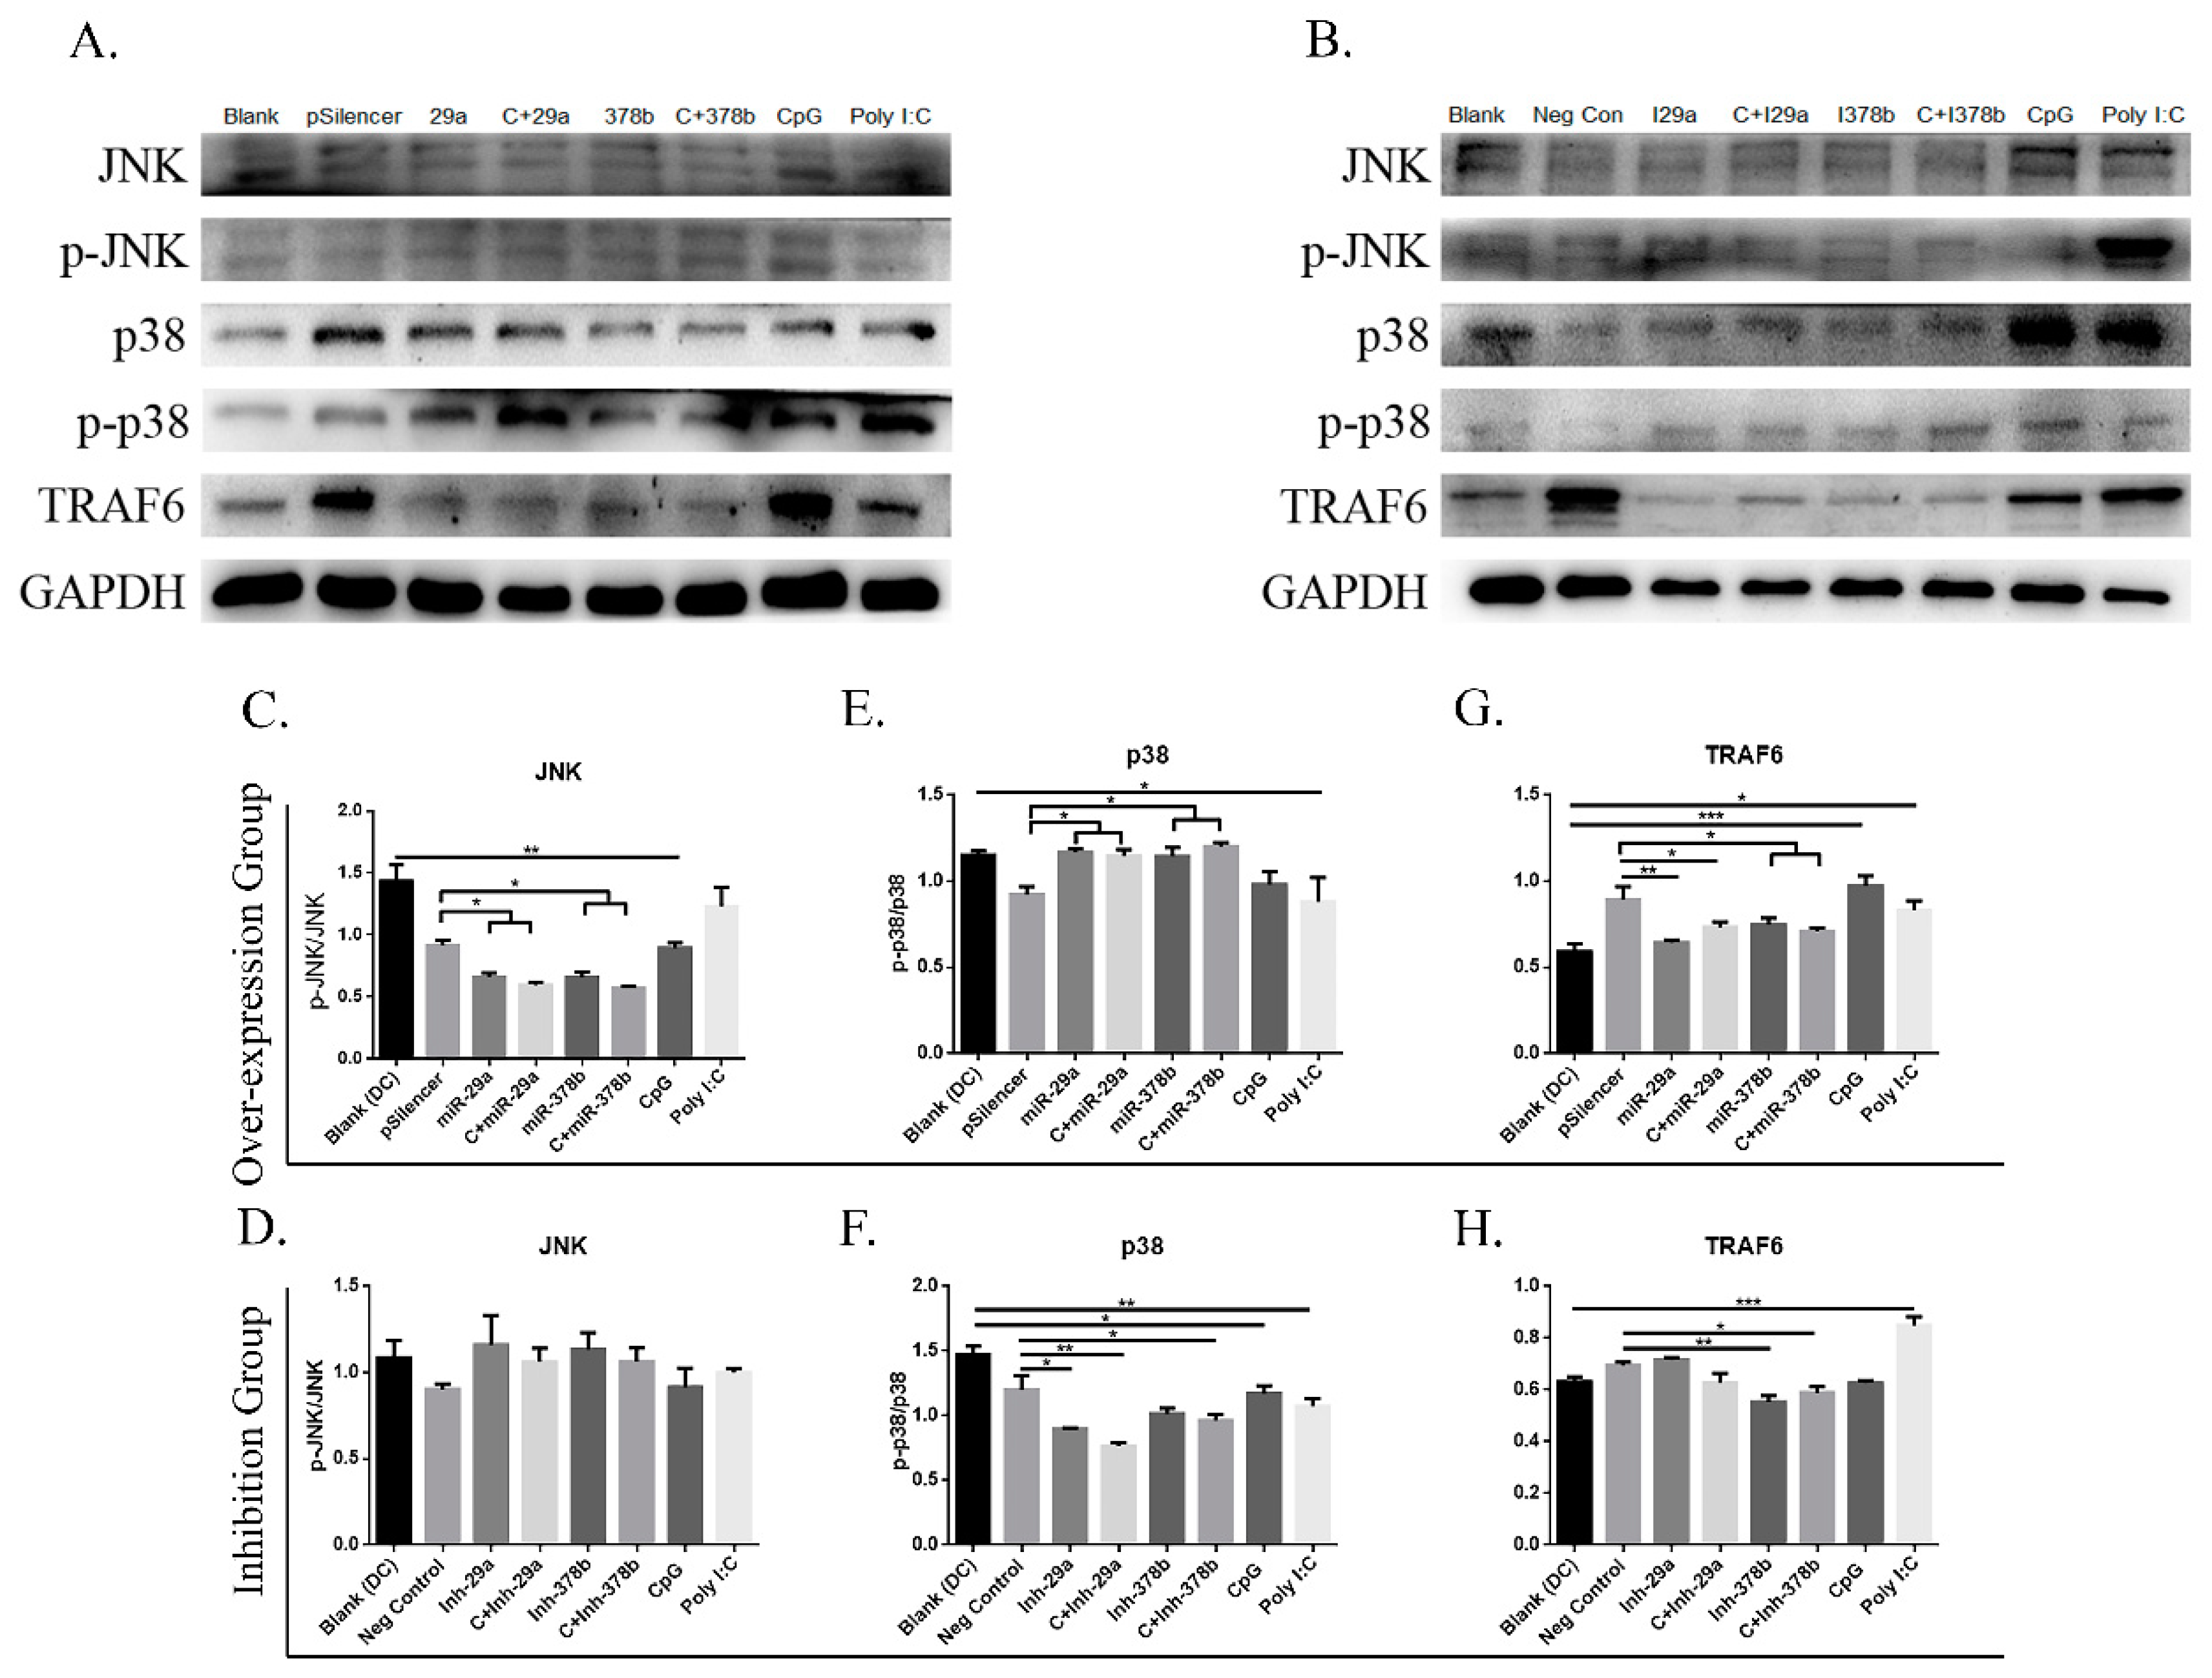
MAPKs are generally expressed in all cell types and play important roles in regulating gene expression and immunological responses [28,29]. To explore the mechanisms underlying CpG induction of miRNAs in BMDCs, we examined the effect of CpG on the activities of MAPKs and TRAF6, and their involvement in miRNA expression in DCs (Figure 6A,B). Firstly, we found that DCs incubated with miR-29a/miR-378b and CpG-stimulated DCs preincubated with miR-29a/miR-378b overexpression groups showed significantly decreased protein levels of p-JNK/JNK, while no change was observed after inhibition (Figure 6C,D). Secondly, the results showed that DCs treated with miR-29a/miR-378b and CpG-stimulated DCs preincubated with miR-29a/miR-378b overexpression groups had significantly increased protein levels of p-p38/p38, which was reduced in the corresponding inhibition groups (Figure 6E,F). Thirdly, we investigated TRAF6 expression at both the mRNA and protein levels. The results suggested that the protein level of TRAF-6 was downregulated in all overexpression groups (Figure 6G). Interestingly, the mRNA levels of miR-29a and miR-378b are associated with increased TRAF6 after CpG stimulation (Figure S7A, Supplementary Materials). Furthermore, NF-κB essential modulator (NEMO), which is an adapter in the nuclear factor kappa-light-chain-enhancer of activated B cells (NF-κB) and IRF signaling pathways [30], and which connects the IκB kinase (IKK) complex with TBK1 [31], showed no significant changes in mRNA level in the overexpression or inhibition groups (Figure S7A,B, Supplementary Materials).
3.6. CpG-Induced miRNAs Influence Cytokine Secretion by DCs
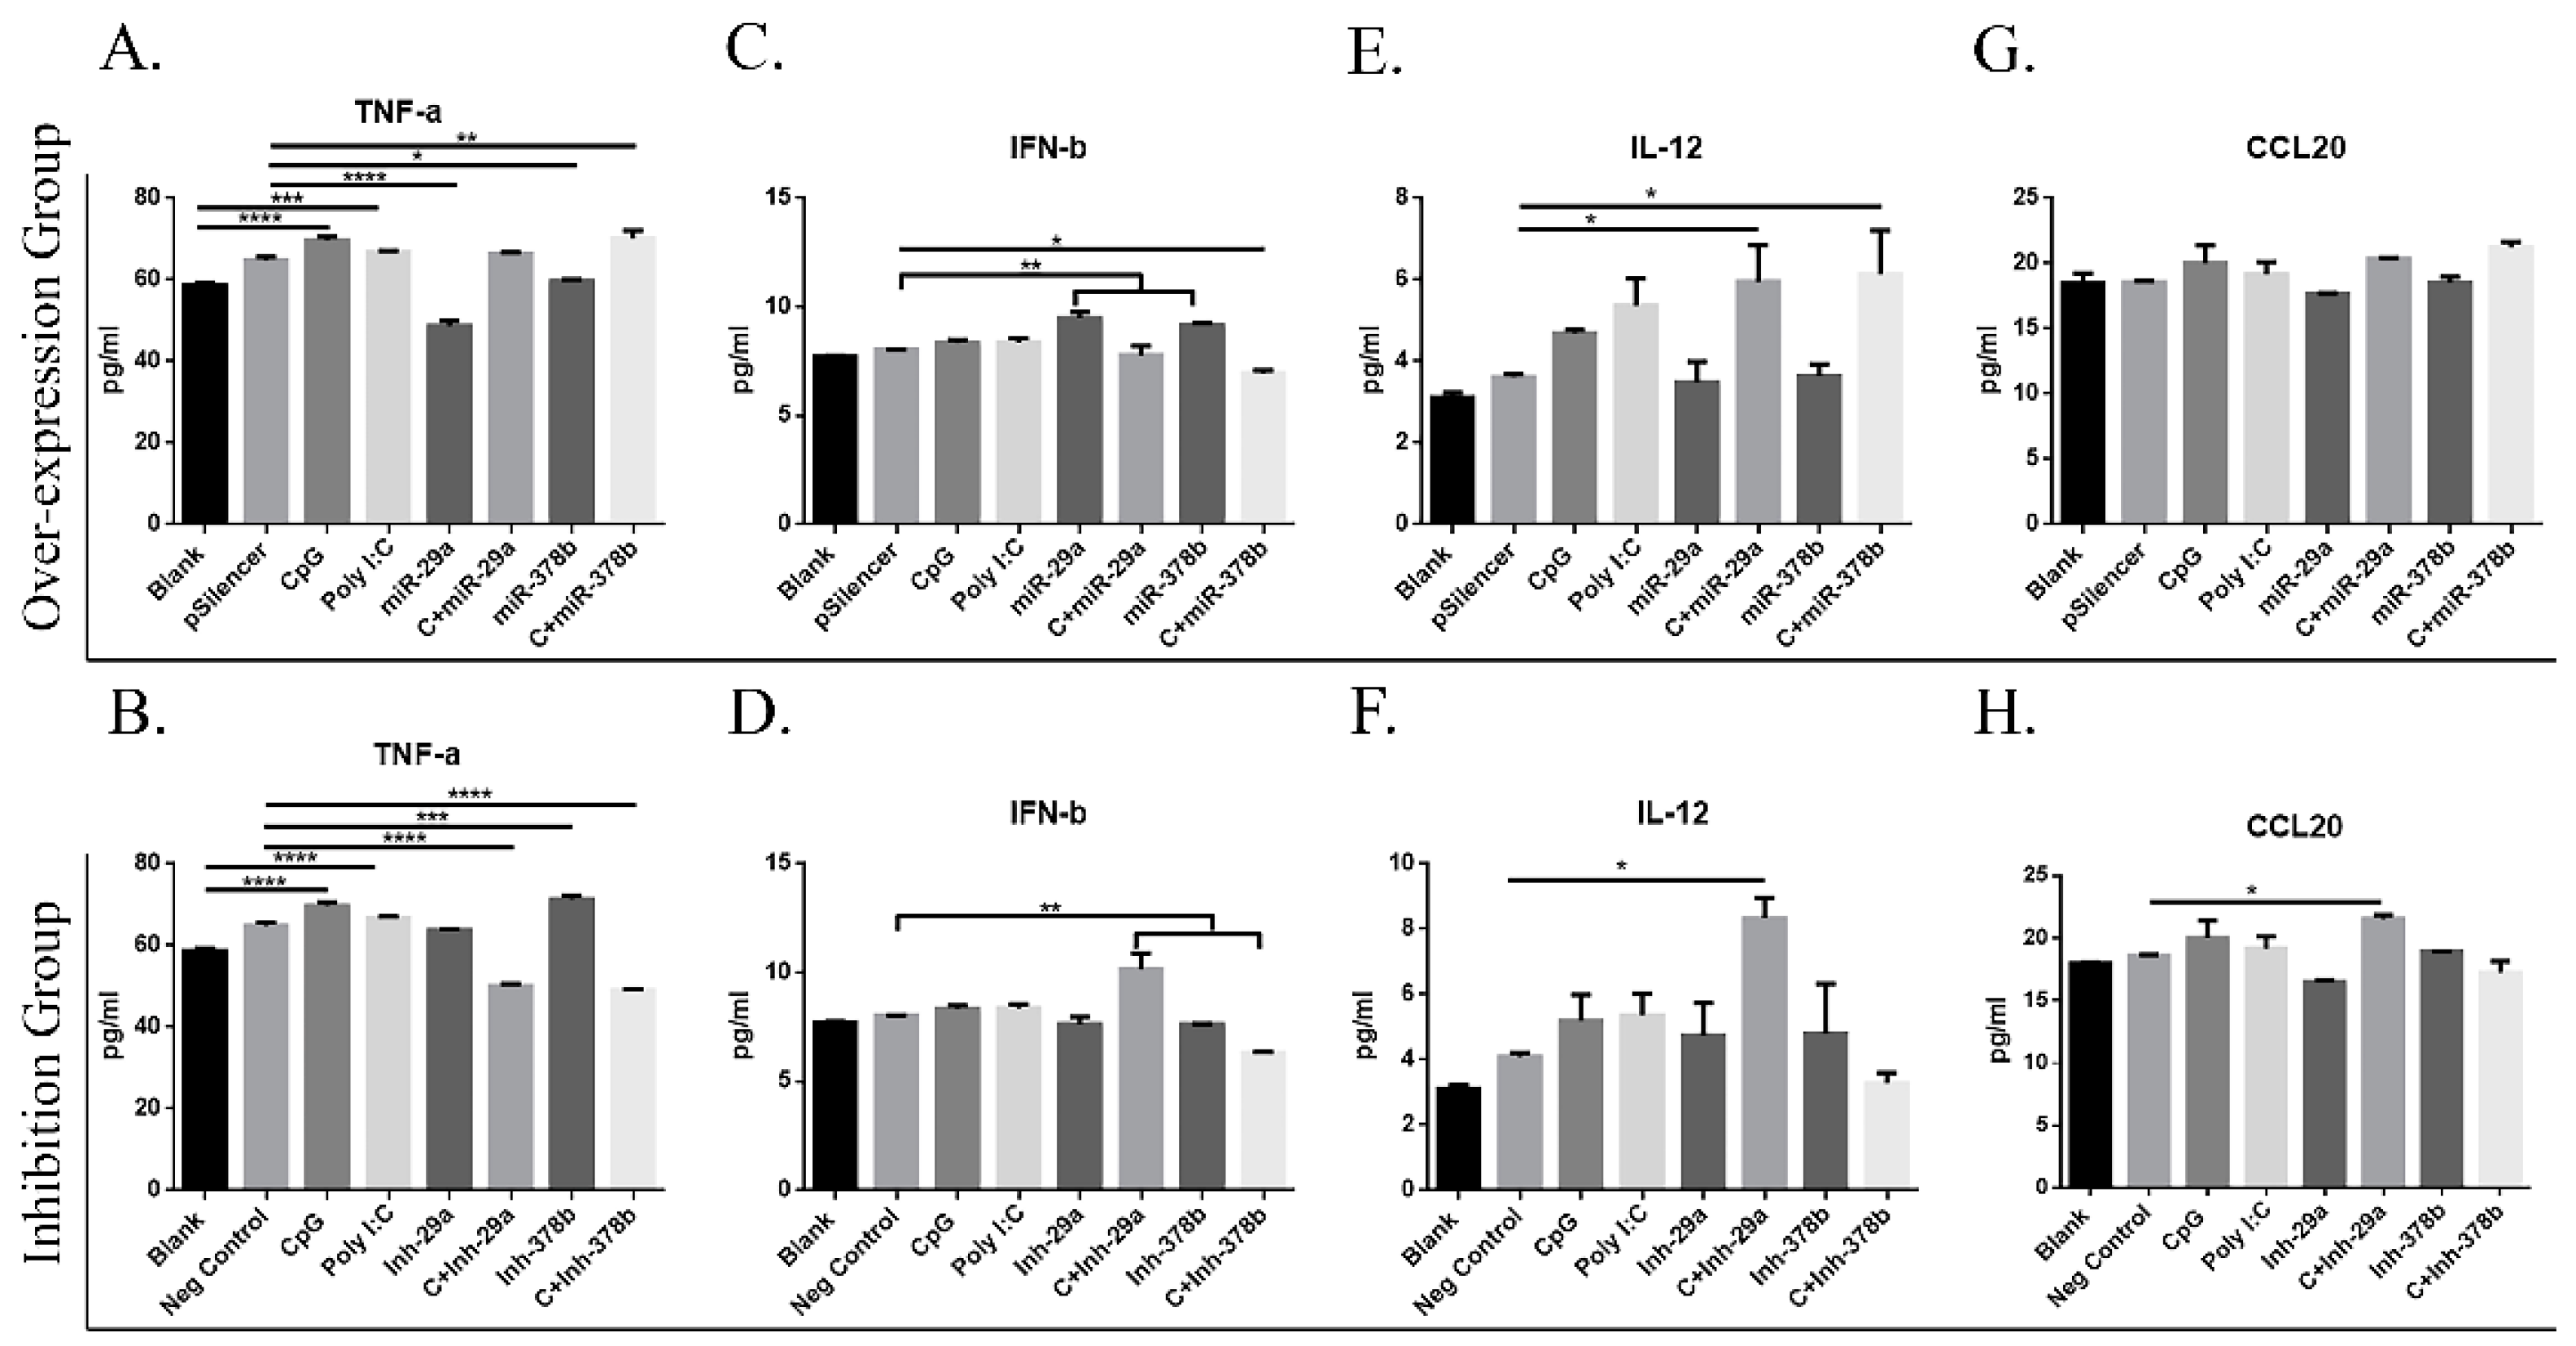
Recent studies revealed that CpG can directly induce DC maturation by promoting cytokine secretion [10]. Cell supernatants were harvested, and cytokine levels were determined to assess the ability of DCs to activate lymphocytes and secrete cytokines. The results showed that miR-29a and miR-378b significantly inhibit TNF-α production in the overexpression group (Figure 7A). IFN-β production was significantly enhanced with miR-29a and miR-378b in the overexpression group (Figure 7C), while no significant change was observed after inhibition (Figure 7D). Interestingly, CpG-stimulated DCs pretreated with an inhibitor of miR-29a showed enhanced IFN-β production (Figure 7D). The chemokine CCL20 plays an important role in the cGAS/STING pathway, but the expression of CCL20 is studied primarily in lymphocytes. Therefore, we examined whether CCL20 is exposed in DCs. The results showed no change in IL-12 or CCL20 production by DCs (Figure 7E–H). Furthermore, CpG-stimulated DCs preincubated with an inhibitor of miR-378b showed dramatic changes compared to the overexpression group in IL-12 and TNF-α production. Together, these results show that miRNAs stimulated by CpG can influence cytokine production by DCs and that miR-378b enhances CpG activity in cytokine production.
3.7. miR-29a and miR-378b Target Prediction and Validation
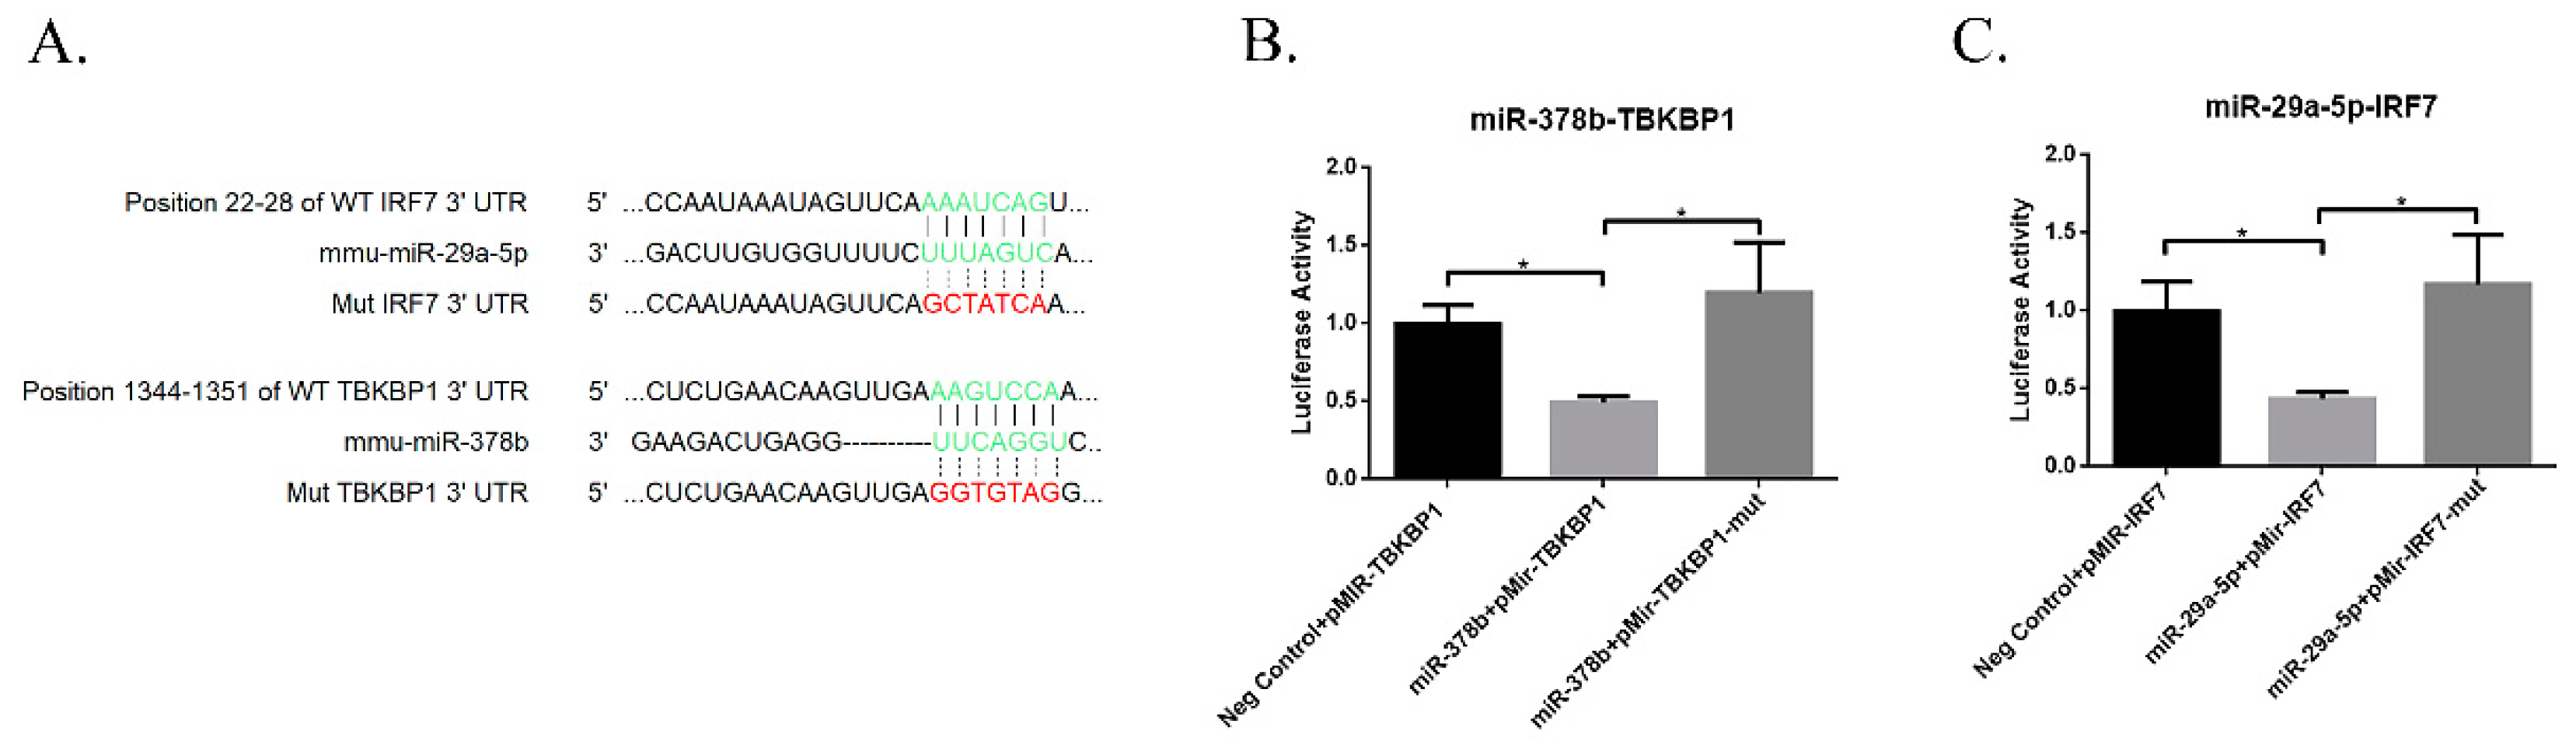
Numerous studies showed that miRNAs bind to the 3′ untranslated region and regulate gene expression by degrading mRNA or interfering with protein translation. To identify the potential targets of miR-29a and miR-378b, we performed a search using TargetScan and miRDB software to predict target genes of miR-29a and miR-378b (Figure S1, Supplementary Materials). Consistent with our qPCR and Western blot results, we found that miR-29a-5p binds IRF7, while miR-378b binds TBKBP1 (Figure 8A). We performed dual luciferase reporter assays to confirm the target site prediction for these miRNAs. The results showed that TBKBP1 and IRF7 significantly reduced luciferase activity compared to the negative control group, whereas TBKBP1 and IRF7 significantly reduced luciferase activity when the binding sites were mutated (Figure 8B,C).
4. Discussion
The cGAS/STING signaling pathway plays a pivotal role in cytosolic DNA sensing and elicits strong activation of DCs in the immune response [12,32]. CpG is a powerful tool for regulating the maturation of DCs, boosting the immune response against a wide variety of pathogens, enhancing cancer and allergy therapies, and developing prophylactic or therapeutic vaccines [6,11]. miRNAs are responsible for dynamic changes in gene expression and regulate innate antiviral responses [13,17]. In this study, we focused on the effects of miR-29a and miR-378b on naïve or CpG-stimulated BMDCs in term of phenotypic changes and cytokine production, as well as the cGAS/STING and MAPK/TRAF6 pathways.
Accumulating evidence revealed that miRNAs inhibit key regulatory components of the innate immune response and markedly affect the capacity of DCs to undergo phenotypic changes [22,23,33,34]. Our findings suggest that both miR-29a and miR-378b could enhance DC maturation by increasing surface marker expression of CD40 and CD86 in the naïve condition. However, when BMDCs were stimulated with CpG, the results differed. miR-378b treatment did not affect the surface markers (MHCII and CD80) when DCs were stimulated with CpG. On other hand, CD273 and Siglec-G are immunosuppressive molecules. Siglec-G inhibits DC cross-presentation and suppresses the innate immune response [2,35,36]. CD273 binds to the programmed cell death protein-1 (PD-1) receptor on T-cells and causes downregulation of various functions, including T-cell proliferation and cytokine production [37]. Consistent with Abomaray [26], we found that miR-29a and miR-378b significantly increased the expression of CD273, but significantly reduced the expression of Siglec-G molecules in BMDCs. When miR-378b was inhibited, CD273 decreased significantly. Together, our results suggest that miR-378b and miR-29a might be inhibitory miRNAs.
To further demonstrate the inhibitory function of miR-378b, we detected the cytokine production of TNF-α, IFN-β, IL-12, and CCL20. Ma found that miRNA-29 family members control the immune system and host–pathogen interactions and influence cytokine (IFN, TNF, and interleukin) signaling in response to bacterial and viral infections [38]. The miR-378 family was observed to influence cell proliferation, and to suppress tumour growth and angiogenesis through various signaling pathways and cytokine production patterns [39,40,41,42,43,44,45]. Our findings show that miR-29a increases IFN-β production and decreases the expression of TNF-α. When miR-29a was inhibited, combined with CpG treatment, a significant decrease in TNF-α and a significant increase in IFN-β production were observed compared with the CpG group without inhibition. miR-378b reduced the expression of the pro-inflammatory cytokine TNF-α and increased IFN-β production. Thus, miR-29a and miR-378b regulate cytokine production by DCs, and miR-378b has an inhibitory role, suppressing the stimulatory effect of CpG on activating cytokine secretion.
Recent findings showed that CpG-stimulated DCs induce the MAPK [18,46] and cGAS/STING signaling pathways [12,47]. cGAS/STING is an essential cytosolic DNA sensing pathway that drives the induction of the DNA-mediated immune response, irrespective of cell type or DNA sequence [48,49,50]. Recently, cGAS and STING were identified as intracellular sensors that activate the interferon pathway and mediate host defense; this role might be influenced by miRNAs [12,32,49]. Wu showed that miR25/93 mediates hypoxia-induced immunosuppression by repressing cGAS [51], and Huang revealed that miR-24 regulates STING in rats [15]. Similarly, our results showed that miR-378b could bind TBKBP1 and increase the expression of TBK1 to activate the cGAS/STING pathway. Unlike miR-378b, we found that miR-29a could bind IRF7 and activate STING/TBK1/IRF3. Moreover, miR-29a could downregulate TRAF6 expression, which might be involved in reducing the antiviral response, consistent with research by Carrie [52]. In addition, Chunyan found that JNK and p-38 kinases are involved in CpG-induced CD40 expression in BMDCs [46]. Nagalingam showed that miR-378 reduces the activity of MAPK [53]. Consistent with that result, our research showed that both miR-29a/miR-378b and CpG-stimulated miR-29a/miR-378b groups had significantly elevated p-p38/p38 signaling and decreased p-JNK/JNK signaling.
5. Conclusions
In summary, we describe an interaction between miRNAs and CpG, promoting the activation of BMDCs. Firstly, we selected six miRNAs whose expression levels were altered by CpG in BMDCs. Secondly, we found that the interaction of miR-29a and miR-378b substantially regulates the maturation of DCs by influencing immune function, including through phenotypic alteration and cytokine production. Thirdly, we demonstrated that miR-378b could target TBKBP1 to activate the cGAS/STING pathway, while miR-29a binds to IRF7 to inhibit IRF7/TRAF6. These findings elucidate the role of miRNAs in the regulation of CpG-stimulated DC maturation, which may accelerate studies on immune response and vaccine production. We present a previously uncharacterized mechanism for miRNA-mediated restriction of the cytosolic DNA sensing pathway.
Supplementary Materials
The following are available online at https://0-www-mdpi-com.brum.beds.ac.uk/2076-393X/7/4/197/s1: Figure S1: The Venn diagram showing the miRNA–mRNA interaction predicted from two different software, TargetScan and miRDB in common: (A) mmu-miR-29a-5p target site IRF7 prediction from TargetScan and miRDB in common (B) mmu-miR-378b target site TBKBP1 prediction from TargetScan and miRDB in common; Figure S2: Identification and construction of pSilencier4.1-mmu-miR-29a and pSilencier4.1-mmu-miR-378b by digestion of BamHI and HindIII. (A) Identification of constructed pSilencier4.1-mmu-miR-29a by digesting with BamHI and HindIII (M: DL10,000 DNA Marker, 1 and 2: mmu-miR-29a and Plasmid pSilencier4.1 digested with BamHI and HindIII). (B) Identification of constructed pSilencier4.1-mmu-miR-378b by digesting with BamHI and HindIII (M: DL10,000 DNA Marker, 1 and 2: mmu-miR-378b and Plasmid pSilencier4.1 digested with BamHI and HindIII); Figure S3: Identification and construction of pMIR-Report vector-IRF7, and pMIR-Report vector-TBKBP1 by digesting HindIII and SacI. (A) Identification of constructed pMIR-Report vector-IRF7-wild type digesting by HindIII and SacI (M: DL10,000 DNA Marker, 1 and 2: amplified IRF7 wild-type gene and pMIR-Report vector digested with HindIII and SacI). (B) Identification of constructed pMIR-Report vector-IRF7-mutant digestion by HindIII and SacI (M: DL10,000 DNA Marker, 1 and 2: amplified IRF7 mutant and pMIR-Report vector digested with HindIII and SacI). (C) Identification of constructed pMIR-Report vector-TBKBP1-wild type digesting by HindIII and SacI (M: DL5,000 DNA Marker, 1: amplified TBKBP1 wild-type gene and pMIR-Report vector digested with HindIII and SacI). (D) Identification of constructed pMIR-Report vector-TBKBP1-mutant digested by HindIII and SacI (M: DL5,000 DNA Marker, 1: amplified TBKBP1 mutant and pMIR-Report vector digested with HindIII and SacI); Figure S4: Phenotypic alterations of mouse immature BMDCs in response to CpG and miRNAs. Morphological observation of BMDCs stimulated by GM-CSF and IL-4 for seven days (line 1: only DCs (blank sample), line 2: DCs transfected with pSilencer4.1 and negative control for miRNAs, line 3: DCs stimulated with CpG and Poly I:C, line 4: DCs transfected with miR-29a and inhibitor of miR-29a, line 5: CpG-stimulated DCs transfected with miR-29a and inhibitor of miR-29a, line 6: immature DCs transfected with miR-378b and inhibitor of miR-378b, line 7: CpG-stimulated DCs transfected with miR-378b and inhibitor of miR-378b); Figure S5: Results of qPCR analysis following stimulation by inhibited miR-29a and miR-378b of cGAS/STING pathway related genes: cGAS, STING, TBK1, IRF3, IRF7, TBKBP1, and STAT6. All these expressions were normalized with GAPDH mRNA expression level. These results are taken from three independent experiments. Significant differences between the blank and positive control groups and group treated by pSilencer4.1 are expressed as * p < 0.05, ** p < 0.01, *** p < 0.001, and **** p < 0.0001, determined by one-way ANOVA with Tukey’s multiple comparison test; Figure S6: cGAS/STING pathway regulatory protein expression on BMDCs stimulated by miR-29a and miR-378b determined by Western blot. (A) Western blot results in naïve DCs and DCs stimulated by CpG with inhibited miR-29a and miR-378b for the total protein level of GAPDH, cGAS, STING, IRF3, IRF7, TBK1, STAT6, and phosphorylated STAT6 (lane 1: blank group; lane 2: control (pSilencer4.1)-stimulated group; lane 3: miR-29a-stimulated group; lane 4: CpG-added miR-29a-stimulated group; lane 5: miR-378b-stimulated group; lane 6: CpG-added miR-378b-stimulated group; lane 7: CpG-stimulated group; lane 8: Poly I:C-stimulated group). (B) The protein level and band density in overexpression groups of miR-29a and miR-378b with cGAS, STING, IRF3, IRF7, TBK1, STAT6, and phosphorylated STAT6, respectively. The data shown are the means ± standard error from three independent experiments. The level of significance between blank and positive control groups and group treated by pSilencer4.1 are identified by * p < 0.05, ** p < 0.01, *** p < 0.001, and **** p < 0.0001, determined by one-way ANOVA with Tukey’s multiple comparison test; Figure S7: qPCR analysis of mRNA expression of TRAF6 and NEMO pathway. (A) qPCR analysis following stimulation by over-expressed miR-29a and miR-378b of TRAF6 and NEMO; (B) qPCR analysis following stimulation by inhibited miR-29a and miR-378b of TRAF6 and NEMO. qPCR mRNA expressions of TRAF6 and NEMO were normalized with mRNA expression of GAPDH. These results are taken from three independent experiments. Significant differences between blank and positive control groups and group treated by pSilencer4.1 are expressed as * p < 0.05, ** p < 0.01, *** p < 0.001, and **** p < 0.0001, determined by one-way ANOVA with Tukey’s multiple comparison test; Table S1: Key resources tables include the list of all reagents, source and identifier of FACS antibodies, WB antibodies, vectors and inhibitors, chemicals, peptides and recombinant proteins, critical commercial assays and software used in this study.
Author Contributions
A.U.S. designed and carried out the molecular genetic studies, bio-information analyses, and microRNA-related data analyses, as well as drafted the manuscript. Y.C. developed the mouse bone marrow-derived dendritic cells and performed FACS analysis. N.S. revised the manuscript and gave valuable suggestions for experimental design. J.L. performed microRNA-related studies, contributed to the interpretation of the data, participated in the design, coordinated experiments and data analyses in the lab, and drafted the manuscript. Q.Y. was the principal investigator of the project, who conceptualized the study, participated in its design, and helped draft the manuscript. A.U.S., Y.C., N.S., J.L., and Q.Y. read and approved the final manuscript.
Funding
This work was supported by the National Key Research and Development Program of China (2017YFD500706), the Jiangsu Natural Science Foundation Excellent Youth Foundation, the National Natural Science Grant of China (No. 31702197), the Fundamental Research Funds for the Central Universities (JCQY201906), the Fundamental Research Funds for the Central Universities (KJQN2018034), and A Project Funded by the Priority Academic Program Development of Jiangsu Higher Education Institutions (PAPD), yje Jiangsu Excellent Youth Fund Project (BK20190077).
Conflicts of Interest
The authors declare no conflicts of interest.
Abbreviations
| DCs | dendritic cells |
| miRNA | microRNA |
| CpG | Cytosine–phosphate–guanosine |
| BMDC | bone marrow dendritic cells |
| GM-CSF | granulocyte-macrophage colony-stimulating factor |
| MHCII | major histocompatibility complex class II |
| Siglec-G | sialic acid-binding immunoglobulin-type lectin-G |
| 3′UTR | three-prime untranslated region |
| FACS | Fluorescence-Activated Cell Sorter |
| MAPK | mitogen-activated protein kinases |
| cGAS/STING | cyclic GMP–AMP/synthase-stimulator of interferon genes |
| TBKBP1 | TANK-binding kinase binding protein 1 |
| IRF7 | interferon regulatory factor 7 |
| TLR-9 | Toll-like receptor 9 |
References
- Arnold-Schrauf, C.; Dudek, M.; Dielmann, A.; Pace, L.; Swallow, M.; Kruse, F.; Kuhl, A.A.; Holzmann, B.; Berod, L.; Sparwasser, T. Dendritic cells coordinate innate immunity via MyD88 signaling to control Listeria monocytogenes infection. Cell Rep. 2014, 6, 698–708. [Google Scholar] [CrossRef]
- Ding, Y.; Guo, Z.; Liu, Y.; Li, X.; Zhang, Q.; Xu, X.; Gu, Y.; Zhang, Y.; Zhao, D.; Cao, X. The lectin Siglec-G inhibits dendritic cell cross-presentation by impairing MHC class I-peptide complex formation. Nat. Immunol. 2016, 17, 1167–1175. [Google Scholar] [CrossRef] [PubMed]
- Latchman, Y.; Wood, C.R.; Chernova, T.; Chaudhary, D.; Borde, M.; Chernova, I.; Iwai, Y.; Long, A.J.; Brown, J.A.; Nunes, R.; et al. PD-L2 is a second ligand for PD-1 and inhibits T cell activation. Nat. Immunol. 2001, 2, 261–268. [Google Scholar] [CrossRef] [PubMed]
- Scheiermann, J.; Klinman, D.M. Clinical evaluation of CpG oligonucleotides as adjuvants for vaccines targeting infectious diseases and cancer. Vaccine 2014, 32, 6377–6389. [Google Scholar] [CrossRef] [PubMed]
- Bode, C.; Zhao, G.; Steinhagen, F.; Kinjo, T.; Klinman, D.M. CpG DNA as a vaccine adjuvant. Expert Rev. Vaccines 2011, 10, 499–511. [Google Scholar] [CrossRef] [PubMed]
- Krieg, A.M. CpG motifs in bacterial DNA and their immune effects. Annu. Rev. Immunol. 2002, 20, 709–760. [Google Scholar] [CrossRef]
- Wagner, H. Interactions between bacterial CpG-DNA and TLR9 bridge innate and adaptive immunity. Curr. Opin. Microbiol. 2002, 5, 62–69. [Google Scholar] [CrossRef]
- Putta, M.; Zhu, F.-G.; Wang, D.; Bhagat, L.; Dai, M.; Kandimalla, E.; Agrawal, S. Peptide Conjugation at the 5′-End of Oligodeoxynucleotides Abrogates Toll-Like Receptor 9-Mediated Immune Stimulatory Activity. Bioconjug. Chem. 2009, 21, 39–45. [Google Scholar] [CrossRef]
- Vollmer, J.; Krieg, A.M. Immunotherapeutic applications of CpG oligodeoxynucleotide TLR9 agonists. Adv. Drug Deliv. Rev. 2009, 61, 195–204. [Google Scholar] [CrossRef]
- Kadowaki, N.; Antonenko, S.; Liu, Y.J. Distinct CpG DNA and Polyinosinic-Polycytidylic Acid Double-Stranded RNA, Respectively, Stimulate CD11c- Type 2 Dendritic Cell Precursors and CD11c+ Dendritic Cells to Produce Type I IFN. J. Immunol. 2001, 166, 2291–2295. [Google Scholar] [CrossRef]
- Klinman, D.M. Immunotherapeutic uses of CpG oligodeoxynucleotides. Nat. Rev. Immunol. 2004, 4, 249–259. [Google Scholar] [CrossRef] [PubMed]
- Li, Q.; Liu, C.; Yue, R.; El-Ashram, S.; Wang, J.; He, X.; Zhao, D.; Zhou, X.; Xu, L. cGAS/STING/TBK1/IRF3 Signaling Pathway Activates BMDCs Maturation Following Mycobacterium bovis Infection. Int. J. Mol. Sci. 2019, 20, 895. [Google Scholar] [CrossRef] [PubMed]
- Bartel, D.P. MicroRNAs: Target recognition and regulatory functions. Cell 2009, 136, 215–233. [Google Scholar] [CrossRef] [PubMed]
- Wang, R.; Zhang, Y.Y.; Lu, J.S.; Xia, B.H.; Yang, Z.X.; Zhu, X.D.; Zhou, X.W.; Huang, P.T. The highly pathogenic H5N1 influenza A virus down-regulated several cellular MicroRNAs which target viral genome. J. Cell. Mol. Med. 2017, 21, 3076–3086. [Google Scholar] [CrossRef] [PubMed]
- Huang, Z.; Chen, X.; Yu, B.; Chen, D. Cloning and functional characterization of rat stimulator of interferon genes (STING) regulated by miR-24. Dev. Comp. Immunol. 2012, 37, 414–420. [Google Scholar] [CrossRef]
- Ingle, H.; Kumar, S.; Raut, A.A.; Mishra, A.; Kulkarni, D.D.; Kameyama, T.; Takaoka, A.; Akira, S.; Kumar, H. The microRNA miR-485 targets host and influenza virus transcripts to regulate antiviral immunity and restrict viral replication. Sci. Signal. 2015, 8. [Google Scholar] [CrossRef]
- Smyth, L.A.; Boardman, D.A.; Tung, S.L.; Lechler, R.; Lombardi, G. MicroRNAs affect dendritic cell function and phenotype. Immunology 2015, 144, 197–205. [Google Scholar] [CrossRef]
- Lin, J.; Yin, Y.Y.; Qin, T.; Zhu, L.Q.; Yu, Q.H.; Yang, Q. Enhanced immune response of BMDCs pulsed with H9N2 AIV and CpG. Vaccine 2014, 32, 6783–6790. [Google Scholar] [CrossRef]
- Livak, K.J.; Schmittgen, T.D. Analysis of relative gene expression data using real-time quantitative PCR and the 2(-Delta Delta C(T)) Method. Methods 2001, 25, 402–408. [Google Scholar] [CrossRef]
- Lin, J.; Xia, J.; Zhang, T.; Zhang, K.; Yang, Q. Genome-wide profiling of microRNAs reveals novel insights into the interactions between H9N2 avian influenza virus and avian dendritic cells. Oncogene 2018, 37, 4562–4580. [Google Scholar] [CrossRef]
- Halperin, S.A.; Van Nest, G.; Smith, B.; Abtahi, S.; Whiley, H.; Eiden, J.J. A phase I study of the safety and immunogenicity of recombinant hepatitis B surface antigen co-administered with an immunostimulatory phosphorothioate oligonucleotide adjuvant. Vaccine 2003, 21, 2461–2467. [Google Scholar] [CrossRef]
- Johanson, T.M.; Cmero, M.; Wettenhall, J.; Lew, A.M.; Zhan, Y.; Chong, M.M. A microRNA expression atlas of mouse dendritic cell development. Immunol. Cell Biol. 2015, 93, 480–485. [Google Scholar] [CrossRef] [PubMed]
- Mehta, A.; Baltimore, D. MicroRNAs as regulatory elements in immune system logic. Nat. Rev. Immunol. 2016, 16, 279–294. [Google Scholar] [CrossRef] [PubMed]
- Paladini, L.; Fabris, L.; Bottai, G.; Raschioni, C.; Calin, G.A.; Santarpia, L. Targeting microRNAs as key modulators of tumor immune response. J. Exp. Clin. Cancer Res. 2016, 35, 103. [Google Scholar] [CrossRef] [PubMed]
- Lin, J.; Xia, J.; Tu, C.Z.; Zhang, K.Y.; Zeng, Y.; Yang, Q. H9N2 Avian Influenza Virus Protein PB1 Enhances the Immune Responses of Bone Marrow-Derived Dendritic Cells by Down-Regulating miR375. Front. Microbiol. 2017, 8, 287. [Google Scholar] [CrossRef]
- Abomaray, F.M.; Al Jumah, M.A.; Kalionis, B.; AlAskar, A.S.; Al Harthy, S.; Jawdat, D.; Al Khaldi, A.; Alkushi, A.; Knawy, B.A.; Abumaree, M.H. Human Chorionic Villous Mesenchymal Stem Cells Modify the Functions of Human Dendritic Cells, and Induce an Anti-Inflammatory Phenotype in CD1+ Dendritic Cells. Stem Cell Rev. Rep. 2015, 11, 423–441. [Google Scholar] [CrossRef]
- Sun, L.; Wu, J.; Du, F.; Chen, X.; Chen, Z.J. Cyclic GMP-AMP synthase is a cytosolic DNA sensor that activates the type I interferon pathway. Science 2013, 339, 786–791. [Google Scholar] [CrossRef]
- Huang, G.; Shi, L.Z.; Chi, H. Regulation of JNK and p38 MAPK in the immune system: Signal integration, propagation and termination. Cytokine 2009, 48, 161–169. [Google Scholar] [CrossRef]
- Liu, Y.; Shepherd, E.G.; Nelin, L.D. MAPK phosphatases—Regulating the immune response. Nat. Rev. Immunol. 2007, 7, 202–212. [Google Scholar] [CrossRef]
- Zhao, T.; Yang, L.; Sun, Q.; Arguello, M.; Ballard, D.W.; Hiscott, J.; Lin, R. The NEMO adaptor bridges the nuclear factor-kappaB and interferon regulatory factor signaling pathways. Nat. Immunol. 2007, 8, 592–600. [Google Scholar] [CrossRef]
- Chariot, A.; Leonardi, A.; Muller, J.; Bonif, M.; Brown, K.; Siebenlist, U. Association of the adaptor TANK with the I kappa B kinase (IKK) regulator NEMO connects IKK complexes with IKK epsilon and TBK1 kinases. J. Biol. Chem. 2002, 277, 37029–37036. [Google Scholar] [CrossRef] [PubMed] [Green Version]
- Marinho, F.V.; Benmerzoug, S.; Rose, S.; Campos, P.C.; Marques, J.T.; Bafica, A.; Barber, G.; Ryffel, B.; Oliveira, S.C.; Quesniaux, V.F.J. The cGAS/STING Pathway Is Important for Dendritic Cell Activation but Is Not Essential to Induce Protective Immunity against Mycobacterium tuberculosis Infection. J. Innate Immun. 2018, 10, 239–252. [Google Scholar] [CrossRef] [PubMed]
- Li, P.; Chen, Y.; Juma, C.A.; Yang, C.; Huang, J.; Zhang, X.; Zeng, Y. Differential Inhibition of Target Gene Expression by Human microRNAs. Cells 2019, 8, 791. [Google Scholar] [CrossRef] [PubMed] [Green Version]
- Hirschberger, S.; Hinske, L.C.; Kreth, S. MiRNAs: Dynamic regulators of immune cell functions in inflammation and cancer. Cancer Lett. 2018, 431, 11–21. [Google Scholar] [CrossRef]
- Toubai, T.; Rossi, C.; Oravecz-Wilson, K.; Zajac, C.; Liu, C.; Braun, T.; Fujiwara, H.; Wu, J.; Sun, Y.; Brabbs, S.; et al. Siglec-G represses DAMP-mediated effects on T cells. JCI Insight 2017, 2. [Google Scholar] [CrossRef] [Green Version]
- Chen, W.; Han, C.; Xie, B.; Hu, X.; Yu, Q.; Shi, L.; Wang, Q.; Li, D.; Wang, J.; Zheng, P.; et al. Induction of Siglec-G by RNA viruses inhibits the innate immune response by promoting RIG-I degradation. Cell 2013, 152, 467–478. [Google Scholar] [CrossRef] [Green Version]
- Freeman, G.J.; Long, A.J.; Iwai, Y.; Bourque, K.; Chernova, T.; Nishimura, H.; Fitz, L.J.; Malenkovich, N.; Okazaki, T.; Byrne, M.C.; et al. Engagement of the PD-1 immunoinhibitory receptor by a novel B7 family member leads to negative regulation of lymphocyte activation. J. Exp. Med. 2000, 192, 1027–1034. [Google Scholar] [CrossRef] [Green Version]
- Ma, F.; Xu, S.; Liu, X.; Zhang, Q.; Xu, X.; Liu, M.; Hua, M.; Li, N.; Yao, H.; Cao, X. The microRNA miR-29 controls innate and adaptive immune responses to intracellular bacterial infection by targeting interferon-gamma. Nat. Immunol. 2011, 12, 861–869. [Google Scholar] [CrossRef]
- Joo, D.; An, S.; Choi, B.G.; Kim, K.; Choi, Y.M.; Ahn, K.J.; An, I.S.; Cha, H.J. MicroRNA378b regulates alpha1type 1 collagen expression via sirtuin 6 interference. Mol. Med. Rep. 2017, 16, 8520–8524. [Google Scholar] [CrossRef] [Green Version]
- Deng, H.; Guo, Y.; Song, H.; Xiao, B.; Sun, W.; Liu, Z.; Yu, X.; Xia, T.; Cui, L.; Guo, J. MicroRNA-195 and microRNA-378 mediate tumor growth suppression by epigenetical regulation in gastric cancer. Gene 2013, 518, 351–359. [Google Scholar] [CrossRef]
- Hyun, J.; Wang, S.; Kim, J.; Rao, K.M.; Park, S.Y.; Chung, I.; Ha, C.S.; Kim, S.W.; Yun, Y.H.; Jung, Y. MicroRNA-378 limits activation of hepatic stellate cells and liver fibrosis by suppressing Gli3 expression. Nat. Commun. 2016, 7, 10993. [Google Scholar] [CrossRef] [PubMed] [Green Version]
- Lee, D.Y.; Deng, Z.; Wang, C.H.; Yang, B.B. MicroRNA-378 promotes cell survival, tumor growth, and angiogenesis by targeting SuFu and Fus-1 expression. Proc. Natl. Acad. Sci. USA 2007, 104, 20350–20355. [Google Scholar] [CrossRef] [PubMed] [Green Version]
- You, L.; Gu, W.; Chen, L.; Pan, L.; Chen, J.; Peng, Y. MiR-378 overexpression attenuates high glucose-suppressed osteogenic differentiation through targeting CASP3 and activating PI3K-Akt signaling pathway. Int. J. Clin. Exp. Pathol. 2014, 7, 7249–7261. [Google Scholar] [PubMed]
- Wang, X.L.; Zhang, T.; Wang, J.; Zhang, D.B.; Zhao, F.; Lin, X.W.; Wang, Z.; Shi, P.; Pang, X.N. MiR-378b Promotes Differentiation of Keratinocytes through NKX3.1. PLoS ONE 2015, 10, e0136049. [Google Scholar] [CrossRef]
- Krist, B.; Florczyk, U.; Pietraszek-Gremplewicz, K.; Jozkowicz, A.; Dulak, J. The Role of miR-378a in Metabolism, Angiogenesis, and Muscle Biology. Int. J. Endocrinol. 2015, 2015, 281756. [Google Scholar] [CrossRef] [Green Version]
- Hua, C.; Sun, L.; Yang, Y.; Tan, R.; Hou, Y. Mechanisms of CpG-induced CD40 expression on murine bone marrow-derived dendritic cells. Autoimmunity 2013, 46, 177–187. [Google Scholar] [CrossRef]
- Bode, C.; Fox, M.; Tewary, P.; Steinhagen, A.; Ellerkmann, R.K.; Klinman, D.; Baumgarten, G.; Hornung, V.; Steinhagen, F. Human plasmacytoid dentritic cells elicit a Type I Interferon response by sensing DNA via the cGAS-STING signaling pathway. Eur. J. Immunol. 2016, 46, 1615–1621. [Google Scholar] [CrossRef]
- Cai, X.; Chiu, Y.H.; Chen, Z.J. The cGAS-cGAMP-STING pathway of cytosolic DNA sensing and signaling. Mol. Cell 2014, 54, 289–296. [Google Scholar] [CrossRef] [Green Version]
- Ma, Z.; Damania, B. The cGAS-STING Defense Pathway and Its Counteraction by Viruses. Cell Host Microbe 2016, 19, 150–158. [Google Scholar] [CrossRef]
- Li, T.; Chen, Z.J. The cGAS-cGAMP-STING pathway connects DNA damage to inflammation, senescence, and cancer. J. Exp. Med. 2018, 215, 1287–1299. [Google Scholar] [CrossRef]
- Wu, M.Z.; Cheng, W.C.; Chen, S.F.; Nieh, S.; O’Connor, C.; Liu, C.L.; Tsai, W.W.; Wu, C.J.; Martin, L.; Lin, Y.S.; et al. miR-25/93 mediates hypoxia-induced immunosuppression by repressing cGAS. Nat. Cell Biol. 2017, 19, 1286–1296. [Google Scholar] [CrossRef] [PubMed] [Green Version]
- Rosenberger, C.M.; Podyminogin, R.L.; Diercks, A.H.; Treuting, P.M.; Peschon, J.J.; Rodriguez, D.; Gundapuneni, M.; Weiss, M.J.; Aderem, A. miR-144 attenuates the host response to influenza virus by targeting the TRAF6-IRF7 signaling axis. PLOS Pathogen 2017, 13, e1006305. [Google Scholar] [CrossRef] [PubMed]
- Nagalingam, R.S.; Sundaresan, N.R.; Gupta, M.P.; Geenen, D.L.; Solaro, R.J.; Gupta, M. A cardiac-enriched microRNA, miR-378, blocks cardiac hypertrophy by targeting Ras signaling. J. Biol. Chem. 2013, 288, 11216–11232. [Google Scholar] [CrossRef] [PubMed] [Green Version]
Figure 1.
Differential expression of microRNAs (miRNAs) in dendritic cells (DCs) upon cytosine–phosphate–guanosine (CpG) stimulation. (A) The heat map of differentially expressed miRNAs on DCs upon CpG stimulation from microarray data. (B) List of the candidate miRNAs with their abundance selected after their expression level. (C) Result of the qPCR analysis of selected miRNAs (miR-29a, miR-98, miR-196b, miR-222, miR-361, miR-378b) on DCs at different time intervals followed by CpG stimulation. (D) qPCR analysis of overexpressed miR-29a and miR-378b, and (E) inhibited miR-29a and miR-378b. pSilencer4.1 was used as a negative control, while CpG alone was used as a positive control. All experiments were performed in triplicate. Significant differences between the blank and positive control groups, and negative control and experimental groups are expressed as * p < 0.05 or ** p < 0.01, *** p < 0.001, and **** p < 0.0001, respectively. The significance of the data was determined by one-way ANOVA with Dunnett’s multiple comparison test.

Figure 2.
The effect of co-stimulatory molecules on DCs with miR-29a and miR-378b before and after CpG stimulation. (A) Flow cytometry analysis of the phenotypic alteration and mean fluorescence intensity (MFI) of major histocompatibility complex class II (MHCII) in overexpression group, (B) MHCII in inhibition group, (C) CD80 in overexpression group, (D) CD80 in inhibition group, (E) CD86 in overexpression group, (F) CD86 in inhibition group, (G) CD40 in overexpression group, and (H) CD40 in inhibition group, in bone marrow-derived dendritic cells (BMDCs) influenced by miR-29a and miR-378b with CpG-stimulated and naïve DCs. Blanks containing untransfected DCs and empty vector pSilencer4.1 were used as a negative control; CpG and polyinosinic:polycytidylic acid (Poly I:C) (1 μg/mL) were used as a positive control. All results are representative of three independent experiments. Significant differences between the blank and positive control groups, and negative control and experimental groups are expressed as * p < 0.05 or ** p < 0.01, *** p < 0.001, and **** p < 0.0001, respectively. The significance of the data was determined by one-way ANOVA with Tukey’s multiple comparison test.

Figure 3.
miR-29a and miR-378b regulate expression of immunosuppressive molecules. (A) Flow cytometry results of immunosuppressive molecule CD273 in overexpression group, (B) CD273 in inhibition group, (C) sialic-acid-binding immunoglobulin-like lectin-G (Siglec-G) in overexpression group, and (D) Siglec-G in inhibition group in BMDCs. Line 1 shows the overexpression group and line 2 shows the inhibition group of miR-29a and miR-378b with CpG-stimulated and naïve DCs. Blanks containing untransfected DCs and empty vector pSilencer4.1 were used as a negative control; CpG and Poly I:C (1 ug/mL) were used as a positive control. All results are representative of three independent experiments. Significant differences between the blank and positive control groups, and negative control and experimental groups are expressed as * p < 0.05 or ** p < 0.01 and **** p < 0.0001, respectively. The significance of the data was determined by one-way ANOVA with Tukey’s multiple comparison test.

Figure 4.
Results of the qPCR analysis following stimulation by overexpressed miR-29a and miR-378b of cyclic guanosine monophosphate-adenosine monophosphate (GMP–AMP) synthase and the stimulator of interferon genes (cGAS/STING) pathway-related genes: (A) STING, (B) TANK-Binding Kinase 1 (TBK1), (C) Interferon Regulatory Factor 3 (IRF3), (D) IRF7, (E) TBK Binding Protein 1 (TBKBP1), (F) cGAS, and (G) Signal Transducer and Activator of Transcription 6 (STAT6). All these expressions were normalized with Glyceraldehyde 3-Phosphate Dehydrogenase (GAPDH) messenger RNA (mRNA) expression level. Empty vectors (pSilencer4.1) were used as a negative control; CpG and Poly I:C were used as a positive control. These results are taken from three independent experiments. Significant differences between the blank and positive control groups and the group treated with pSilencer4.1 are expressed as * p < 0.05, ** p < 0.01, *** p < 0.001, and **** p < 0.0001, determined by one-way ANOVA with Tukey’s multiple comparison test.

Figure 5.
cGAS/STING pathway regulatory protein expression on BMDCs stimulated by miR-29a and miR-378b determined by Western blot. (A) Western blot results in naïve DCs and DCs stimulated by CpG with overexpressed miR-29a and miR-378b for the total protein level of GAPDH, cGAS, STING, IRF3, IRF7, TBK1, STAT6, and phosphorylated STAT6 (lane 1: blank group; lane 2: control (pSilencer4.1)-stimulated group; lane 3: miR-29a-stimulated group; lane 4: CpG-added miR-29a-stimulated group; lane 5: miR-378b-stimulated group; lane 6: CpG-added miR-378b stimulated group; lane 7: CpG-stimulated group; lane 8: Poly I:C-stimulated group). (B–G) The protein expression level and band density in overexpression groups of miR-29a and miR-378b with cGAS, STING, IRF3, IRF7, TBK1, STAT6, and phosphorylated STAT6, respectively. The cGAS, STING, IRF3, IRF7, and TBK1 expressions were normalized with GAPDH, while phosphorylated STAT6 was normalized with STAT6. pSilencer4.1 vectors were used as a negative control, while CpG and Poly I:C were used as a positive control. The data shown are the means ± standard error from three independent experiments. The level of significance between blank and positive control groups and the group treated with pSilencer4.1 are identified by * p < 0.05, ** p < 0.01, *** p < 0.001, and **** p < 0.0001, determined by one-way ANOVA with Tukey’s multiple comparison test.

Figure 6.
miR-29a and miR-378b influence Mitogen-Activated Protein Kinase (MAPK) and TNK Receptor Associated Factor 6 (TRAF6) pathways. (A) Cells were harvested, and Western blot analysis was performed for phosphorylation and the total level of c-Jun NH2-terminal Kinase (JNK) and p38 kinases, and TRAF6 in miRNA overexpression group; GAPDH protein expression was used as a loading control. (B) Western blot analysis of inhibited miR-29a and miR-378b on naïve DCs and CpG-stimulated DCs for phosphorylation and the total level of JNK and p38 kinases, TRAF6, and GAPDH (lane 1: blank group; lane 2: control (pSilencer4.1 or negative control)-stimulated group; lane 3: miR-29a- or inhibitor miR-29a-stimulated group; lane 4: CpG-added miR-29a- or inhibitor miR-29a-stimulated group; lane 5: miR-378b- or inhibitor miR-378b-stimulated group; lane 6: CpG-added miR-378b- or inhibitor miR-378b-stimulated group; lane 7: CpG-stimulated group; lane 8: Poly I:C-stimulated group). (C,D) Western blot band density and protein expression level in overexpression and inhibitor groups of miR-29a and miR-378b with JNK normalized with phosphorylated JNK, and (E,F) p38 normalized with phosphorylated p38. (G,H) Band density and protein expression level of TRAF6 normalized with GAPDH in miRNA overexpression and inhibited groups. Vectors (pSilencer4.1) were used as a negative control; CpG and Poly I:C were used as a positive control. All results are taken from three independent experiments. The level of significance between blank and positive control groups and the group treated with pSilencer4.1 are identified as * p < 0.05, ** p < 0.01, *** p < 0.001, and **** p < 0.0001, determined by one-way ANOVA with Tukey’s multiple comparison test.

Figure 7.
Effect of miR-29a and miR-378b on cytokine and interleukin production of BMDCs stimulated by CpG. (A) Tumor Necrosis Factor-α (TNF-α) overexpression group, (B) TNF-α inhibition group, (C) Interferon-β (IFN-β) overexpression group, (D) IFN-β inhibition group, (E) Interleukin-12 (IL-12) overexpression group, (F) IL-12 inhibition group, (G) C-C motif chemokine Ligand 20 (CCL20) overexpression group, and (H) CCL20 inhibition group. Cytokines released from naïve and CpG-stimulated BMDCs influenced by overexpressed and inhibited groups of miR-29a and miR-378b were measured by enzyme-linked immunosorbent assays. Data for TNF-α, IFN-β, IL-12, and CCL20 are shown as means ± standard deviation (SD) of three independent experiments. Significant differences between blank and positive control groups, and negative control and experimental groups are expressed as * p < 0.05 or ** p < 0.01, *** p < 0.001, and **** p < 0.0001, respectively. The significance of the data was determined by one-way ANOVA with Tukey’s multiple comparison test.

Figure 8.
Results of dual luciferase reporter assay of miRNAs and their target genes. (A) Prediction of wild-type and mutant-type sequences of IRF7 and TBKBP1 genes with their binding sites for miR-29a-5p and miR-378b, respectively. (B) Dual luciferase assay results of miR-29a-5p and its target wild-type and mutant IRF7 genes, and (C) miR-378b and wild-type and mutant TBKBP1 genes. Independent miRNA was used as a negative control, transfected with the wild-type gene. Significant differences between the negative control group and miRNA target group are expressed as * p < 0.05, determined by one-way ANOVA with Tukey’s multiple comparison test.


Table 1.
qRT-PCR primers used in verification of microRNA (miRNA) results.
| miRNAs | Sense Primers (5′ to 3′) |
|---|---|
| mmu-miR-29a | AGAGGATGACTGATTTCTTTTGGTGTTC |
| mmu-miR-98 | GCTGGGGTGAGGTAGTAAGTTGTATTGT |
| mmu-miR-196a-2 | GTGGCTTAGGTAGTTTCATGTTGTTGG |
| mmu-miR-222 | AGTGGCTCAGTAGCCAGTGTAGATCC |
| mmu-miR-361 | GAAGCTTATCAGAATCTCCAGGGGTAC |
| mmu-miR-378b | GGGAACCCTGGACTTGGAGTCAGAAGA |
Table 2.
Primers used in amplification of mouse miRNAs.
| miRNAs | Sequence | Products |
|---|---|---|
| miR-29a sense | GGCTCGAGACACCCACCATCACTATGTG | 461 bp |
| miR-29a anti-sense | TGAATTCAACAGGCTACCAGAGCCTG | |
| miR-378b sense | GGCTCGAGTATCATGGCATATCAGCAGAAGC | 488 bp |
| miR-378b anti-sense | TGAATTCTGCATATACCTGATAAGTCACAGG |
Table 3.
Primers used in amplified mmu-miRNA target gene.
| Gene | Sequence | Products |
|---|---|---|
| mmu-miR-29a-5p target gene-Interferon Regulatory Factor 7 (IRF7) wild-type sense | AAGATCCTTTATTAAGCTTAAATCAGTGGAGCCCTGGGT | 406 bp |
| mmu-miR-29a-5p target gene-IRF7 wild-type anti-sense | GCACTAGTGAGGGAGCTCGGTTTCGGAAAGCCTGACGG | |
| mmu-miR-29a-5p target gene-IRF7 mutant-type sense | AAGATCCTTTATTAAGCTTGCTATCATGGAGCCCTGGGT | |
| mmu-miR-378b target gene-TANK-Binding Kinase Binding Protein 1 (TBKBP1) wild-type sense | GATCCTTTAAGCTTAAGTCCAATAAAACTTACCTG | 483 bp |
| mmu-miR-378b target gene-TBKBP1 wild-type anti-sense | CACTAGTGAGGGAGCTCAAAAGTCATGAGTTTGTGAC | |
| mmu-miR-378b target gene-TBKBP1 mutant type sense | GATCCTTTATTAAGCTTGGTGTAGGATAAAACTTACCTG |
Table 4.
qRT-PCR primers used in verification of messenger RNA (mRNA) results.
| Gene | Sense | Anti-Sense |
|---|---|---|
| GAPDH | AGGTCGGTGTGAACGGATTTG | GGGGTCGTTGATGGCAACA |
| cGAS | CATGTGTGCAGGAGCATGTA | CAACAACCCATGCAACAAAG |
| STING | TGAGCCTCAACCAACCCTAC | CCATCCACACAGGTCAACAG |
| TBK1 | GGGGTGCTCTCCCTAATTCT | CTTGTCAGGGAACCGACTGT |
| TBKBP1 | GGTGAGGGGTATGTCAGCAG | TCCAAGACCTTCCGAGTGAG |
| IRF3 | CAAGGCTCAGTCTTCCCATC | CGTAGGGACAATGTGTGTGC |
| IRF7 | TCTCGGCTTGTGCTTGTCTA | ACTGGGGGTCACCTTCTTTC |
| STAT6 | TCTGCTTTTGCCAGTGTGAC | GCCCAGGGAGTTTACACAGA |
| TRAF6 | TGGGTCCTCTGTGTCTTTGA | AGGAGTCAGATGGGGCTACA |
| NEMO | GCTCCTGTTGTCTCCTTTGC | TGCAGTTTCCCTGTGTTGAG |
© 2019 by the authors. Licensee MDPI, Basel, Switzerland. This article is an open access article distributed under the terms and conditions of the Creative Commons Attribution (CC BY) license (http://creativecommons.org/licenses/by/4.0/).
Share and Cite
MDPI and ACS Style
Shah, A.U.; Cao, Y.; Siddique, N.; Lin, J.; Yang, Q. miR29a and miR378b Influence CpG-Stimulated Dendritic Cells and Regulate cGAS/STING Pathway. Vaccines 2019, 7, 197. https://0-doi-org.brum.beds.ac.uk/10.3390/vaccines7040197
AMA Style
Shah AU, Cao Y, Siddique N, Lin J, Yang Q. miR29a and miR378b Influence CpG-Stimulated Dendritic Cells and Regulate cGAS/STING Pathway. Vaccines. 2019; 7(4):197. https://0-doi-org.brum.beds.ac.uk/10.3390/vaccines7040197
Chicago/Turabian StyleShah, Abid Ullah, Yanan Cao, Naila Siddique, Jian Lin, and Qian Yang. 2019. "miR29a and miR378b Influence CpG-Stimulated Dendritic Cells and Regulate cGAS/STING Pathway" Vaccines 7, no. 4: 197. https://0-doi-org.brum.beds.ac.uk/10.3390/vaccines7040197
Note that from the first issue of 2016, this journal uses article numbers instead of page numbers. See further details here.