
Methamphetamine and the Synthetic Cathinone 3,4-Methylenedioxypyrovalerone (MDPV) Produce Persistent Effects on Prefrontal and Striatal Microglial Morphology and Neuroimmune Signaling Following Repeated Binge-like Intake in Male and Female Rats
 and
and 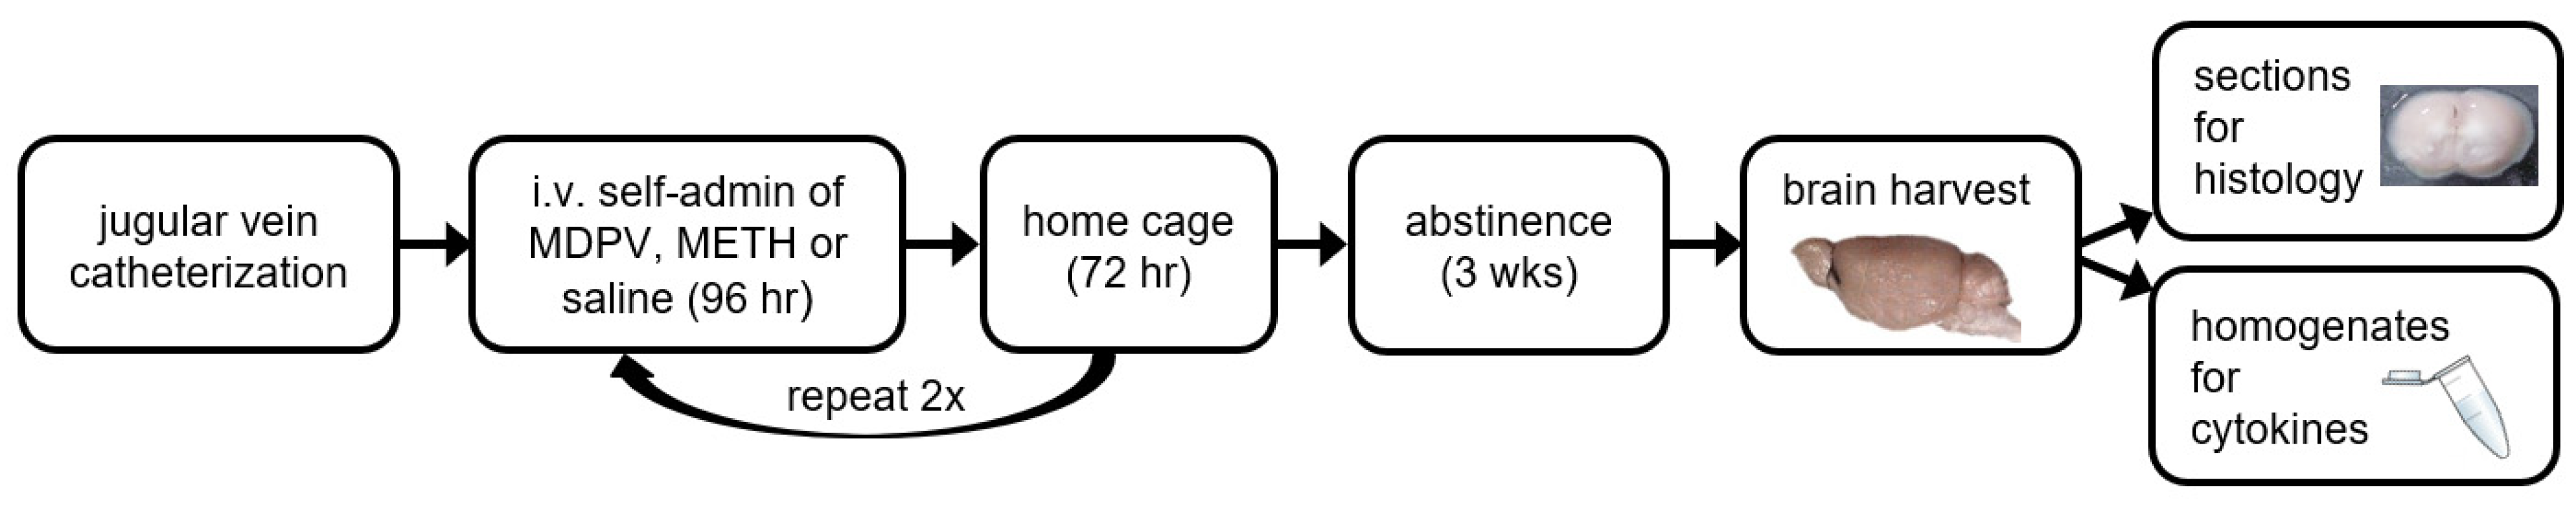
Abstract
:1. Introduction
2. Materials and Methods
2.1. Animals
2.2. Drugs
2.3. Implantation of Intravenous Catheters
2.4. Apparatus
2.5. Self-Administration Procedures
2.6. Immunohistochemical Staining
2.7. Quantification of Cell Density
2.8. Assessment of Microglial Morphology
2.9. Golgi–Cox Staining and Quantification of Dendritic Spine Density
2.10. Detection and Quantification of Apoptosis
2.11. Assessment of PFC and DStr Cytokine Levels
2.12. Statistical Analyses
3. Results
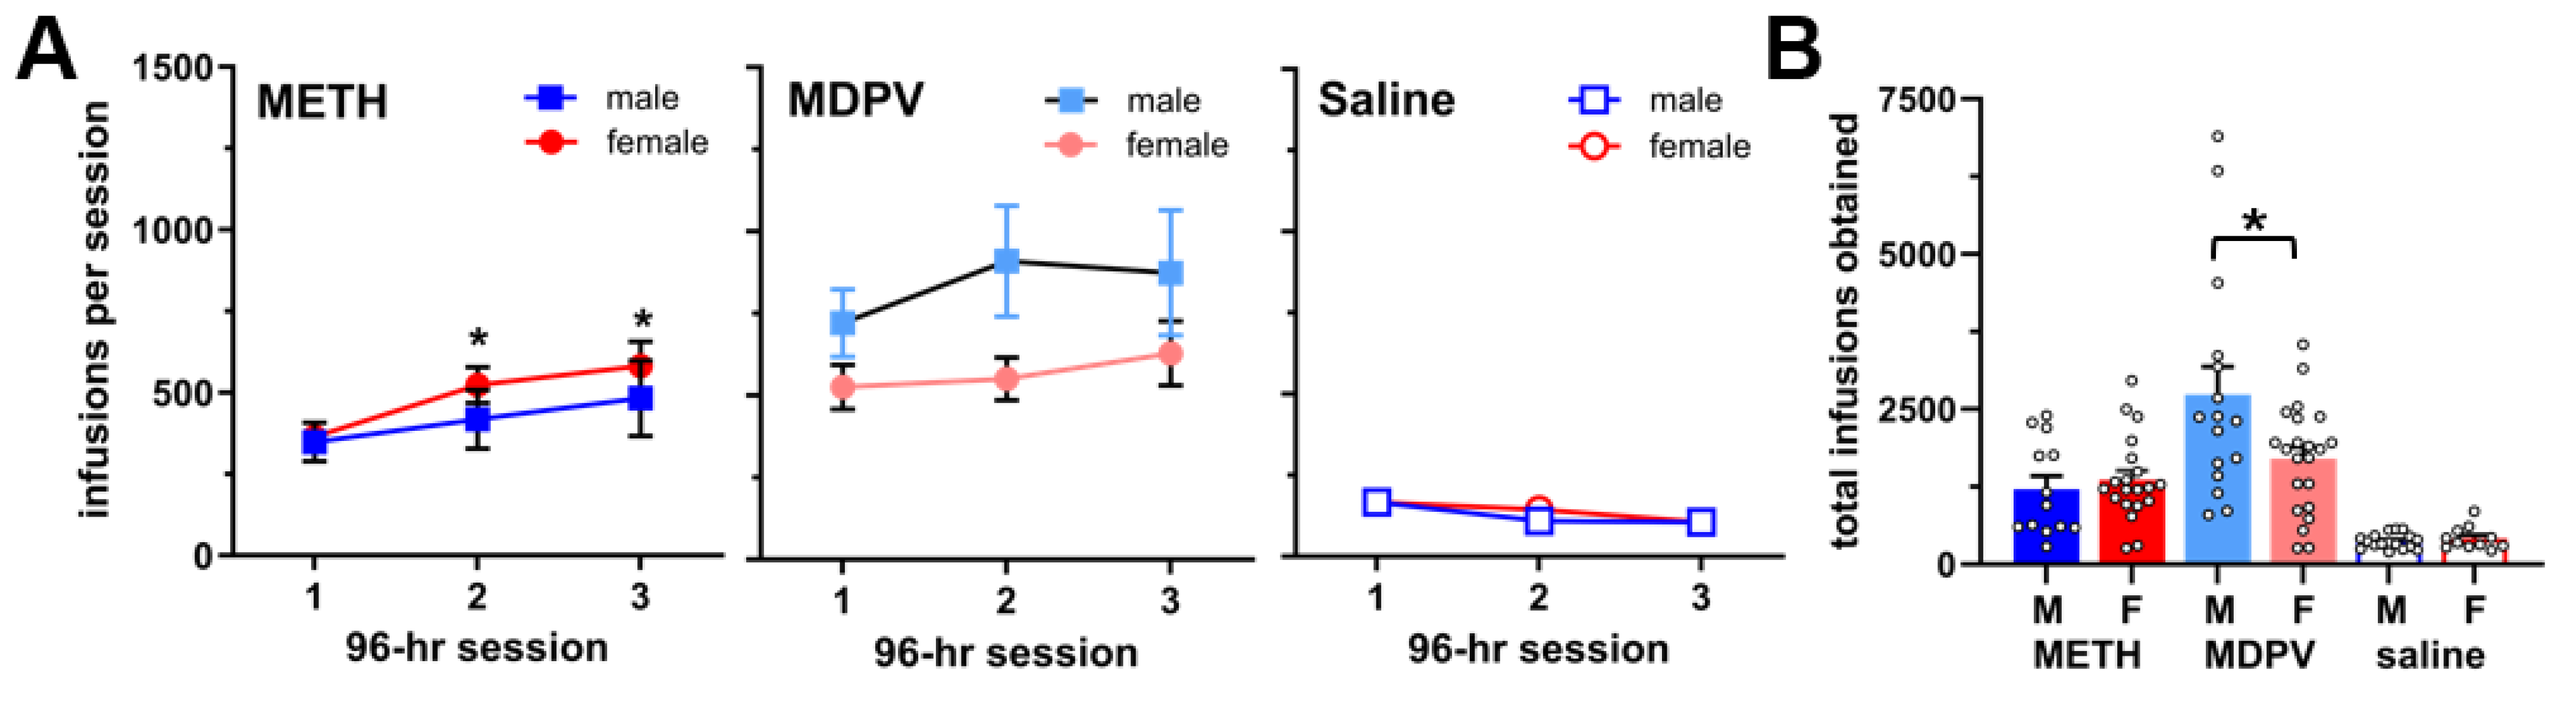
3.1. Repeated 96-h Access to METH and MDPV Produces Robust Intake Levels
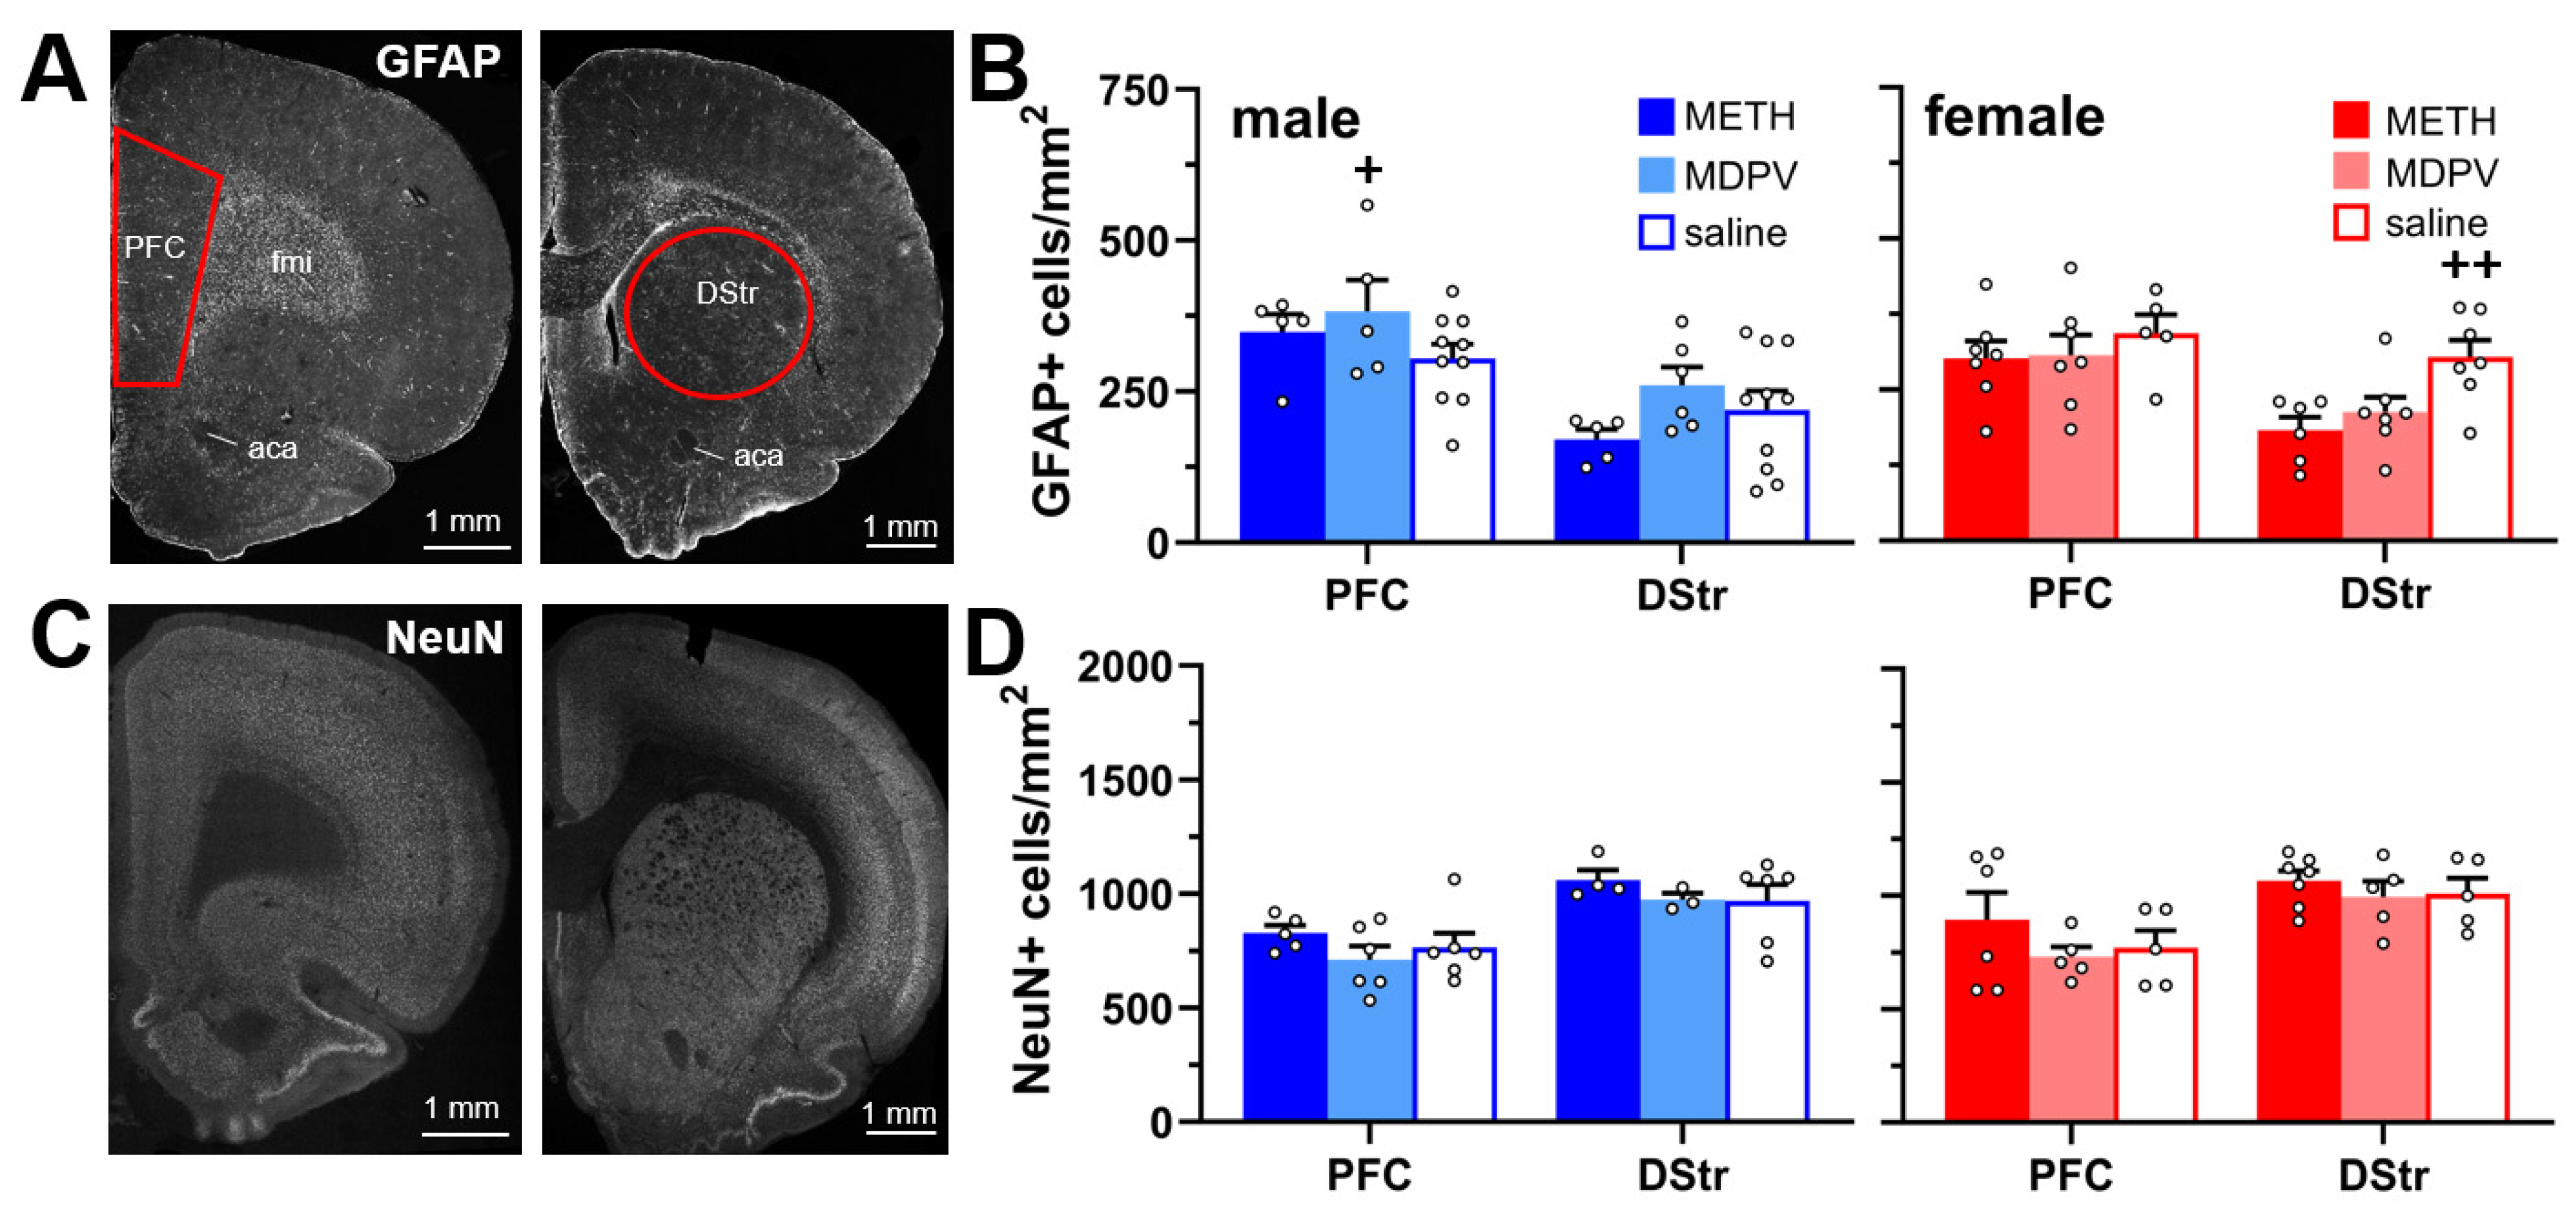
3.2. Astrocyte and Neuronal Density in the PFC and DStr Are Not Altered during Abstinence Following Repeated Binge-like METH and MDPV Intake
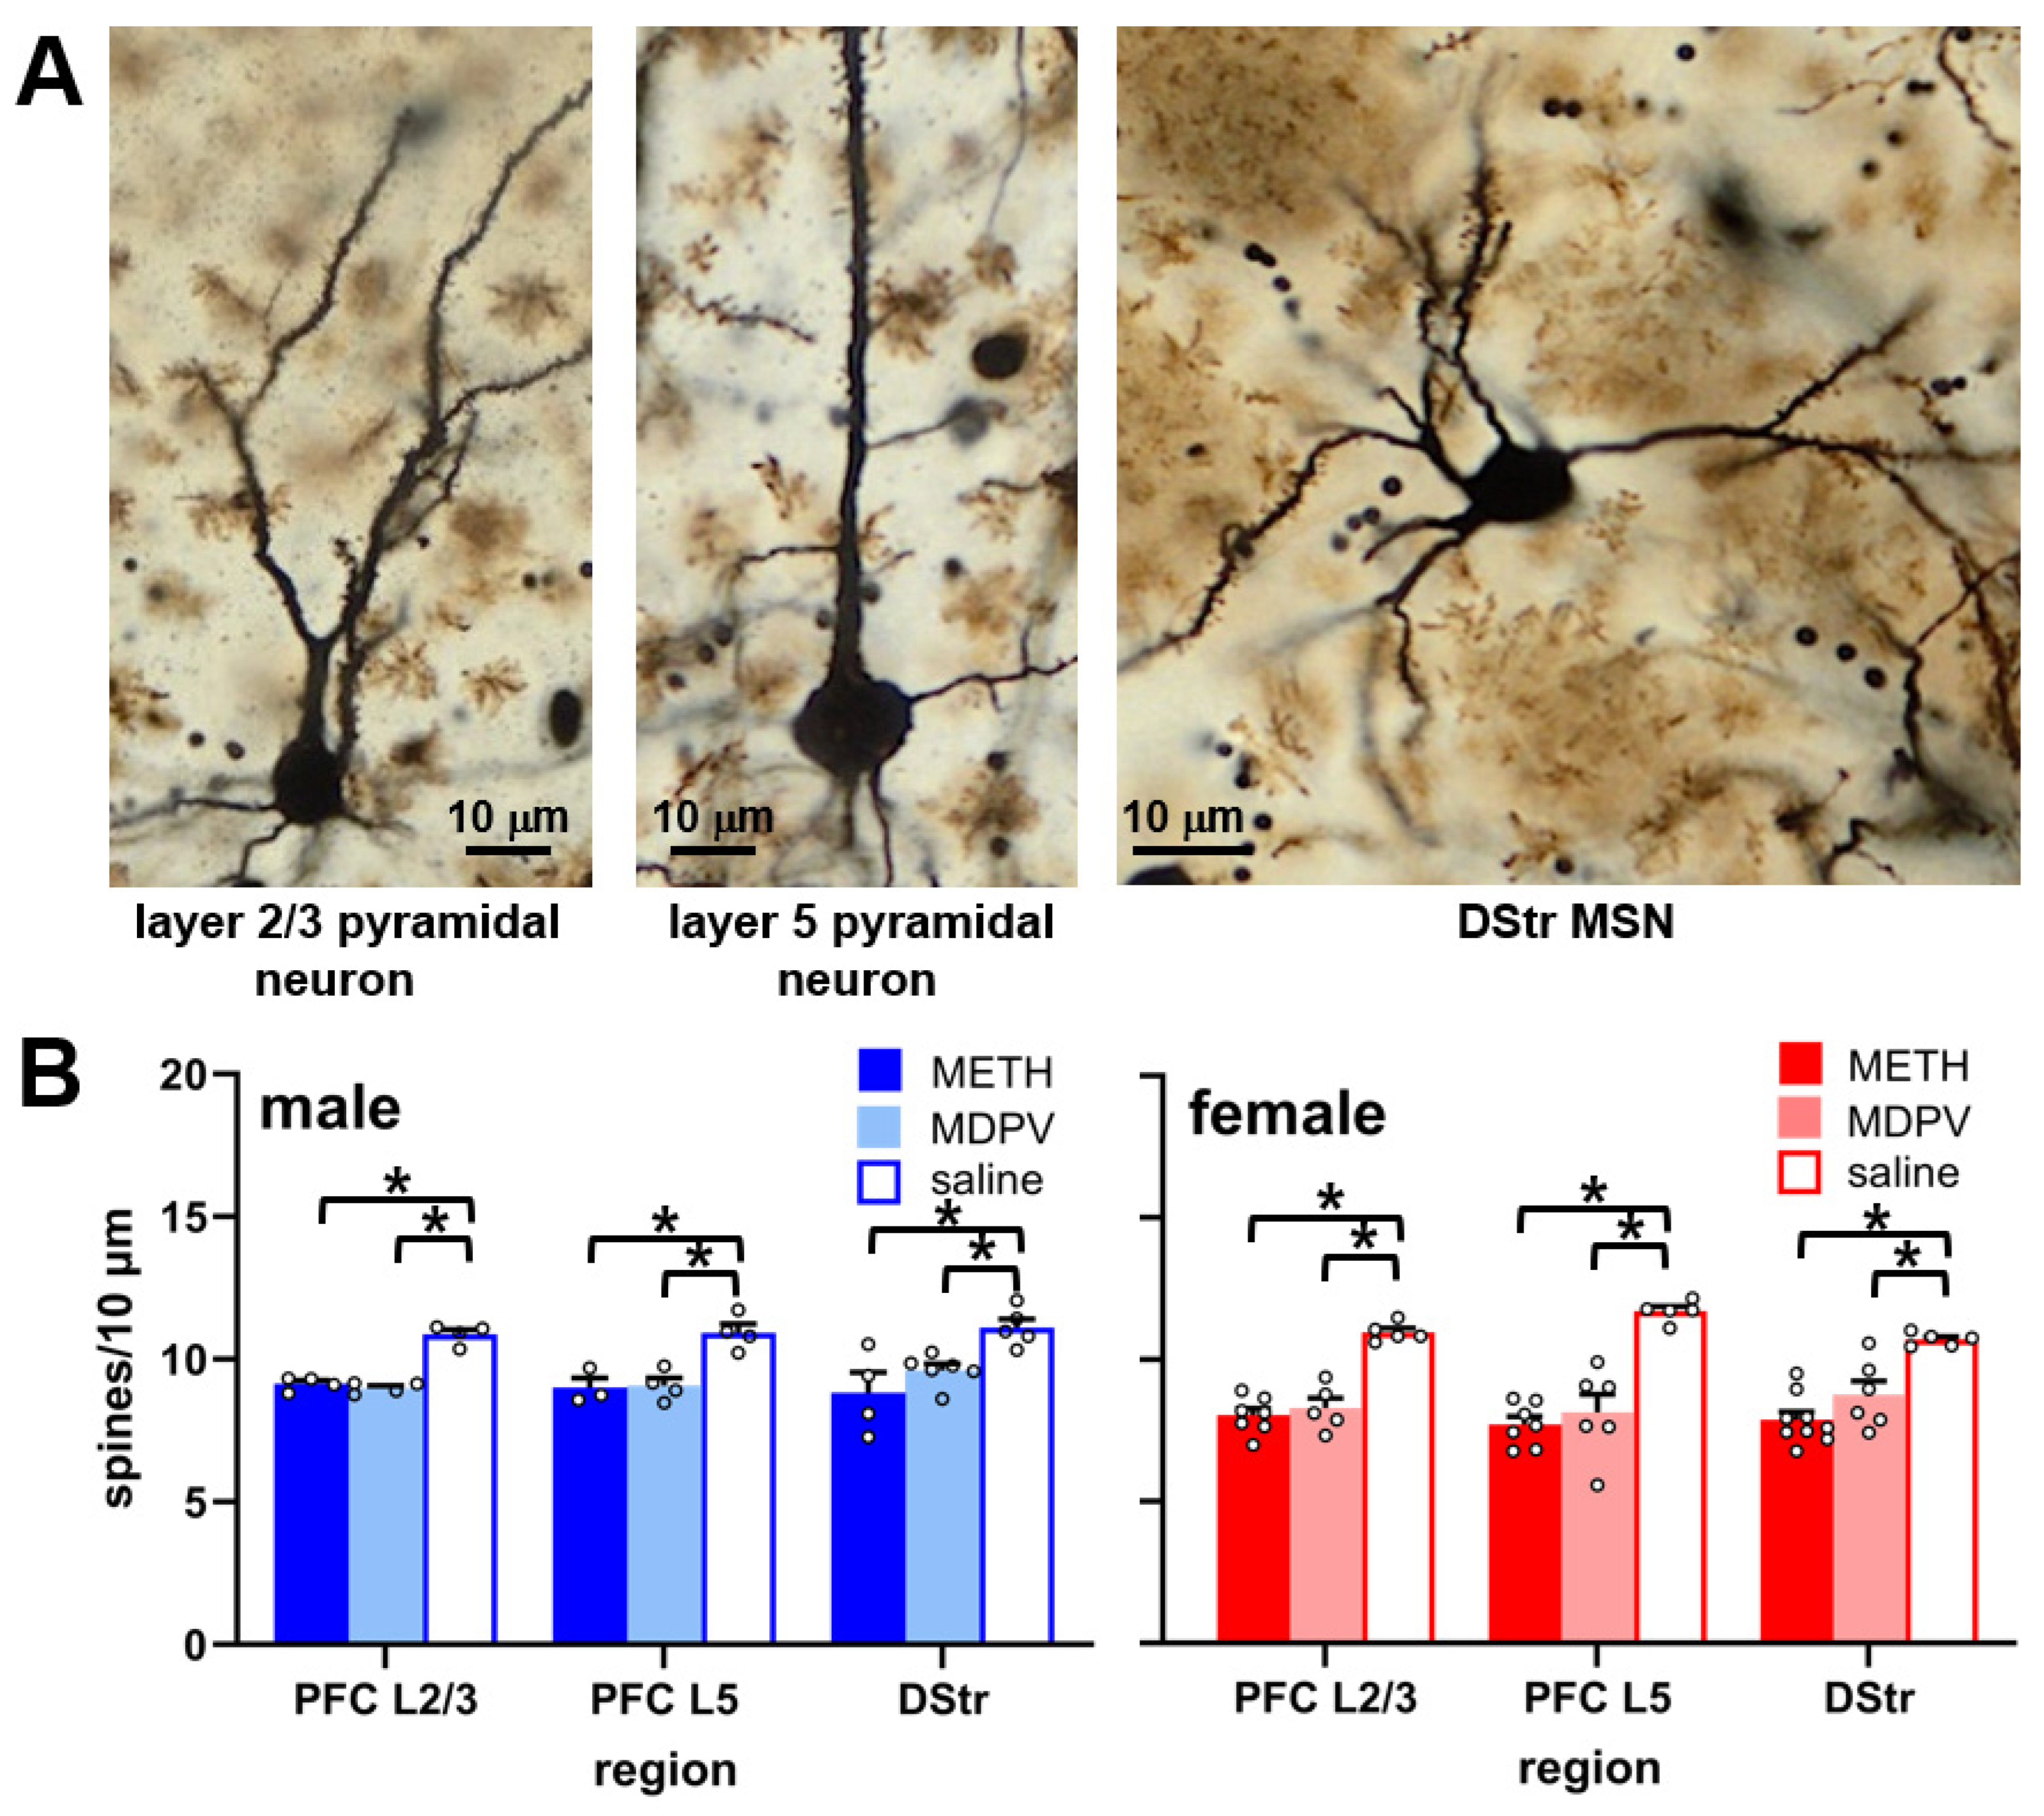
3.3. Dendritic Spine Densities in the PFC and DStr Are Reduced during Abstinence Following Repeated Binge-like Intake of METH and MDPV
3.4. Abstinence Following Repeated Binge-like Intake of METH and MDPV Is Accompanied by Reduced PFC Microglial Cell Density and Evidence of Microglial Apoptosis
3.5. Evidence for Alterations in Microglial Morphology during Abstinence Following Repeated Binge-like Intake of METH and MDPV
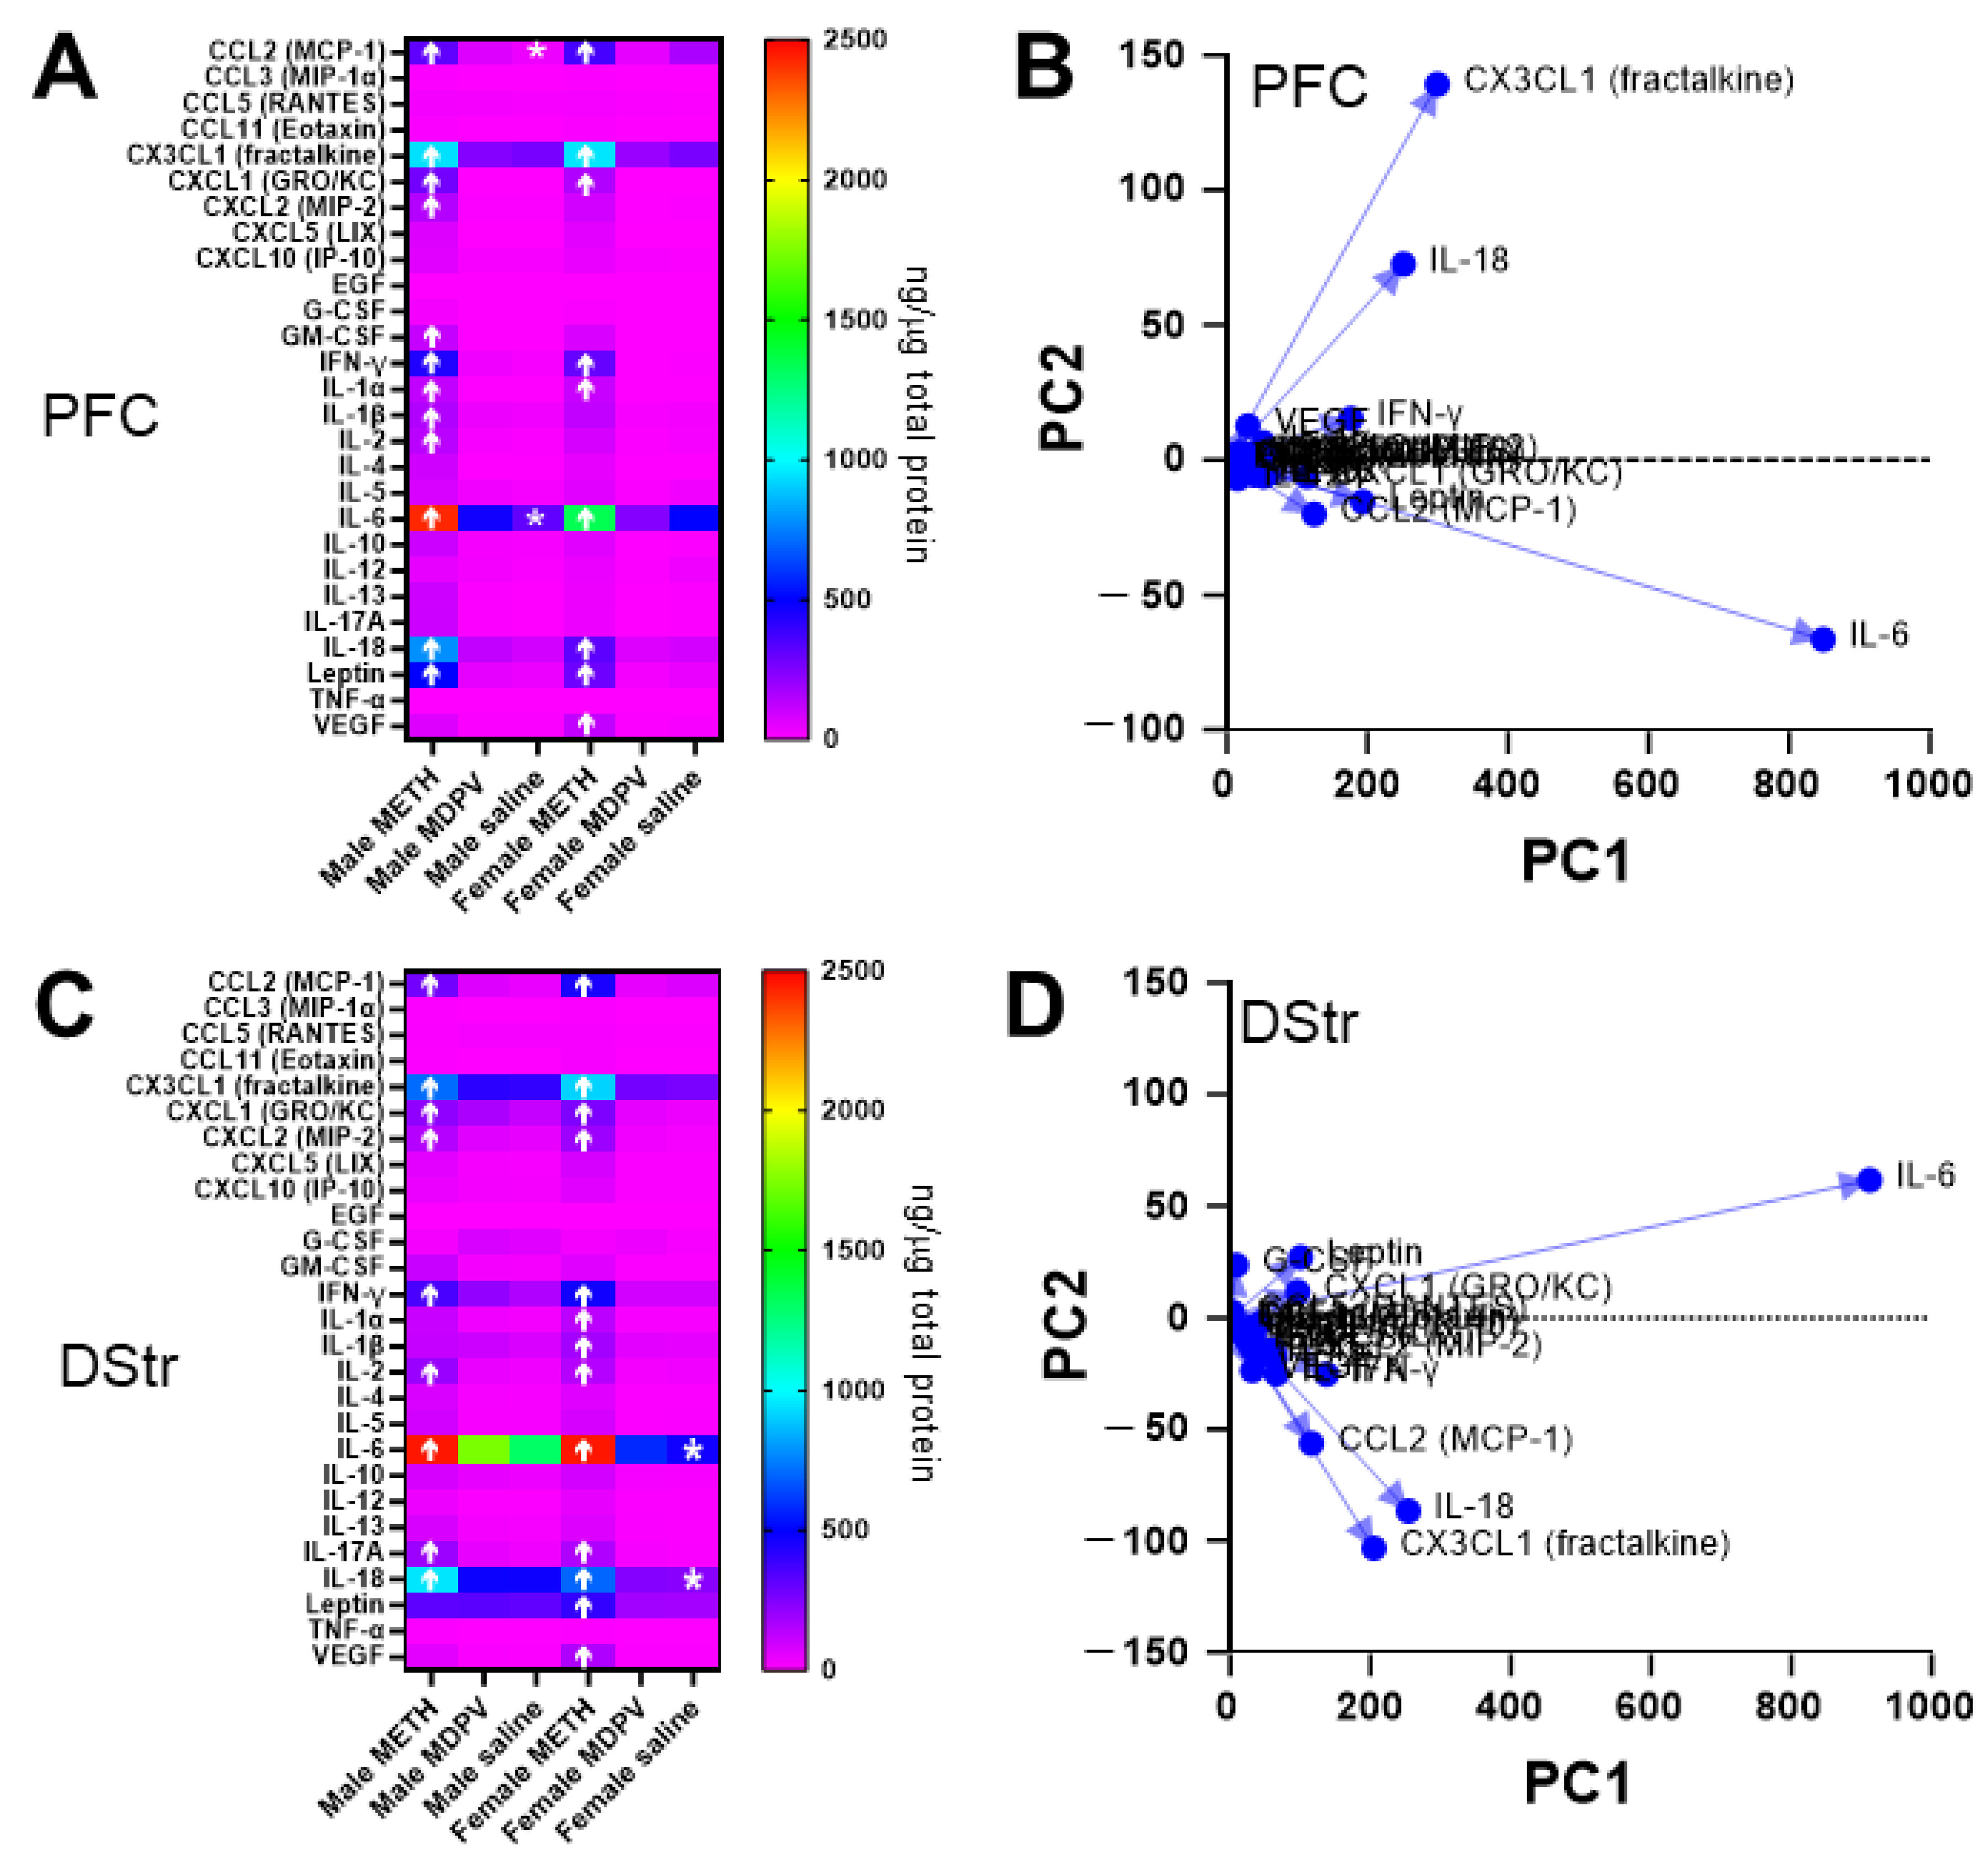
3.6. Abstinence Following Repeated Binge-like Intake of METH but Not MDPV Is Associated with Changes in Specific Cytokines in the PFC and DStr
4. Discussion
5. Conclusions
Author Contributions
Funding
Institutional Review Board Statement
Informed Consent Statement
Data Availability Statement
Acknowledgments
Conflicts of Interest
References
- DePoy, L.M.; Gourley, S.L. Synaptic Cytoskeletal Plasticity in the Prefrontal Cortex Following Psychostimulant Exposure. Traffic 2015, 16, 919–940. [Google Scholar] [CrossRef]
- Jayanthi, S.; Daiwile, A.P.; Cadet, J.L. Neurotoxicity of Methamphetamine: Main Effects and Mechanisms. Exp. Neurol. 2021, 344, 113795. [Google Scholar] [CrossRef]
- Hofford, R.S.; Russo, S.J.; Kiraly, D.D. Neuroimmune Mechanisms of Psychostimulant and Opioid Use Disorders. Eur. J. Neurosci. 2019, 50, 2562–2573. [Google Scholar] [CrossRef]
- Lacagnina, M.J.; Rivera, P.D.; Bilbo, S.D. Glial and Neuroimmune Mechanisms as Critical Modulators of Drug Use and Abuse. Neuropsychopharmacology 2017, 42, 156–177. [Google Scholar] [CrossRef]
- Bravo, J.; Magalhaes, C.; Andrade, E.B.; Magalhaes, A.; Summavielle, T. The Impact of Psychostimulants on Central and Peripheral Neuro-Immune Regulation: A Scoping Review of Cytokine Profiles and Their Implications for Addiction. Front. Cell. Neurosci. 2023, 17, 1109611. [Google Scholar] [CrossRef]
- Loftis, J.M.; Janowsky, A. Neuroimmune Basis of Methamphetamine Toxicity. Int. Rev. Neurobiol. 2014, 118, 165–197. [Google Scholar]
- Correia, C.; Romieu, P.; Olmstead, M.C.; Befort, K. Can Cocaine-Induced Neuroinflammation Explain Maladaptive Cocaine-Associated Memories? Neurosci. Biobehav. Rev. 2020, 111, 69–83. [Google Scholar] [CrossRef]
- Crews, F.T.; Zou, J.; Qin, L. Induction of Innate Immune Genes in Brain Create the Neurobiology of Addiction. Brain Behav. Immun. 2011, 25 (Suppl. S1), S4–S12. [Google Scholar] [CrossRef]
- Namba, M.D.; Leyrer-Jackson, J.M.; Nagy, E.K.; Olive, M.F.; Neisewander, J.L. Neuroimmune Mechanisms as Novel Treatment Targets for Substance Use Disorders and Associated Comorbidities. Front. Neurosci. 2021, 15, 650785. [Google Scholar] [CrossRef]
- Leyrer-Jackson, J.M.; Nagy, E.K.; Olive, M.F. Cognitive Deficits and Neurotoxicity Induced by Synthetic Cathinones: Is There a Role for Neuroinflammation? Psychopharmacology 2019, 236, 1079–1095. [Google Scholar] [CrossRef]
- Marusich, J.A.; Gay, E.A.; Stewart, D.A.; Blough, B.E. Sex Differences in Inflammatory Cytokine Levels Following Synthetic Cathinone Self-Administration in Rats. Neurotoxicology 2022, 88, 65–78. [Google Scholar] [CrossRef] [PubMed]
- Nagy, E.K.; Leyrer-Jackson, J.M.; Hood, L.E.; Acuna, A.M.; Olive, M.F. Effects of Repeated Binge Intake of the Pyrovalerone Cathinone Derivative 3,4-Methylenedioxypyrovalerone on Prefrontal Cytokine Levels in Rats—A Preliminary Study. Front. Behav. Neurosci. 2023, 17, 1275968. [Google Scholar] [CrossRef] [PubMed]
- Goncalves, J.; Martins, T.; Ferreira, R.; Milhazes, N.; Borges, F.; Ribeiro, C.F.; Malva, J.O.; Macedo, T.R.; Silva, A.P. Methamphetamine-Induced Early Increase of Il-6 and TNF-alpha mRNA Expression in the Mouse Brain. Ann. N. Y. Acad. Sci. 2008, 1139, 103–111. [Google Scholar] [CrossRef] [PubMed]
- Cearley, C.N.; Blindheim, K.; Sorg, B.A.; Krueger, J.M.; Churchill, L. Acute Cocaine Increases Interleukin-1beta mRNA and Immunoreactive Cells in the Cortex and Nucleus Accumbens. Neurochem. Res. 2011, 36, 686–692. [Google Scholar] [CrossRef] [PubMed]
- Li, S.X.; Shi, J.; Epstein, D.H.; Wang, X.; Zhang, X.L.; Bao, Y.P.; Zhang, D.; Zhang, X.Y.; Kosten, T.R.; Lu, L. Circadian Alteration in Neurobiology during 30 Days of Abstinence in Heroin Users. Biol. Psychiatry 2009, 65, 905–912. [Google Scholar] [CrossRef] [PubMed]
- Luo, Y.; He, H.; Ou, Y.; Zhou, Y.; Fan, N. Elevated Serum Levels of TNF-alpha, Il-6, and Il-18 in Chronic Methamphetamine Users. Hum. Psychopharmacol. 2021, 37, e2810. [Google Scholar] [CrossRef] [PubMed]
- Loftis, J.M.; Choi, D.; Hoffman, W.; Huckans, M.S. Methamphetamine Causes Persistent Immune Dysregulation: A Cross-Species, Translational Report. Neurotox Res. 2011, 20, 59–68. [Google Scholar] [CrossRef] [PubMed]
- Re, G.F.; Jia, J.; Xu, Y.; Zhang, Z.; Xie, Z.R.; Kong, D.; Lu, D.; Li, Y.; Peng, Q.Y.; Yu, J.; et al. Dynamics and Correlations in Multiplex Immune Profiling Reveal Persistent Immune Inflammation in Male Drug Users after Withdrawal. Int. Immunopharmacol. 2022, 107, 108696. [Google Scholar] [CrossRef] [PubMed]
- Stefański, R.; Ziółkowska, B.; Kuśmider, M.; Mierzejewski, P.; Wyszogrodzka, E.; Kołomańska, P.; Dziedzicka-Wasylewska, M.; Przewłocki, R.; Kostowski, W. Active Versus Passive Cocaine Administration: Differences in the Neuroadaptive Changes in the Brain Dopaminergic System. Brain Res. 2007, 1157, 1–10. [Google Scholar] [CrossRef]
- Palamarchouk, V.; Smagin, G.; Goeders, N.E. Self-Administered and Passive Cocaine Infusions Produce Different Effects on Corticosterone Concentrations in the Medial Prefrontal Cortex (MPC) of Rats. Pharmacol. Biochem. Behav. 2009, 94, 163–168. [Google Scholar] [CrossRef]
- Caffino, L.; Cassina, C.; Giannotti, G.; Orrù, A.; Moro, F.; Di Clemente, A.; Racagni, G.; Fumagalli, F.; Cervo, L. Short-Term Abstinence from Cocaine Self-Administration, but Not Passive Cocaine Infusion, Elevates Acamkii Autophosphorylation in the Rat Nucleus Accumbens and Medial Prefrontal Cortex. Int. J. Neuropsychopharmacol. 2014, 17, 323–329. [Google Scholar] [CrossRef]
- Miszkiel, J.; Detka, J.; Cholewa, J.; Frankowska, M.; Nowak, E.; Budziszewska, B.; Przegaliński, E.; Filip, M. The Effect of Active and Passive Intravenous Cocaine Administration on the Extracellular Signal-Regulated Kinase (ERK) Activity in the Rat Brain. Pharmacol. Rep. 2014, 66, 630–637. [Google Scholar] [CrossRef]
- Bodetto, S.P.; Romieu, P.; Sartori, M.; Tesone-Coelho, C.; Majchrzak, M.; Barbelivien, A.; Zwiller, J.; Anglard, P. Differential Regulation of Mecp2 and Pp1 in Passive or Voluntary Administration of Cocaine or Food. Int. J. Neuropsychopharmacol. 2014, 17, 2031–2044. [Google Scholar] [CrossRef]
- Radley, J.J.; Anderson, R.M.; Cosme, C.V.; Glanz, R.M.; Miller, M.C.; Romig-Martin, S.A.; LaLumiere, R.T. The Contingency of Cocaine Administration Accounts for Structural and Functional Medial Prefrontal Deficits and Increased Adrenocortical Activation. J. Neurosci. 2015, 35, 11897–11910. [Google Scholar] [CrossRef]
- Adkins, A.M.; Wellman, L.L.; Sanford, L.D. Controllable and Uncontrollable Stress Differentially Impact Fear Conditioned Alterations in Sleep and Neuroimmune Signaling in Mice. Life 2022, 12, 1320. [Google Scholar] [CrossRef]
- Sewalia, K.; Watterson, L.R.; Hryciw, A.; Belloc, A.; Ortiz, J.B.; Olive, M.F. Neurocognitive Dysfunction Following Repeated Binge-Like Self-Administration of the Synthetic Cathinone 3,4-Methylenedioxypyrovalerone (Mdpv). Neuropharmacology 2018, 134, 36–45. [Google Scholar] [CrossRef]
- Miotto, K.; Striebel, J.; Cho, A.K.; Wang, C. Clinical and Pharmacological Aspects of Bath Salt Use: A Review of the Literature and Case Reports. Drug Alcohol Depend. 2013, 132, 1–12. [Google Scholar] [CrossRef]
- Palamar, J.J.; Martins, S.S.; Su, M.K.; Ompad, D.C. Self-Reported Use of Novel Psychoactive Substances in a Us Nationally Representative Survey: Prevalence, Correlates, and a Call for New Survey Methods to Prevent Underreporting. Drug Alcohol Depend. 2015, 156, 112–119. [Google Scholar] [CrossRef]
- Ordak, M.; Nasierowski, T.; Muszynska, E.; Bujalska-Zadrozny, M. The Psychiatric Characteristics of People on a Mephedrone (“Bath Salts”) Binge. Subst. Use Misuse 2020, 55, 1610–1617. [Google Scholar] [CrossRef]
- Cho, A.K.; Melega, W.P. Patterns of Methamphetamine Abuse and Their Consequences. J. Addict. Dis. 2002, 21, 21–34. [Google Scholar] [CrossRef]
- Simon, S.L.; Richardson, K.; Dacey, J.; Glynn, S.; Domier, C.P.; Rawson, R.A.; Ling, W. A Comparison of Patterns of Methamphetamine and Cocaine Use. J. Addict. Dis. 2002, 21, 35–44. [Google Scholar] [CrossRef]
- Cornett, E.M.; Goeders, N.E. 96-h Methamphetamine Self-Administration in Male and Female Rats: A Novel Model of Human Methamphetamine Addiction. Pharmacol. Biochem. Behav. 2013, 111, 51–57. [Google Scholar] [CrossRef]
- Nagy, E.K.; Overby, P.F.; Olive, M.F. Reinforcing Effects of the Synthetic Cathinone alpha-Pyrrolidinopropiophenone (a-PPP) in a Repeated Extended Access Binge Paradigm. Front. Psychiatry 2020, 11, 862. [Google Scholar] [CrossRef]
- National Institutes of Health. Guide for the Care and Use of Laboratory Animals, 8th ed.; The National Academies Press: Washington, DC, USA, 2011. [Google Scholar]
- Watterson, L.R.; Kufahl, P.R.; Nemirovsky, N.E.; Sewalia, K.; Grabenauer, M.; Thomas, B.F.; Marusich, J.A.; Wegner, S.; Olive, M.F. Potent Rewarding and Reinforcing Effects of the Synthetic Cathinone 3,4-Methylenedioxypyrovalerone (MDPV). Addict. Biol. 2014, 19, 165–174. [Google Scholar] [CrossRef]
- Twining, R.C.; Bolan, M.; Grigson, P.S. Yoked Delivery of Cocaine Is Aversive and Protects against the Motivation for Drug in Rats. Behav. Neurosci. 2009, 123, 913–925. [Google Scholar] [CrossRef]
- Paxinos, G.; Watson, C. The Rat Brain in Stereotaxic Coordinates; Elsevier Academic Press: San Diego, CA, USA, 2014. [Google Scholar]
- Abbass, M.; Trought, K.; Long, D.; Semechko, A.; Wong, A.H.C. Automated Immunohistochemical Method to Analyze Large Areas of the Human Cortex. J. Neurosci. Methods 2018, 294, 81–90. [Google Scholar] [CrossRef]
- York, E.M.; LeDue, J.M.; Bernier, L.P.; MacVicar, B.A. 3DMorph Automatic Analysis of Microglial Morphology in Three Dimensions from ex vivo and in vivo Imaging. eNeuro 2018, 5, e0266-0218.2018. [Google Scholar] [CrossRef]
- Bernier, L.P.; York, E.M.; Kamyabi, A.; Choi, H.B.; Weilinger, N.L.; MacVicar, B.A. Microglial Metabolic Flexibility Supports Immune Surveillance of the Brain Parenchyma. Nat. Commun. 2020, 11, 1559. [Google Scholar] [CrossRef]
- Morton, L.; Arndt, P.; Garza, A.P.; Henneicke, S.; Mattern, H.; Gonzalez, M.; Dityatev, A.; Yilmazer-Hanke, D.; Schreiber, S.; Dunay, I.R. Spatio-Temporal Dynamics of Microglia Phenotype in Human and Murine cSDV: Impact of Acute and Chronic Hypertensive States. Acta Neuropathol. Commun. 2023, 11, 204. [Google Scholar] [CrossRef]
- Coffey, K.R.; Lesiak, A.J.; Marx, R.G.; Vo, E.K.; Garden, G.A.; Neumaier, J.F. A Camp-Related Gene Network in Microglia Is Inversely Regulated by Morphine Tolerance and Withdrawal. Biol. Psychiatry Glob. Open Sci. 2022, 2, 180–189. [Google Scholar] [CrossRef]
- Levine, N.D.; Rademacher, D.J.; Collier, T.J.; O’Malley, J.A.; Kells, A.P.; San Sebastian, W.; Bankiewicz, K.S.; Steece-Collier, K. Advances in Thin Tissue Golgi-Cox Impregnation: Fast, Reliable Methods for Multi-Assay Analyses in Rodent and Non-Human Primate Brain. J. Neurosci. Methods 2013, 213, 214–227. [Google Scholar] [CrossRef]
- Du, F. Golgi-Cox Staining of Neuronal Dendrites and Dendritic Spines with FD Rapid Golgistain Kit. Curr. Prot. Neurosci. 2019, 88, e69. [Google Scholar] [CrossRef]
- Jedynak, J.P.; Uslaner, J.M.; Esteban, J.A.; Robinson, T.E. Methamphetamine-Induced Structural Plasticity in the Dorsal Striatum. Eur. J. Neurosci. 2007, 25, 847–853. [Google Scholar] [CrossRef]
- Coutinho, A.; Flynn, C.; Burdo, T.H.; Mervis, R.F.; Fox, H.S. Chronic Methamphetamine Induces Structural Changes in Frontal Cortex Neurons and Upregulates Type I Interferons. J. Neuroimmune Pharmacol. 2008, 3, 241–245. [Google Scholar] [CrossRef]
- Rasakham, K.; Schmidt, H.D.; Kay, K.; Huizenga, M.N.; Calcagno, N.; Pierce, R.C.; Spires-Jones, T.L.; Sadri-Vakili, G. Synapse Density and Dendritic Complexity Are Reduced in the Prefrontal Cortex Following Seven Days of Forced Abstinence from Cocaine Self-Administration. PLoS ONE 2014, 9, e102524. [Google Scholar] [CrossRef]
- Wilson, C.J.; Groves, P.M.; Kitai, S.T.; Linder, J.C. Three-Dimensional Structure of Dendritic Spines in the Rat Neostriatum. J. Neurosci. 1983, 3, 383–388. [Google Scholar] [CrossRef]
- Ko, M.J.; Mulia, G.E.; van Rijn, R.M. Commonly Used Anesthesia/Euthanasia Methods for Brain Collection Differentially Impact Mapk Activity in Male and Female C57bl/6 Mice. Front. Cell. Neurosci. 2019, 13, 96. [Google Scholar] [CrossRef]
- Walker, W.H., 2nd; Bumgarner, J.R.; Nelson, R.J.; Courtney DeVries, A. Transcardial Perfusion Is Not Required to Accurately Measure Cytokines within the Brain. J. Neurosci. Methods 2020, 334, 108601. [Google Scholar] [CrossRef]
- Reichel, C.M.; Chan, C.H.; Ghee, S.M.; See, R.E. Sex Differences in Escalation of Methamphetamine Self-Administration: Cognitive and Motivational Consequences in Rats. Psychopharmacology 2012, 223, 371–380. [Google Scholar] [CrossRef]
- Abbott, M.S.; Seaman, R.W., Jr.; Doyle, M.R.; Maguire, D.R.; Rice, K.C.; Collins, G.T. Interactions between Impulsivity and MDPV Self-Administration in Rats. Addict. Biol. 2022, 27, e13168. [Google Scholar] [CrossRef]
- Hambuchen, M.D.; Hendrickson, H.P.; Gunnell, M.G.; McClenahan, S.J.; Ewing, L.E.; Gibson, D.M.; Berquist, M.D.; Owens, S.M. The Pharmacokinetics of Racemic MDPV and Its (R) and (S) Enantiomers in Female and Male Rats. Drug Alcohol Depend. 2017, 179, 347–354. [Google Scholar] [CrossRef]
- Pu, C.; Vorhees, C.V. Developmental Dissociation of Methamphetamine-Induced Depletion of Dopaminergic Terminals and Astrocyte Reaction in Rat Striatum. Dev. Brain Res. 1993, 72, 325–328. [Google Scholar] [CrossRef]
- Zhu, J.P.; Xu, W.; Angulo, J.A. Disparity in the Temporal Appearance of Methamphetamine-Induced Apoptosis and Depletion of Dopamine Terminal Markers in the Striatum of Mice. Brain Res. 2005, 1049, 171–181. [Google Scholar] [CrossRef]
- Gonçalves, J.; Leitão, R.A.; Higuera-Matas, A.; Assis, M.A.; Coria, S.M.; Fontes-Ribeiro, C.; Ambrosio, E.; Silva, A.P. Extended-Access Methamphetamine Self-Administration Elicits Neuroinflammatory Response along with Blood-Brain Barrier Breakdown. Brain Behav. Immun. 2017, 62, 306–317. [Google Scholar] [CrossRef]
- Campeão, M.; Fernandes, L.; Pita, I.R.; Lemos, C.; Ali, S.F.; Carvalho, F.; Rodrigues-Santos, P.; Fontes-Ribeiro, C.A.; Soares, E.; Viana, S.D.; et al. Acute MDPV Binge Paradigm on Mice Emotional Behavior and Glial Signature. Pharmaceuticals 2021, 14, 271. [Google Scholar] [CrossRef]
- Tehrani, A.M.; Boroujeni, M.E.; Aliaghaei, A.; Feizi, M.A.H.; Safaralizadeh, R. Methamphetamine Induces Neurotoxicity-Associated Pathways and Stereological Changes in Prefrontal Cortex. Neurosci. Lett. 2019, 712, 134478. [Google Scholar] [CrossRef]
- Kitamura, O.; Takeichi, T.; Wang, E.L.; Tokunaga, I.; Ishigami, A.; Kubo, S. Microglial and Astrocytic Changes in the Striatum of Methamphetamine Abusers. Leg. Med. 2010, 12, 57–62. [Google Scholar] [CrossRef]
- Lee, Y.; Su, M.; Messing, A.; Brenner, M. Astrocyte Heterogeneity Revealed by Expression of a GFAP-LacZ Transgene. Glia 2006, 53, 677–687. [Google Scholar] [CrossRef]
- Baldwin, K.T.; Murai, K.K.; Khakh, B.S. Astrocyte Morphology. Trends Cell Biol. 2023. [Google Scholar] [CrossRef]
- Miner, N.B.; O’Callaghan, J.P.; Phillips, T.J.; Janowsky, A. The Combined Effects of 3,4-Methylenedioxymethamphetamine (MDMA) and Selected Substituted Methcathinones on Measures of Neurotoxicity. Neurotoxicol. Teratol. 2017, 61, 74–81. [Google Scholar] [CrossRef]
- Zhu, J.P.; Xu, W.; Angulo, N.; Angulo, J.A. Methamphetamine-Induced Striatal Apoptosis in the Mouse Brain: Comparison of a Binge to an Acute Bolus Drug Administration. Neurotoxicology 2006, 27, 131–136. [Google Scholar] [CrossRef]
- Kuczenski, R.; Everall, I.P.; Crews, L.; Adame, A.; Grant, I.; Masliah, E. Escalating Dose-Multiple Binge Methamphetamine Exposure Results in Degeneration of the Neocortex and Limbic System in the Rat. Exp. Neurol. 2007, 207, 42–51. [Google Scholar] [CrossRef]
- Ding, J.; Huang, J.; Tang, X.; Shen, L.; Hu, S.; He, J.; Liu, T.; Yu, Z.; Liu, Y.; Wang, Q.; et al. Low and High Dose Methamphetamine Differentially Regulate Synaptic Structural Plasticity in Cortex and Hippocampus. Front. Cell. Neurosci. 2022, 16, 1003617. [Google Scholar] [CrossRef]
- Kim, A.; Mandyam, C.D. Methamphetamine Affects Cell Proliferation in the Medial Prefrontal Cortex: A New Niche for Toxicity. Pharmacol. Biochem. Behav. 2014, 126C, 90–96. [Google Scholar] [CrossRef]
- Mullen, R.J.; Buck, C.R.; Smith, A.M. NeuN, a Neuronal Specific Nuclear Protein in Vertebrates. Development 1992, 116, 201–211. [Google Scholar] [CrossRef]
- Weyer, A.; Schilling, K. Developmental and Cell Type-Specific Expression of the Neuronal Marker Neun in the Murine Cerebellum. J. Neurosci. Res. 2003, 73, 400–409. [Google Scholar] [CrossRef]
- Kumar, S.S.; Buckmaster, P.S. Neuron-Specific Nuclear Antigen NeuN Is Not Detectable in Gerbil Subtantia Nigra Pars Reticulata. Brain Res. 2007, 1142, 54–60. [Google Scholar] [CrossRef]
- Escubedo, E.; Guitart, L.; Sureda, F.X.; Jiménez, A.; Pubill, D.; Pallàs, M.; Camins, A.; Camarasa, J. Microgliosis and Down-Regulation of Adenosine Transporter Induced by Methamphetamine in Rats. Brain Res. 1998, 814, 120–126. [Google Scholar] [CrossRef]
- Sekine, Y.; Ouchi, Y.; Sugihara, G.; Takei, N.; Yoshikawa, E.; Nakamura, K.; Iwata, Y.; Tsuchiya, K.J.; Suda, S.; Suzuki, K.; et al. Methamphetamine Causes Microglial Activation in the Brains of Human Abusers. J. Neurosci. 2008, 28, 5756–5761. [Google Scholar] [CrossRef]
- Matsudaira, T.; Prinz, M. Life and Death of Microglia: Mechanisms Governing Microglial States and Fates. Immunol. Lett. 2022, 245, 51–60. [Google Scholar] [CrossRef]
- Paolicelli, R.C.; Sierra, A.; Stevens, B.; Tremblay, M.E.; Aguzzi, A.; Ajami, B.; Amit, I.; Audinat, E.; Bechmann, I.; Bennett, M.; et al. Microglia States and Nomenclature: A Field at Its Crossroads. Neuron 2022, 110, 3458–3483. [Google Scholar] [CrossRef]
- Ball, J.B.; Green-Fulgham, S.M.; Watkins, L.R. Mechanisms of Microglia-Mediated Synapse Turnover and Synaptogenesis. Prog. Neurobiol. 2022, 218, 102336. [Google Scholar] [CrossRef]
- Wilton, D.K.; Dissing-Olesen, L.; Stevens, B. Neuron-Glia Signaling in Synapse Elimination. Annu. Rev. Neurosci. 2019, 42, 107–127. [Google Scholar] [CrossRef]
- Frank, M.G.; Adhikary, S.; Sobesky, J.L.; Weber, M.D.; Watkins, L.R.; Maier, S.F. The Danger-Associated Molecular Pattern Hmgb1 Mediates the Neuroinflammatory Effects of Methamphetamine. Brain Behav. Immun. 2016, 51, 99–108. [Google Scholar] [CrossRef]
- Gou, H.; Sun, D.; Hao, L.; An, M.; Xie, B.; Cong, B.; Ma, C.; Wen, D. Cholecystokinin-8 Attenuates Methamphetamine-Induced Inflammatory Activation of Microglial Cells through Cck2 Receptor. Neurotoxicology 2020, 81, 70–79. [Google Scholar] [CrossRef]
- Robson, M.J.; Turner, R.C.; Naser, Z.J.; McCurdy, C.R.; Huber, J.D.; Matsumoto, R.R. SN79, a Sigma Receptor Ligand, Blocks Methamphetamine-Induced Microglial Activation and Cytokine Upregulation. Exp. Neurol. 2013, 247, 134–142. [Google Scholar] [CrossRef]
- Seminerio, M.J.; Robson, M.J.; McCurdy, C.R.; Matsumoto, R.R. Sigma Receptor Antagonists Attenuate Acute Methamphetamine-Induced Hyperthermia by a Mechanism Independent of Il-1beta mRNA Expression in the Hypothalamus. Eur. J. Pharmacol. 2012, 691, 103–109. [Google Scholar] [CrossRef]
- Namyen, J.; Permpoonputtana, K.; Nopparat, C.; Tocharus, J.; Tocharus, C.; Govitrapong, P. Protective Effects of Melatonin on Methamphetamine-Induced Blood-Brain Barrier Dysfunction in Rat Model. Neurotox Res. 2020, 37, 640–660. [Google Scholar] [CrossRef] [PubMed]
- Canedo, T.; Portugal, C.C.; Socodato, R.; Almeida, T.O.; Terceiro, A.F.; Bravo, J.; Silva, A.I.; Magalhaes, J.D.; Guerra-Gomes, S.; Oliveira, J.F.; et al. Astrocyte-Derived TNF and Glutamate Critically Modulate Microglia Activation by Methamphetamine. Neuropsychopharmacology 2021, 46, 2358–2370. [Google Scholar] [CrossRef]
- Stolyarova, A.; Thompson, A.B.; Barrientos, R.M.; Izquierdo, A. Reductions in Frontocortical Cytokine Levels Are Associated with Long-Lasting Alterations in Reward Valuation after Methamphetamine. Neuropsychopharmacology 2015, 40, 1234–1242. [Google Scholar] [CrossRef] [PubMed]
- Coelho-Santos, V.; Goncalves, J.; Fontes-Ribeiro, C.; Silva, A.P. Prevention of Methamphetamine-Induced Microglial Cell Death by TNF-Alpha and Il-6 through Activation of the Jak-Stat Pathway. J. Neuroinflammation 2012, 9, 103. [Google Scholar] [CrossRef] [PubMed]
- Hudson, S.P.; Jacobson-Pick, S.; Anisman, H. Sex Differences in Behavior and Pro-Inflammatory Cytokine mRNA Expression following Stressor Exposure and Re-Exposure. Neuroscience 2014, 277, 239–249. [Google Scholar] [CrossRef] [PubMed]
- Pascual, M.; Montesinos, J.; Marcos, M.; Torres, J.L.; Costa-Alba, P.; Garcia-Garcia, F.; Laso, F.J.; Guerri, C. Gender Differences in the Inflammatory Cytokine and Chemokine Profiles Induced by Binge Ethanol Drinking in Adolescence. Addict. Biol. 2017, 22, 1829–1841. [Google Scholar] [CrossRef] [PubMed]
- Angoa-Perez, M.; Kuhn, D.M. The Pharmacology and Neurotoxicology of Synthetic Cathinones. Adv. Pharmacol. 2024, 99, 61–82. [Google Scholar] [PubMed]
- Wright, C.B.; Sacco, R.L.; Rundek, T.; Delman, J.; Rabbani, L.; Elkind, M. Interleukin-6 Is Associated with Cognitive Function: The Northern Manhattan Study. J. Stroke Cerebrovasc. Dis. 2006, 15, 34–38. [Google Scholar] [CrossRef] [PubMed]
- Wang, T.Y.; Lu, R.B.; Lee, S.Y.; Chang, Y.H.; Chen, S.L.; Tsai, T.Y.; Tseng, H.H.; Chen, P.S.; Chen, K.C.; Yang, Y.K.; et al. Association between Inflammatory Cytokines, Executive Function, and Substance Use in Patients with Opioid Use Disorder and Amphetamine-Type Stimulants Use Disorder. Int. J. Neuropsychopharmacol. 2023, 26, 42–51. [Google Scholar] [CrossRef]
- Levandowski, M.L.; Hess, A.R.B.; Grassi-Oliveira, R.; de Almeida, R.M.M. Plasma Interleukin-6 and Executive Function in Crack Cocaine-Dependent Women. Neurosci. Lett. 2016, 628, 85–90. [Google Scholar] [CrossRef] [PubMed]
- Kohno, M.; Link, J.; Dennis, L.E.; McCready, H.; Huckans, M.; Hoffman, W.F.; Loftis, J.M. Neuroinflammation in Addiction: A Review of Neuroimaging Studies and Potential Immunotherapies. Pharmacol. Biochem. Behav. 2019, 179, 34–42. [Google Scholar] [CrossRef]
- London, E.D.; Kohno, M.; Morales, A.M.; Ballard, M.E. Chronic Methamphetamine Abuse and Corticostriatal Deficits Revealed by Neuroimaging. Brain Res. 2015, 1628, 174–185. [Google Scholar] [CrossRef]
- Gannon, B.M.; Galindo, K.I.; Rice, K.C.; Collins, G.T. Individual Differences in the Relative Reinforcing Effects of 3,4-Methylenedioxypyrovalerone under Fixed and Progressive Ratio Schedules of Reinforcement in Rats. J. Pharmacol. Exp. Ther. 2017, 361, 181–189. [Google Scholar] [CrossRef]
- Pickens, R.; Meisch, R.A.; McGuire, L.E. Methamphetamine Reinforcement in Rats. Psychonom. Sci. 1967, 8, 371–372. [Google Scholar] [CrossRef]


Disclaimer/Publisher’s Note: The statements, opinions and data contained in all publications are solely those of the individual author(s) and contributor(s) and not of MDPI and/or the editor(s). MDPI and/or the editor(s) disclaim responsibility for any injury to people or property resulting from any ideas, methods, instructions or products referred to in the content. |
© 2024 by the authors. Licensee MDPI, Basel, Switzerland. This article is an open access article distributed under the terms and conditions of the Creative Commons Attribution (CC BY) license (https://creativecommons.org/licenses/by/4.0/).
Share and Cite
Nagy, E.K.; Overby, P.F.; Leyrer-Jackson, J.M.; Carfagno, V.F.; Acuña, A.M.; Olive, M.F. Methamphetamine and the Synthetic Cathinone 3,4-Methylenedioxypyrovalerone (MDPV) Produce Persistent Effects on Prefrontal and Striatal Microglial Morphology and Neuroimmune Signaling Following Repeated Binge-like Intake in Male and Female Rats. Brain Sci. 2024, 14, 435. https://0-doi-org.brum.beds.ac.uk/10.3390/brainsci14050435
Nagy EK, Overby PF, Leyrer-Jackson JM, Carfagno VF, Acuña AM, Olive MF. Methamphetamine and the Synthetic Cathinone 3,4-Methylenedioxypyrovalerone (MDPV) Produce Persistent Effects on Prefrontal and Striatal Microglial Morphology and Neuroimmune Signaling Following Repeated Binge-like Intake in Male and Female Rats. Brain Sciences. 2024; 14(5):435. https://0-doi-org.brum.beds.ac.uk/10.3390/brainsci14050435
Chicago/Turabian StyleNagy, Erin K., Paula F. Overby, Jonna M. Leyrer-Jackson, Vincent F. Carfagno, Amanda M. Acuña, and M. Foster Olive. 2024. "Methamphetamine and the Synthetic Cathinone 3,4-Methylenedioxypyrovalerone (MDPV) Produce Persistent Effects on Prefrontal and Striatal Microglial Morphology and Neuroimmune Signaling Following Repeated Binge-like Intake in Male and Female Rats" Brain Sciences 14, no. 5: 435. https://0-doi-org.brum.beds.ac.uk/10.3390/brainsci14050435