1. Introduction
Vibrations that propagate from the ground into buildings can pose significant challenges not only to the structural integrity of these buildings but also to the well-being and comfort of their occupants. These challenges extend beyond more physical harm or the accelerated deterioration of building materials; they intrude into the daily lives of individuals, affecting their comfort and, in severe instances, their health. Residents and users of buildings may find themselves contending with a range of adverse effects, from minor annoyances to serious health implications.
One of the primary concerns with ground-borne vibrations is their impact on the structural health of buildings. Continuous exposure to vibrations can lead to the development of micro-cracks in the building’s foundation and walls, compromising the building’s overall stability and safety. Moreover, the vibratory motion can accelerate the wear and tear of construction materials, leading to premature aging of the building and necessitating more frequent repairs and maintenance, thus increasing the financial burden on property owners and managers. This effect becomes worse against multi-hazard occurrences, for example, due to additional vibrations induced by the wind [
1].
Beyond the structural implications, the human impact of these vibrations cannot be overstated. Inside the buildings, vibrations can disturb the peace and quiet that occupants expect from their living and working environments. The physical sensation of vibrations can be particularly bothersome, disrupting concentration and relaxation. In extreme cases, the persistent presence of low-frequency vibrations—ranging from 5 to 25 Hz, which coincides with the resonant frequencies of human internal organs—can lead to more severe health issues. Individuals may experience sleep disturbances, which in turn can contribute to a range of psychological and physical health problems, including headaches, chronic fatigue, and even neurotic states. The evidence from a broad array of studies [
2,
3,
4,
5] supports these findings, highlighting the need for further investigation and action. In [
2], references to the impact of vibrations on human sleep quality can be found, while [
3] presents a more medical approach to the influence of vibrations on heart rate. Ref. [
4] highlights the particular impact of low-frequency vibrations on human health, whereas [
5] provides a comprehensive view of the impact of transportation vibrations as a detrimental factor to both physical and mental health. Despite the considerable body of research on this topic and the existence of normative standards designed to mitigate the impact of vibrations, there remains a gap in our full understanding and management of this issue. The subjective nature of vibration perception—how vibrations are experienced differently by individuals—poses a significant challenge to developing universal guidelines and solutions. This variability in perception is influenced by several factors, including an individual’s health, sensitivity to motion, and even psychological predisposition to stress or anxiety caused by environmental conditions. The evolving understanding of the effects of ground-borne vibrations on humans and structures has led to changes and updates in both national and international regulatory standards, such as those encapsulated in ISO standards [
6,
7]. These adjustments reflect the ongoing research and growing awareness of the need for comprehensive approaches to vibration management. They aim to provide clearer guidelines for the construction of buildings and the development of urban areas, ensuring that both the physical integrity of structures and the health and comfort of their occupants are safeguarded.
People can perceive transportation-originated vibrations in two distinct ways: active and passive. The active mode of vibration perception relates to situations where individuals themselves generate vibrations, mainly applicable to machine operators or drivers. In contrast, passive reception of vibrations occurs when individuals have no influence over the source of the vibrations. The difference between active and passive reception of vibrations is vividly illustrated by the example of a car with a driver and a passenger. The driver, steering the car, anticipates turns or road irregularities that they decide to navigate through. This anticipation allows the driver to mentally and physically prepare for the upcoming vibrations, leading to a more controlled and less startling experience. The driver’s active role in generating and anticipating vibrations results in a perception that is often less bothersome or disturbing. This preparation might involve bracing for impact, adjusting the vehicle’s speed, or strategically choosing a path that minimizes discomfort from vibrations. On the other hand, for the passenger, these same situations are unexpected and uncontrolled. The passenger does not have the same awareness or control over the vehicle’s movements, making each bump, turn, or vibration a sudden and possibly unsettling experience. This lack of anticipation and control exemplifies the passive reception of vibrations. Passengers are subjected to movements and vibrations generated by the vehicle without any prior knowledge or the ability to mitigate their impact. This can result in a more intense perception of discomfort, as the element of surprise can exacerbate the physical sensation of the vibrations. The psychological aspect of anticipation plays a significant role in the active and passive reception of vibrations. When individuals are actively involved in the generation of vibrations, their preparedness and control over the situation can significantly reduce the perceived intensity and discomfort of those vibrations. In contrast, the absence of control and predictability in passive reception can lead to heightened sensitivity and discomfort. In summary, the perception of transportation-originated vibrations differs markedly between active participants, like drivers or machine operators, who can anticipate and control their exposure, and passive recipients, such as passengers, who experience these vibrations without forewarning or control.
The results of research on the impact of vibrations caused by transportation means on people who passively receive these vibrations have been presented in many scientific works [
8,
9,
10,
11,
12,
13]. In [
8] authors analyze the road traffic influence on the dynamic structural behavior of the building and human perception of vibration caused by busy roadways. Meanwhile, in [
9], the authors explore the impact of vibrations caused by trains on individuals perceiving these vibrations passively. Foundations for the current understanding of the impact of vibrations on humans in buildings were laid out in [
10]. The analysis focused on the influence of building vibrations on the perceptibility of vibrations by individuals, regardless of their source. The contemporary approach to the impact of vibrations on individuals, combined with the influence of noise, can be found in [
11]. Similarly, in [
12], not only noise but also vibrations, in this case caused by railway traffic, were indicated as stress-inducing factors. In [
13] once again, the focus was on the influence of transportation vibrations, but there was also an attempt to predict the behavior of the floor under the influence of vibrations. A modern approach was also applied in [
14], where the propagation of waves in the ground was also considered. These analyses cover various aspects, including the intensity of vibrations, their frequency, and the impact of these vibrations on the well-being and health of individuals. However, the available literature lacks a global, comprehensive approach to the issue, which would allow for a full understanding of the scale and specificity of the impact of transportation vibrations on people in buildings.
In many studies, detailed results regarding the impact of vibrations on humans are presented without proper context, which complicates the drawing of general conclusions. Furthermore, there is often a lack of information about the source of the vibrations, which is crucial for understanding the mechanisms of their action and potential impact on people. This is a significant oversight, as the source of vibrations is fundamentally important for their characteristics. For example, vibrations caused by vehicles moving on railroads are characterized by greater intensity and are therefore more perceptible to people in buildings than vibrations caused by vehicles on roadways. This difference in perception and impact on people stems from differences in transport technology, the type of substrate, and the construction of infrastructure supporting various types of transport.
Considering the passive reception of transportation-type vibrations by people in buildings and the not entirely comprehensive methodology of assessing the impact of vibrations on people, it has been observed that the existing methodology associated with the RMS (Root Mean Square) method may be insufficient in certain cases. In the recorded signal originating from transportation sources, so-called peaks can occur, for example, when there are irregularities on the road or track, and these peaks are more perceptible than the stable passage of a vehicle near a building. Therefore, in many national and international standards, an auxiliary measure called the Vibration Dose Value (VDV) has been introduced to assess the impact of vibrations on people in buildings. The Vibration Dose Value, by incorporating the fourth power in its formula, does not lose these peaks but, in fact, makes them more prominent in the signal. The aspect that unites all methods of assessing the impact of vibrations on people in buildings is the reference of analysis results to the posture of a person present in a room. In assessing the impact of vibrations on people, three positions of human vibration reception are considered. In the sitting and standing positions, a person receives vibrations through the feet or the seating surface, in such a way that the “z” axis, which runs along the spine, is the vertical axis, while the “x” axis (back to front) and “y” axis (side to side) are horizontal axes. In the lying position, the entire body surface receives vibrations in such a way that the “z” axis becomes the horizontal direction, and the “x” axis becomes vertical. The perception of vibrations by humans varies depending on the direction of their action in such a way that for frequencies below 4 Hz, horizontal vibrations are more perceptible than vertical ones, while above this frequency, the situation is reversed, and it is the vertical vibrations that are more perceptible. Information about the purpose of the room, the time of occurrence of the vibrations, and their nature are included in the value of the correction factor “n” in the RMS method, which should be used to multiply the vibration perception threshold curves to obtain curves representing the comfort assurance lines in a given measurement situation. In VDV, they are included in the value itself in the table.
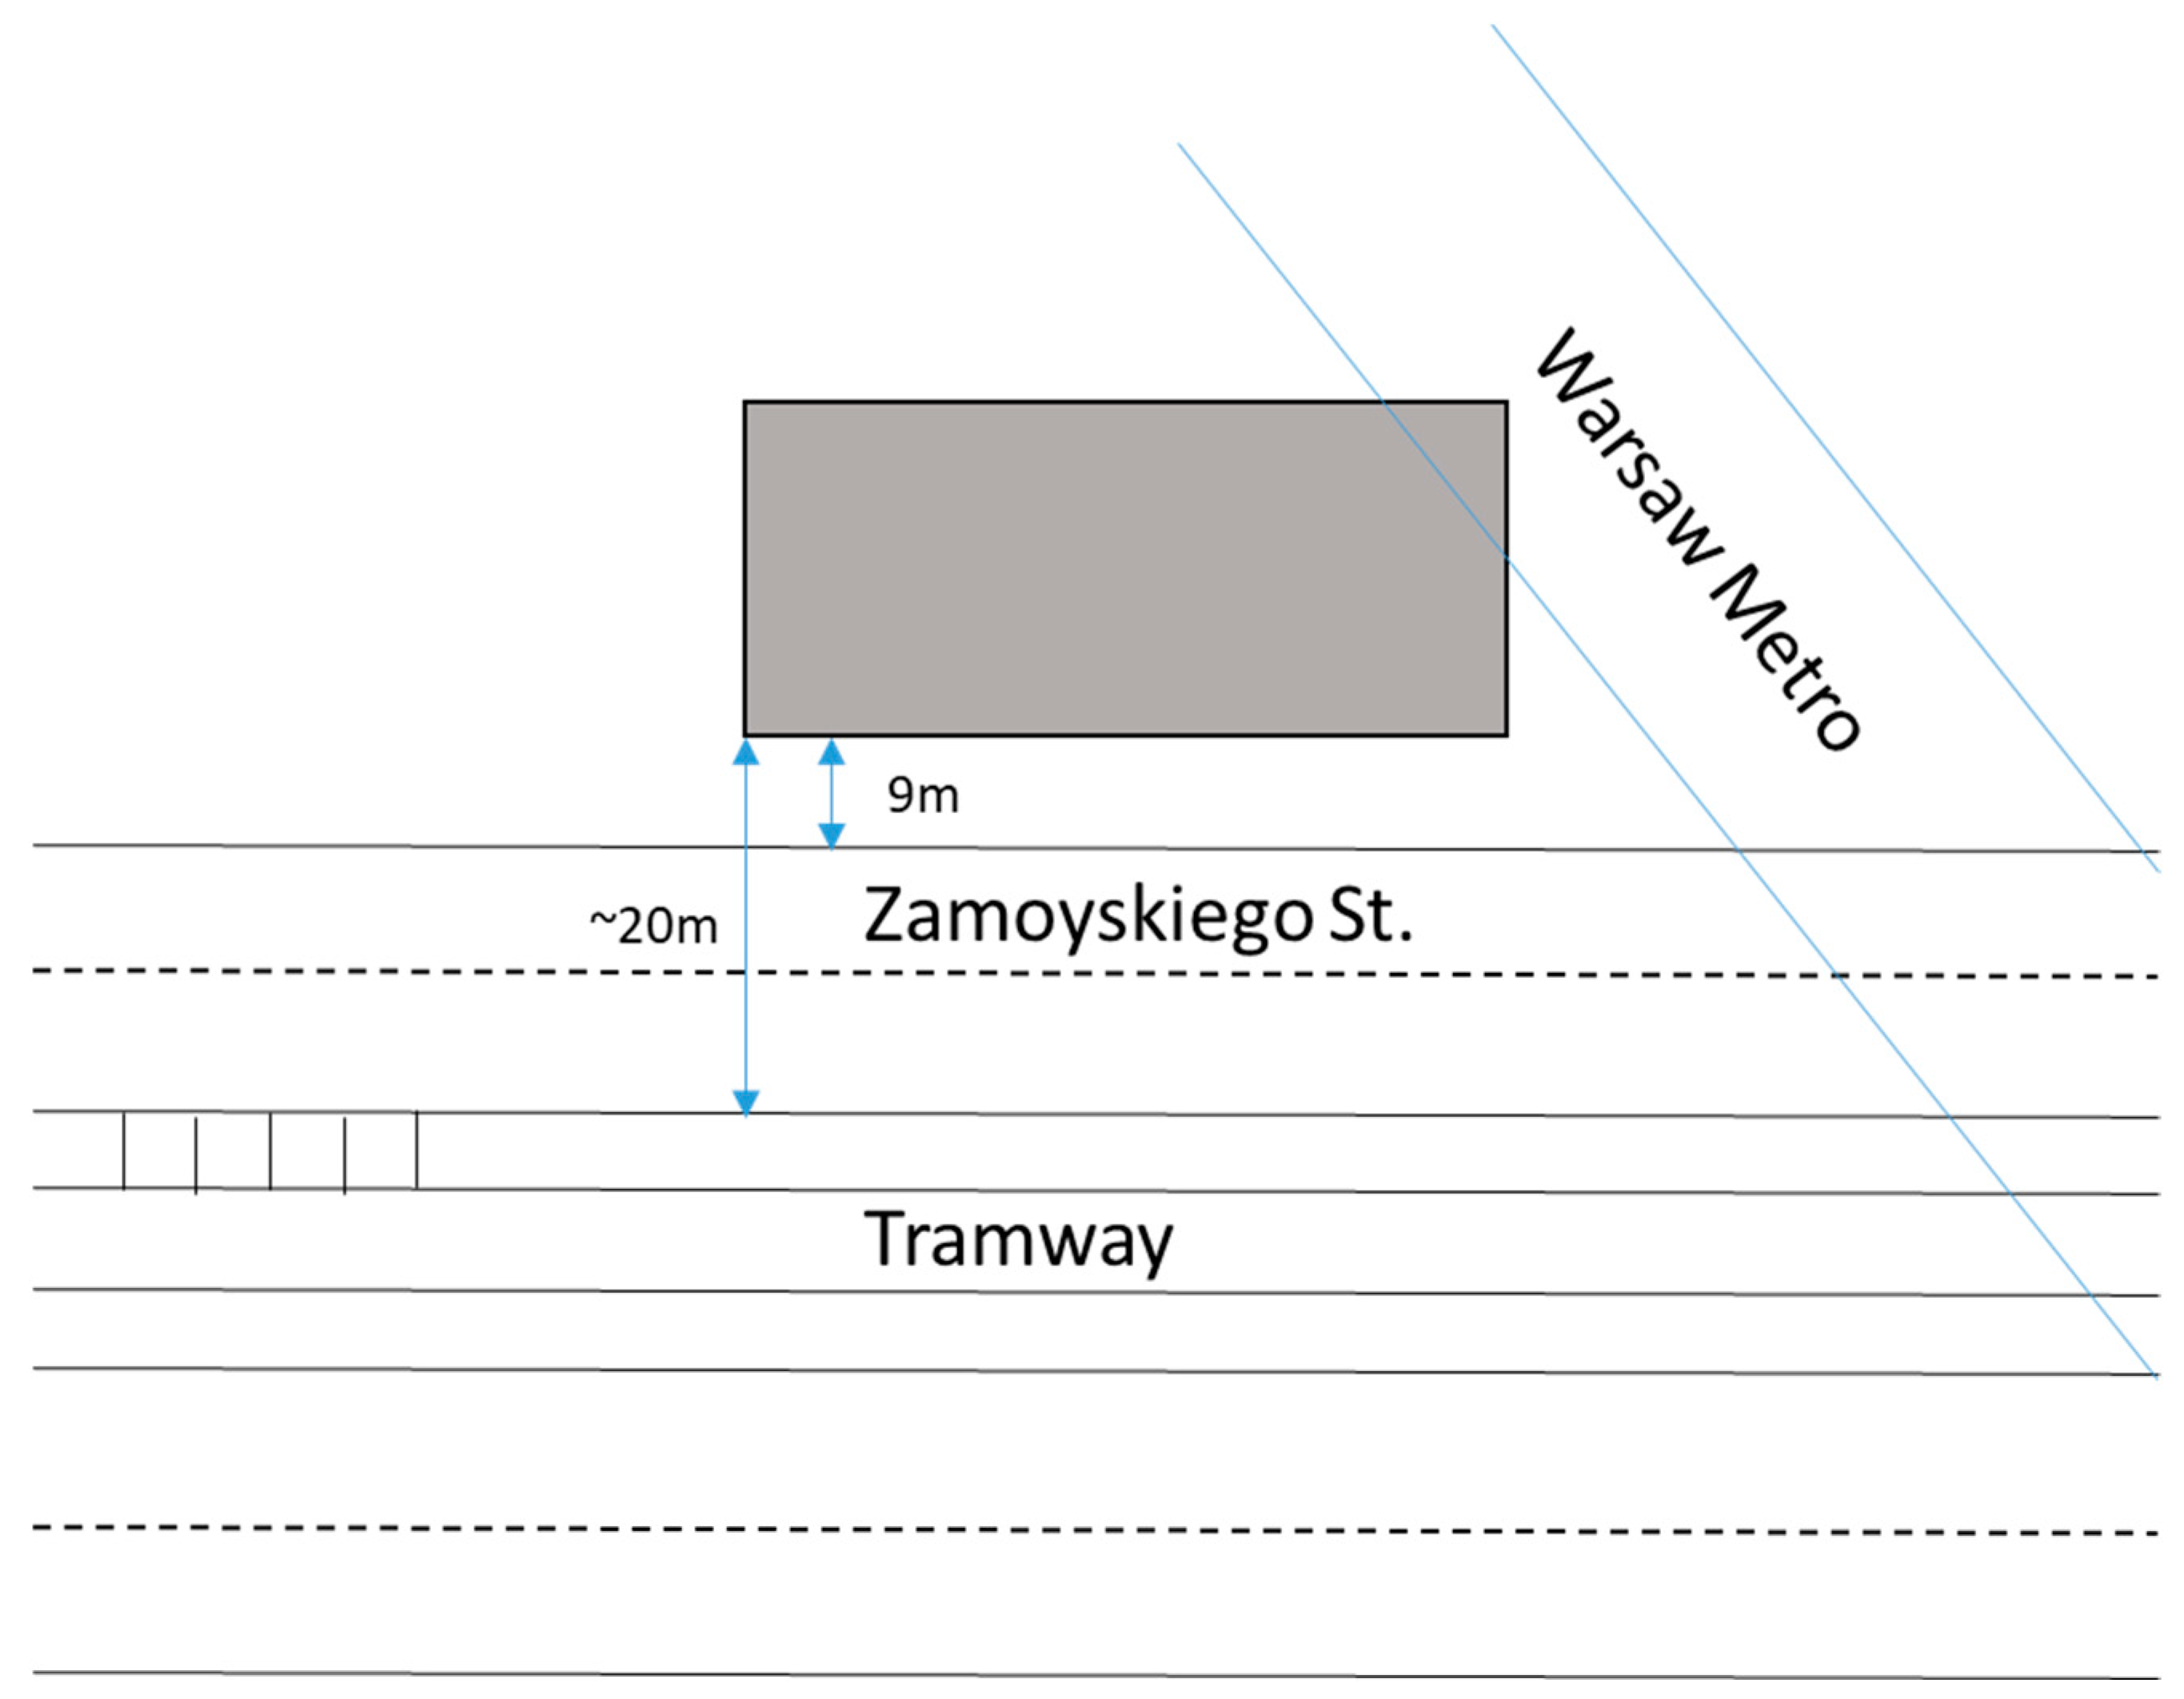
The article presents the results of 24 h measurements conducted during the construction of the metro line in Warsaw. The analysis of the results was carried out using both the classical RMS method and the VDV method. Interesting events related to the passage of metro trains, tram cars, and automobile traffic on a nearby road were recorded.
2. The Measurement Methodology and a General Description of the Conducted Measurements
The revised standard [
15] includes guidelines pertaining to the proper execution and analysis of measurements of the impact of vibrations on people in buildings. The recommendations cover both equipment requirements and the selection of measurement points, as well as the analysis of the recorded signal itself.
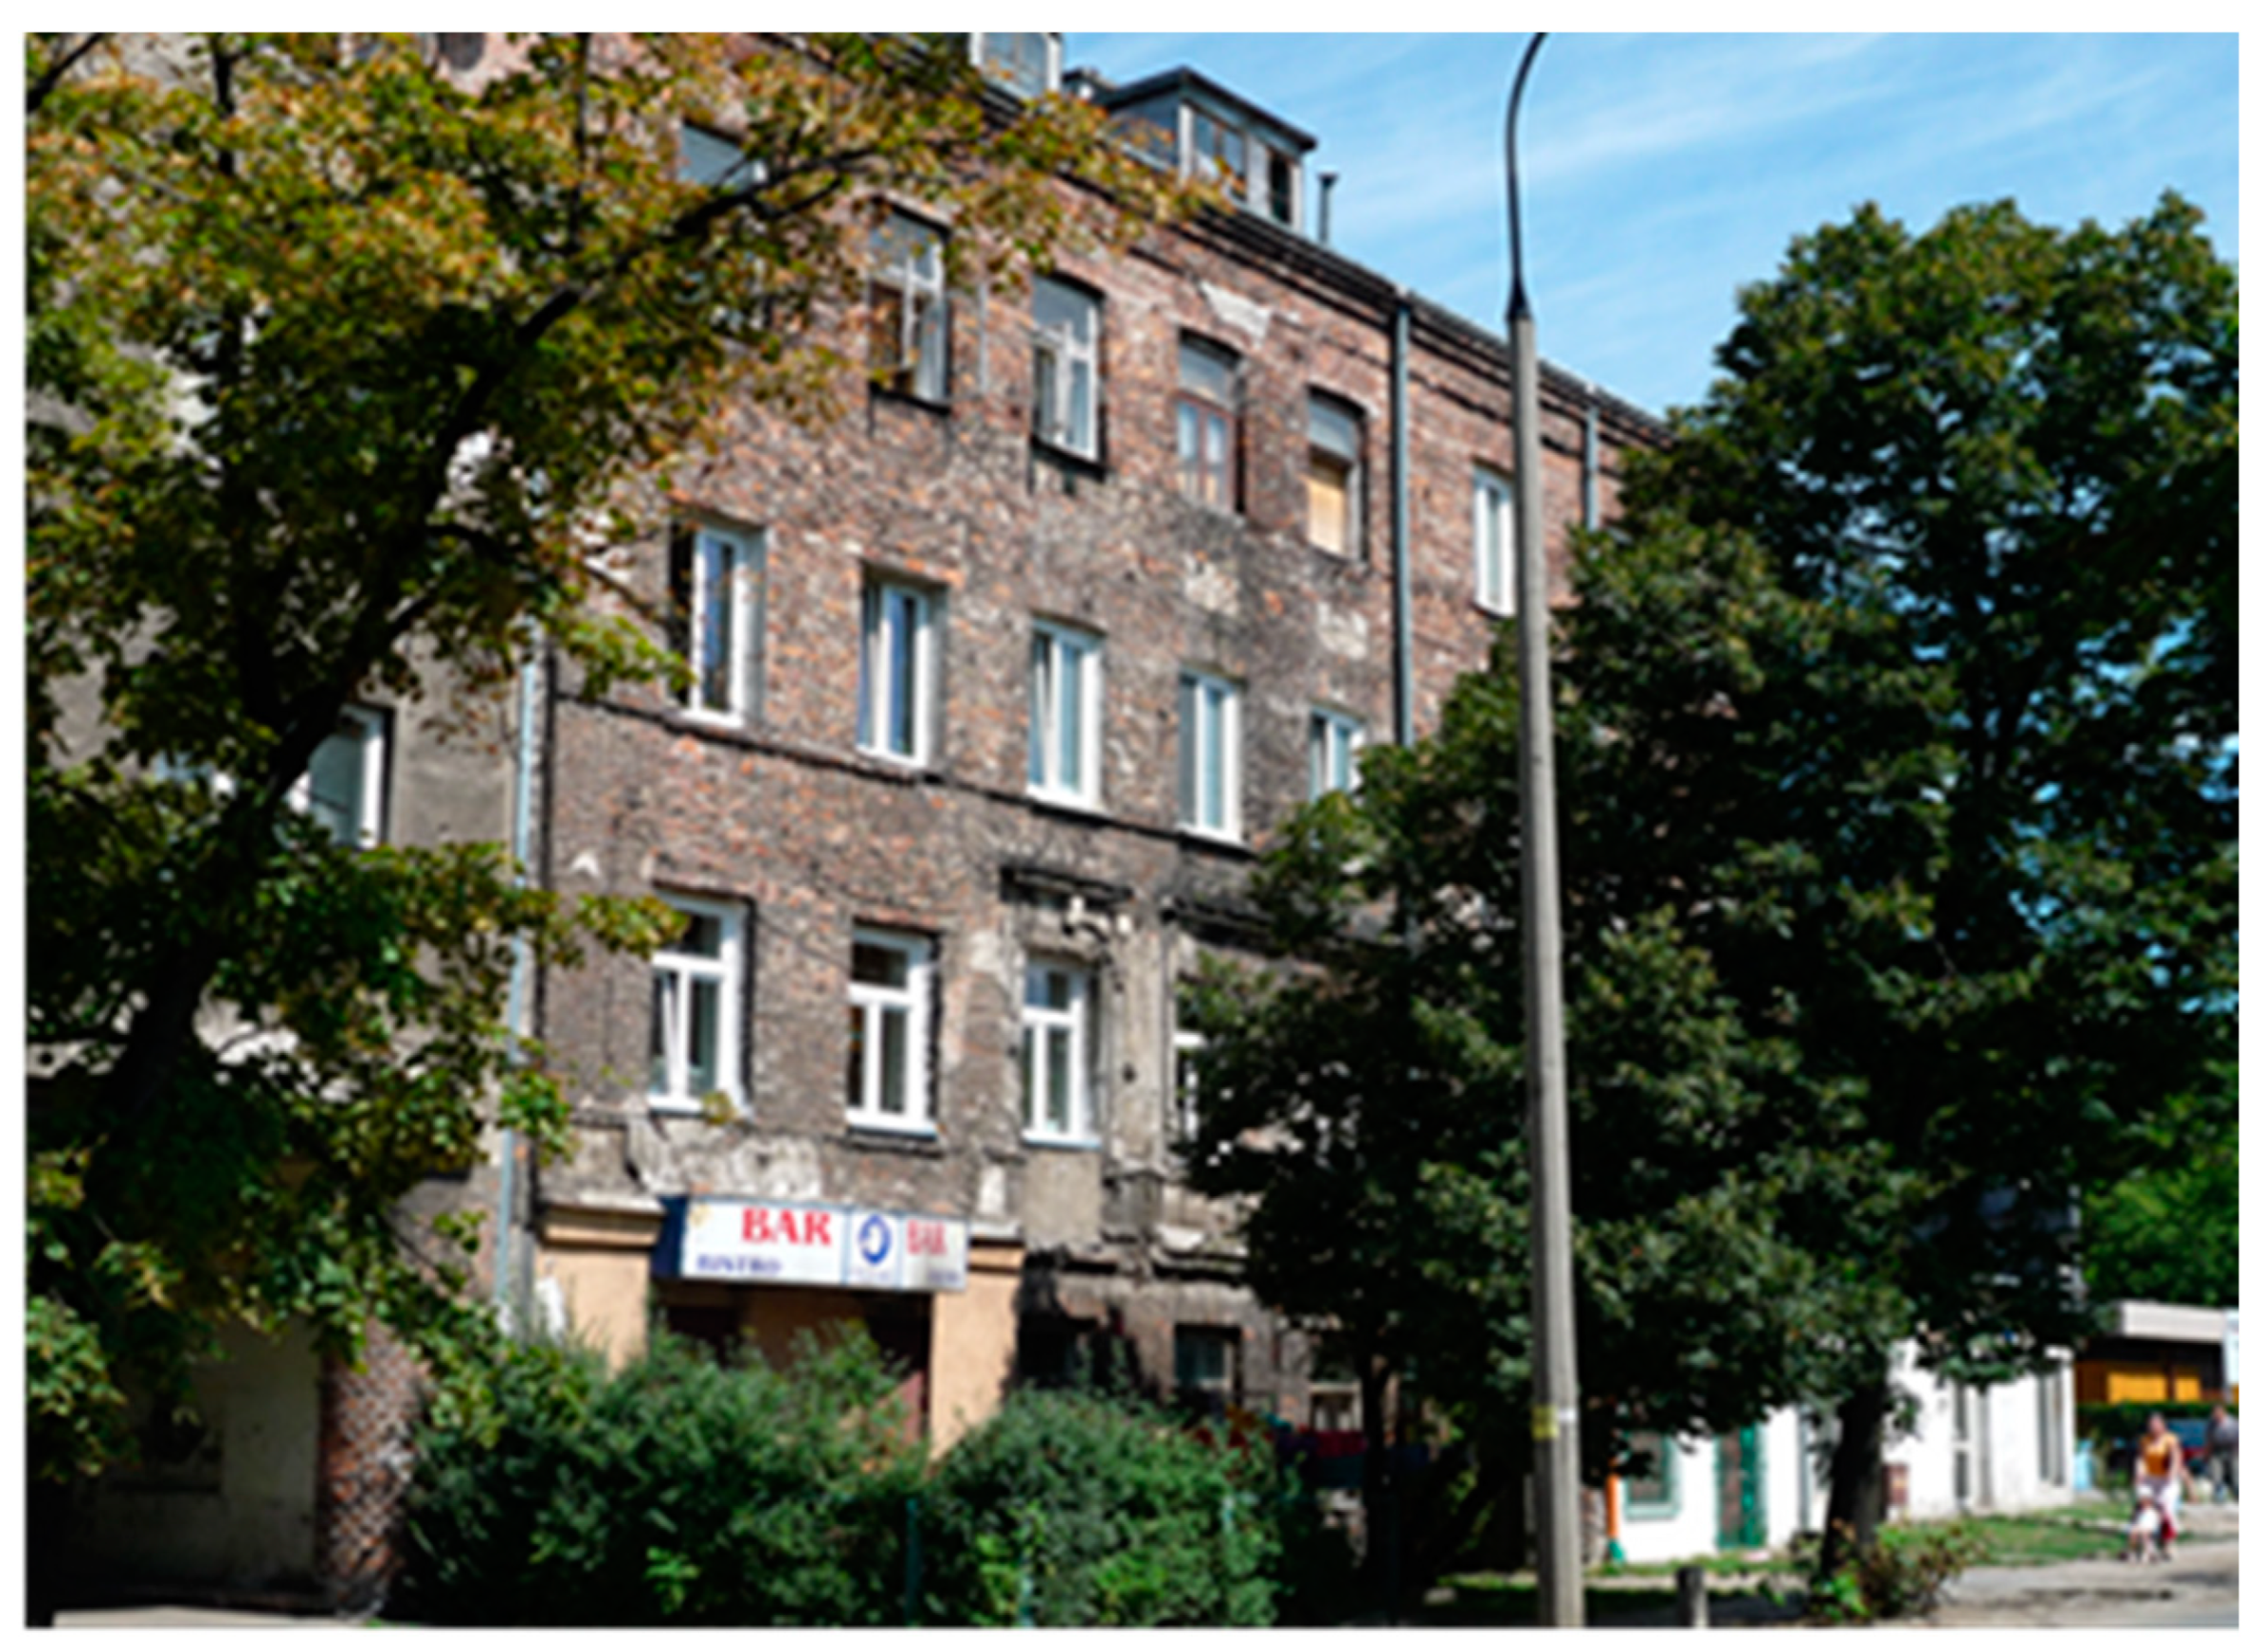
The buildings selected for analysis were located within the so-called dynamic impact zone (
Table 1).
An extremely important aspect of measuring the impact of vibrations on people in buildings is the selection of measurement point locations. In this area, the normative records of different countries show some differences. According to the ISO standard [
7], vibrations transmitted to the human body should be measured on the surface between the body and that surface. This is an imprecise provision. Meanwhile, the ISO standard [
6], in relation to the selection of the measurement point, requires that the measurement of vibrations transmitted to the human body be conducted in the middle of rigid surfaces. This more precise provision is due to the scope of application of the ISO [
6] standard, which contains requirements mainly relating to vibrations of general impact. The British standard [
16] in this area is much more lenient. It also indicates the center of the room intended for the permanent stay of people, but the range of the zone in which measurements of the impact of vibrations on people can be conducted ranges from 1/3 to 2/3 of the length/width of the ceiling. The measurements carried out as part of the research included in this work were conducted according to the Polish standard [
15]. The measurement points were located at least in one room on the highest floor, located as close as possible to the source of vibrations. Clarification is needed regarding the choice of a measurement point on the ceiling of the highest floor, given information that the highest level of vibrations generated by metro train passages occurs on the ceilings of the lowest floors. In the studies conducted in connection with the subject of this work, the goal was not to perform a diagnosis but to study the mutual relations between assessment parameters. The measurement point was located in the geometric center of the room.
During the measurements, vibration accelerations were recorded, which was associated with the ease of assessing the impact of vibrations on people using this parameter. During the conducted measurements, devices that should enable the correct registration of the signal from 1 Hz, and even below this value, were significant. During the measurements, seismic sensors of type 393B12 PCB Piezotronics were used, featuring a nominal sensitivity of 10 V/g, a measuring range of ±0.5 g, and a frequency range spanning from 0.1 Hz to 1 kHz. For signal recording purposes, the LMS Scadas Mobile recorder with integrated ICP® standard signal conditioning systems for each channel was employed. The use of ICP® conditioners allows for the utilization of long cables, significantly facilitating measurement tasks in buildings with large dimensions or when measurements necessitate considerable distances between measurement points and the recording station. This analyzer offers real-time recording capabilities for each channel while preserving high signal dynamics across the entire frequency spectrum. The measurement, although in most cases the vertical direction plays a decisive role, should be conducted simultaneously in three orthogonal directions: the “X” direction is taken in all measurements perpendicular to the excitation, the “Y” direction parallel, and the “Z” direction is the vertical direction.
According to the standard [
15], the use of a measurement disc is recommended, which should have a weight of at least 30 kg and a diameter of 30 cm [
15] (
Figure 1). The signal registration should enable the recording of frequencies in the range from 1 to 120 Hz, so that after applying a low-pass filter, frequencies up to 80 Hz could be included in the assessment.
Determining the duration of vibrations is a separate issue. The standard [
15] stipulates that the duration of vibrations is defined by the interval during which the value of vibration acceleration amplitudes does not fall below 0.2 of the maximum amplitude value in the recorded waveform. The ISO standard [
6], primarily used for measuring general-character vibrations, requires that the signal recording time be at least 30 min. The standard [
7] contains a provision regarding the duration of vibrations, stating that the recorded signal should suffice to ensure reasonable statistical accuracy. This definition is very broad and imprecise, while the duration of vibrations significantly affects the signal analysis results, especially regarding the widely used and recommended RMS method in the work [
7]. In the German standard [
17], analysis is carried out in cycles lasting 30 s each, after which data from the cycles are averaged. The measurements described in this work were performed in accordance with the standard [
15].
The last issue related to the analysis of measurement data is the sampling frequency of the recorded signal, which, according to Nyquist’s criterion [
18], should adhere to the principle that the highest frequency recorded in the signal (f
N) is half the sampling frequency (f
S) (Formula (1)):
This means that for a cutoff frequency fN = 120 Hz, the sampling frequency should be at least fS = 240 Hz. In practice, this minimum is set at 2.5 times the highest recorded frequency, which means that in the case of the impact of vibrations on people, the sampling frequency should be at least 300 Hz. Of course, the higher the fS value, the better the quality of the results, which is why in the analyses described in this work, a frequency of 1024 Hz was used.
5. Results of Analysis
As a result of background dynamic measurements, 12 events were recorded originating from: the tram line (8 events) and the roadway (4 events). However, during post-construction measurements, 11 events related to metro train passages were recorded. In total, 23 events were subject to RMS/MTVV and VDV analysis.
5.1. The Results of RMS Analysis
The recorded signal was analyzed according to the methodology described in
Section 2 of this study. Out of the 23 recorded events, the threshold of vibration perceptibility by people in buildings was exceeded in five cases. Three exceedances of the perceptibility threshold occurred for metro train passages, accounting for approximately 27% of all metro train passages recorded on the site. Two exceedances of the perceptibility threshold occurred for roadway passages, which in this case constituted 50% of all passages recorded from that road. In the case of passing trams, no exceedance of the vibration perceptibility threshold by people was observed.
Below are examples of RMS analysis of individual events in 1/3-octave bands with the appropriate waveform (
Figure 6—heavy truck passage,
Figure 7—tramway passage,
Figure 8—metro train passage).
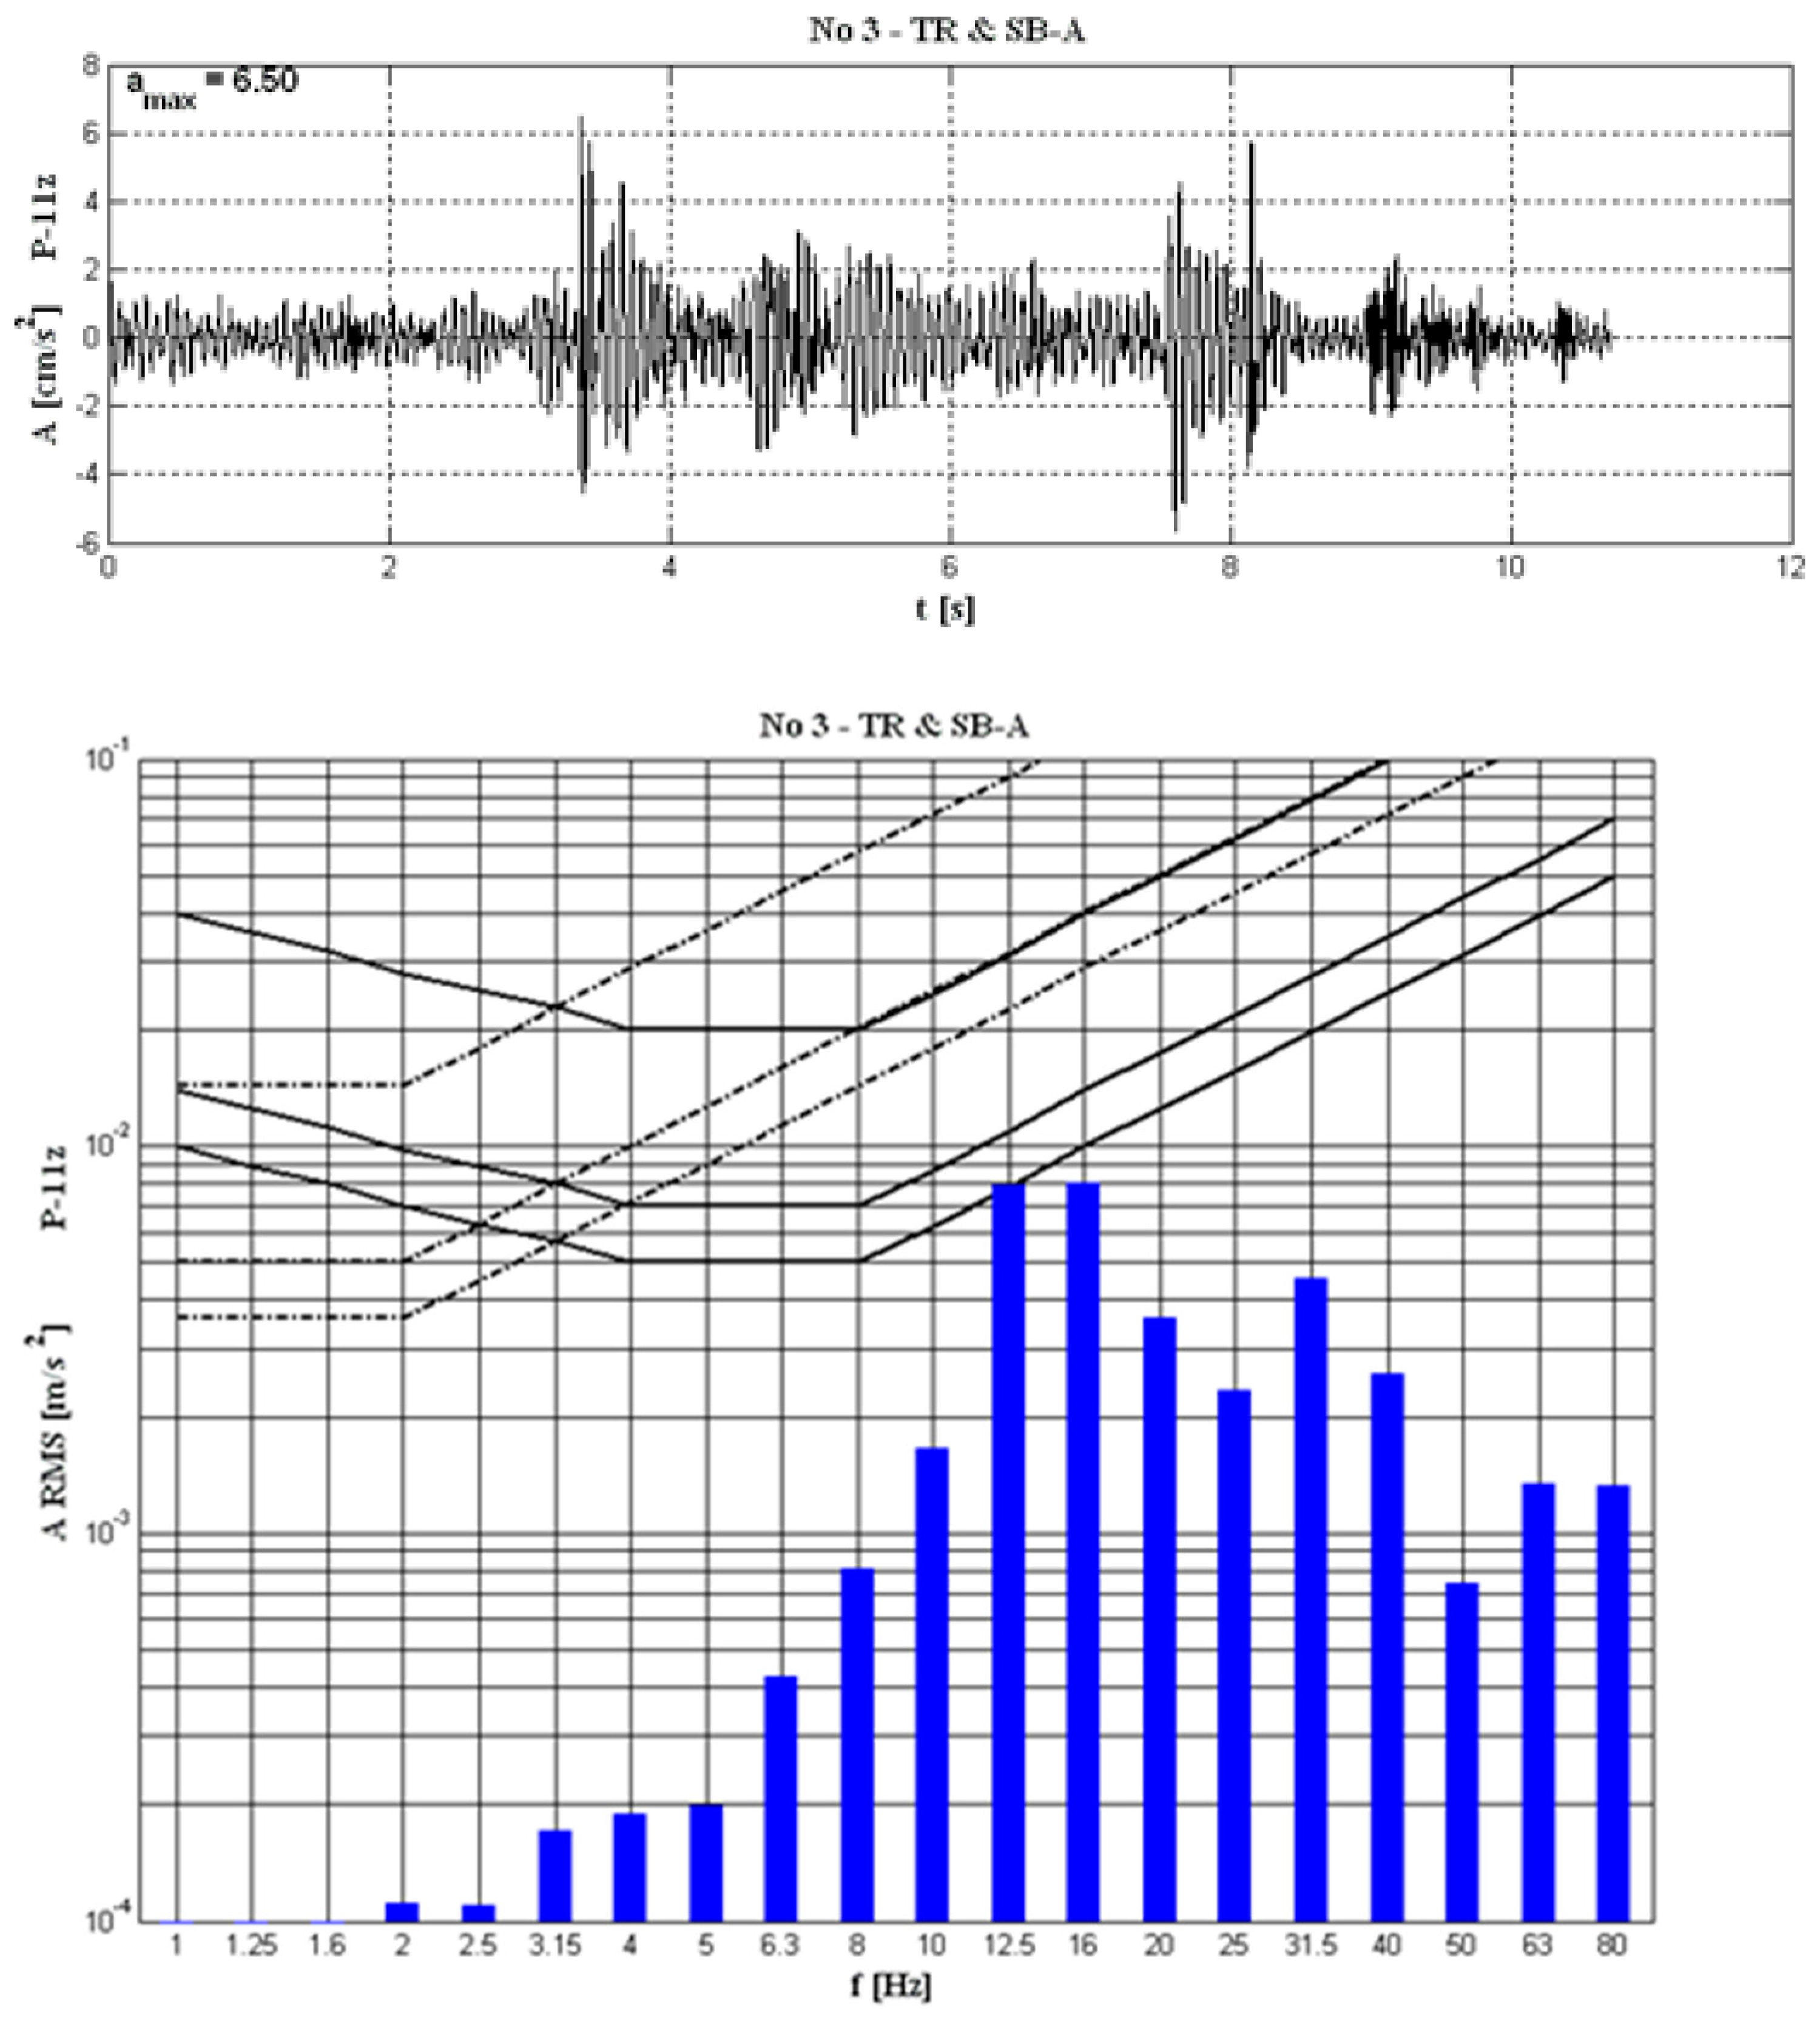
From the information provided in
Figure 6, it can be inferred that the recorded vibrations do not violate the conditions for ensuring necessary comfort, but they are noticeable to individuals in the room. The threshold of vibration perception is exceeded for two frequencies: 12.5 Hz and 16 Hz, as better illustrated by the results given in
Table 3, relating to the values of the HPVI. The passage of trams did not cause any exceedance of the threshold of vibration perception by people in any of the recorded events.
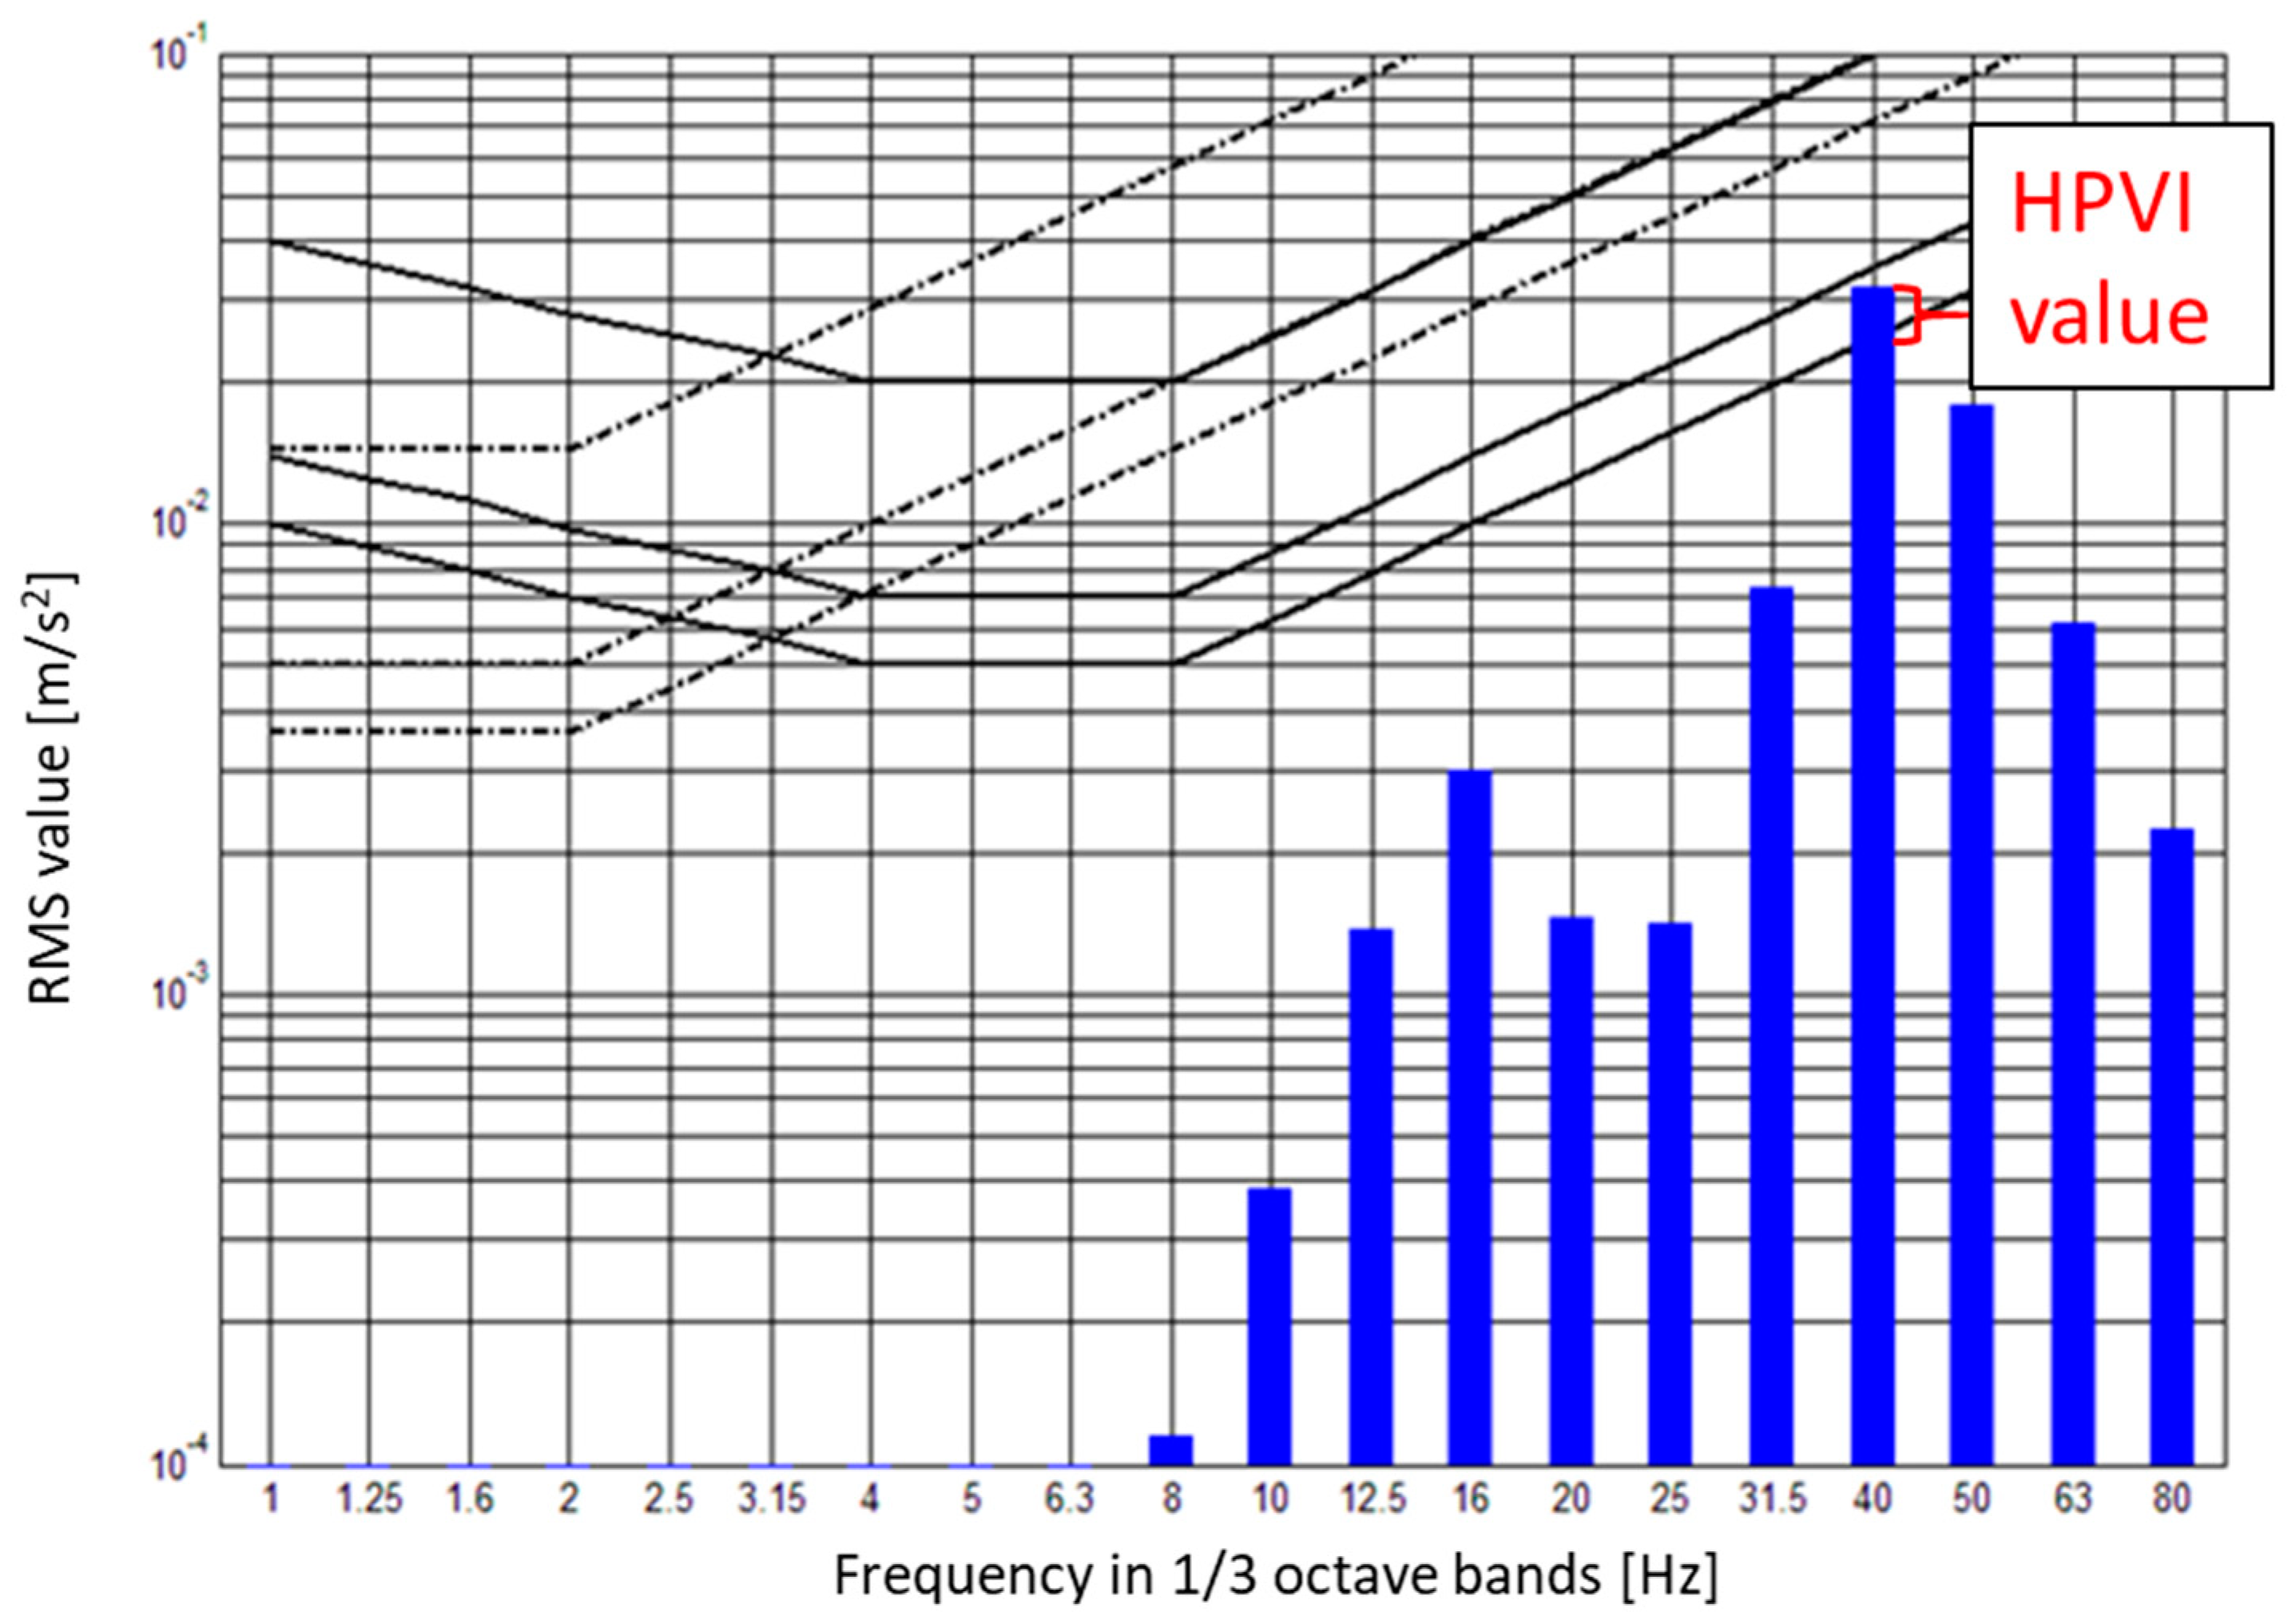
The RMS analysis of the vibrogram caused by the passage of the metro train did not reveal any violation of the conditions for ensuring vibrational comfort to people in the rooms. However, exceedances of the vibration perception threshold occurred. In the example shown in
Figure 3 and
Figure 4, the exceedance measured by the HPVI indicator was HPVI = 1.28 at a frequency of 40 Hz. In this example, compared to vibrations caused by passages on the roadway, vibrations caused by metro train passages shifted the frequency spectrum towards higher values.
Based on the RMS analysis, it can be concluded that in 22% of the events, there was an exceeding of values corresponding to the thresholds of vibration perception by people in buildings.
5.2. The Results of VDV Analysis
The same events analyzed using the RMS method were subjected to VDV analysis. The duration of the events ranged from 11 to 19 s. The results of the VDV analysis along with the collective summary of HPVI indicators calculated in the RMS analysis are presented in
Table 4.
Values that exceed the thresholds defined by the Polish standard [
15] for the perception of vibrations by people in buildings (WODL > 1.0) or correspond to a low probability of complaints from residents during the daytime (VDV > 0.2) are marked in yellow.
For the purpose of comparing the results obtained by the RMS method and the VDV method, the following assumptions were made:
- -
A low probability of complaints is compared with exceeding the threshold of vibration perception by people,
- -
The possible occurrence of complaints is compared with the level of requirements for ensuring necessary vibrational comfort.
Based on the VDV method research, fewer events were found in which there was a low probability of resident complaints. These are two events related to subway train passages. Vibrations generated by tram passages are imperceptible. Based on the results of the assessment performed using the VDV method, it can be stated that 18% of events caused by subway train passages result in a low probability of complaints.
Based on the measurement results, an attempt was made to analyze the correlation between two methods of determining the impact of vibrations on people in buildings: RMS (in the form of the HPVI index) and VDV. The result of this analysis is shown in
Figure 9.
The correlation between HPVI and VDV is equal to 0.67 which suggests a strong correlation between HPVI index and VDV value, but not too strong for exact prediction of one of the factors knowing the other.
The regression equation for the relationship between HPVI and VDV is:
This equation indicates that for every unit increase in VDV, HPVI increases by approximately 2.92 units, starting from a base value of 0.44 when VDV is zero. This suggests a strong positive linear relationship between these two variables, confirming the moderate to strong correlation previously discussed.
The descriptive statistics for HPVI and VDV across different types of vehicles show differences:
For HPVI:
- -
Metro trains have a mean HPVI of approximately 0.88 with a standard deviation of 0.22, indicating a wider range of HPVI values.
- -
Tramways show the lowest mean HPVI at about 0.57 with a relatively small standard deviation, suggesting less variation.
- -
Buses have a mean HPVI of around 0.78, with variability indicated by the standard deviation.
- -
Heavy trucks have only one measurement, showing the highest single HPVI value at 1.72.
For VDV:
- -
Metro trains show a higher mean VDV of 0.176 with a standard deviation of 0.055, indicating significant variability.
- -
Tramways have the lowest mean VDV at approximately 0.059 with less variation.
- -
Buses fall in the middle with a mean VDV of about 0.067.
- -
Heavy trucks have a significantly higher VDV of 0.161 but as a single measurement, it is difficult to compare variability.
These differences suggest that the type of vehicle has an impact on both HPVI and VDV measurements, with metro trains generally showing higher values and tramways showing lower values on average. Heavy trucks, though only represented by a single measurement, show notably high VDV. This analysis indicates that vehicle type does affect vibration impact measurements, with specific types of vehicles potentially causing more significant vibrations and discomfort.
6. Discussion
Although there are few holistic studies on the impact of transportation vibrations on people in buildings, i.e., those receiving vibrations passively, articles in which only one type of passing vehicle is studied also allow for comparison of results. In article [
27], the effect of heavy goods vehicles (HGVs) is examined, showing that different types of vehicles have varying impacts, similar to the discussion on metro trains, buses, and trucks. In [
28], the impact of tram speeds passing near a residential building on the residents’ perception of vibrations was studied. It was found that the speed of the tram does not necessarily translate into vibrational comfort in rooms located near the tramway. Similar conclusions can be drawn from our analyses when comparing the travel time of trams with the VDV or HPVI values. This suggests that tram speed, much like the tram type, has a complex relationship with the vibrational comfort experienced inside buildings close to tram lines. This nuanced understanding underscores the importance of considering various factors beyond speed alone in efforts to minimize the impact of vibrations on residents.
A very interesting study can be found in [
29], which is an in-depth analysis of the influence of tram traffic-induced vibration on buildings damaged by earthquakes, particularly in the context of the Zagreb 2020 earthquake. It explores various aspects of vibration impacts, including the tram type, velocity, and proximity to the buildings, and how these factors contribute to the propagation of existing cracks or cause new damage to the already earthquake-affected structures. Both our analysis and the document underscore the significant role of vehicle type in influencing vibration levels. Just as different types of vehicles (buses, metro trains, trams) were found to have varying impacts on HPVI and VDV, the document further specifies tram types, highlighting how specific tram models contribute differently to vibration levels and potentially to the damage extent of buildings.
The metro train passage is always studied when complaints from residents appear, as occurred in [
30]. Articles focus mostly on the diagnosis of noise and vibrations which appeared due to metro train passages. They focus on how to design buildings located near the metro.
The document [
31] focuses on a comprehensive study of how traffic-induced vibrations affect residential buildings and their occupants, with a specific case study in Istanbul, one of the world’s most populous and traffic-congested cities. The research includes surveys of building occupants’ perceptions of vibrations, measurements of ground vibrations induced by trains, and numerical modeling of typical residential buildings to assess their responses to these vibrations. Similar to our analysis, Erkal’s study highlights the significant role of vehicle type (especially trains) in influencing vibration levels and their perception by residents. This aligns with our findings on the variable impact of different types of vehicles on HPVI and VDV measurements.
Although there are no comprehensive studies that consider various types of vehicles passing near buildings where people passively receive transportation-induced vibrations, it can be observed from many research results that the type of vehicle is not insignificant when considering vibrational comfort. In addition, a further investigation is planned by considering multi-hazard effects (i.e., wind-induced vibrations on high-rise buildings) estimated through CFD simulations of [
32].


