1. Introduction
Literature mapping is one of the activities carried out by researchers to identify relevant articles for their research during a Systematic Literature Review (SLR). This is one of the daily activities of all researchers and creators of new studies and investigations. In general, there are four stages to carrying out a consistent literature review, which are as follows: (i) Establishing a methodology with a basis and raising relevant research questions; (ii) Collecting a database with applications to support the research; (iii) Evaluating the base of articles collected, in the bibliometric search, considering title, abstract, keywords, number of citations and relevance of the article to the topic of study; and (iv) Structuring the information regarding the results found by the bibliometric search.
Identifying and analyzing the most relevant studies on a given subject is a challenge of literature mapping, as it is an exhaustive activity to find answers to specific research questions so that the information can be relevant to the study. Another problem to be considered is the possible existence of bias in the research when this stage is carried out based on the exclusive individual interpretation of a single reviewer, so it is necessary to have structured studies to minimize bias and make the research more transparent and robust [
1]. In the same article, the authors point out that time is another problem to be overcome, not only because of the time that reviewers spend selecting articles but also because of the time that reviewers will have to dedicate in the coming years if this is not automated, because every year a more significant number of studies appear, so the work of evaluating and reviewing each of these articles has become increasingly complex and time-consuming.
Faced with the challenges of identifying and analyzing relevant studies during literature reviews, machine learning (ML) models are emerging as promising solutions. ML models are revolutionizing several areas, including academia, because they have the ability to understand and interpret texts in a similar or superior way to humans [
2]. In this context, it is essential to explore how these technologies can improve and automate the literature mapping process, helping reviewers to make decisions on relevant articles based on textual analysis of the articles [
3]. Reinforcing this understanding, [
4] states that in the current era of Industry 4.0, knowledge of artificial intelligence and especially mastery of Machine Learning algorithms is crucial for analyzing data in an intelligent and automated way.
Therefore, ML models are expected to be increasingly inserted into society’s daily activities and practices, as they have been radically improved and applied to the development of automated and semi-automated systems and methodologies [
5]. This is because ML models can understand and comprehend the patterns generated in a way that minimizes human action in the training phase [
6]. This makes it possible to develop tools to automate or semi-automate processes, not only to speed up the analysis stage but also to ensure that information can constantly be updated, especially at the article selection stage, to ensure the quality of the review, and because it is the variable that most impacts on the time spent by the reviewer [
7].
Several tools and methodologies are being developed to demonstrate the relevance of Machine Learning research aligned with article selection [
1]. An example of this is [
8], which for the first time pointed out the advantages of using automatic classification of citations for articles within the systematic review of documents relating to the efficacy of the class of drugs in situations where treatment of diseases is required, demonstrating that it is possible to reduce by more than 50% the topics to be reviewed during a manual review.
In reference [
1] proposed a systematic literature review in the area of food safety, applying machine learning techniques to automatically classify articles relevant to the area using naive Bayes and a support vector machine, resulting in a reduction of more than 30% of the articles to be read by the reviewer. In [
7] evaluated classification models within tokenization, lemmatization, empty word removal, TF-IDF (Term-Frequency/Inverse-DocumentFrequency), decision tree algorithms, and support vector machines for classification algorithms within the field of Software Engineering (SE) with an FScore result of 92%.
Finally, this research aims to contribute to these issues by demonstrating a new methodology that uses machine learning algorithms to improve quality, speed, and standardization along with a Scientific Significance Score-SSS, a scoring system for best literature mapping methods to assess productivity-related issues in the sector. According to the results, it was possible to reduce the number of articles to be evaluated by the reviewer. In some cases, the results indicated a reduction of up to 96.00% in the Innovation and Artificial Intelligence classification category, while the other category had a reduction of more than 90% of the relevant articles in each specific topic.
The research is structured as follows:
Section 2 discusses the methods and methodologies used to carry out this study. The category classifier is first presented, which uses Machine Learning models to train and label the category. It then moves on to the relevance classifier, which uses a scoring system called SSS alongside the Z-score to classify the finest papers. The categories used in the research related to productivity within the industry are presented, and the work to collect the database and analyze this data using Bibliometrix is described.
Section 3 contains the results of the classifiers by category, using the accuracy, precision, recall, and F-measure metrics to compare the best Machine Learning model between Multinomial Naive Bayes (MNB), SGD Classifier, Support Vector Machine (SVM), and Decision Tree models to be used by the category classifier. In
Section 4, the main conclusions of the research are presented, in addition to pointing out the main improvements for future studies, as well as issues not addressed by the research.
2. Methodology
This section describes the main methodologies and methods used to structure the category and relevance classifiers. First, a framework is presented for the whole process, including how the database will be handled, the Machine Learning classification models tested, the validation metrics, an explanation of the SIR and how the Z-score and Standard Deviation measures were applied to classify relevance, how the database was structured, and an analysis of the database.
2.1. Integrated Framework for Literature Mapping
We propose a comprehensive framework integrating data extraction from the Web of Science, machine learning classification algorithms, and relevance calculations to conduct literature mapping efficiently.
The database is built from the Web of Science, ensuring the inclusion of high-relevance and reliable articles. Next, machine learning algorithms are employed to automatically classify articles, reducing manual workload and enhancing process efficiency.
Following the initial classification, each category undergoes a relevance calculation. This process involves the application of specific metrics, such as citation frequency, journal quality, and article timeliness. The combination of these parameters results in a relevance score for each article.
The final stage of the framework involves the selection of the most relevant articles based on the calculated relevance scores. Predefined criteria and a specific threshold are established to identify each category’s finest papers.
Figure 1 illustrates the integrated flow of the proposed framework. It begins with data extraction from the Web of Science, followed by applying machine learning classification algorithms. After classification, relevance calculation takes place, considering metrics such as citation frequency, journal quality, and article timeliness. The last step is the selection of the most relevant articles based on calculated relevance scores, establishing a specific threshold. This systematic approach aims to optimize identifying significant works in systematic literature reviews.
2.2. Database
Web of Science is a platform with an essential database for the area of exact sciences; it has a series of articles from engineering, economics, and natural sciences. Therefore, it becomes essential to survey articles focused on productivity and industry. Given the increasingly massive use of data and the requirement to generate information quickly, the literature review also has to adapt computationally to analyze the articles, thus becoming faster and more automatic. WoS allows for exporting a list of information about the articles searched for external analysis. A computational tool used to analyze article data is the Bibliometrix package from RStudio [
9], which makes data analysis simple, with studies involving the prominent authors, countries, articles, affiliations, thematic evolution, clusters of themes, and publications over the years.
The steps for data extraction from the Web of Science platform, database consolidation, and Bibliometrix analysis follow the following structure, composed of five steps:
Definition of research categories within the macro-themes industry and productivity (Artificial Intelligence, Efficiency, Industry 4.0 and Industry 5.0, Innovation, Sustainability, Business, Gross Domestic Product (GDP), Sustainable Development Goals (SDGs), Public policy).
Search within the macro-themes (industry and productivity) by category.
Extraction of data in Excel format for consolidation of labeled database (to be used in the training process of machine learning models) and Bibtex for consolidation of base for analysis in Bibliometrix (as it is a more recommended format for the use of the database within the environment in biblioshiny).
Creation of a new column within the Labeled Database to label with the category’s name corresponding to each article according to the search result in WoS.
Removal of duplicates for Bibliometrix analysis.
Each article’s data for machine learning training are Title, Abstract, Author, Journal, Year, Country, Keywords, DOI, and Citations, as shown in
Figure 1.
2.3. Categories of Productivity in Industry
In our investigation, we undertook a Literature Mapping using the conventional methodology involving manual keyword selection and filtering. Subsequently, we employed both Category Classification of Scientific Articles and Relevance Classification of Scientific Articles as equitable indicators of workload to make a comparison and exhibit its efficacy.
We are poised to adhere to a stringent approach to conducting an extensive bibliometric examination centered on productivity in the industry. This entails applying specific filters to ensure the pertinence and contemporaneity of the encompassed studies. To encompass a substantial temporal scope, we intend to scrutinize articles published from 2014 to 2023, drawing upon various reputable sources.
In industrial productivity, six primary dimensions (
Table 1) exist that play pivotal roles in driving progress and reshaping the sector. These dimensions encompass innovation, sustainability, Industry 4.0, Industry 5.0, efficiency, and artificial intelligence. Each of these will be examined below:
Innovation catalyzes augmenting industrial productivity by introducing novel concepts, technologies, and processes that streamline operations and amplify efficiency. It also fosters adaptability to market shifts and inventive solutions to industrial challenges. Sustainability is critical in the industry, entailing practices that curtail resource consumption, minimize environmental impact, and advocate for energy efficiency. Companies adopt sustainable strategies to enhance productivity while diminishing their ecological footprint.
Industry 4.0 Industry 4.0 integrates cutting-edge digital technologies, including IoT, big data, and artificial intelligence, to establish intelligent factories. This leads to automation, heightened quality control, and augmented productivity.
Industry 5.0 represents a fusion of advanced technologies, such as collaborative robotics and artificial intelligence, with human labor to bolster productivity. Humans and machines collaborate, harnessing their distinct capabilities to amalgamate efficiency and creativity.
Efficiency is a cornerstone of industrial productivity, entailing the optimization of processes, waste reduction, and quality enhancement. This is achieved through a perpetual process analysis and refinement cycle for more efficient operational performance.
Artificial Intelligence drives industrial productivity by ushering in automation, refining supply chain logistics, and steering data-powered decision-making. These advancements result in heightened efficiency and enhanced quality.
These six categories interact with each other, forming a set of approaches and technologies that contribute to boosting productivity in the industry. Adopting and integrating these elements into industrial strategies and processes can result in significant efficiency, competitiveness, and sustainability gains.
2.4. Analysis of the Database
This first part analyzes the data used in the data preparation process and provides an overview of the 7872 articles. This is an important step that precedes the cleaning and training of machine learning models. Since 70% of the labeled database will be used to train the algorithm, it is necessary to understand what prior information from these data can be generated and the articles’ initial structure to guide the research’s next steps.
With the requirement for increasingly faster information generation from big data or even from smaller databases, it becomes essential and evident how for the adequacy of data analysis and information generation to occur automatically and computationally, several tools for bibliometric analysis have emerged to allow this process to take place more intuitively with the support of new technologies, such as Scimago, BibExcel, and SciVal. In this way, Bibliometrix emerges as a bibliometric analysis tool for massive analysis of data related to articles, whereby platforms such as Web of Science, Scopus, Dimensions, Lens.org, PubMed, and Cochrane Library can have raw files imported into the Bibliometrix environment, as well as data frames which can also be analyzed by the tool, provided there is adequate data treatment. It is interesting to remove the replications of articles if there is more than one database to be analyzed, given that article platforms may contain the same article within the list of journals or even in cases where several bases were extracted from the same platform by using different combinations.
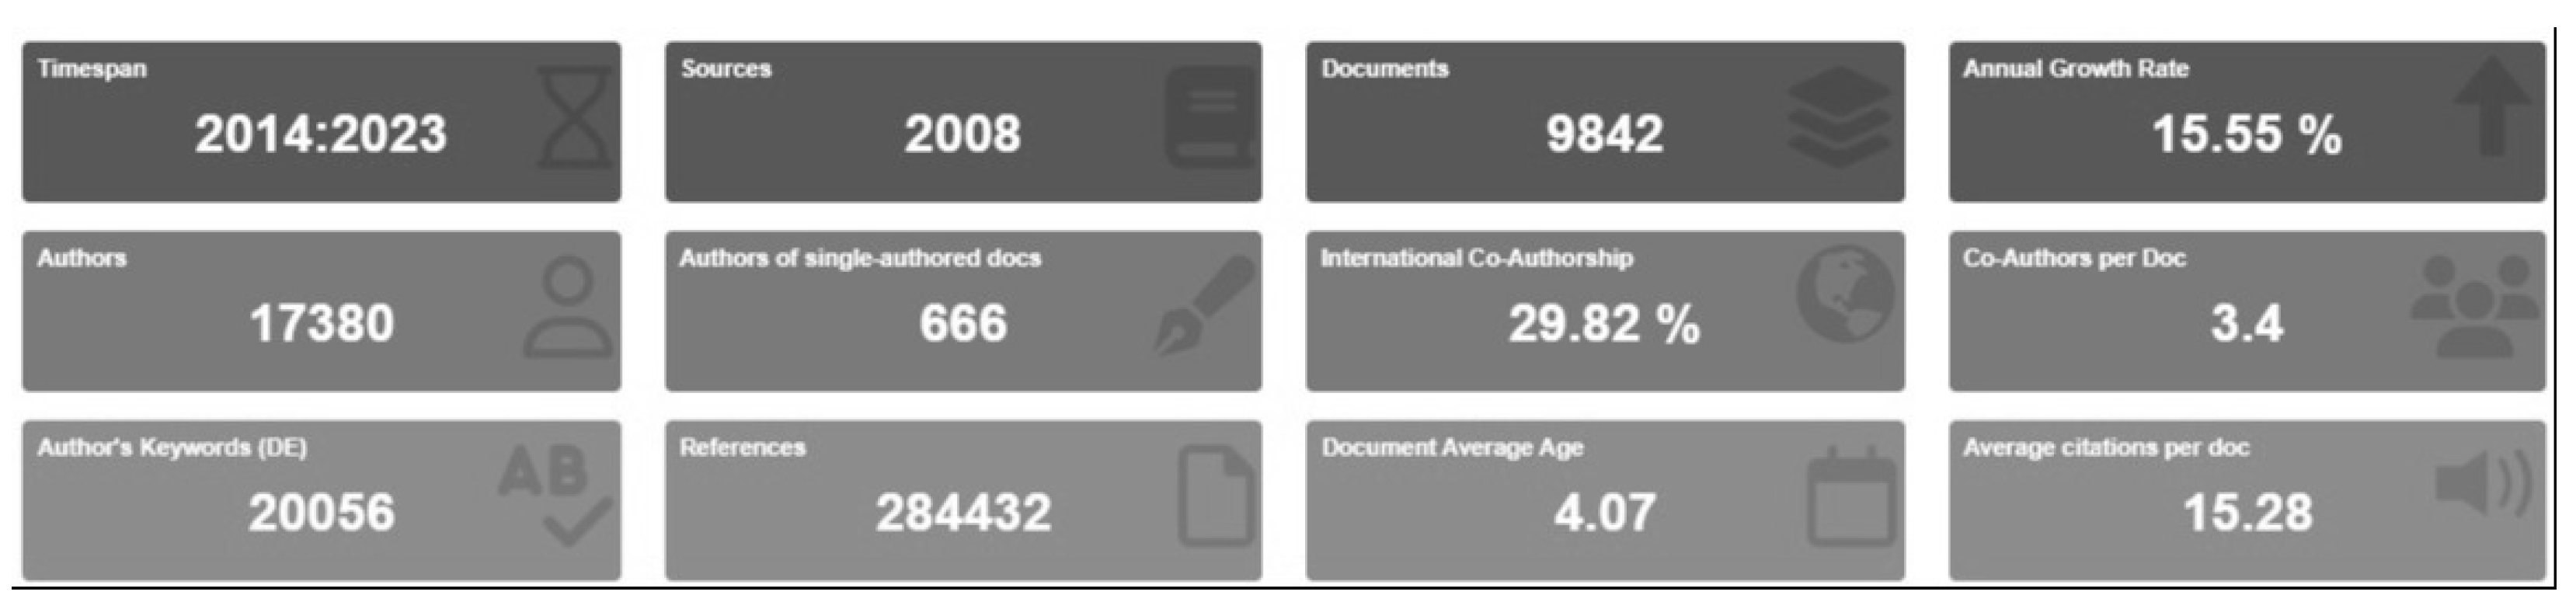
From the six predefined categories, a base of 9842 journals from 2014 to 2023 is obtained while filtering only the articles. In total, 1970 replications are analyzed; without the replications, the base results in 7872 articles. Bibliometrix analyzes a publication growth rate of 15.5%, 9842 sources, 17,380 authors, and 666 authors of documents with single authorship. It is analyzed that the number of single authors is insignificant compared to most articles containing more than one author per document, including 29.82% of articles with international co-authorship, which points to significant international collaboration between countries, resulting in 20,056 keywords and 284,432 references that were used, with an average of 15.28 citations per document and an average age of 4.07 years per document, which shows that most of the exported articles are recent studies within less than 5 years of publication, which indicates the productivity and industry is high within the nine categories surveyed (
Figure 2).
The main authors and the main keywords dealt with in the articles. The main authors are Li Y., Wang Y., Li J., Lin B., and Chen X.
The keywords are China, productivity, efficiency, data envelopment analysis, and industry. It is analyzed that the main authors and the authors who publish the most on the subject are Chinese. It is observed that China appeared as the most used keyword, which demonstrates the country’s dominance within the macro-themes productivity and industry. The other two keywords that stand out in the research are efficiency and Data Envelopment Analysis (DEA); DEA is used for efficiency analysis; it is the only methodology that appears among the most addressed topics.
Three groupings resulting from the 8621 articles are analyzed. Two clusters are formed by the macro themes of productivity, identified by the green color, and industry, identified by the blue color. It is observed that there is a tendency for the articles to be located in some thematic pole.
The efficiency category is more related to industry, while the innovation and policy categories are more related to productivity. The third grouping labeled with red is the sustainable category.
2.5. Category Classification of Scientific Articles
Categorizing scientific papers into pertinent sections is crucial for effectively arranging and retrieving information from an extensive corpus of scholarly literature.
In this subsection, we elucidate the approach undertaken to train and assess the efficacy of four distinct machine learning models—Multinomial Naive Bayes Classification, Stochastic Gradient Descent, Support Vector Machines, and Decision Tree Classifier—applied to classify scientific articles across six distinct domains: Innovation, Sustainability, Industry 4.0, Industry 5.0, Efficiency, and Artificial Intelligence. A visual depiction of the complete process executed can be observed in
Figure 3.
2.5.1. Data Preparation
The dataset employed in this research was compiled from six distinct queries on the Web of Science (WoS), guaranteeing a diverse assortment of articles for each category. Articles devoid of title, abstract, or keyword data were eliminated from the dataset due to their insufficiency for accurate classification.
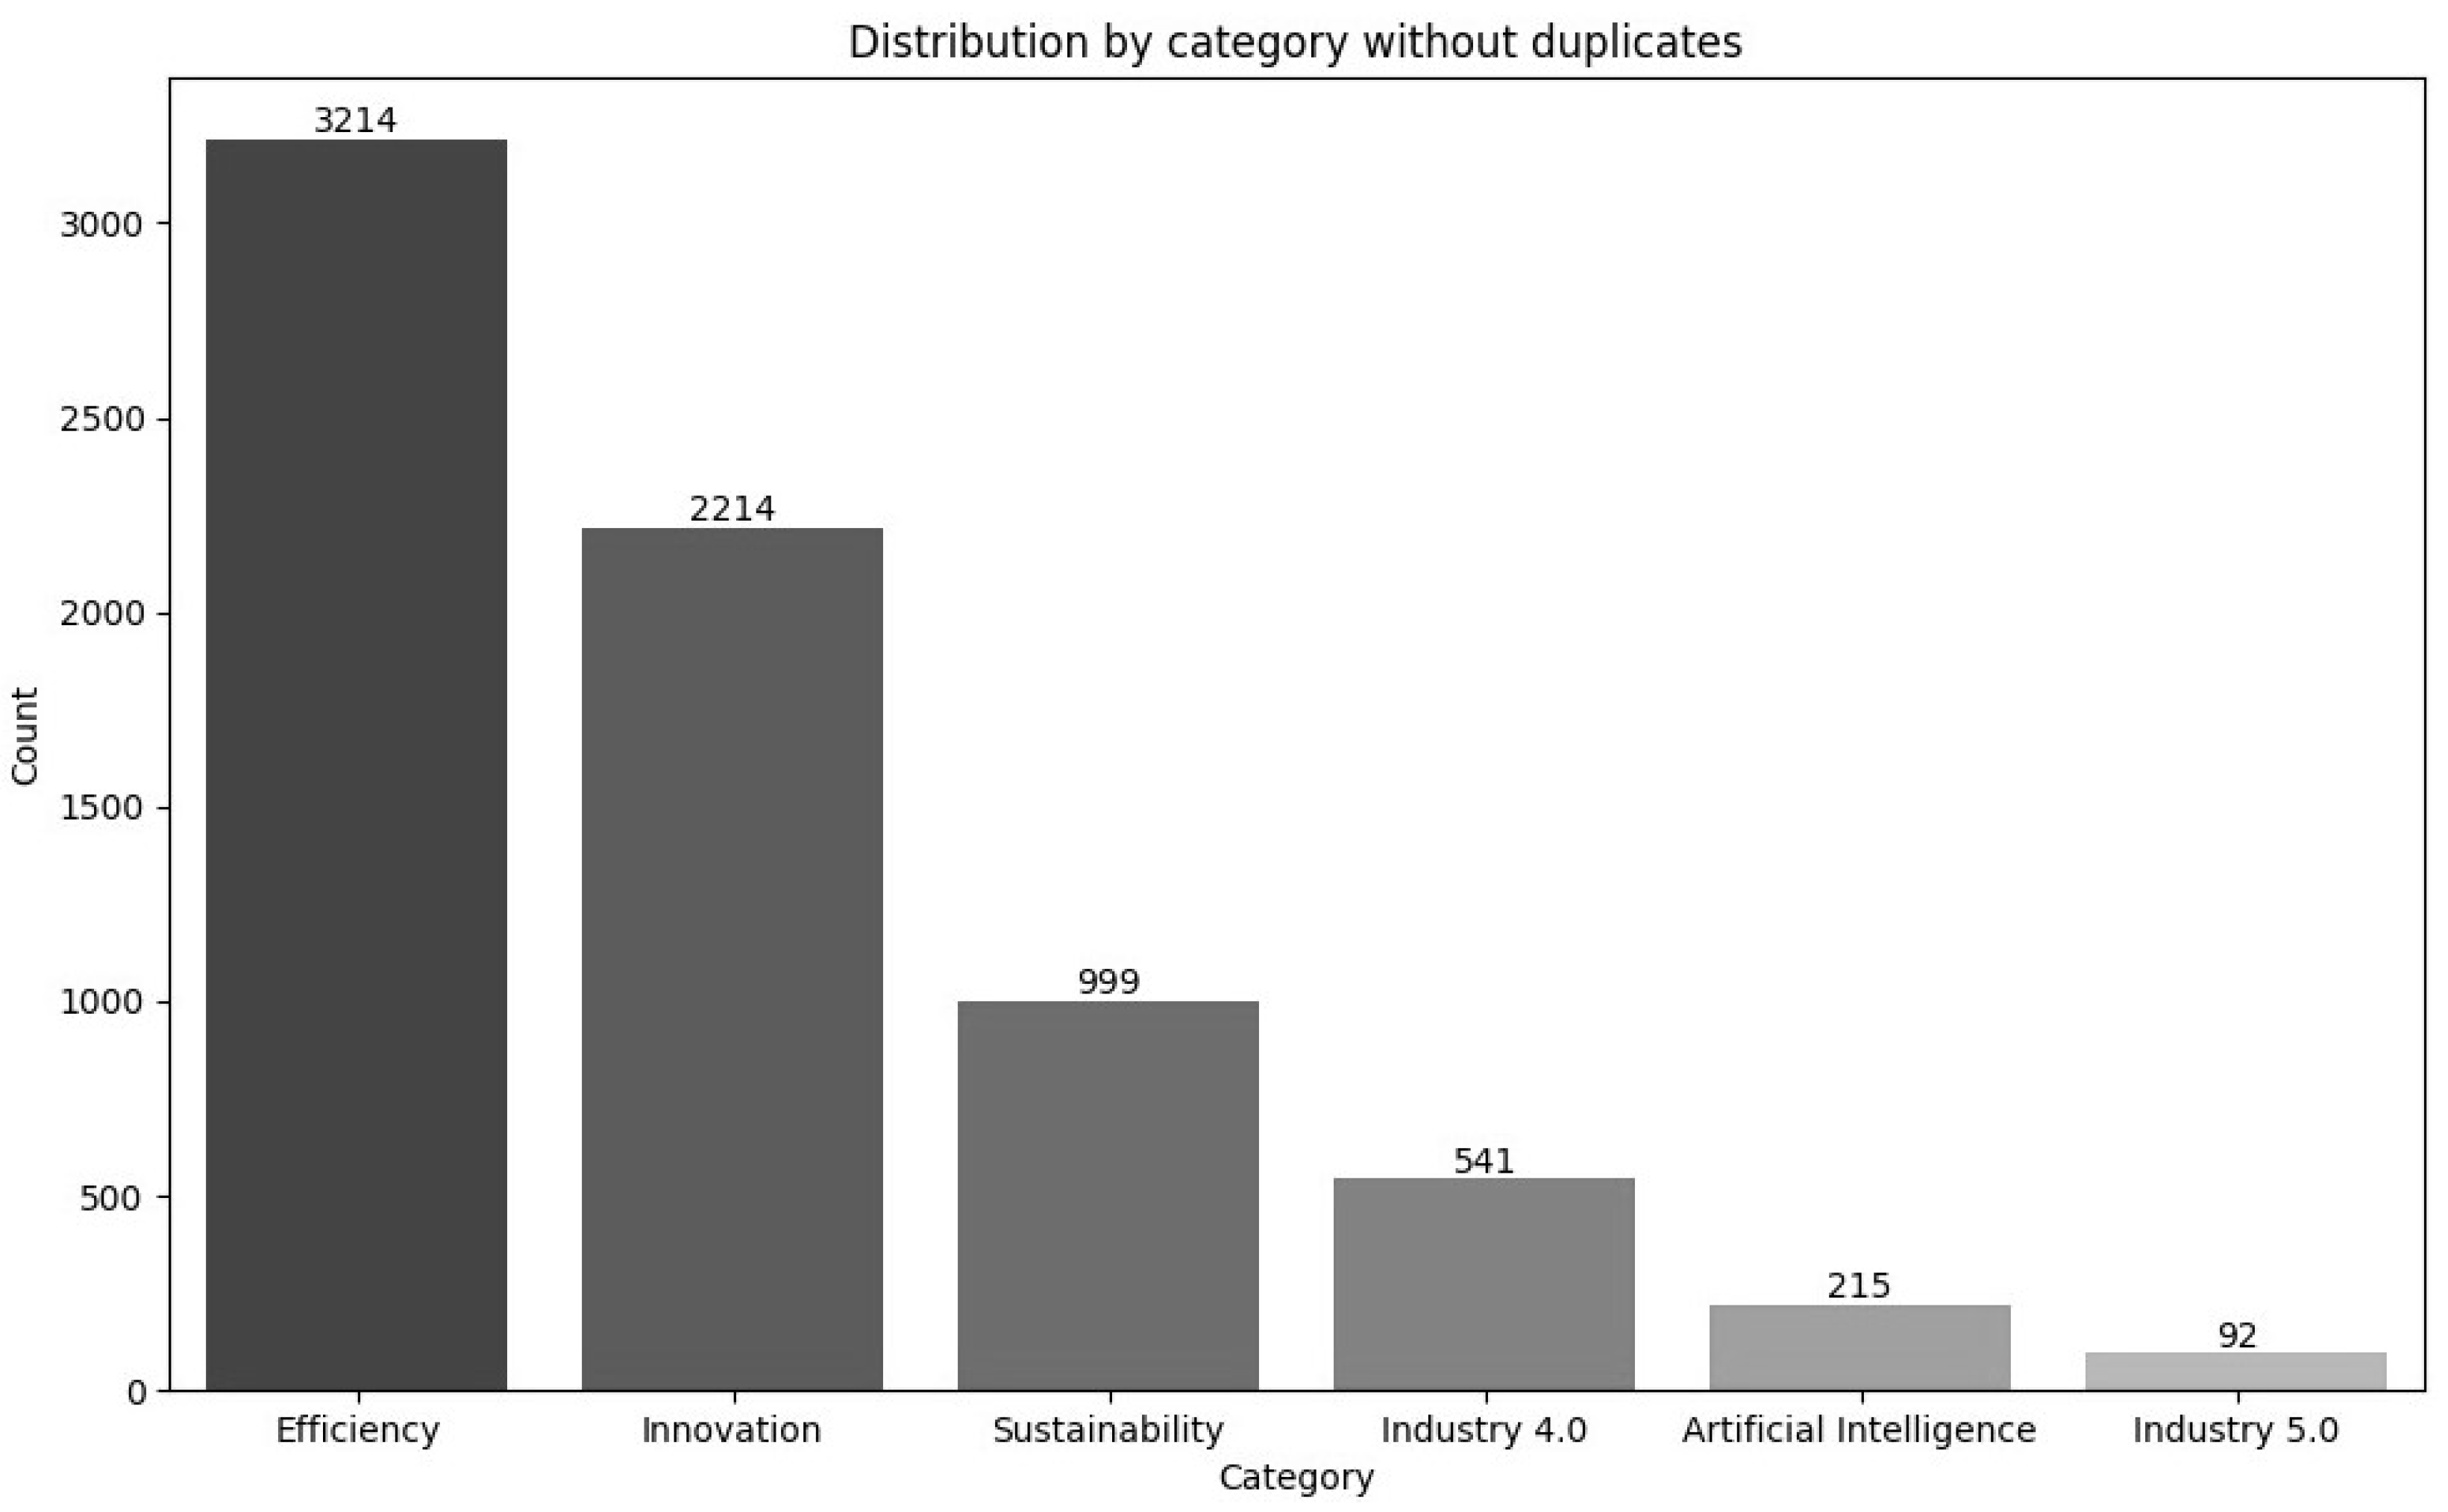
Additionally, measures were taken to ensure the exclusivity of each article to a single category. Any articles duplicated in more than one category have been removed to ensure that each article is in only one category. These duplicates were discovered by comparing the DOI of the articles found in each category. This strategy was adopted to ensure the dataset was more balanced. This meticulous data cleaning and preparation procedure safeguarded the reliability of the training and validation sets. The distribution of article categories post-duplication removal is illustrated in
Figure 4.
In terms of textual representation, a corpus was built by employing the TF-IDF (Term Frequency-Inverse Document Frequency) methodology, as outlined in the study conducted by Qaiser et al. (2018) [
10]. This technique transformed the textual content into numerical vectors. Furthermore, stemming was employed to truncate words to their root forms, curtailing feature space dimensions and enhancing model performance.
Subsequently, the dataset was randomly partitioned, allocating 70% for training and 30% for validation, thereby guaranteeing both subsets were representative of all six categories.
2.5.2. Machine Learning Models
Having readied the training dataset, the four designated machine learning models underwent training using the prepared data.
Multinomial Naive Bayes Classification (MNBC) is a prevalent technique for text classification, establishing a classifier from a network of trained data. According to [
11], MNBC utilizes the Frequency Estimate parameter to accentuate data frequencies. This feature contributes to the reliability of results and renders MNBC an effective tool for data classification.
Stochastic Gradient Descent (SGD) is a classifier capable of comprehending increasingly intricate functions and generalizing over parameterized data, as indicated by [
12]. It is noteworthy that Dynamic Multiclass Strategy (DMS) frequently initiates learning with straightforward classifiers, deferring the use of complex ones. The rationale lies in preserving the information gleaned from the initial learning phase via the simpler classifiers. Consequently, the DMS initiates learning in a predominantly linear manner.
Support Vector Machines (SVMs) operate based on the minimum structural risk principle found within the statistical theory [
13]. Consequently, SVM plays a pivotal role in data classification by employing linear regression to generate outcomes. SVM transforms a nonlinear input dataset into a linear form by applying a kernel function [
14].
The Decision Tree Classifier (DTC) serves to simplify intricate issues, making them more comprehensible and aiding in decision-making [
15]. As described by [
16], DTC is characterized as a hierarchical classifier, furnishing multi-level classification and divulging the specific pattern to which each datum belongs. Moreover, it offers adaptability in handling both binary and multi-class classifications.
The hyperparameters in each model were optimized using GridSearchCV (Alhakeem et al., 2022) [
17]. As can be seen in
Figure 5, this approach enables a grid of possible values to be created for the hyperparameters and then involves examining all the available combinations so that the best configuration can be determined. The GridSearchCV implementation uses cross-validation to analyze the performance of each set of hyperparameters. By employing this method, we were able to discover the best combination of hyperparameters for each model and thus optimize its effectiveness. The metric chosen for the best sets of hyperparameters was the average of the cross-validation results. By adopting this methodology, we could pinpoint each model’s optimal blend of hyperparameters, elevating its overall performance to its pinnacle.
2.5.3. Method Validation Metrics
A crucial aspect of the development of machine learning systems is the validation of the model. This process allows us to assess how well the model performs and generalizes when faced with new and unseen data. Numerous key elements of model validation are underscored:
Recall calculates the ratio of true positives to the total count of positive samples within the testing dataset. This measurement holds significance when the objective is to reduce false negatives, thus preventing the model from erroneously labeling positive samples as negative.
Precision represents a measurement that gauges the fraction of accurate positive predictions (true positives) to the complete count of positive predictions generated by the model. This metric is valuable when the emphasis diminishes false positives, preventing the model from categorizing negative samples as positive.
Accuracy serves as a prevalent assessment measure, quantifying the ratio of accurate forecasts produced by the model relative to the predictions rendered. This calculation entails adding the correct forecasts and dividing this sum by the overall count of instances. Accuracy proves advantageous in scenarios where classes are evenly distributed, signifying that they possess comparable instance quantities.
The F-measure represents a measurement that amalgamates precision and recall, forging a singular gauge. This metric comes in handy when class distribution is uneven, as it considers false positives and negatives alike. The F-measure is computed as the harmonic average of precision and recall, offering a cohesive yardstick to portray the comprehensive prowess of the model’s performance.
The confusion matrix serves as a technique to assess the outcomes of machine learning-based classification. It furnishes a thorough overview of the model’s predictions through a juxtaposition with the factual actual values. We can pinpoint instances of false positives and false negatives by conducting tests with labeled test data.
While validating a machine learning model, it becomes imperative to scrutinize these factors to cherry-pick the most suitable model coupled with finely tuned parameters. This process aims to attain peak performance, gauged by a spectrum of metrics encompassing accuracy, precision, recall, and the F-measure. The choice of which metric to prioritize hinges on the distinctive requirements of the problem and the classes under consideration.
2.6. Scientific Significance Score
Assessing the significance of scientific papers holds paramount importance in pinpointing the most noteworthy contributions within a particular research field or category. A prevalent technique employed for this assessment involves the utilization of a proposed relevance classifier called SSS alongside two pivotal metrics: the standard deviation of the mean and the Z-score. In the following section, we will delve into these concepts and their pivotal role in categorizing scientific articles based on their relevance.
Let
represent the Scientific Significance Score, a metric proposed in this paper to rank journals based on their scientific significance. The formula for calculating
is as follows:
where:
= the number of decimal places of the rounded value of the Scimago Journal, Country Rank ().
= Number of Citations of the paper.
= Current Year.
= Publication Year, when the paper was published.
This formula represents a scoring mechanism where is determined based on an international index , the number of citations () of the paper, and the temporal difference between the current year () and the publication year ().
To identify the top-tier articles, we leveraged the criterion of the article’s citation count. To cherry-pick the finest articles, we employed an outlier detection method, such as the Z-score and the standard deviation of the mean [
18].
Z-scores typically identify outliers that notably exceed (positively or negatively) the majority of the data. When a Z-score surpasses a predetermined threshold (e.g., ±2 or ±3), it can indicate that a specific data point is an outlier. In our study, we classify articles as Finest if their Z-score exceeds 3, while articles are deemed relevant if their Z-score falls below −3 and is greater than the upper range of the standard deviation, and the articles below the upper bound of the standard deviation were classified as Good.
3. Results
This segment unveils this study’s outcomes by presenting and examining how four distinct classification models fared when applied to the challenge of categorizing scientific articles.
3.1. Category Classification
The assessment encompasses the Multinomial Naive Bayes (MNB), SGD Classifier, Support Vector Machine (SVM), and Decision Tree models. Each of these models underwent multiple runs with different hyperparameter configurations, and their effectiveness was gauged by metrics such as the F-measure [
19,
20]. The primary objective is to discern the most fitting model for the given challenge of subject classification. This scrutiny involved processed data transformed into vectors. The dataset is composed of labeled documents spanning diverse subject categories. The task involves training the models to aptly classify new documents into their appropriate categories.
Table 2 shows the values of the F-measure metric for each model. This is the most suitable metric when we have an unbalanced database. We highlight the remarkable rate for this metric for the Decision Tree model, which reached a percentage of over 74%.
- (1)
Multinomial Naive Bayes (MNB). This classifier hinges on Bayes’ theorem and is acknowledged for its simplicity and computational efficiency. When evaluating MNB’s performance in our subject classification endeavor (
Figure 6), we observed that the F-measure rests at 66.06%.
Despite the advantages of its simplicity and computational efficiency, the outcomes suggest that MNB might not be the optimal choice for our specific subject classification task. In this context, exploring alternative models that have demonstrated more promising outcomes becomes pivotal. This exploration aims to pinpoint the model that best aligns with the project’s requirements and objectives.
- (2)
The Stochastic Gradient Descent (SGD). The SGD classifier, a linear classifier employing stochastic gradient descent for optimization, was subjected to performance evaluation in our subject classification undertaking. Our findings demonstrate that the SGD classifier attained the F-measure of 71.34%. This outcome underscores the model’s superiority over MNB, and this improvement can be attributed to its enhanced capability to tackle more intricate classification challenges (
Figure 7).
The enhanced F-measure demonstrated by the SGD classifier, compared to MNB, can be attributed to its inherent characteristics and proficiency in handling linear relationships among problem features. This ability proves especially valuable when dealing with intricate classification challenges. Consequently, these outcomes suggest that the SGD classifier presents a more favorable prospect for the subject classification task than MNB. However, it remains crucial to thoroughly consider the other evaluated models to ascertain the most suitable option that aligns with the precise demands of this study.
- (3)
Support Vector Machines (SVM). Recognized for its efficacy in high-dimensional spaces, the Support Vector Machine (SVM) stands as a frequently employed classifier in classification tasks. Our findings reveal that the SVM garnered an F-measure metric of 73.67%. These demonstrate that the SVM surpassed the performance of both MNB and SGD classifiers. This highlights many true positives, evident within the associated confusion matrix (
Figure 8).
The remarkable outcomes observed in accuracy, recall, and precision, when contrasted with those of the MNB and the SGD Classifier, strongly validate the SVM’s potency for subject classification tasks. Notably, it shines in scenarios characterized by expansive data dimensionality and intricate classification intricacies.
Consequently, these findings underscore the SVM’s stature as a remarkably competitive and accomplished choice for the subject classification endeavor. Nevertheless, it remains imperative to weigh additional factors like runtime and interpretability when choosing the most fitting model that aligns with our project’s unique prerequisites and objectives.
- (4)
The Decision Tree, recognized for its interpretability and reliance on decision rules, stands out as a model choice. Our findings reveal that the Decision Tree model attained an F-measure of 74.41%. This outcome reigns supreme among the models under examination, solidifying how the Decision Tree excelled in the subject classification undertaking.
The commendable outcomes achieved in accuracy, recall, and precision affirm that the Decision Tree is a formidable contender for subject classification tasks. Notably, its interpretability is a considerable asset, offering more precise insights into the model’s decision-making process and enabling the recognition of classification trends. In light of the results presented, it is evident that the Decision Tree emerged as the top-performing model for the subject classification undertaking. The interpretability feature of the Decision Tree brings a substantial advantage to the table when navigating the realm of subject classification.
3.2. Relevance Classification
The 7872 articles classified by subject were further classified into three categories of relevance: Good, Relevant, and Finest (
Table A1).
- (1)
Innovation. In Innovation, we classified as follows (
Figure 9):
Good: 2600
Relevant: 27
Finest: 23
The finest article is Innovation in the Pharmaceutical Industry: New Estimates of R&D Costs.
- (2)
Efficiency. In Efficiency, we classified as follows (
Figure 10):
Good: 4556
Relevant: 24
Finest: 24
The finest article is Impact of Energy Conservation Policies on the Green Productivity in China’s Manufacturing Sector: Evidence from a Three-stage DEA Model.
- (3)
Sustainability. In Sustainability, we classified as follows (
Figure 11):
Good: 715
Relevant: 311
Finest: 20
The finest article is Natural Fiber Reinforced Polymer Composites in Industrial Applications: Feasibility of Date Palm Fibers for the Sustainable Automotive Industry.
- (4)
Industry 4.0. In Industry 4.0, we classified as follows (
Figure 12):
Good: 684
Relevant: 3
Finest: 3
The finest article is State-of-the-Art in Surface Integrity in Machining Nickel-based Superalloys.
- (5)
Artificial Intelligence. In Artificial Intelligence, we classified as follows (
Figure 13):
Good: 168
Relevant: 59
Finest: 5
The finest article is Brave New World: Service Robots in the Frontline.
4. Conclusions
In summary, this study aimed to compare various approaches to systematic literature reviews, seeking the most efficient method for swift and effective review processes. Our investigation categorized industry productivity into six core sectors: Innovation, Sustainability, Industry 4.0, Industry 5.0, Efficiency, and Artificial Intelligence. Subsequently, systematic literature reviews were carried out for each of these sectors. To streamline the classification, we leveraged four Machine Learning models: Multinomial Naive Bayes Classification (MNBC), Stochastic Gradient Descent (SGD), Support Vector Machines (SVM), and Decision Tree Classifier (DTC). Among these, the Decision Tree Classifier (DTC) exhibited remarkable performance, boasting a classification accuracy surpassing 75%.
A relevance classifier was employed to pinpoint significant contributions in scientific articles across various research domains or categories. This classifier integrated two crucial metrics: the standard deviation of the mean and the Z-score.
As a prospective recommendation for future research, we underscore the importance of incorporating supplementary data sources and considering the h-index as an alternative method for ranking article relevance. By broadening the data scope and integrating diverse evaluation metrics, upcoming studies have the potential to amplify the precision and depth of systematic literature reviews. Also, we recommend the creation of a human curation stage, in which the results of relevant articles are evaluated manually to endorse the results of the evaluation presented. Ultimately, this contributes to more comprehensive insights and well-informed decision-making within industrial productivity.


 ,
, 


