Article

The Investigation of Various Flange Gaps on Wind Turbine Tower Bolt Fatigue Using Finite-Element Method

1
Datang Boiler and Pressure Vessel Inspection Center Co., Ltd., Heifei 230088, China
2
China Datang Corporation Science and Technology Research Institute Co., Ltd., East China Electric Power Test & Research Institute, Heifei 230088, China
3
State Key Laboratory of Alternate Electrical Power System with Renewable Energy Sources, North China Electric Power University, Beijing 102206, China
4
Institute of Advanced Structure Technology, Beijing Institute of Technology, Beijing 100081, China
5
Huaneng Clean Energy Research Institute, Beijing 102209, China
*
Author to whom correspondence should be addressed.
Submission received: 12 March 2024 / Revised: 17 April 2024 / Accepted: 18 April 2024 / Published: 25 April 2024
(This article belongs to the Section Mechanical Engineering)

Abstract

:
Upon careful examination, numerous wind turbine collapses can be attributed to the failure of the tower bolts. Nowadays, the Schmidt–Neuper algorithm is extensively accepted in wind turbine tower bolt design. It is not advisable to utilize the finite-element method, notwithstanding the effect of the flange gap. To quantitatively investigate the influence of flange gaps on bolt fatigue, a nonlinear finite-element model of a flange segment incorporating bolt pretension and contact elements is herein proposed. Three distinct types of flange gaps are defined intentionally. It is possible to determine the nonlinear relationship between the wall load and bolt internal force. The fatigue damage of bolts was thus computed using the obtained nonlinear curve. Comparing with the results with those of Schmidt–Neuper method revealed the bolt fatigue damage is susceptible to a specified flange gap.

1. Introduction

The bolted flange is the fundamental connecting form for cylinder structures in numerous engineering disciplines, including nuclear energy, aerospace, and maritime engineering. The triple complexity of material, geometric, and contact nonlinearity is the source of its highly nonlinear behaviors. For instance, Liao et al. conducted a representative study in which they integrated both Gurson–Tvergaard–Needleman and progressive damage models into the explanation of plastic and damage behavior of threaded bolts [1,2]. The finite-element (FE) technique explored thread structural features. Until recently, the majority of bolt failure research relied on experimental tests [3,4,5] and FE simulations [6,7]. In contrast to the FE method, engineering algorithms such as DIN 188000-4: 1990-11 [8], Eurocode 3 [9], and the GL 2010 standard [10] for steel shells buckling analysis; DIN 4133 for wind-induced transverse vibrations [11]; and VDI 2230 for bolts connection [12] prevail in wind turbine design. The GL 2010 standard recommends the Petersen and Schmidt–Neuper methods for ring flange connections. Due to its simplicity, efficacy, and success in a range of wind turbines, the Schmidt–Neuper approach is now widely used in tower connection design [10].
Meanwhile, mechanism research using the FE method continues to reveal the influence of various parameters on bolt strength. Liu et al. introduced an improved 2D finite-element model to forecast the distribution of bolt loads in composite multi-bolt single-lap joints, effectively capturing secondary bending, a pivotal factor contributing to joint failure [13]. Alonso-Martinez et al. [14] established an FE model of the flange subsystem in which the prestressing forces and contact between flanges are taken into account. In their study, the effects of various variables on the tower structural responses were examined by experiments. Ajaei and Soyoz [15] studied the influence of bolt preload on the occurrence of fatigue damage to bolts under eccentric loads. They pointed out the strong correlation between bolt preload and fatigue damage. Fu et al. [16] introduced the probability density to compute the probability of fatigue, highlighting the influence of random vibration. Sharos et al. finished the development and validation of a highly efficient and innovative user-defined finite-element method for modeling composite bolted joints under various loading rates, which was validated by experimental data [17]. Seidel et al. [18] found that the impact of the geometrical imperfections on wind turbine tower bolt fatigue can be predicted by the FE analysis model. Weijtjens et al. [19] discovered that the FE model is more consistent with the observed load transfer coefficients in the offshore wind farm compared to the values expected from the celebrated Schmidt–Neuper approximation. Cheng et al. [20] supplied comprehensive knowledge for the practical implementation of offshore wind turbine connections, and the effectiveness and precision of the FE models were confirmed by comparison with the results of the conducted tests. Belardi et al. evaluated the applicability of the composite bolted joint for modeling single-lap multi-column composite bolted joints and compared the stiffness prediction and bolt-load distribution outcomes with those obtained from a refined 3D model [21]. Tao et al. investigated the effects of yaw optimization control on the fatigue life of tower bolts in offshore wind turbines [22]. Zheng et al. devised a systematic approach for time–domain fatigue assessment of preloaded blade root bolts for FOWTs. This approach took into account mean stress effects as well as a range of design and installation factors that influence the bolt fatigue strength [23].
During the past decades, wind turbine tower collapse accidents have been frequently reported worldwide [24,25,26,27]. Chou and Tu [26,28] conducted an in-depth investigation of tower failure, along with the lessons learned from a post-disaster inspection. They concluded that a considerable percentage of incidents might be related to bolt strength deficiencies. Mahmanparst et al. delineated prevalent issues linked to flanges and bolted connections while proposing potential resolutions [29]. For instance, seals should shield bolted connections from seawater for the duration of usage. Furthermore, optimizing the force dynamics of the hammer can mitigate peak stresses in the flange, diminish fatigue stresses, and decrease noise emissions during piling operations. Further simplification can be achieved by eschewing intricate sealing configurations and avoiding post-delivery machining of flanges provided by specialist suppliers.
Undoubtedly, catastrophic events need to be avoided through prudent design. Despite broad recognition of the significance of the tower bolt fatigue life, to the authors’ best knowledge, little research has been quantitatively conducted on the effect of various flange gaps on bolt fatigue. To this end, a finite-element model of a flange segment incorporating bolt pretension and contact elements is herein proposed. Three types of flange range are defined artificially. Consequently, the effects of various flange gaps on bolt fatigue are quantitatively revealed. A particular finding of note is that the bolt fatigue is sensitive to a particular type of the flange gap.
The rest of this paper is structured as follows. Section 2 describes the procedure for the Schmidt–Neuper approach and bolt fatigue analysis. Using the FE technique, Section 3 evaluates the effects of various flange gaps on bolt fatigue damage. Section 4 concludes with a succinct summary.

2. Procedure for Bolt Fatigue Analysis Using Schmidt–Neuper Method

The example provided in this section introduces the Schmidt–Neuper algorithm. Results from the calculation serve as the reference against which the finite-element model is tested.

2.1. Basic Procedure for Schmidt–Neuper Algorithm

The stresses in the bolt are estimated for ultimate and fatigue strength measurement using a single segment of the entire flange, as depicted in Figure 1. The tension force Z, equal to the sum of the shell’s stresses, is applied to the section. Resorting to this simplified model, the critical step in bolt fatigue analysis is to establish the link between Z and the bolt internal force FVS. As indicated in Figure 2, the pretension bolts and flange segment system is modeled as a spring system [30]. Parallel springs representing the washer and flange are in series with the spring, symbolizing the bolt.
The bolt and washer’s elastic stiffness can be evaluated as follows:
C s = E A N L s
C D , 2 = E π D w 2 d h 2 4 T w
where E signifies the steel’s elasticity modulus; AN denotes the nominal bolt surface, which is calculable from the nominal bolt diameter; LS is the free bolt length, which excludes the part of the bolt that passes through the nut; Dw and dh refer to the key head’s width bolt and the diameter of the bolt hole, respectively; Tw is the washer thickness.
The following formula can be applied to determine the stiffness of a flange with a thickness Tf [31].
C D , 1 = π E 8 T f D w + 2 T f 10 2 d h 2
The stiffness of the flange and washer can be described in the following manner:
C D = 1 C D , 1 + 2 C D , 2 1
The symbol C specifies the total stiffness as follows:
C = C S + C D
Hence, the bolt and flange spring ratios are determined, respectively, as follows:
p = C S / C , q = C D / C
We can define a constant named level ratio as follows [29]:
λ = 0.7 a + b 0.7 a
where a and b are the distances between the bolt center to the flange inner diameter and the mid-surface of the thin wall of the tower, respectively, as illustrated in Figure 3. Here, d is the flange inner diameter. PCD represents the pitch circle diameter, which is the diameter corresponding to the center line of the bolt.
Two additional constants are defined as follows:
Z I = ( a 0.5 b ) F V / a + b , Z II = F V / λ q
where ZI and ZII are the maximum wall load limits I and II, respectively; FV represents the preload bolt.
To produce the nonlinear relationship between the bolt load FVS and tower wall load Z, the following points on the curves are given by the Schmidt–Neuper algorithm:
F VS = 2 F V + λ Z 2 F V λ Z II F V p Z I F V F V + p Z I λ Z II λ Z Z < Z II Z = Z II Z = Z I Z = 0 Z = Z I Z = Z II Z II < Z
In Equation (9), the tower wall load Z can be evaluated by the external loads, and it yields the following:
Z = 2 M R N + F z N
where M refers to the bending moment at the flange section; R is the outside radius of the tower at the flange position; Fz is a total force in the z-direction, and N is the number of bolts in the flange connection. The moment at flange M can be decomposed into Mx and My. Both loads are assumed to be spatially fluctuating according to a sine or cosine function. As a result, Equation (10) can be rewritten as follows:
Z = 2 M x sin β M y cos β R N + F z N
where β is the angle representing the bolt’s position, as demonstrated in Figure 4. The coordinate system shown below directly follows one given in GL 2010 standard [10]. Figure 4 represents the cross-sectional coordinate system of the tower, where the circle signifies the tower’s cross-section. The x-axis denotes the inflow wind direction, with the y-axis perpendicular to the x-axis. When using the right-hand rule, the corresponding z-direction points vertically upward along the tower. β represents the angle between any cross-section of the tower and the positive x-axis. The intersection of the β-axis with the circle indicates the position of the tower flange where the bolt is located.
In the Schmidt–Neuper algorithm, it is assumed that the torsional stress from tightening the bolts does not influence on the bolt fatigue. Thus, the bolt stress only considers the axial load, calculated in the following manner:
σ = F VS / A S
where As is the stress area of the bolt. For specific values of As, the reader should consult the VDI 2230 standards [12].

2.2. S–N Curve for the Bolt

For tower bolted connections, the property classes 10.9 (according to ISO 898-1: 2009) are utilized [10]. The yield and tensile limits for high-strength steel are 900 MPa and 1000 MPa, respectively. Figure 5 depicts the S–N curve for the tower bolt, which can be separated into two sections by the division point 5 × 10⁶. The following equation is applied to describe the S–N curve [28]:
N = N D Δ σ D / Δ σ m
where the slope parameter can be given as m = 3 5 N < 5 × 10 6 N 5 × 10 6 . The abscissa represents the number of stress cycles, while the ordinate represents the stress range. Two parameters, ND and ΔσD, respectively, denote the number of stress cycles and stress range corresponding to the segments of the S–N curve. According to the GL 2010, the recommended commonly used S–N curves include two forms: Eurcode3 and IIW. Both consist of two linear segments with exponential slopes of 3 and 5, respectively, where the difference lies in the inflection points corresponding to 5 × 10⁶ and 1 × 10⁷ cycles. As depicted in Figure 5, typical standard design S–N curves indicate the specific fatigue strength of structures under 2 × 10⁶ cycles and define it as the detail category (DC). For example, an S–N curve with DC 36 represents its fatigue strength, characterized by stress amplitude, at 2 × 10⁶ cycles as 36 MPa. This paper adopts Eurcode3 as the fundamental form of the bolt S–N curve, with a DC level selected as 36 [28].
The S–N curve is reduced by factor ks for bolts with a diameter of more than 30 mm [28].
k s = min 1 , 30 / d N 0.25
where dN is the nominal diameter of the bolt in millimeters.

2.3. Palmgren–Miner’s Rule

The structural strength criteria can be established based on the cumulative damage sum, denoted as D:
D = ψ i ψ ¯ i 1
where ψ i and ψ ¯ i represent the actual and allowable load cycles for class (i), respectively. Here, ψ ¯ i is associated with the stress range, which can be estimated using the S–N curve.

2.4. Fatigue Load

In this section, the lifetime fatigue load of a wind turbine tower is calculated using the commercial wind turbine load simulation software Bladed 4.3TM, and the fatigue condition design load cases (DLCs) 1.2, 3.1, 4.1, and 6.4 are specified according to GL 2010 standard [10,19]. Notably, the duration of each load simulation is ten minutes, and six different random seeds are set for each wind condition to assure the stability of fatigue damage evaluation. For instance, Figure 6 depicts a typical ten-minute fatigue load case, including six time-varying loads corresponding to the flange’s center position.

2.5. Methodology of Fatigue Analysis in the Time Domain

In estimating fatigue damage, the stress range and mean stress are the most crucial factors. In this investigation, the fatigue load and time-variant stress can be derived from the time-varying loads and nonlinear relationship between external loads and bolt stress. The Schmidt–Neuper approach excludes the influence of mean stress from tightening the bolts. On the basis of the linear damage accumulation assumption, the fatigue damage accumulated from each stress cycle can be computed using the S–N curve given in Section 2.2. For the amount of cycles occurred over time, the rainflow cycle counting method is employed. For a time-varying stress history, only the peaks and valleys are stored in the cycle counting. Subsequently, the cycles are determined by checking every three successive points from the beginning until a closed hysteresis loop is defined [32]. In one loop, the algebraic difference between the maximum and minimum stress is defined as the stress range, i.e., Δσ = σmaxσmin. The counting continues until all the stress points are utilized. More details on this rainflow cycle counting method can be found in the reference [32].

2.6. Reference Results

This section describes the fundamental characteristics of the steel tower housing a 2 MW wind turbine. In addition, the cumulative fatigue damage of bolts is evaluated using the Schmidt–Neuper method. The tower is 72.37 m high and features a tubular design with variable cross-section and wall thickness along its height. An interior flange connection with 110 screws (M48) is investigated. The outer and inner diameters of the flange are 4.2 m and 3.8 m, respectively. As shown in Figure 3, the pitch circle diameter (PCD) of the screws is 3.98 m. The flange and tower wall thicknesses are 140 mm and 32 mm, respectively. The main specifications are 900 MPa yield strength and 1470 mm2 stress area. The bolts are pretensioned with a force of FV = 926.1 kN, and the stress under preload is 630 MPa, which corresponds to 70% of their bearing capacity. The washer’s inner and outer diameters are 49.4 mm and 92.0 mm, respectively, and its thickness is 8 mm. Based on the aforementioned parameters, Figure 7 depicts the nonlinear relationship between the wall tension Z and bolt stress σ.
After obtaining the nonlinear relationship depicted in Figure 7 and combining it with the external time-variant loads Mx, My, and Fz, the time-variant bolt stress can be easily derived using linear interpolation over the predetermined nonlinear curve. Sequentially, rainflow counting and fatigue damage accumulation are performed. For clarity, Figure 8 depicts the distribution of bolt damage accumulation over 20 years at 15° intervals.
In Figure 8, the angular coordinates indicate the position of the tower within the horizontal section. The line connecting the 0° and 180° positions aligns with the direction of incoming turbulent winds, with 0° representing the upstream direction and 180° representing the downstream direction. The angles in Figure 8 represent the positions of the bolts on the flange. As observed in Figure 8, the radar diagram of bolt fatigue damage is asymmetrical. The extreme cumulative damage occurs near 0° or 180°, implying that the bolt fatigue is predominantly caused by the bending moment. To acquire even more precise data, recalculation is performed by subdividing the region near 0°, and the resultant fatigue damage distribution is displayed in Figure 9.
From Figure 9, maximum damage appears to occur at −3.27° (=−360°/110) with a cumulative damage value of 0.292. The maximum damage does not exceed 1. The current design satisfies the fatigue strength criteria, as deduced from Miner’s rule [33]. Without additional explanation, the following section evaluates the bolt at −3.27°.

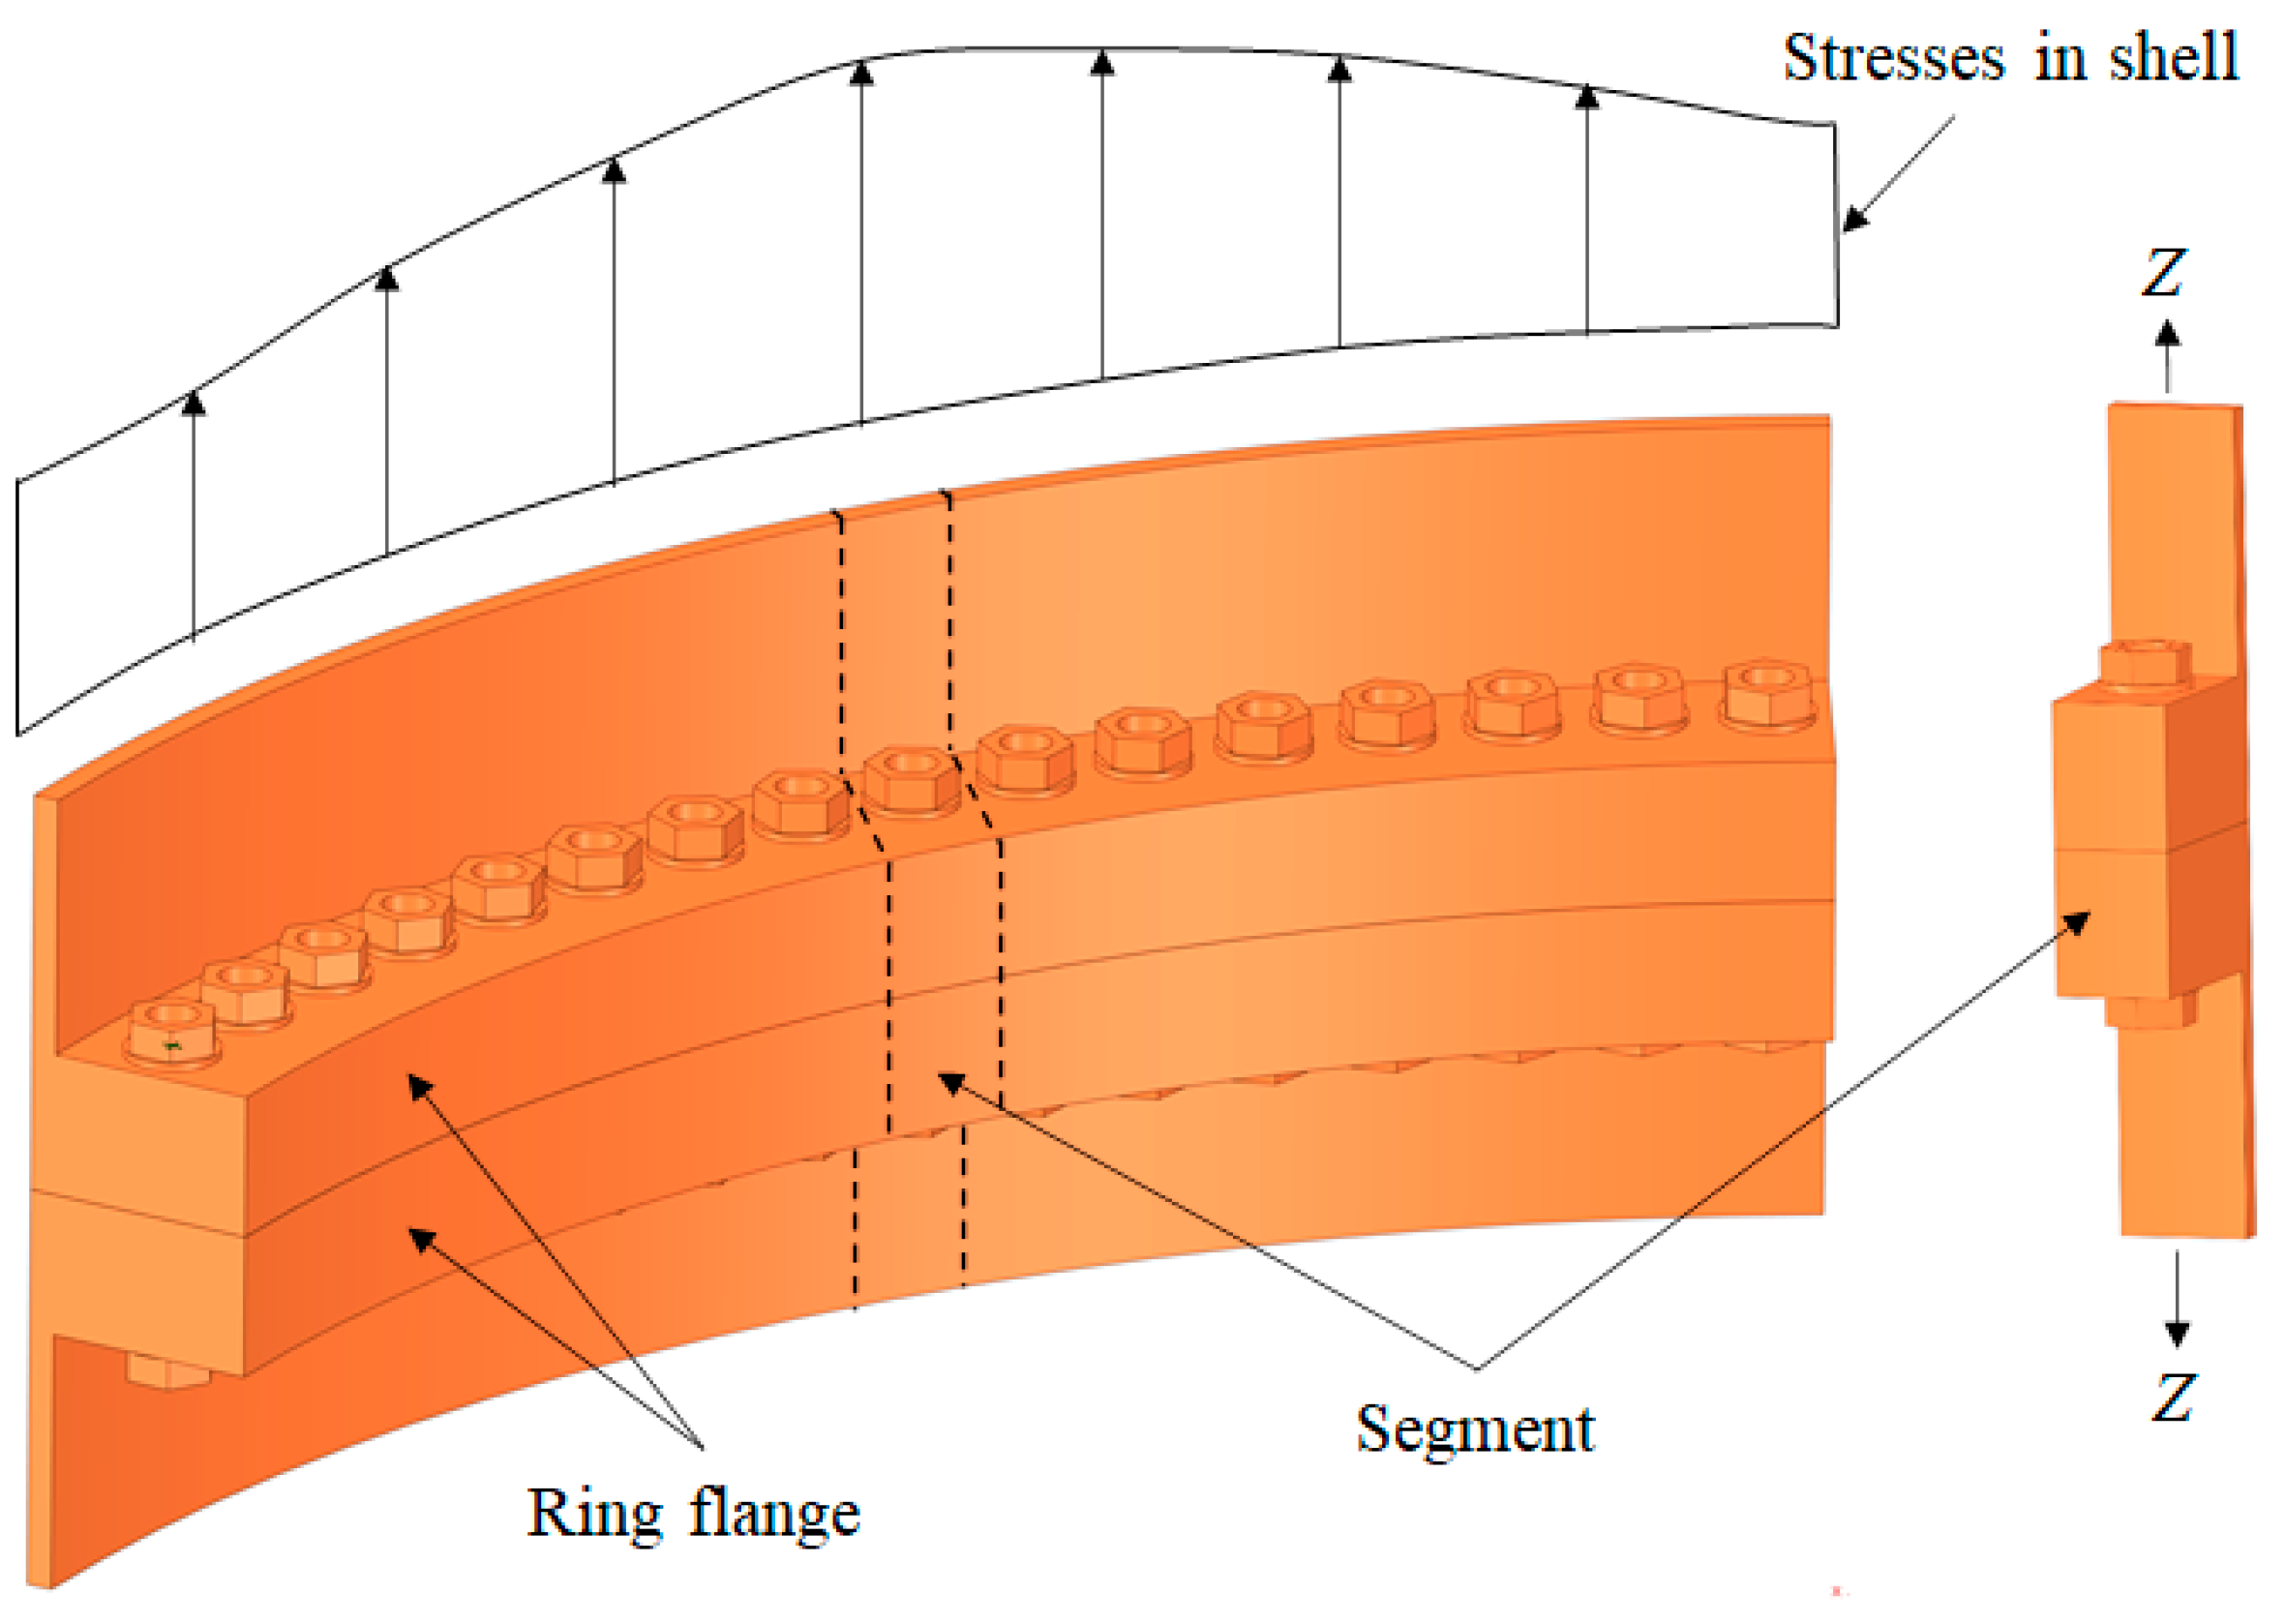
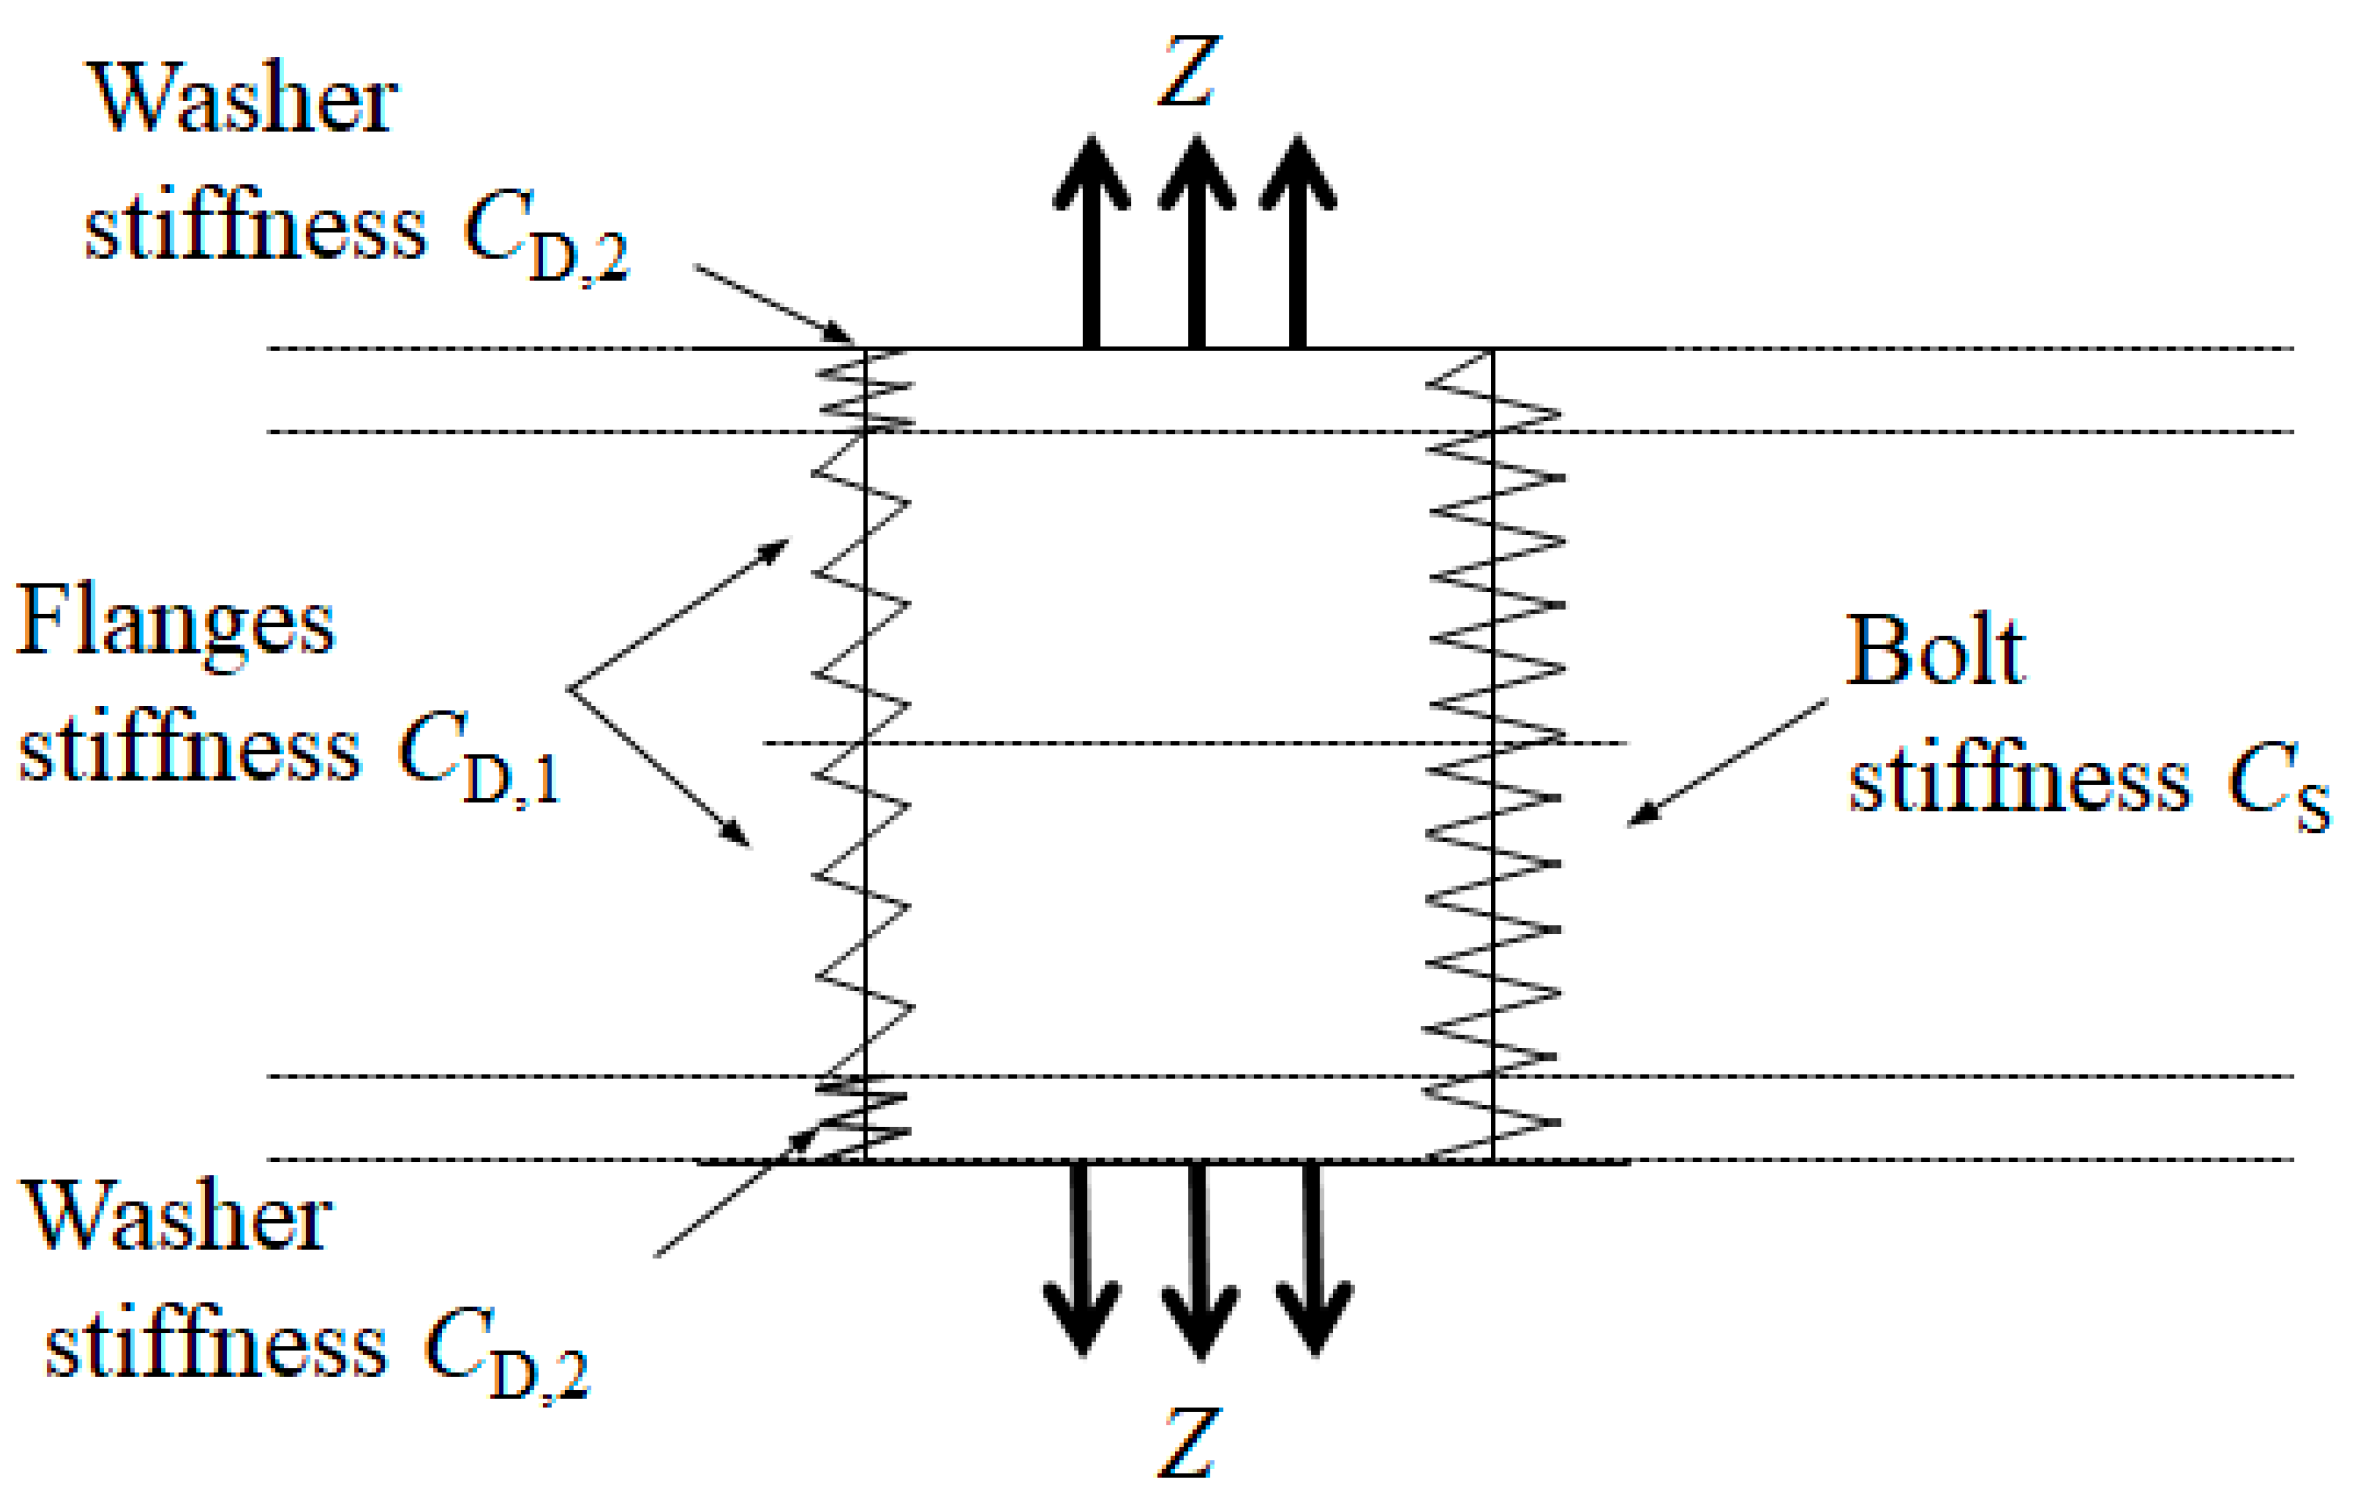
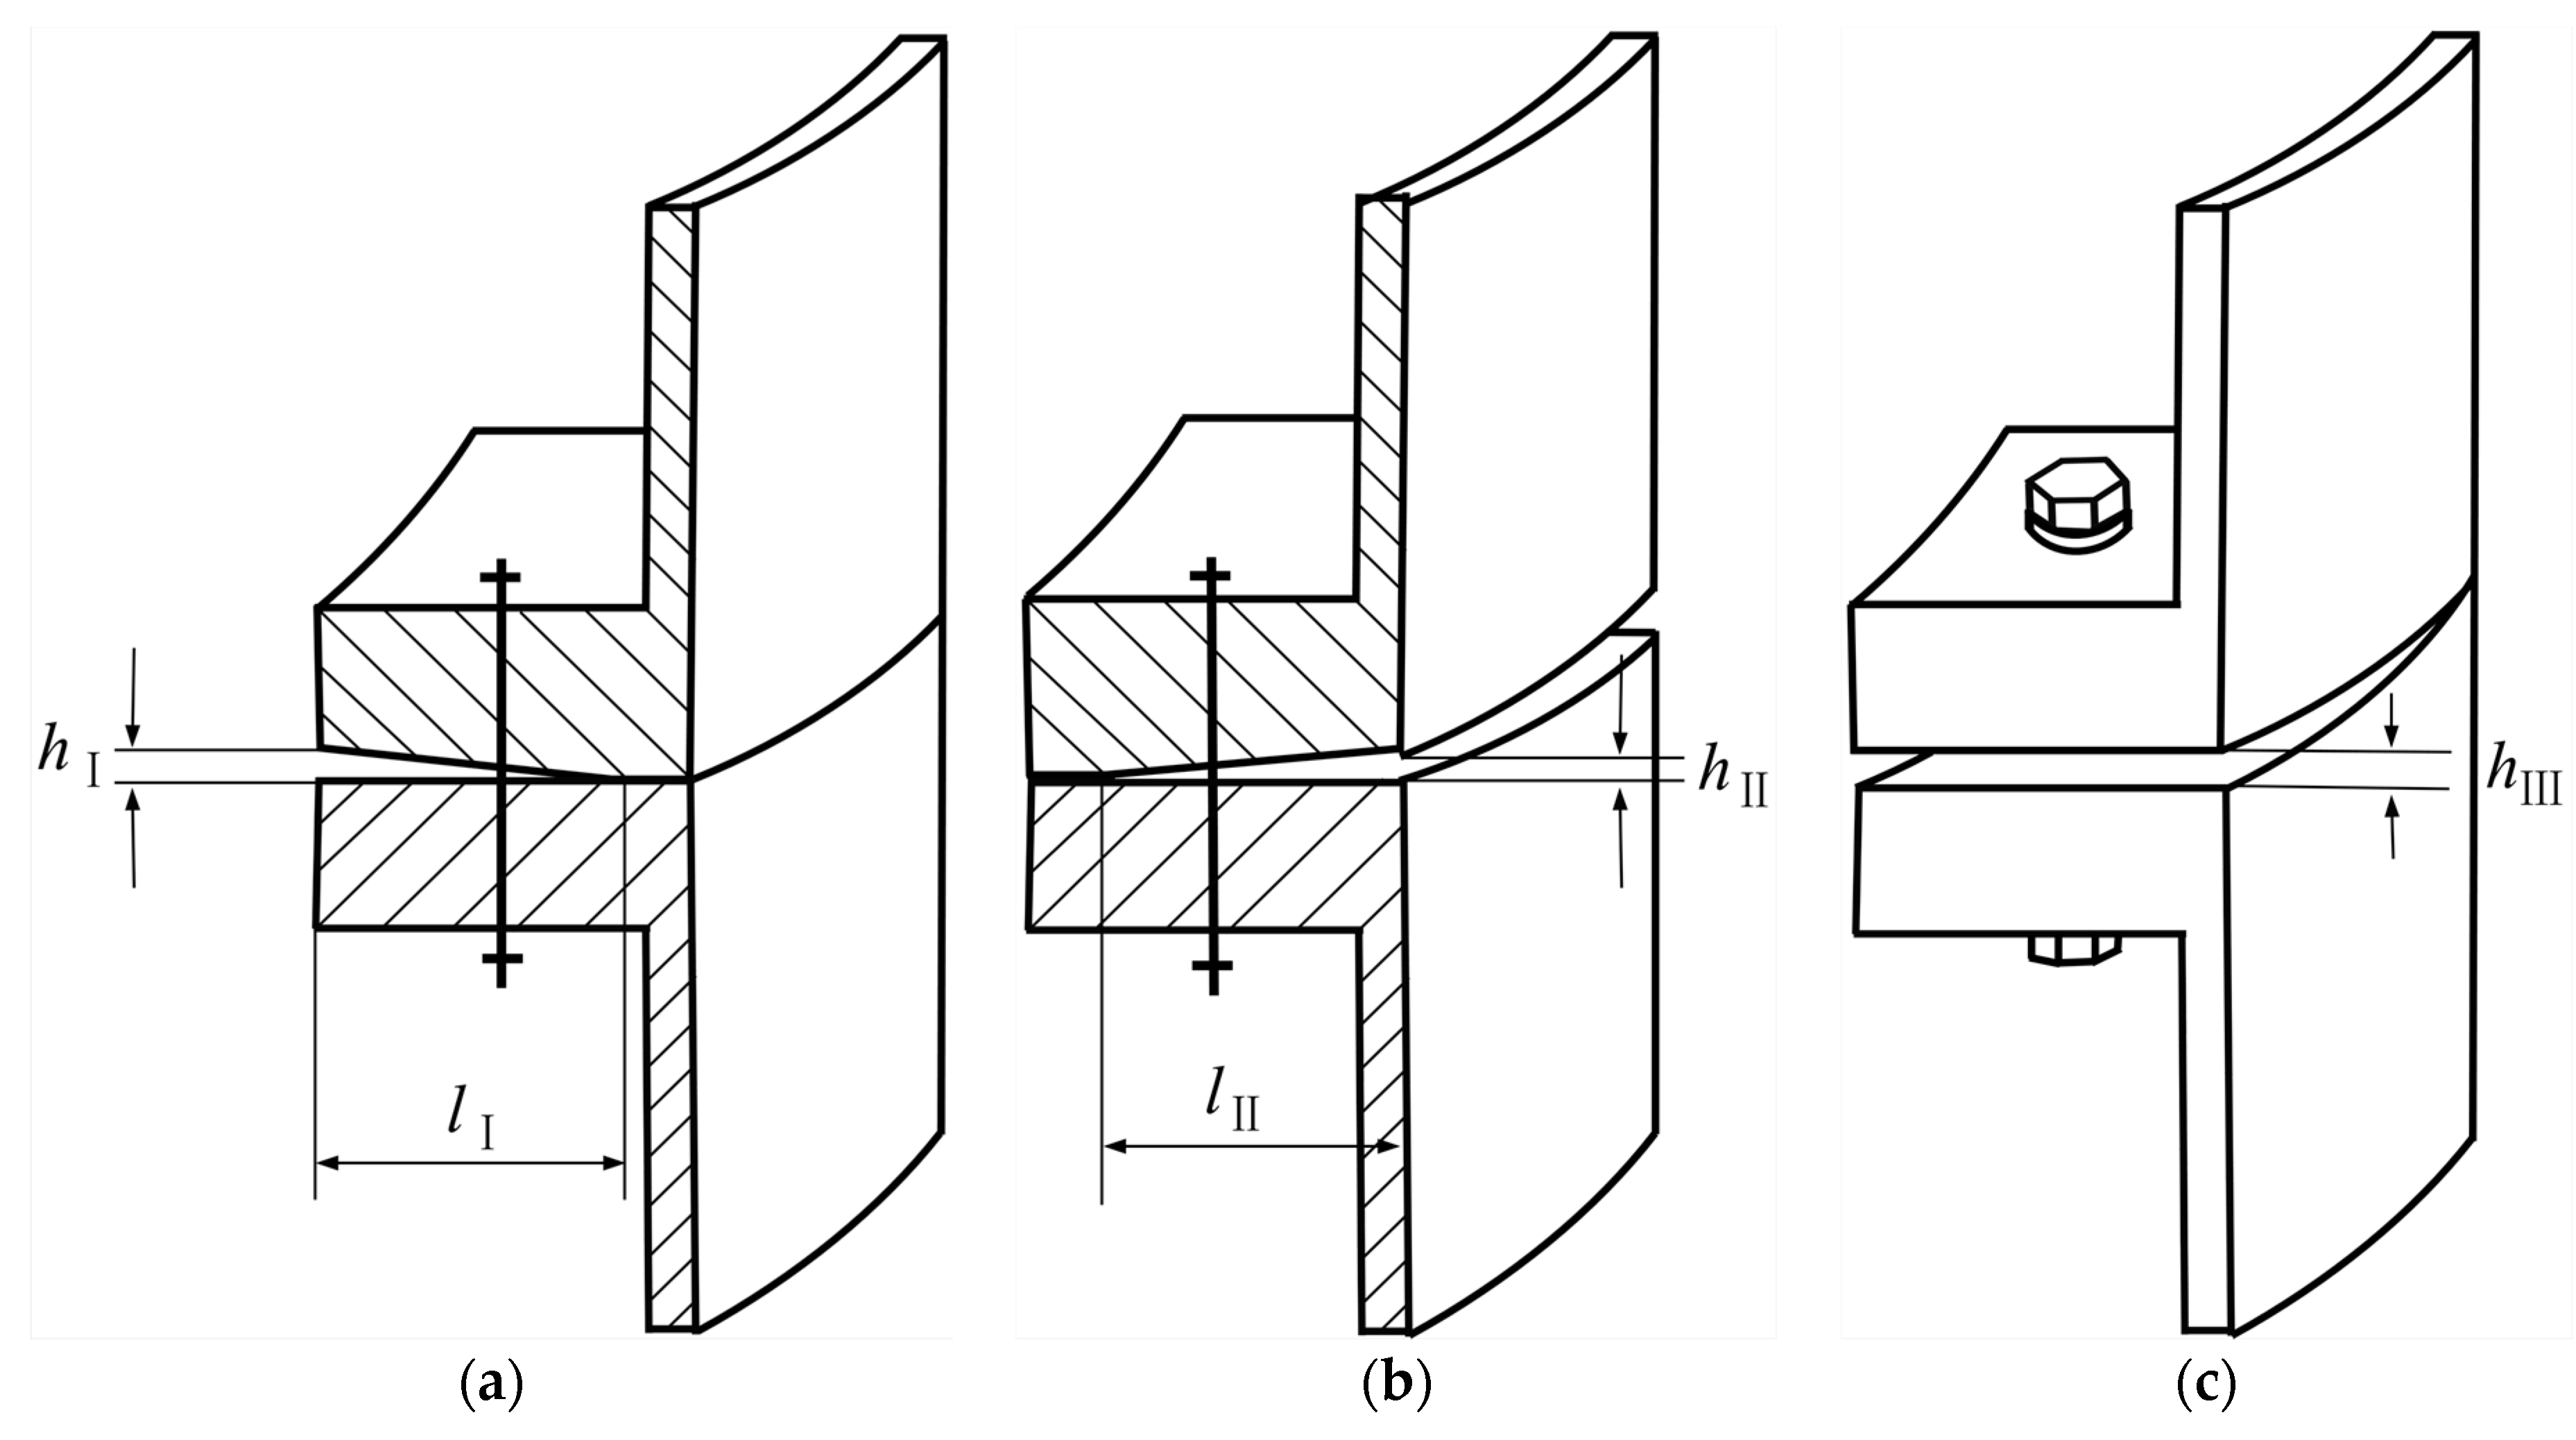
3. FE Analysis for the Flange Segment
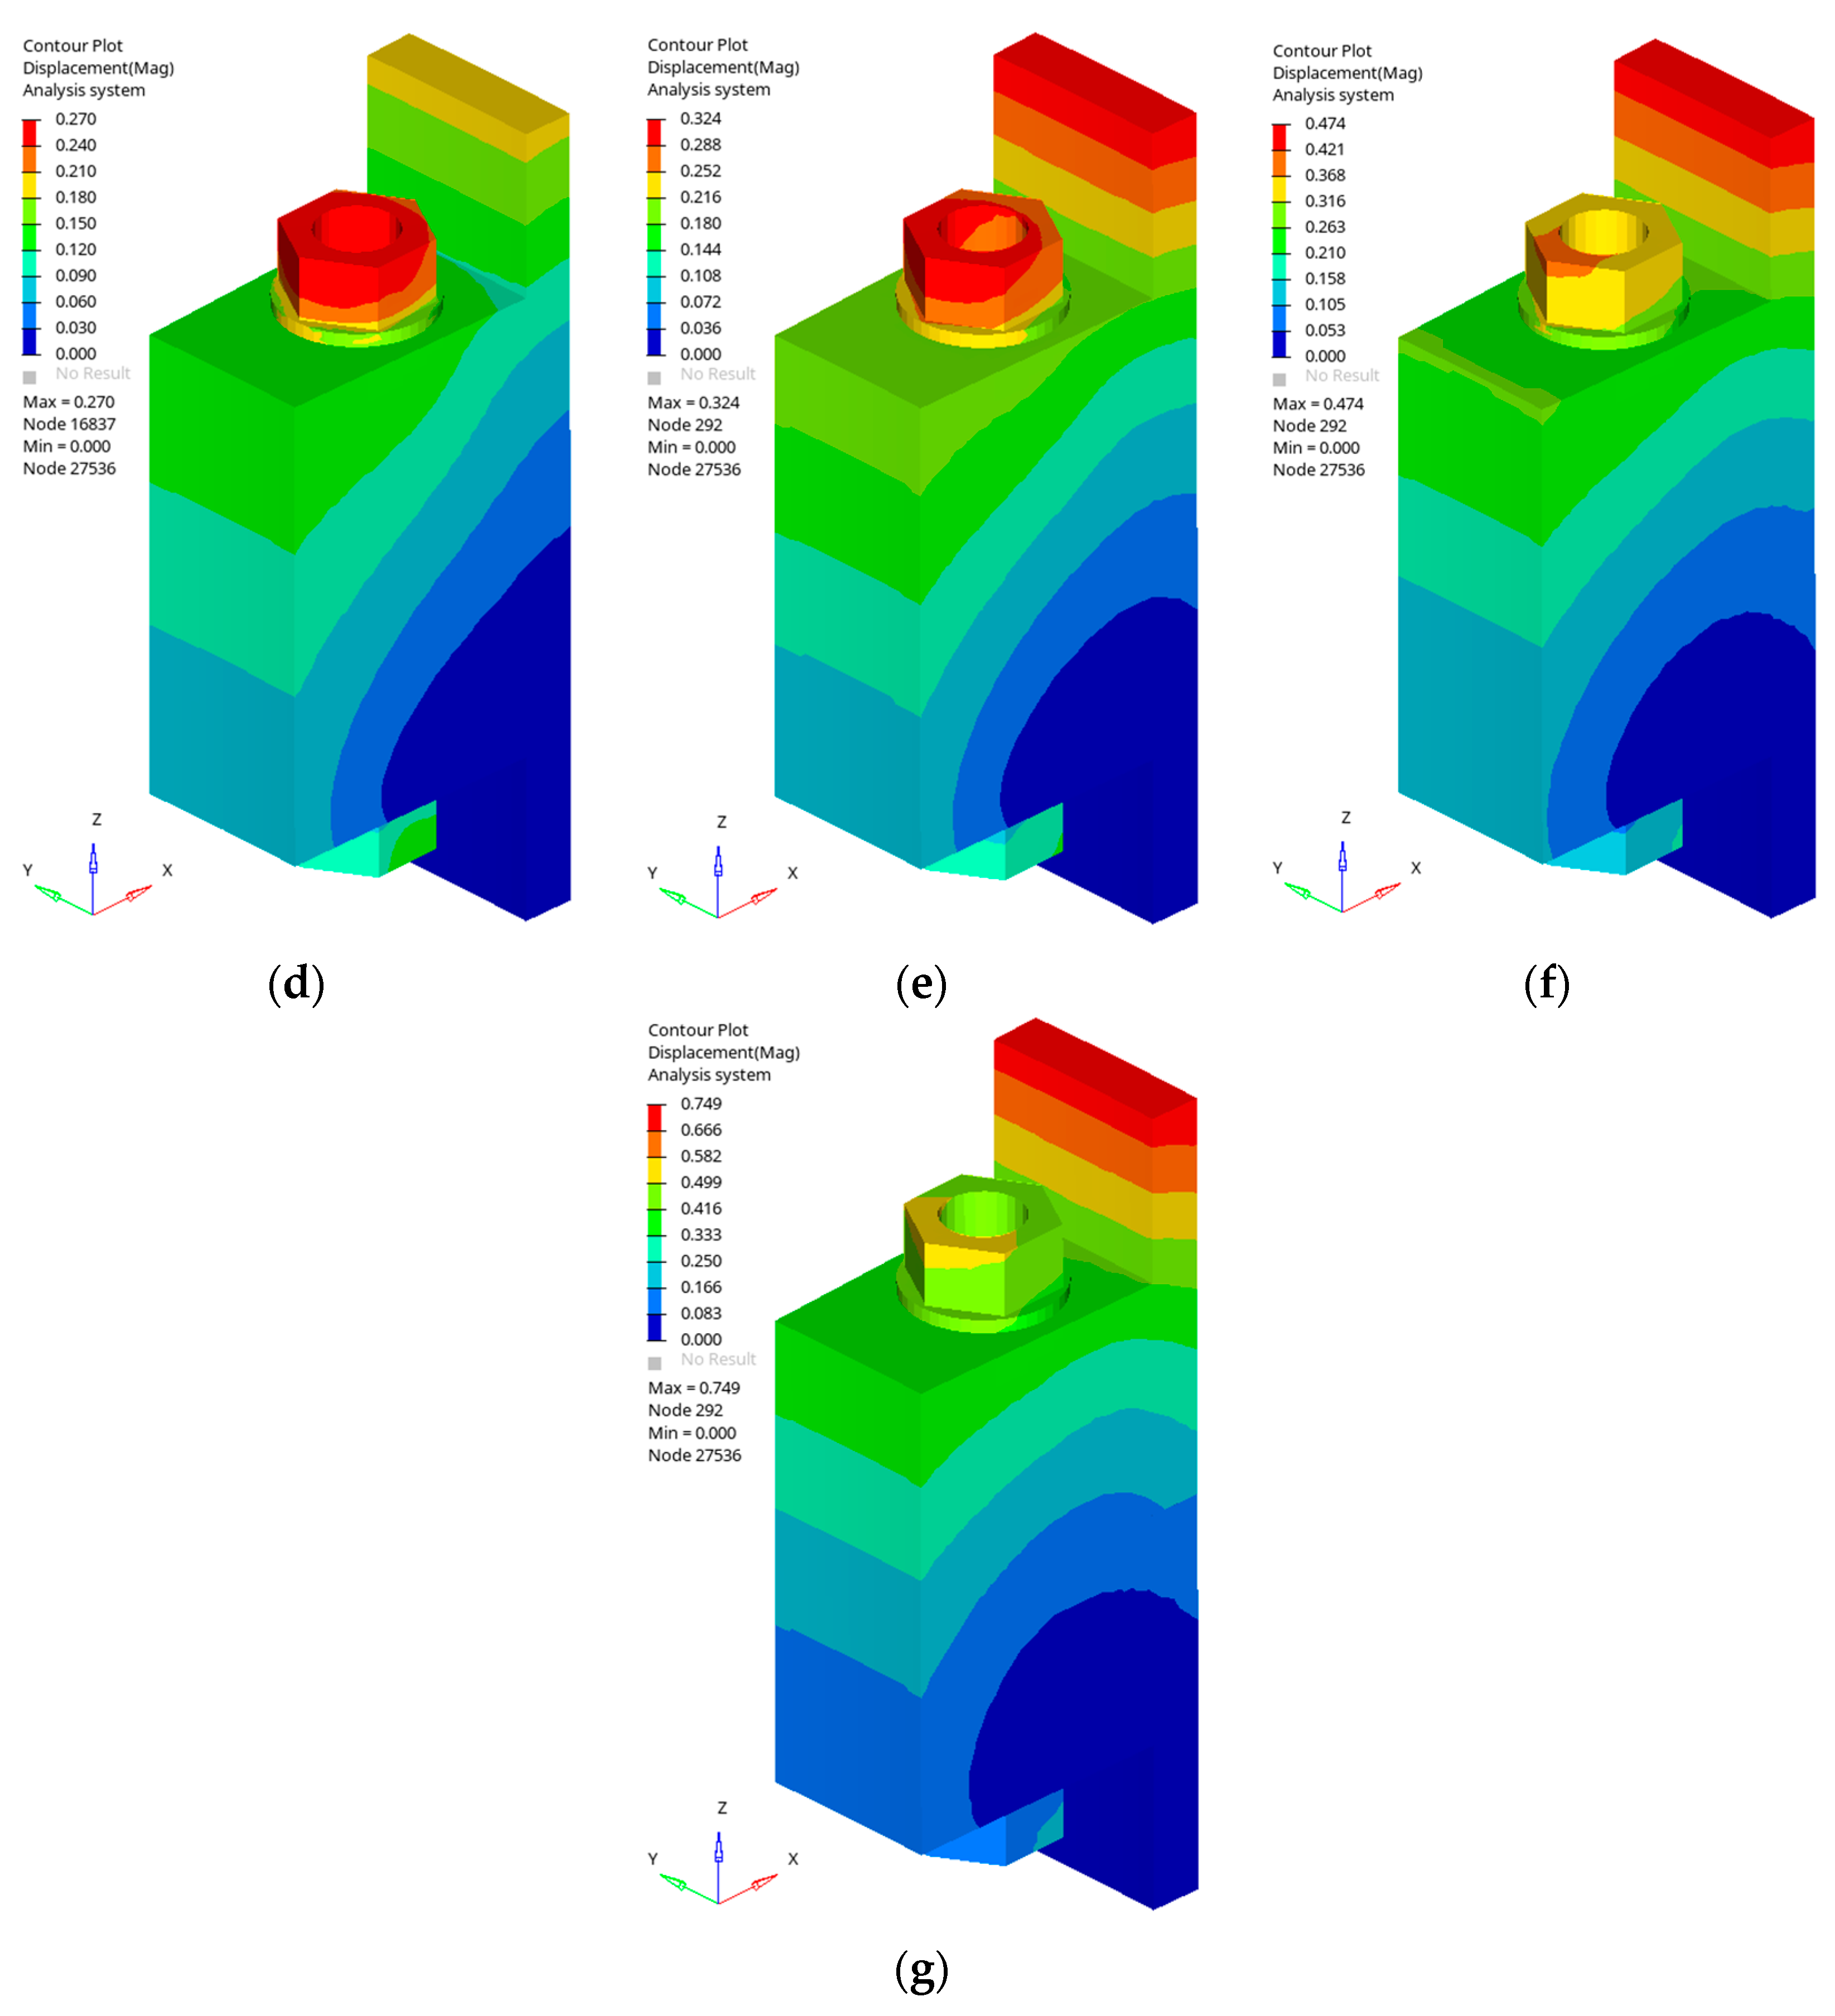
3.1. FE Modeling

As stated in the GL2010 standard, “Calculations with the aid of the finite element method that do not consider flange gaps, as well as other calculation methods leading to comparable results, are not permissible [28]. Thus, it is worthwhile to explore the effect of flange gaps on bolt fatigue quantitatively. However, the authors are aware that the reported literature is rather limited. This section will consider the flange gaps mainly originating from transportation, installation, and service. The flange gaps are artificially classified into three categories. Flange gap type I appears at the inner edge of the flange, with an opening height of hI. Assuming that only the upper flange gap opens, it extends along the flange gap surface for a length of lI from the edge. Flange gap type II is opposite in direction to flange gap type I, with an opening height of hII and an extension length of lII, as shown specifically in Figure 10b. When the upper flange rotates along the circumferential direction with the intersection of the upper and lower flanges on one side as the axis of rotation, it can form a type III gap, as shown in Figure 10c, with an opening height of hIII.
Because the effect of the flange gaps on fatigue damage cannot be quantitatively evaluated in the Schmidt–Neuper algorithm, the FE analysis using the commercial software ANSYS 19.2TM is performed. For one segment of the flange system, all components, including the flange, washer, and nut head, are discretized using hexahedral elements as plotted in Figure 11. Two nonlinear contact pairs are established between flange and washers, while one contact pair exists between the flange surfaces. The bolts and the pretension are simulated with beam elements and pretension elements. A group of umbrella-like rigid elements is adopted to imitate the connection of a bolt and nut head. In this study, geometric nonlinearity is ignored for the sake of simplification, which is extremely beneficial in terms of computing costs.
Firstly, the preferred flange with no gaps is analyzed on the FE model and Schmidt–Neuper algorithm, as drawn in Figure 12, aiming to compare the similarities and differences between the two approaches. The displacement contours corresponding to the FE analysis are illustrated in Figure 13.
Compared to the Schmidt–Neuper algorithm, the FE-derived bolt internal force curve is asymmetrical, as clearly demonstrated in Figure 12. Once the tower wall is pressed, the bolt force fluctuation can be negligible. Under the same external load, the bolt force is relatively minimal in the FE results. The universally adopted Schmidt–Neuper algorithm embodies the engineering relevance of conservative design, as can be concluded.
It is noticeable that the maximum flange displacement is consistently greater under positive tension compared to negative tension in Figure 13. At Z values of 400 kN and 600 kN, a fault line appears between the upper and lower flanges, indicating a clear separation between them.

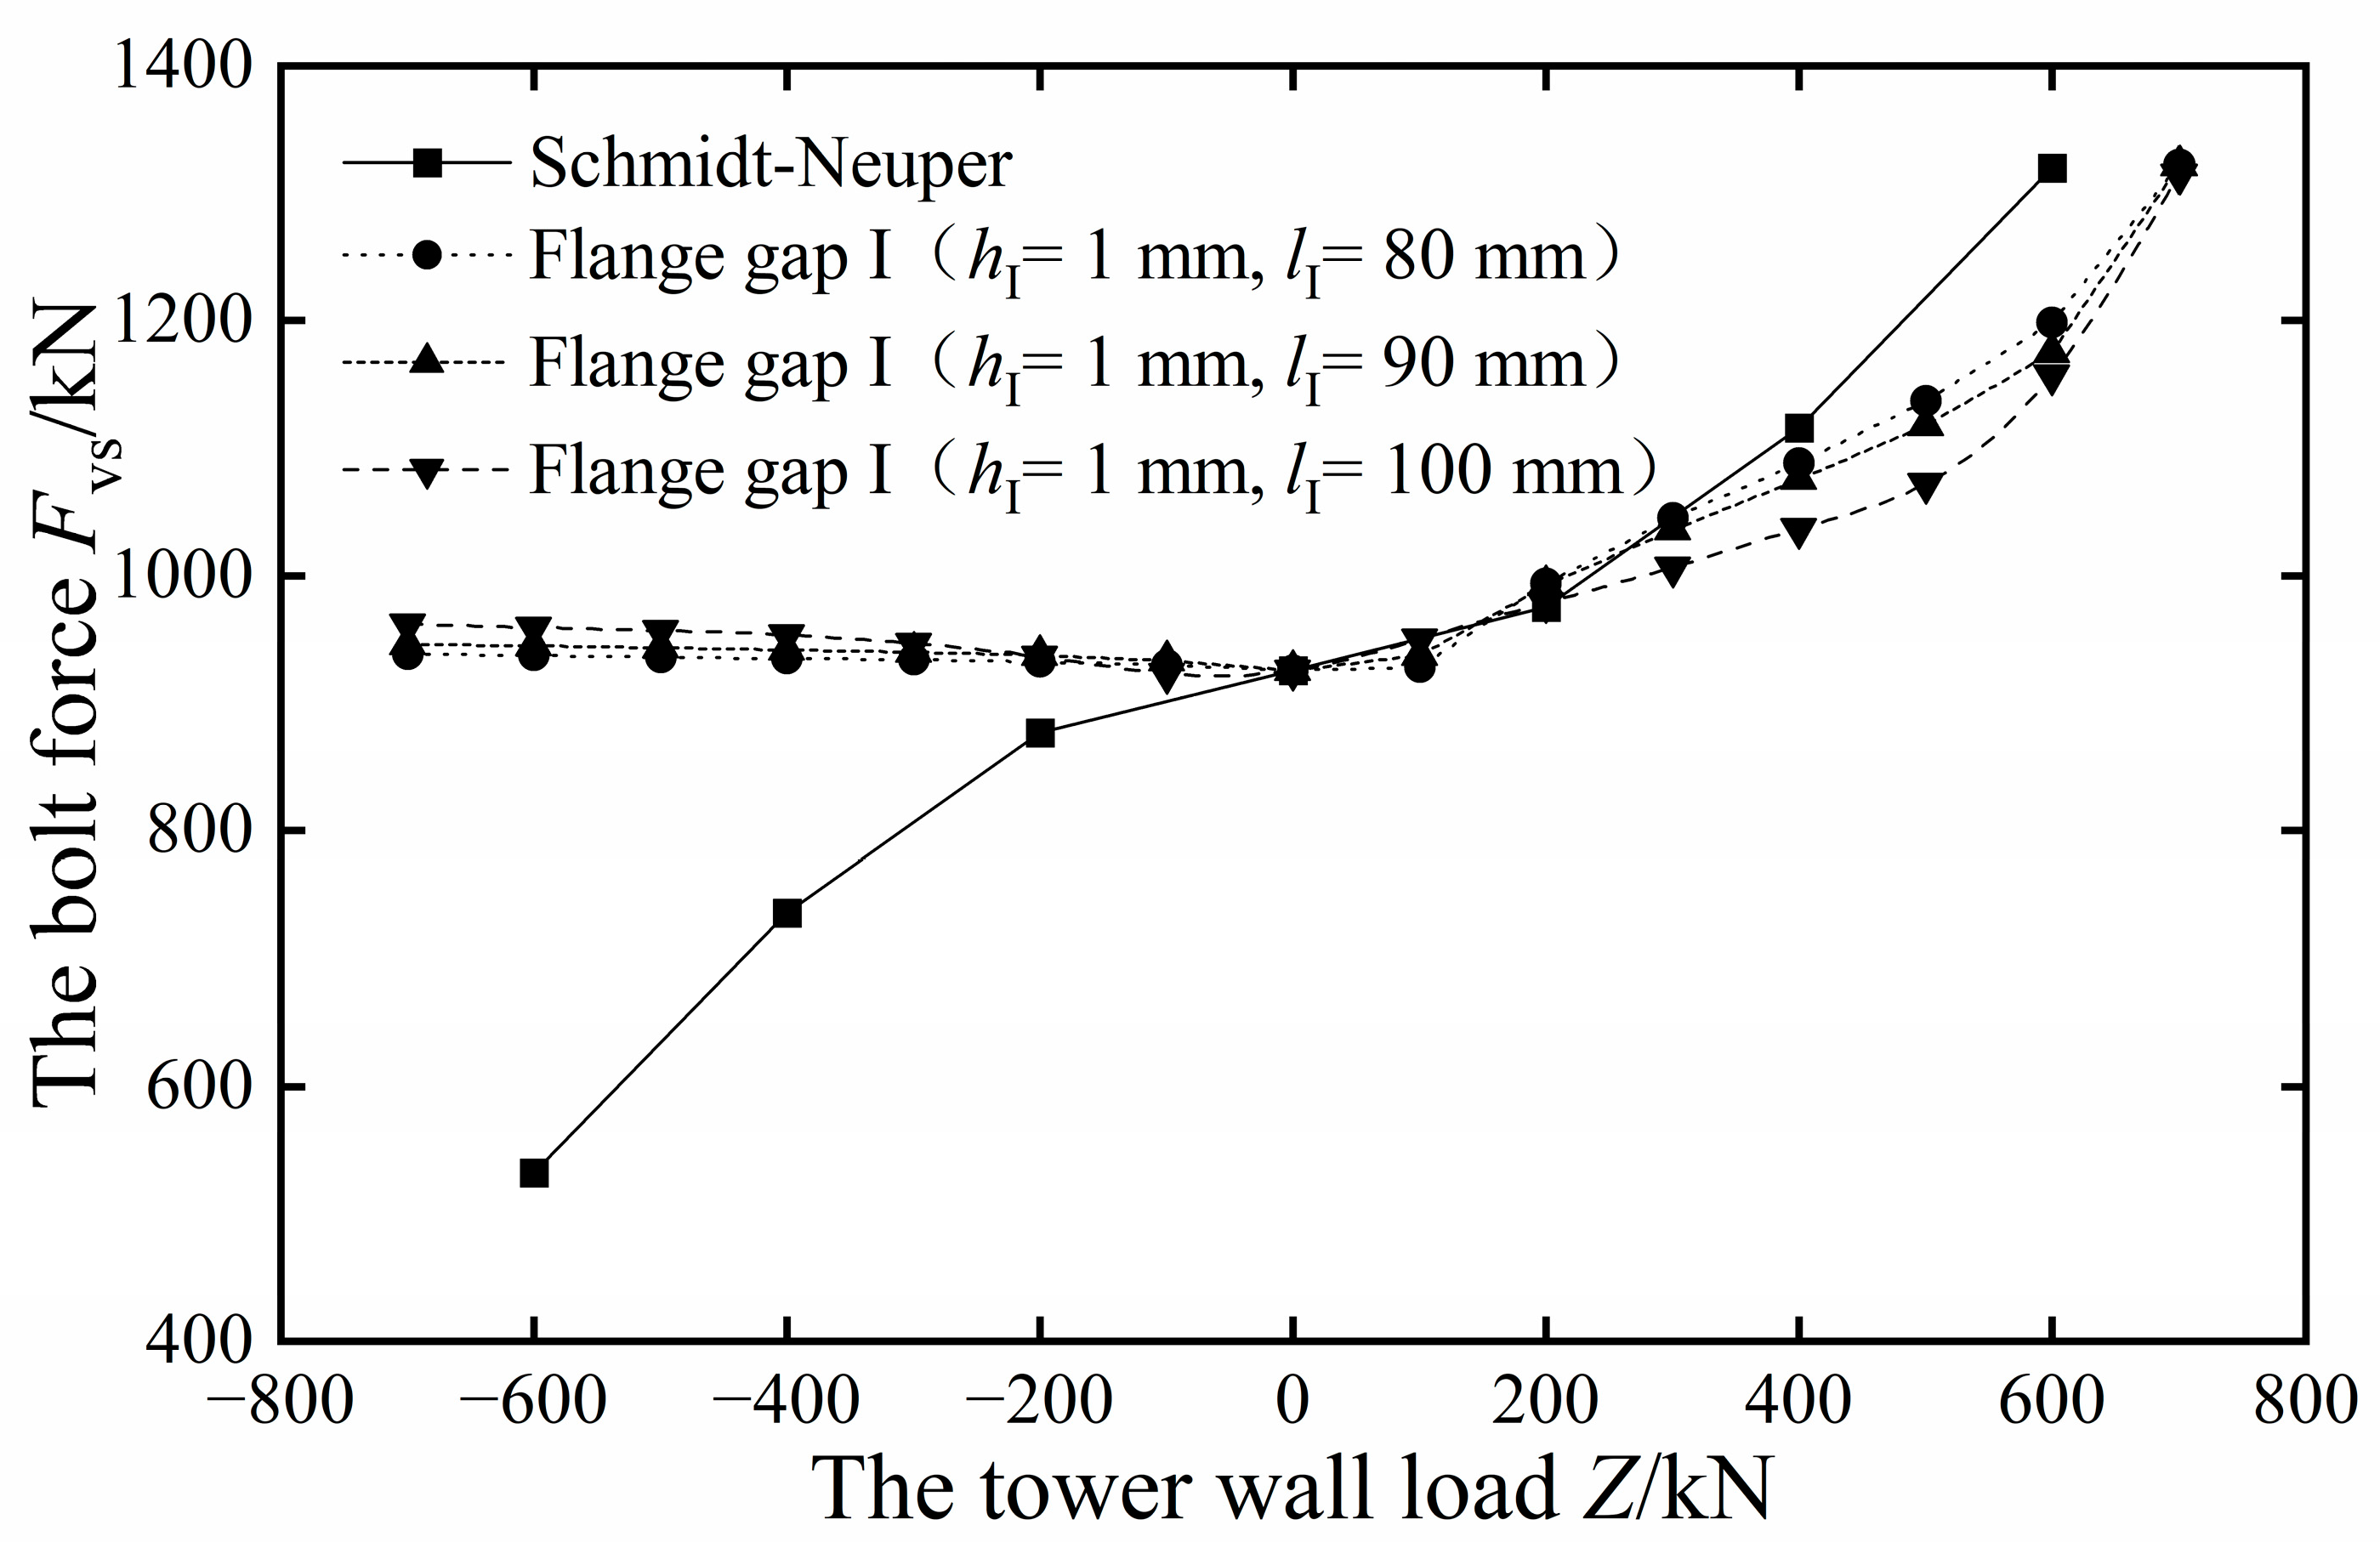
3.2. FE Analysis for the Flange Gap I

The influence of the flange gap I on bolt fatigue is also analyzed. Here, it is hypothesized that the opening height hI = 1 mm remains constant while the tower wall is subject to varying loads Z. The partial results reflecting the nonlinear relationship between Z and FVS are given in Table 1 and plotted in Figure 14.
As shown in Figure 14, when the flange is tensed, the bolt’s internal force decreases with increasing lI. When the flange is compressed, the curve representing the variation in bolt internal force stays flat due to the clearance compensating for deformation.
Secondly, the length along the flange gap lI is set as lI = 100 mm while changing hI. The partial results by varying tower wall loads Z are included in Table 2 and demonstrated in Figure 15.
As illustrated in Figure 15, a pattern similar to that seen in Figure 14 emerges when the parameter lI is fixed. This is due to the fact that an increased opening height results in greater gap at the bolt hole, exposing the flange to more adverse effects under tension; the compensating effect under compression causes the bolt forces to increase continuously in the opposite direction.

3.3. FE Analysis for the Flange Gap II

With the opening height of h = 1 mm, the fluctuation of external tension Z and internal force FVS with respect to various parameters lII is investigated. To facilitate comparison, Figure 16 depicts the results derived from the Schmidt–Neuper algorithm and FE approach, while Table 3 contains partial data.
As expected, the bolt force FVS is linearly related to the parameter lII under the given conditions, as illustrated in Figure 16. For gap type II, when h is minimal, and the extension length of gap does not surpass the position of the bolt hole, the bolt’s force exceeds the Schmidt–Neuper curve in the high-pressure region. Moreover, under equivalent tension, the bolt’s force escalates with the augmentation of lII.

3.4. FE Analysis for the Flange Gap III

Under such circumstances, partial numerical results by altering the parameter hIII are listed in Table 4. For comparison purposes, all results obtained from the Schmidt–Neuper algorithm and the FE method are plotted in Figure 17.
As observed from Figure 17, even with a considerable external tension Z, the nonlinear curves generated by the FE approach underestimate the bolt force FVS compared with those from the Schmidt–Neuper algorithm. It may be concluded that the bolt force is not seriously affected by the type III flange.
It is noteworthy to mention that the numerical values of Fvs at the same Z are smaller in comparison to type I and type II. This discrepancy indicates type I and II are more sensitive to the gap forms. This is predominantly attributable to the lever effect caused by bolt defects, resulting in larger deformations at the bolt location and generating significant stress.

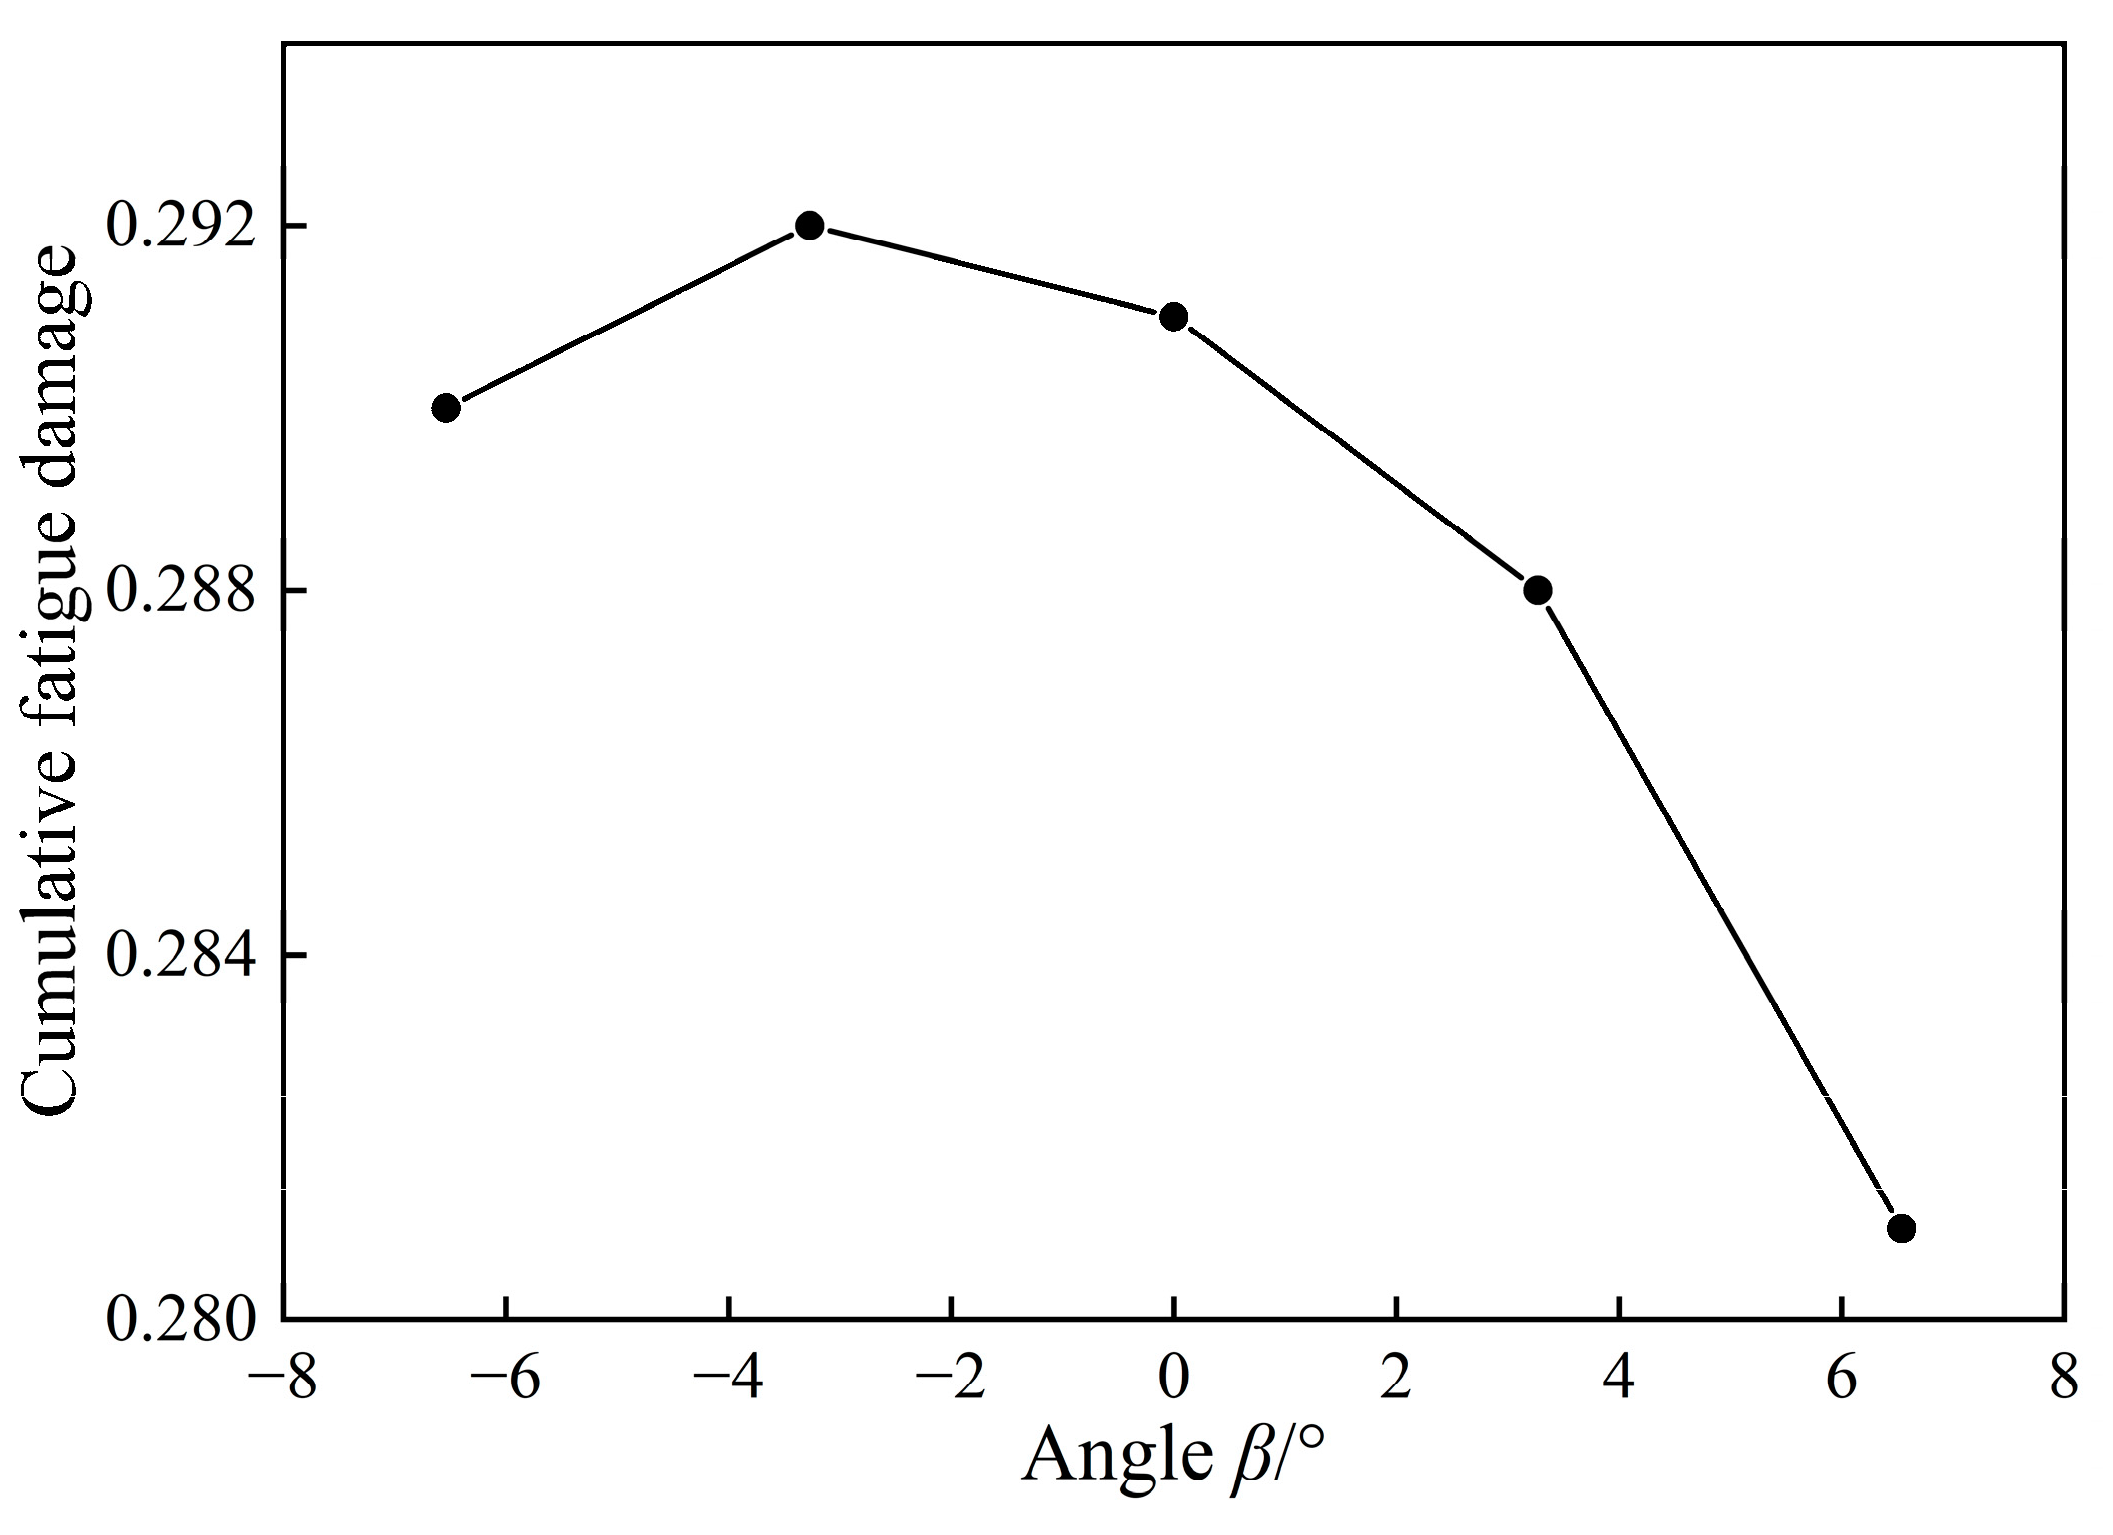
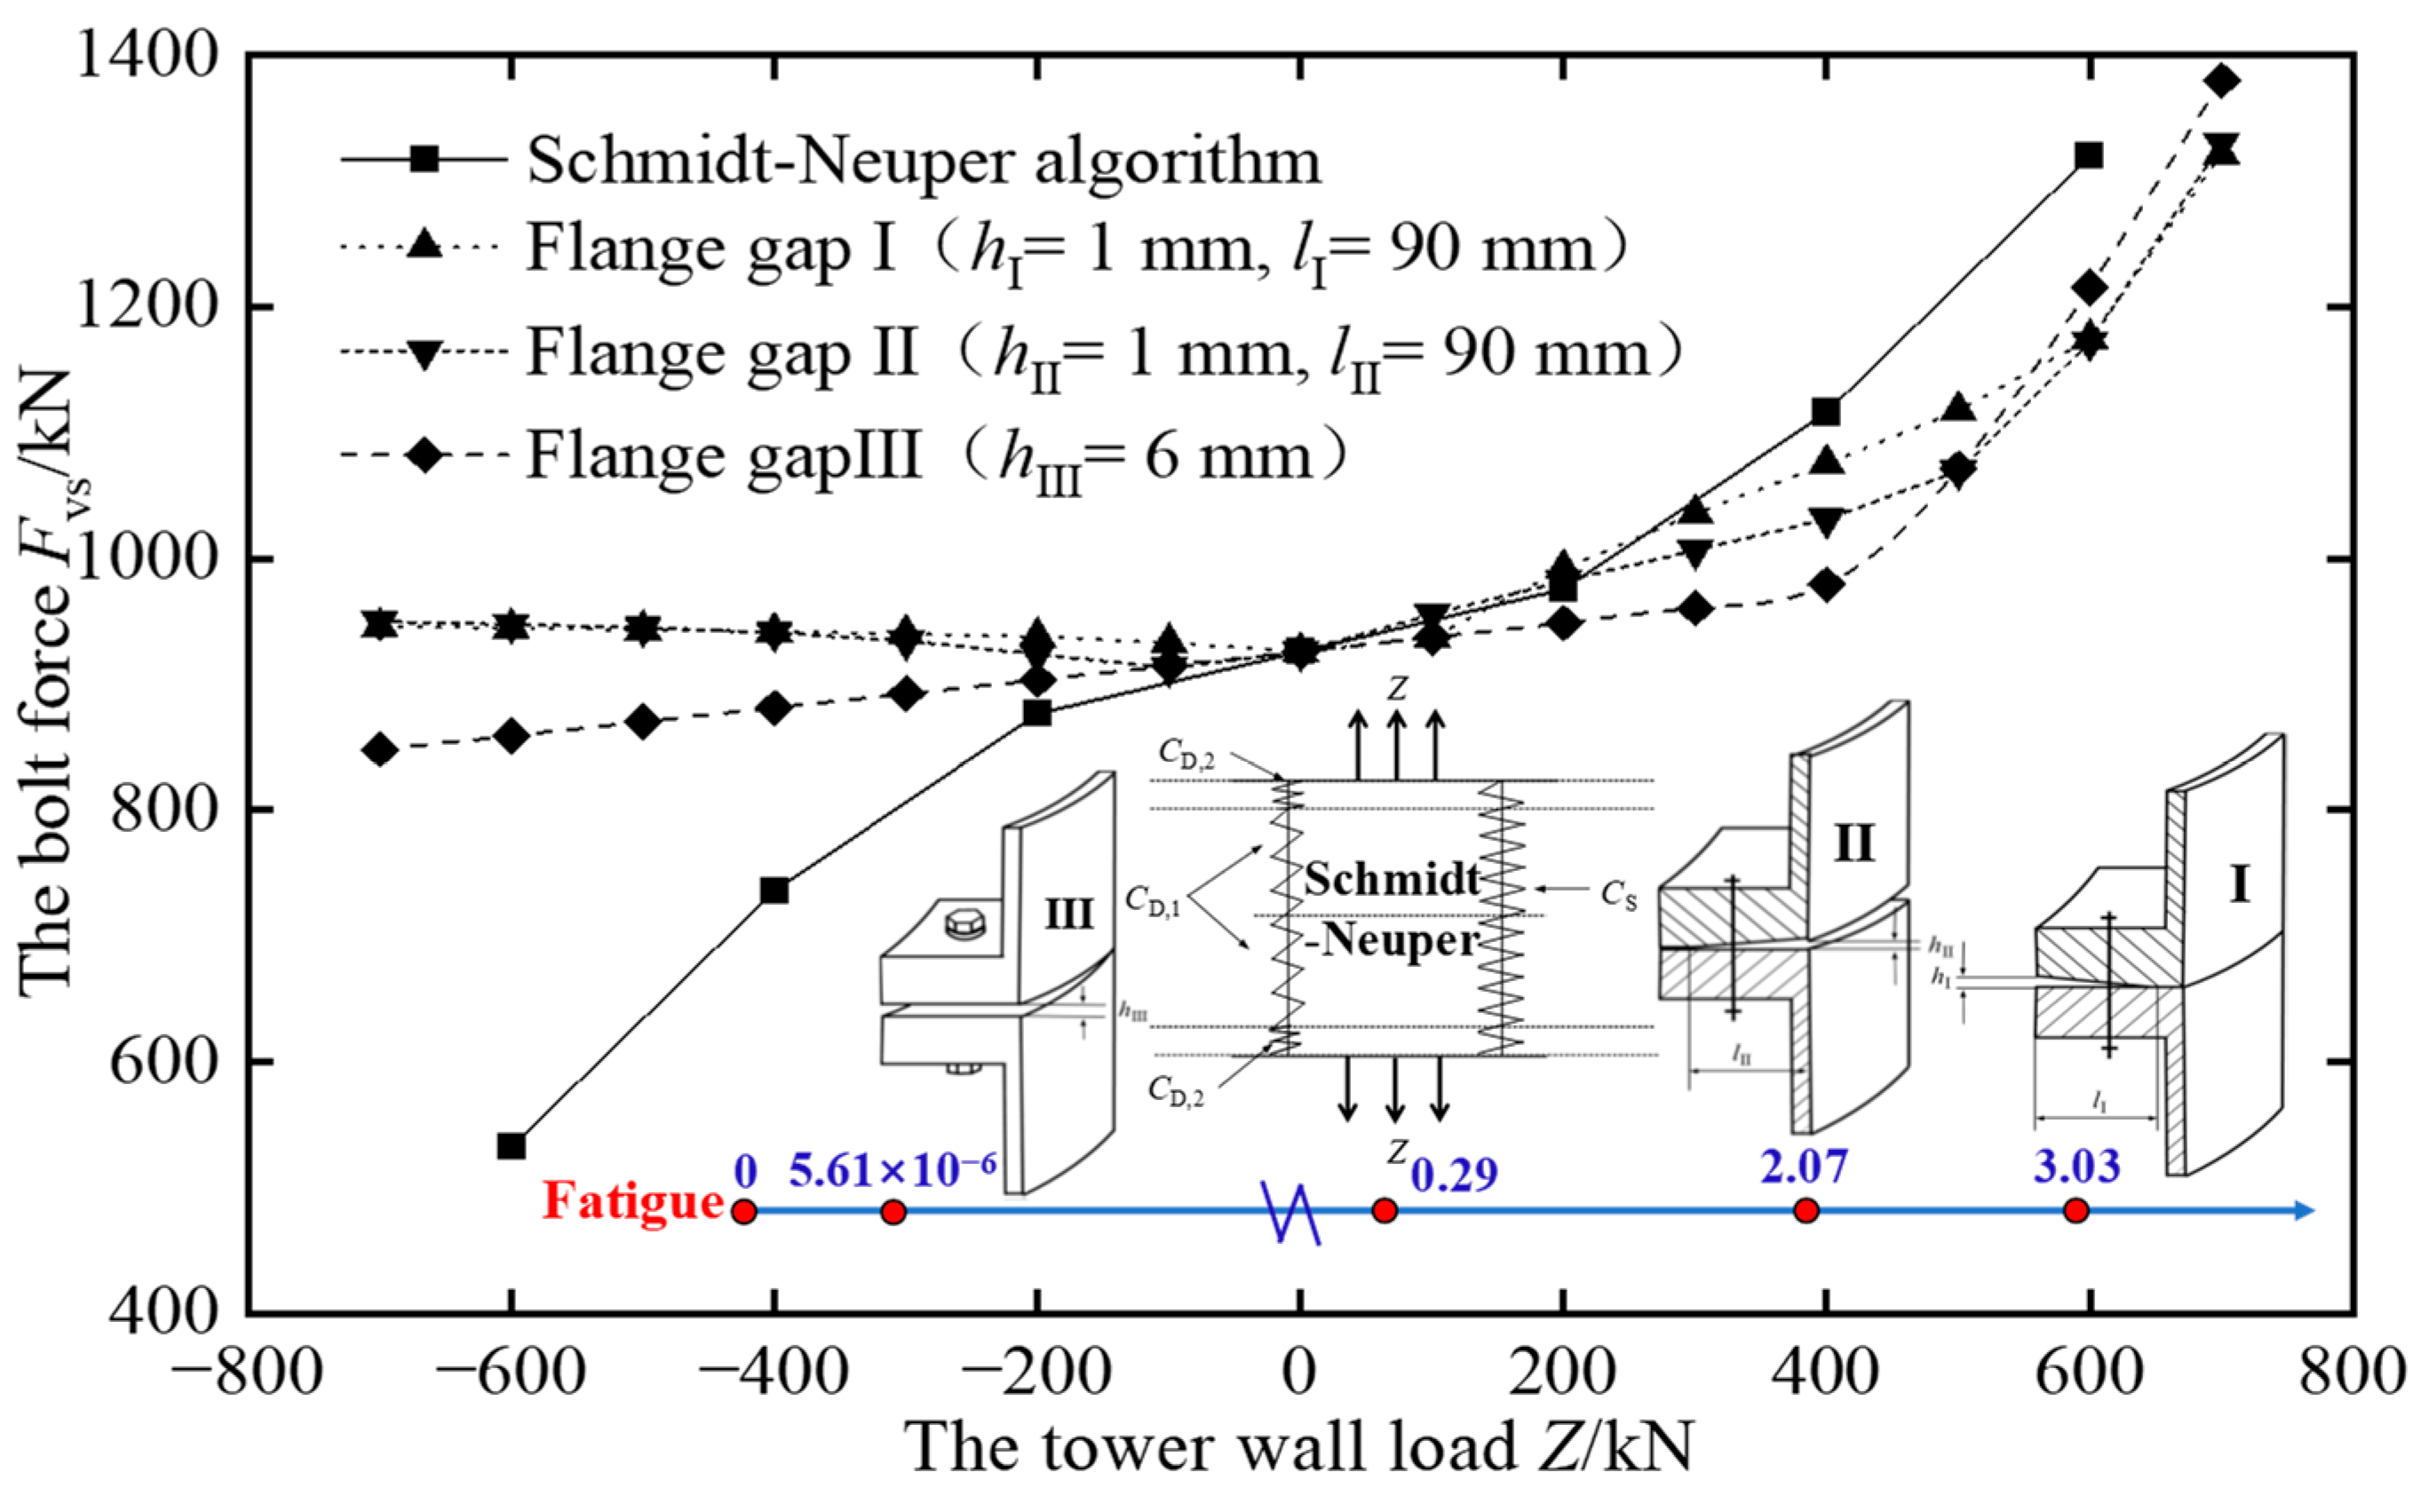
3.5. Comparisons of Cumulative Fatigue Damage Caused by Flange Gaps

This section quantifies the effect of various flange clearances on the cumulative fatigue damage of bolts. The bolts around 0 and 180 degrees are predominantly subject to pressure and tension; therefore, the latter are analyzed. The parameters of the three types of flange gaps, their corresponding computing method, and cumulative fatigue are summarized in Table 5 and plotted for clarity in Figure 18.
Due to the high sensitivity of fatigue to the stress range, as in Equation (13), the relationship between load cycles (N) and stress range (Δσ) follows a power law. As a consequence of this sensitivity of fatigue damage to stress variations, the fatigue damage magnitude varies considerably between gap types.
In summary, the following conclusions can be drawn from all results of this study:
(1)
The FE-derived nonlinear curve representing the bolt force relative to the tower wall is asymmetrical. The Schmidt–Neuper algorithm yields conservative structural design results for engineering applications;
(2)
The bolt fatigue damage is significantly affected by flange clearance of types I and II but is insensitive to type III. Throughout the manufacturing, processing, and installation of tower flanges, it is imperative to minimize the occurrence of type I and type II structures.

4. Conclusions

To quantify the effects of various flange gaps on bolt fatigue, an FE model integrating pretension forces and contact nonlinearity is herein proposed. The model takes full consideration of many nonlinear factors such as the contact between flanges, the contact between flanges and gaskets, and the pretightening force of bolts. Three kinds of flange gaps are manually defined, and the influence of gap opening height and gap extension length on the internal force of bolts is investigated. In comparison, it can be concluded that the widely adopted Schmidt–Neuper algorithm is appropriate for conservative design. According to the FE results, the curves of external tension and internal force of the bolt were inconsistent on both sides of tension and compression. The results indicate that bolt fatigue damage is highly reliant on the type of flange gap. For the specified gap and parameters, the corresponding fatigue damage can be even beyond that calculated from the Schmidt–Neuper algorithm. In future work, the proposed FE approach will be extended to include combinations of various types of gaps.

Author Contributions

Conceptualization, M.L. and K.L.; methodology, R.G.; software, J.W.; validation, W.D., M.L. and J.W.; formal analysis, Y.Z.; investigation, K.L.; resources, K.L.; data curation, M.L.; writing—original draft preparation, M.L.; writing—review and editing, M.L. and R.G.; visualization, Y.L.; supervision, K.L.; project administration, Y.Z.; funding acquisition, K.L. All authors have read and agreed to the published version of the manuscript.

Funding

This research and the APC were funded by Huaneng Clean Energy Research Institute grant number HNKJ20-H54.

Data Availability Statement

All data have been included in details in the article.

Acknowledgments

This work was financially supported by the Huaneng Clean Energy Research (HNKJ20-H54).

Conflicts of Interest

Authors Mingxing Liu, Jiaqing Wang and Yong Li were employed by the company Datang Boiler and Pressure Vessel Inspection Center Co., Ltd. Authors Mingxing Liu, Jiaqing Wang and Yong Li were employed by the company China Datang Corporation Science and Technology Research Institute Co., Ltd. Author Yiming Zhou is employed by the company Huaneng Clean Energy Research Institute. The remaining authors declare that the research was conducted in the absence of any commercial or financial relationships that could be construed as a potential conflict of interest.

References

  1. Liao, R.; Sun, Y.; Liu, J.; Zhang, W. Applicability of damage models for failure analysis of threaded bolts. Eng. Fract. Mech. 2011, 78, 514–524. [Google Scholar] [CrossRef]
  2. Liao, R.; Sun, Y.; Zhang, W. Nonlinear analysis of axial-load and stress distribution for threaded connection. Chin. J. Mech. Eng. 2009, 22, 869–875. [Google Scholar] [CrossRef]
  3. Yan, Y.; Wen, W.D.; Chang, F.K.; Shyprykevich, P. Experimental study on clamping effects on the tensile strength of composite plates with a bolt-filled hole. Compos. Part A 1999, 30, 1215–1229. [Google Scholar] [CrossRef]
  4. Leon, F.M.; Pai, N.G.; Hess, D.P. The effect of thread dimensional conformance on yield and tensile strength. Eng. Fail. Anal. 2001, 8, 49–56. [Google Scholar] [CrossRef]
  5. Majzoobi, G.H.; Farrahi, G.H.; Habibi, N. Experimental evaluation of the effect of thread pitch on fatigue life of bolts. Int. J. Fatigue 2005, 27, 189–196. [Google Scholar] [CrossRef]
  6. Xiao, Y. Bearing deformation behavior of Carbon/Bismaleimide composites containing one and two bolted joint. J. Reinf. Plast. Compos. 2003, 22, 169–182. [Google Scholar] [CrossRef]
  7. Girard, C.; Dano, M.L.; Picard, A.; Gendron, G. Bearing behavior of mechanically fastened joints in composite laminates—Part I: Strength and local strains. Mech. Adv. Mater. Struct. 2003, 10, 1–21. [Google Scholar] [CrossRef]
  8. Schmidt, H. Steel Structures—Part 4: Stability—Safety Against Buckling of Shells; J.F. Jullien: London, UK, 1991; pp. 265–269. [Google Scholar]
  9. Code, P. Eurocode 3: Design of Steel Structures-Part 1–2: General Rules-Structural Fire Design; European Committee for Standardisation: London, UK, 1993. [Google Scholar]
  10. Woebbeking, M. GL 2010, Guideline for the Certification of Wind Turbines. 2010. Reference Number GL 2010(E). Available online: https://wordpressstorageaccount.blob.core.windows.net/wp-media/wp-content/uploads/sites/649/2018/05/Session_3_-_Handout_3_-_GL_Guideline_for_the_Certification_of_Wind_Turbines.pdf (accessed on 21 April 2024).
  11. DIN 4133: 1991-11; Steel Stacks. German Institute for Standardisation (Deutsches Institut für Normung): Berlin, Germany, 2007.
  12. VDI 2230 Blatt 1: 2015-11; Systematic Calculation of High Duty Bolted Joints—Joints with One Cylindrical Bolt. Beuth: Berlin, Germany, 1984.
  13. Liu, F.; Yao, W.; Zhao, L.; Wu, H.; Zhang, X.; Zhang, J. An improved 2D finite element model for bolt load distribution analysis of composite multi-bolt single single-lap joints. Compos. Struct. 2020, 253, 112770. [Google Scholar] [CrossRef]
  14. Alonso-Martinez, M.; Adam, J.M.; Alvarez-Rabanal, F.P.; del Coz Díaz, J.J. Wind turbine tower collapse due to flange failure: FEM and DOE analyses. Eng. Fail. Anal. 2019, 104, 932–949. [Google Scholar] [CrossRef]
  15. Ajaei, B.B.; Soyoz, S. Effects of preload deficiency on fatigue demands of wind turbine tower bolts. J. Constr. Steel Res. 2020, 166, 105933. [Google Scholar] [CrossRef]
  16. Fu, B.; Zhao, J.; Li, B.; Yao, J.; Teifouet, A.R.M.; Sun, L.; Wang, Z. Fatigue reliability analysis of wind turbine tower under random wind load. Struct. Saf. 2020, 87, 101982. [Google Scholar] [CrossRef]
  17. Sharos, P.A.; Mccarthy, C.T. Novel finite element for near real-time design decisions in multi-fastener composite bolted joints under various loading rates. Compos. Struct. 2020, 240, 112005. [Google Scholar] [CrossRef]
  18. Seidel, M.; Stang, A.; Wegener, F.; Schierl, C.; Schaumann, P. Full-Scale Validation of FE Models for Geometrically Imperfect Flange Connections. J. Constr. Steel Res. 2021, 187, 106955. [Google Scholar] [CrossRef]
  19. Weijtjens, W.; Stang, A.; Devriendt, C.; Schaumann, P. Bolted Ring Flanges in Offshore-Wind Support Structures—In-Situ Validation of Load-Transfer Behaviour. J. Constr. Steel Res. 2021, 176, 106361. [Google Scholar] [CrossRef]
  20. Cheng, L.; Yang, F.; Seidel, M.; Veljkovic, M. FE-Assisted Investigation for Mechanical Behaviour of Connections in Offshore Wind Turbine Towers. Eng. Struct. 2023, 285, 116039. [Google Scholar] [CrossRef]
  21. Belardi, V.G.; Fanelli, P.; Vivio, F. Comparative analysis of FE modeling techniques for single-lap multi-column composite bolted joints. Int. Conf. Chem. Sci. Eng. 2021, 21, 121–128. [Google Scholar]
  22. Tao, T.; Yang, Y.; Yang, T.; Liu, S.; Guo, X.; Wang, H.; Liu, Z.; Chen, W.; Liang, C.; Long, K.; et al. Time-domain fatigue damage assessment for wind turbine tower bolts under yaw optimization control at offshore wind farm. Ocean Eng. 2024, 303, 117706. [Google Scholar] [CrossRef]
  23. Zheng, T.; Chen, N.Z. Time-domain fatigue assessment for blade root bolts of floating offshore wind turbine (FOWT). Ocean Eng. 2022, 262, 112201. [Google Scholar] [CrossRef]
  24. DeCastro, M.; Salvador, S.; Gómez-Gesteira, M.; Costoya, X.; Carvalho, D.; Sanz-Larruga, F.J.; Gimeno, L. Europe, China and the United States: Three different approaches to the development of offshore wind energy. Renew. Sustain. Energy Rev. 2019, 109, 55–70. [Google Scholar] [CrossRef]
  25. Wang, L.; Kolios, A.; Liu, X.; Venetsanos, D.; Cai, R. Reliability of offshore wind turbine support structures: A state-of-the art review. Renew. Sustain. Energy Rev. 2022, 161, 112250. [Google Scholar] [CrossRef]
  26. Chou, J.S.; Ou, Y.C.; Lin, Y.K. Collapse mechanism and risk management of wind turbine tower in strong wind. J. Wind. Eng. Ind. Aerodyn. 2019, 193, 103962. [Google Scholar] [CrossRef]
  27. Ma, Y.; Martinea-Vazquez, P.; Baniotopoulos, C.C. Wind Turbine Tower Collapse Cases: A Historical Overview. Proc. Inst. Civ. Eng. Struct. Build. 2019, 172, 547–555. [Google Scholar] [CrossRef]
  28. Chou, J.S.; Tu, W.T. Failure analysis and risk management of a collapse large wind turbine tower. Eng. Fail. Anal. 2011, 18, 295–313. [Google Scholar] [CrossRef]
  29. Mehmanparast, A.; Lotfian, S.; Vipin, S.P. A review of challenges and opportunities associated with bolted flange connections in the offshore wind industry. Metals 2020, 10, 732. [Google Scholar] [CrossRef]
  30. Seidel, M. Tolerance requirements for flange connections in wind turbine support structures. Stahlbau 2018, 87, 880–887. [Google Scholar] [CrossRef]
  31. Feldmann, M.; Naumes, J.; Pak, D. On the load-deformation behaviour of bolts in preloaded ring flange connections with gaps with regard to fatigue prediction. Stahlbau 2011, 80, 21–29. [Google Scholar] [CrossRef]
  32. DNV-OS-J101; Design of Offshore Wind Turbine Structures. DNV: Oslo, Norway, 2013.
  33. Sun, Q.; Dui, H.N.; Fan, X.L. A statistically consistent fatigue damage model based on Miner’s rule. Int. J. Fatigue 2014, 69, 16–21. [Google Scholar] [CrossRef]
Figure 1. The whole flange and its one segment.
Applsci 14 03670 g001
Figure 2. The spring model to simulate the flange system.
Applsci 14 03670 g002
Figure 3. Illustration of the flange geometry parameter.
Applsci 14 03670 g003
Figure 4. The illustration of the angle β.
Applsci 14 03670 g004
Figure 5. S–N curve for tower bolt.
Applsci 14 03670 g005
Figure 6. Various time-varying loads for a typical fatigue load case: (a) Fx; (b) Fy; (c) Fz; (d) Mx; (e) My; (f) Mz.
Applsci 14 03670 g006aApplsci 14 03670 g006b
Figure 7. Nonlinear relationship between wall tension Z and bolt stress σ.
Applsci 14 03670 g007
Figure 8. Distribution of bolt damage accumulation over 20 years.
Applsci 14 03670 g008
Figure 9. Distribution of bolt fatigue damage near 0°.
Applsci 14 03670 g009
Figure 10. Three types of the flange gap: (a) type I; (b) type II; (c) type III.
Applsci 14 03670 g010
Figure 11. Finite element of the flange system with an open gap.
Applsci 14 03670 g011
Figure 12. Nonlinear relationship between wall tension Z and bolt force FVS.
Applsci 14 03670 g012
Figure 13. Flange displacement contours under different wall tensions Z: (a) Z = −600 kN; (b) Z = −400 kN; (c) Z = −200 kN; (d) Z = 0 kN; (e) Z = 200 kN; (f) Z = 400 kN; (g) Z = 600 kN.
Applsci 14 03670 g013aApplsci 14 03670 g013b
Figure 14. The nonlinear relationship between Z and FVS for flange gap I.
Applsci 14 03670 g014
Figure 15. The nonlinear relationship between Z and FVS for flange gap I.
Applsci 14 03670 g015
Figure 16. The nonlinear relationship between Z and FVS for flange gap II.
Applsci 14 03670 g016
Figure 17. The nonlinear relationship between Z and FVS for flange gap III.
Applsci 14 03670 g017
Figure 18. The nonlinear relationship between Z and FVS and resultant cumulative fatigue damage under given conditions.
Applsci 14 03670 g018
Table 1. Results of external load and internal force FVS for bolts (unit: kN).
Tower Wall Load ZFVS (lI = 80 mm)FVS (lI = 90 mm) FVS (lI = 100 mm)
−600937.1944.7959.3
−400935.0941.9953.4
−200932.7937.9937.0
0926.1926.1926.1
200993.8992.1979.1
4001087.91075.31036.9
6001198.91174.91157.7
Table 2. The bolt force FVS by varying the tower wall load Z (unit: kN).
Tower Wall Load ZFVS (hI = 0.5 mm)FVS (hI = 1.0 mm)FVS (hI = 2.0 mm)
−600918.6959.31022.3
−400917.8953.41014.0
−200917.6937.0990.2
0926.1926.1926.1
200952.7979.1996.4
400995.81036.91058.9
6001153.21157.71153.3
Table 3. The bolt force FVS by varying the tower wall load Z (unit: kN).
Tower Wall Load ZFVS (lII = 80 mm)FVS (lII = 90 mm)FVS (lII = 100 mm)
−600962.8947.6942.4
−400945.8941.3939.0
−200908.7924.0933.7
0926.1926.1926.1
200963.6982.31005.9
4001001.51031.41069.4
6001161.51172.41187.1
Table 4. The bolt force FVS by varying the tower wall load Z (unit: kN).
Tower Wall Load ZFVS (hIII = 2 mm)FVS (hIII = 6 mm)
−600910.1859.2
−400914.6881.4
−200919.1903.6
0926.1926.1
200934.8948.8
400963.6979.2
6001160.4 1215.6
Table 5. The results of cumulative fatigue damages derived from various cases.
Method DescriptionParameterCumulative Fatigue Damage
Schmidt–Neuper algorithm0.29
No gap using the FE approach5.61 × 10−6
Type I using the FE approachhI = 1 mm, lI = 90 mm3.03
Type II using the FE approachhII = 1 mm, lII = 90 mm2.07
Type III using the FE approachhIII = 6 mm3.82 × 10−2
Disclaimer/Publisher’s Note: The statements, opinions and data contained in all publications are solely those of the individual author(s) and contributor(s) and not of MDPI and/or the editor(s). MDPI and/or the editor(s) disclaim responsibility for any injury to people or property resulting from any ideas, methods, instructions or products referred to in the content.

