
Experimental Study on Energy Release Mechanism and Crack Propagation Evolution of Sandstone under True Triaxial Loading
1
State Key Laboratory of Water Resource Protection and Utilization in Coal Mining, Beijing 102209, China
2
National Institute of Clean-and-Low-Carbon Energy, Beijing 102211, China
3
College of Energy and Mining Engineering, Shandong University of Science and Technology, Qingdao 266590, China
*
Author to whom correspondence should be addressed.
Appl. Sci. 2024, 14(9), 3655; https://0-doi-org.brum.beds.ac.uk/10.3390/app14093655
Submission received: 31 March 2024
/
Revised: 22 April 2024
/
Accepted: 23 April 2024
/
Published: 25 April 2024
(This article belongs to the Special Issue Monitoring and Prevention of Dynamic Disasters in Deep Underground Engineering)
Abstract
:The instability of hard and brittle rock often leads to disastrous consequences in underground engineering. Under various surrounding rock pressure conditions, in situ stress induces corresponding deformation and damage to the floor post-mining. Therefore, it is crucial to examine the effects of mining under different confining pressures on rock disturbance, damage characteristics, and their distribution. Consequently, triaxial loading experiments under varying intermediate principal stress conditions were conducted on red sandstone specimens, using an acoustic emission monitoring system to track energy changes during rock damage and failure. This approach aids in studying crack generation, propagation, and fracture damage evolution. The results indicate that rock deformation results in axial compression and dilatancy, aligned with the direction of minimum and intermediate principal stresses. Ductility in rock failure becomes more pronounced with increased stress, primarily manifesting as shear failure. Internal cracks in the specimen lead to stress concentration and marked plastic deformation under compression, yet do not result in macroscopic surface cracks. The fracture angle θ of specimens post-failure generally exceeds 45° and varies with stress changes; at consistent burial depths, the angle of the sandstone failure surface increases with intermediate principal stress. This paper preliminarily establishes the informational linkage between rock failure and energy release, analyzing the rock samples over time and space. This research offers insights for analyzing and mitigating sudden rock instability.
1. Introduction
The failure mode of three-dimensional stress rock mass is a critical parameter for predicting the stability of geological structures, including rock slopes, dam foundations, deep tunnels, and roadways [1,2]. Deep mining causes intense readjustment of mining stress, leading to concentrated stress redistribution on the fault plane. Understanding the failure modes and energy evolution mechanisms in rock masses under high-stress conditions is crucial for reducing accident rates. Consequently, scholars, including Cai, have extensively researched the mechanical properties of deep rock masses based on triaxial compression tests [3]. Liu et al. explored how fillers impact the deformation characteristics, mechanical properties, and failure modes of rock masses [4]. Tang et al. [5] assessed how the loading rate affects the peak strength and post-failure resilience of rock masses under confining pressure, providing insights into the long-term deformation and stability of underground structures. Du et al. [6] found that confining pressure significantly influences the shear expansion of rock masses, noting that under low pressures, rock masses compress before expanding, whereas under high pressures, they predominantly undergo shear compression. Zhao et al. [7] performed triaxial compression tests on rock specimens at various temperatures and confining pressures, focusing on how these factors affect rock mechanics.
However, these theories and experiments rely on conventional triaxial stress (σ1 > σ2 = σ3) and do not accurately represent the actual three-dimensional stress state, neglecting the significant influence of intermediate principal stress σ2 on rock deformation and strength. Numerous in situ stress measurements demonstrate significant anisotropy in stress from shallow to mid-depth levels (σ1 > σ2 > σ3) [8,9,10,11]. The confirmed influence of σ2 on the compressive strength of jointed rock mass underscores the importance of conducting physical and mechanical property tests under true triaxial stress conditions. Since Mogi developed the first genuine rock triaxial testing machine in 1980 [12], researchers including Zhou et al. and Chen et al. have extensively studied marble [13,14], limestone, shale, sandstone, and granite using triaxial testing equipment [15]. Research indicates that the splitting or shear failure of marble is influenced by the intermediate and minimum principal stresses [16]. True triaxial experiments on gray sandstone specimens showed that adjusting the σ2/σ3 ratio can increase strength by 310%. Chang et al. [17] examined how intermediate principal stress affects crack morphology, stress–strain responses, and acoustic emission (AE) activity. They proposed a damage model that accounts for both micro- and macro-damages—micro-cracks and pre-existing defects, respectively—to elucidate the failure characteristics of rock specimens with a single defect under true triaxial compression. Building on the linear and Coulomb strength criteria for marble, Gao et al. [15] developed a refined true triaxial strength criterion that considers the effects of joint orientation and the intermediate and minimum principal stresses, establishing the relationship between failure mode, joint inclination, and intermediate principal stress.
During the coal mining process, changes in the three-dimensional stress within the rock mass can easily trigger disasters such as rock bursts, activation of floor structures, and water inrushes. Deep mining in high-stress environments more readily induces fault slips, leading to the formation and expansion of water-conducting fissures and subsequent water inrush channels at the working face, ultimately causing disasters. Stress redistribution at various mining depths differentially affects the crack propagation mode and failure deformation of the rock mass, as illustrated in Figure 1. However, the factors contributing to the formation of water inrush channels and the propagation modes of dominant cracks in the early stages remain unclear, with scant research on the initiation types and angles of these cracks. Li et al. [18] established the necessary confining pressure using the mechanical parameters of the actual in situ stress environment. By altering the σ2/σ3 ratio (keeping σ3 constant and changing σ2) and employing an acoustic emission monitoring system, they examined the deformation and failure characteristics and the energy evolution mechanisms of red sandstone under these in situ stress conditions.
2. Testing Conditions and Scheme
2.1. Sample Preparation
The samples used in this test are sourced from the same sandstone block, characterized by good homogeneity to minimize the impact of rock anisotropy on test outcomes. The sample dimensions are 100 mm × 100 mm × 100 mm cubes, with the end face flatness controlled to within 0.02 mm. Specimen surfaces must be polished to a smooth finish and free of any apparent joints or cracks. The actual triaxial sandstone specimens are prepared in strict compliance with the standards set by the International Society for Rock Mechanics. Figure 2 displays some of the prepared test samples.
2.2. Test Equipment
The test setup primarily comprises precise triaxial loading and acoustic emission monitoring systems. As depicted in Figure 3, during the test, time synchronization between the loading system and the acoustic emission monitoring system is maintained, facilitating the analysis of the relationship between stress, strain, energy changes in the specimen, and the initiation and propagation of cracks. The experimental setup utilizes an existing triaxial test system of rock stress-seepage coupling, which includes a three-dimensional loading framework, an axial loading subsystem, a lateral loading subsystem, a servo control system, and a data acquisition system [19].
The testing machine’s maximum axial load capacity is 1600 kN, with a maximum indenter stroke of 400 mm; laterally, σ2 can exert a force up to 1000 kN with a ram stroke of 400 mm, while σ3 can exert up to 500 kN, also with a ram stroke of 400 mm. The primary control mode of the testing machine is load control, with a loading rate ranging from 0.01 kN/s to 100 kN/s and a control accuracy of ±0.1%. Displacement control is also feasible, with the minimum loading rate set at 0.01 mm/s and the same control accuracy of ±0.1%.
A MISTRAS series PCI-2 acoustic emission monitoring and analysis system is used to collect acoustic emission event data during the precise triaxial loading of the sample. This system features high stability and accuracy in data monitoring and performs well even under complex background noise. It can instantly extract characteristic data parameters and process the waveform. The system’s threshold is set at 40 dB, with a floating threshold of 6 dB, and the position of the first break marks the starting point of the waveform.
2.3. Test Scheme
To investigate the deformation and failure behaviors of sandstone at different burial depths and assess the impact of intermediate principal stress on sandstone failure under actual triaxial stress conditions, triaxial compression tests were conducted on sandstone under varying confining pressures. The simulated depth gradients for this test were 600 m, 1000 m, and 1400 m. Based on initial in situ stress measurement results from various countries [20], an empirical formula for calculating the axial stress of deep sandstone specimens was derived.
σhmax = σ1 = 6.7 + 0.0444H
σhmin = σ2 = 0.8 + 0.0329H
σv = σ3 = 0.027H
The corresponding vertical stresses can be 16.2 MPa, 27 MPa, and 37.8 MPa, respectively. H represents the burial depth, with the unit being meters. According to the empirical formula, the ratio of vertical stress σV to the maximum stress σhmax and the minimum stress σhmin ranges from 1.2 to 2.0.
Therefore, set σ2/σ3 are 1.2, 1.4, 1.6, and 1.8, respectively. Each group has three test pieces. Specific values are shown in Table 1:
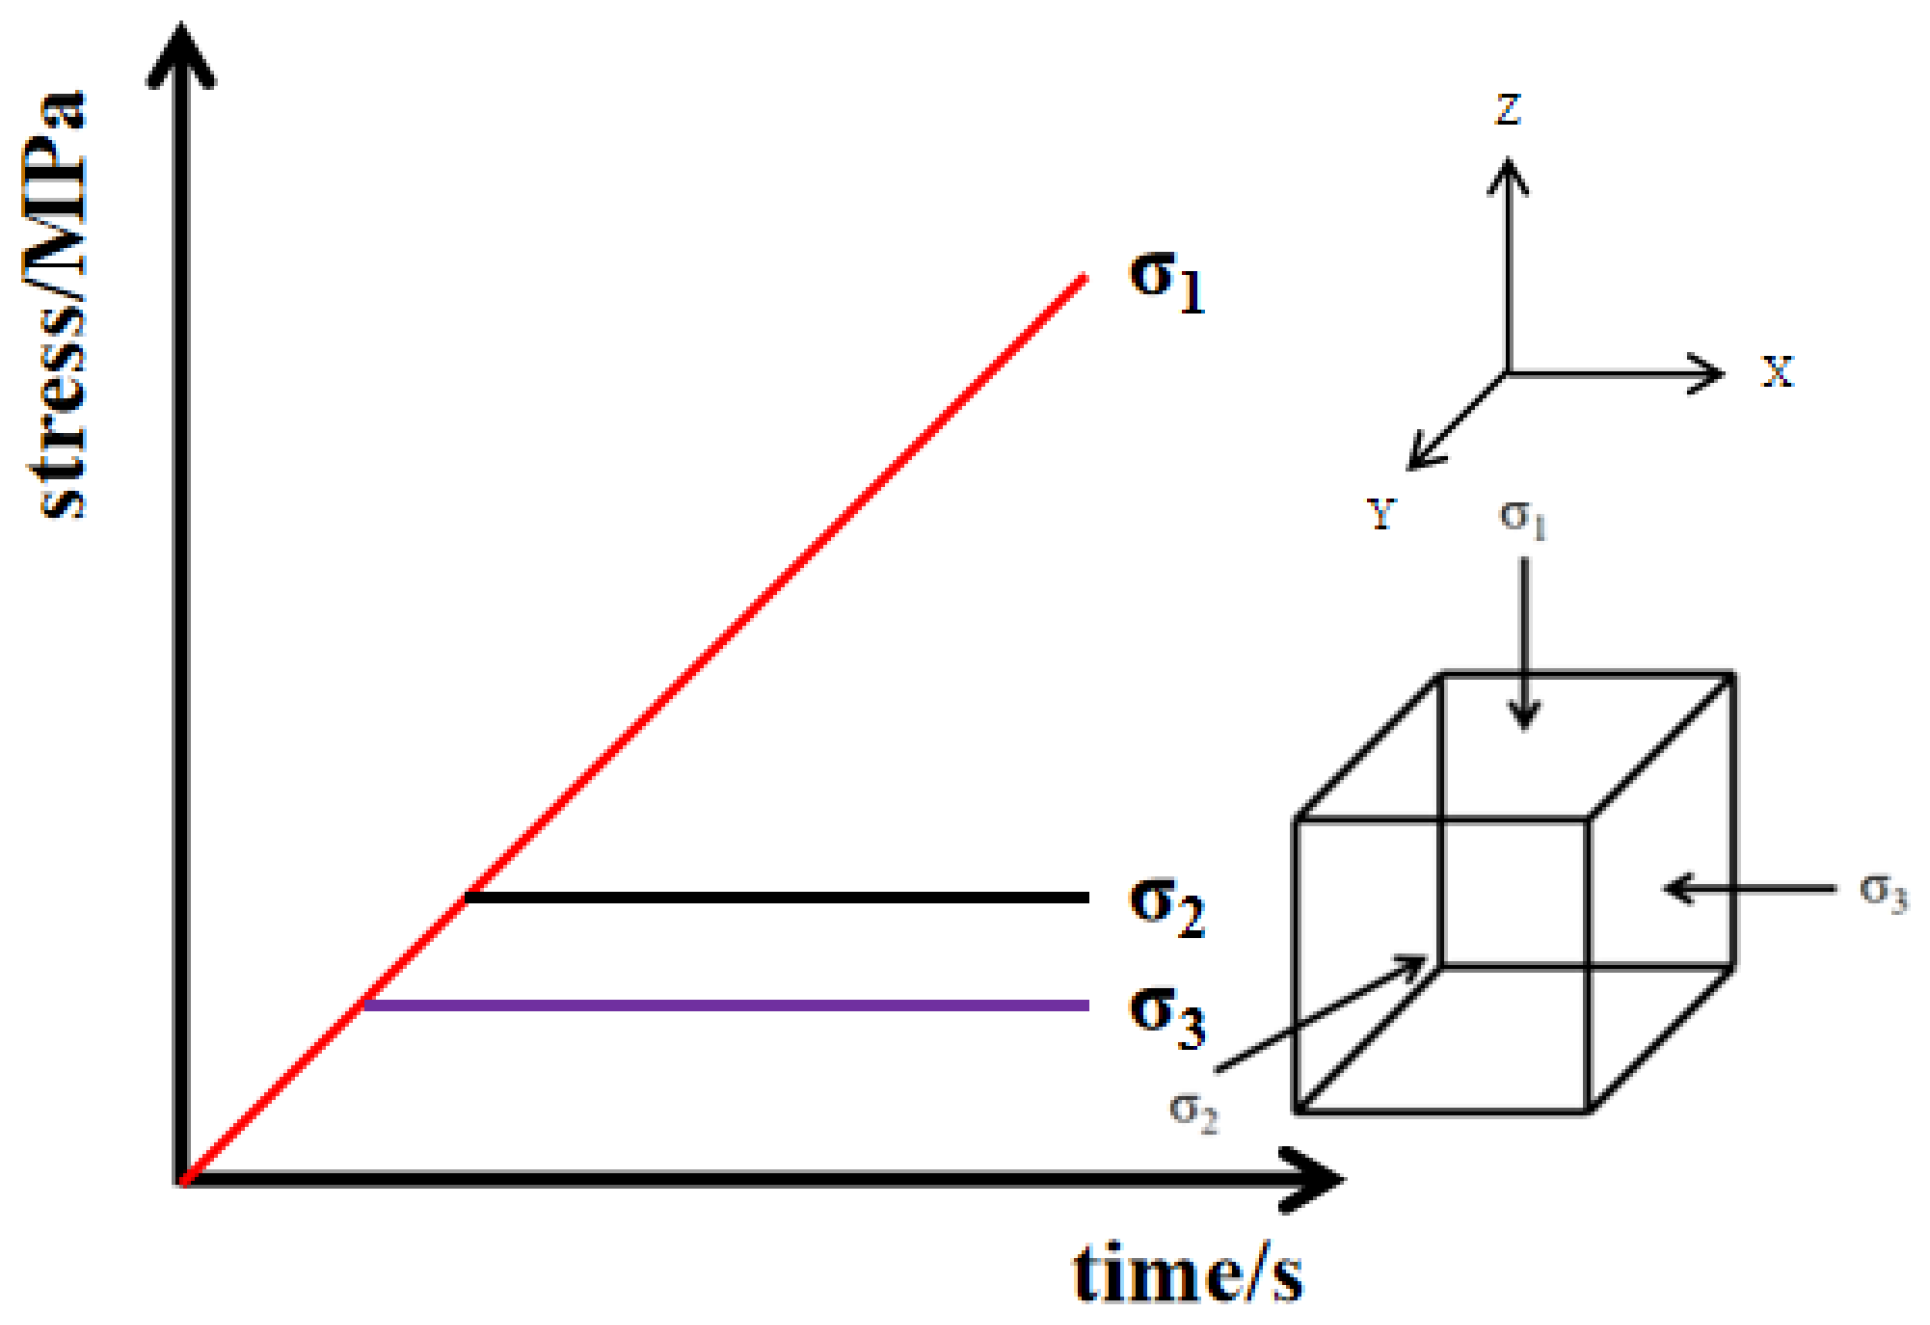
Set the maximum principal stress σ1 along the Z direction, the intermediate principal stress σ2 along the Y direction, and the minimum principal stress σ3 along the X direction. The spatial stress diagram corresponding to the actual test is shown in Figure 4. The specific stress loading procedure is as follows:
The test loading system applies a 1 MPa prestress at a loading rate of 0.5 kN/s in the Z direction in load control mode to ensure that the test piece will not be displaced during loading.
- Following step 1, apply hydrostatic pressure simultaneously at a loading rate of 0.5 kN/s in the X, Y, and Z directions until reaching the stress value σ3 in the X direction, then cease loading in the X direction.
- Continue applying hydrostatic pressure in the Y and Z directions at the loading rate of 0.5 kN/s until the stress value reaches σ2, then stop loading in the Y direction.
After the sandstone specimen reaches the initial in situ stress state in the X and Y directions, the system switches to load-average speed-increase control mode with a loading rate of 0.5 kN/s. Axial loading and acoustic emission detection are conducted simultaneously. An acoustic emission sensor is positioned on the side, and a sufficient amount of coupling agent is applied between the sensor and the rock sample surface to ensure full coupling and enhance the stability of data acquisition.
3. Analysis of Test Results
3.1. Analysis of Variation Characteristics of Maximum Principal Stress
The principal stress–strain relationship is depicted in Figure 5. Due to the large intermediate principal stress σ2, when it exceeds the loading capacity limit of the test system, the maximum principal stress results in Scheme III σ2/σ3 ratios of 1.4, 1.6, and 1.8, which prevent the sandstone samples from being crushed. Consequently, this section focuses solely on comparing and analyzing the test results from Scheme I and Scheme II.
From the test curve, it is evident that the stress–strain curve initially exhibits a concave upward change due to the compaction and closure of original micro-cracks and defects, accompanied by a reduction in the sample’s porosity. In the elastic stage, the curve demonstrates a clear linear relationship, indicative of elastic deformation where the strain continues to increase while adhering to Hooke’s law, with no new cracks forming. Upon reaching the crack initiation stress, the equilibrium between new and previously closed damage is maintained, preserving the linear relationship of the stress–strain curve. As the axial load advances to the expansion stress, the sample’s cracks begin to expand unsteadily; the rate of new crack growth surpasses that of crack closure, and the stress–strain curve shifts to a nonlinear convex shape. Internally, the sample begins to connect and gradually penetrate, forming a macroscopic fracture surface. When the axial load attains peak strength, a sharp drop in stress occurs, and the sample becomes instantly unstable and fractures. At this point, although completely fractured, the sample retains significant residual strength due to the high confining pressure. As the axial strain increases under constant axial load, the specimen enters the residual stage, maintaining some bearing capacity despite being damaged.
When the minimum principal stress σ3 remains constant, the peak stress, residual strength, peak strain, and σ2/σ3 ratios are depicted in Figure 6a. A comparison of test data from 600 m and 1000 m depths shows that with an increase in intermediate principal stress, triaxial compressive strength, yield stress, and residual strength gradually increase, while axial peak strain initially decreases and then increases. At a buried depth of 600 m with σ2, the maximum failure principal stress σ1 increases by 48.45 MPa. Compared to the initial stage, the strength at each subsequent stage increases by 4.7%, 7.4%, and 16%, respectively. At a buried depth of 1000 m with σ2, the maximum failure principal stress σ1 increases by 59.57 MPa, with strength increases at each stage of 2%, 7.2%, and 14%, respectively, compared to the initial stage. The peak strain initially increased and then decreased, showing a generally downward trend, primarily due to the influence of high confining pressure. When σ2/σ3 = 1.6, the maximum increase in peak stress is 133.89 MPa, which is 5.5% higher than the average increment, and the minimum increment in peak strain is 0.0265%, based on the comparison of sandstone specimens from 600 m and 1000 m buried depths.
As depicted in Figure 6b,c, the duration of each stage in the compression process of the sandstone samples initially increases and then decreases as σ2 increases. The compaction stage gradually shortens, while the durations of the elastic and plastic deformation stages correspondingly lengthen, with the plastic deformation stage lasting the longest. In the post-peak stage, due to the confining pressure, the rock experiences no significant stress drop, enhancing the rock’s ductility.
3.2. Deformation Characteristic Analysis
The stress–strain curves under different intermediate principal stresses are shown in Figure 7, wherein the volumetric strain calculation formula of εV is:
Observing Figure 7 reveals that σ2 has a significant influence on εV, and distinct stages are evident during the specimen’s expansion in the stress loading process. In the initial stage of loading, as σ1 increases, micro-cracks in the rock specimen are compacted and closed, causing all directional strains to be positive and the model to be in a compressed state. Here, εV typically exhibits a linear increasing trend, and the deformation at this stage varies positively with increases in σ2 and negatively with decreases. During the elastic phase, the growth rate of ε1 is notably higher than that of the lateral strain, εV remains positive, and the specimen’s deformation is primarily axial compression, with the total model deformation increasing gradually. In the yield stage, as σ1 continues to rise, the internal cracks of the specimen rapidly expand and penetrate, leading to an increased growth rate of lateral strain, predominantly ε3, causing εV to increase in the opposite direction. This transition marks the change from a volumetric compression state to an expansion state. In the failure stage, through-cracks form a fracture surface that spans the entire specimen, ultimately leading to its destruction, and the deformation stabilizes at a maximum value. Comparing the volumetric strain across the three stages shows that the volumetric deformation at a 600 m burial depth is more pronounced than that at 1000 m.
To better characterize the damage degree of deep sandstone under the influence of mining disturbance, the fracturing coefficient is introduced as ξ, and the corresponding expression is:
where εv1 represents the volume strain at the peak strength point of the sandstone specimen, and εv2 denotes the volume strain under the initial in situ stress environment. Calculations show that ξ600 m = 0.028, ξ1000 m = 0.242, and ξ1400 m = 1.075, indicating that the fracturing coefficient at 1400 m exceeds 1. This suggests that the volume strain of the sandstone sample progressively decreases from the initial stress state to the peak strength point, reflecting compressive deformation. This occurs because the increases in maximum horizontal strain and minimum horizontal strain are smaller than those in axial strain throughout the loading process, leading to the volume strain at the peak strength point being lower than at the initial stress state’s end. Conversely, ξ600 m and ξ1000 m are less than 1, showing that the volume strain of sandstone specimens increases progressively from the initial stress state to the peak strength point, indicating swelling deformation. This happens because the increments of maximum and minimum horizontal strains exceed the axial strain during the loading process under 600 m and 1000 m stress conditions. The sequence ξ1400 m > ξ1000 m > ξ600 m demonstrates how different burial depths significantly influence the degree and mode of rock failure. This research indicates that as intermediate principal stress increases, the volume strain decreases and the extent of compressive deformation of sandstone specimens diminishes, exhibiting significant dilation.
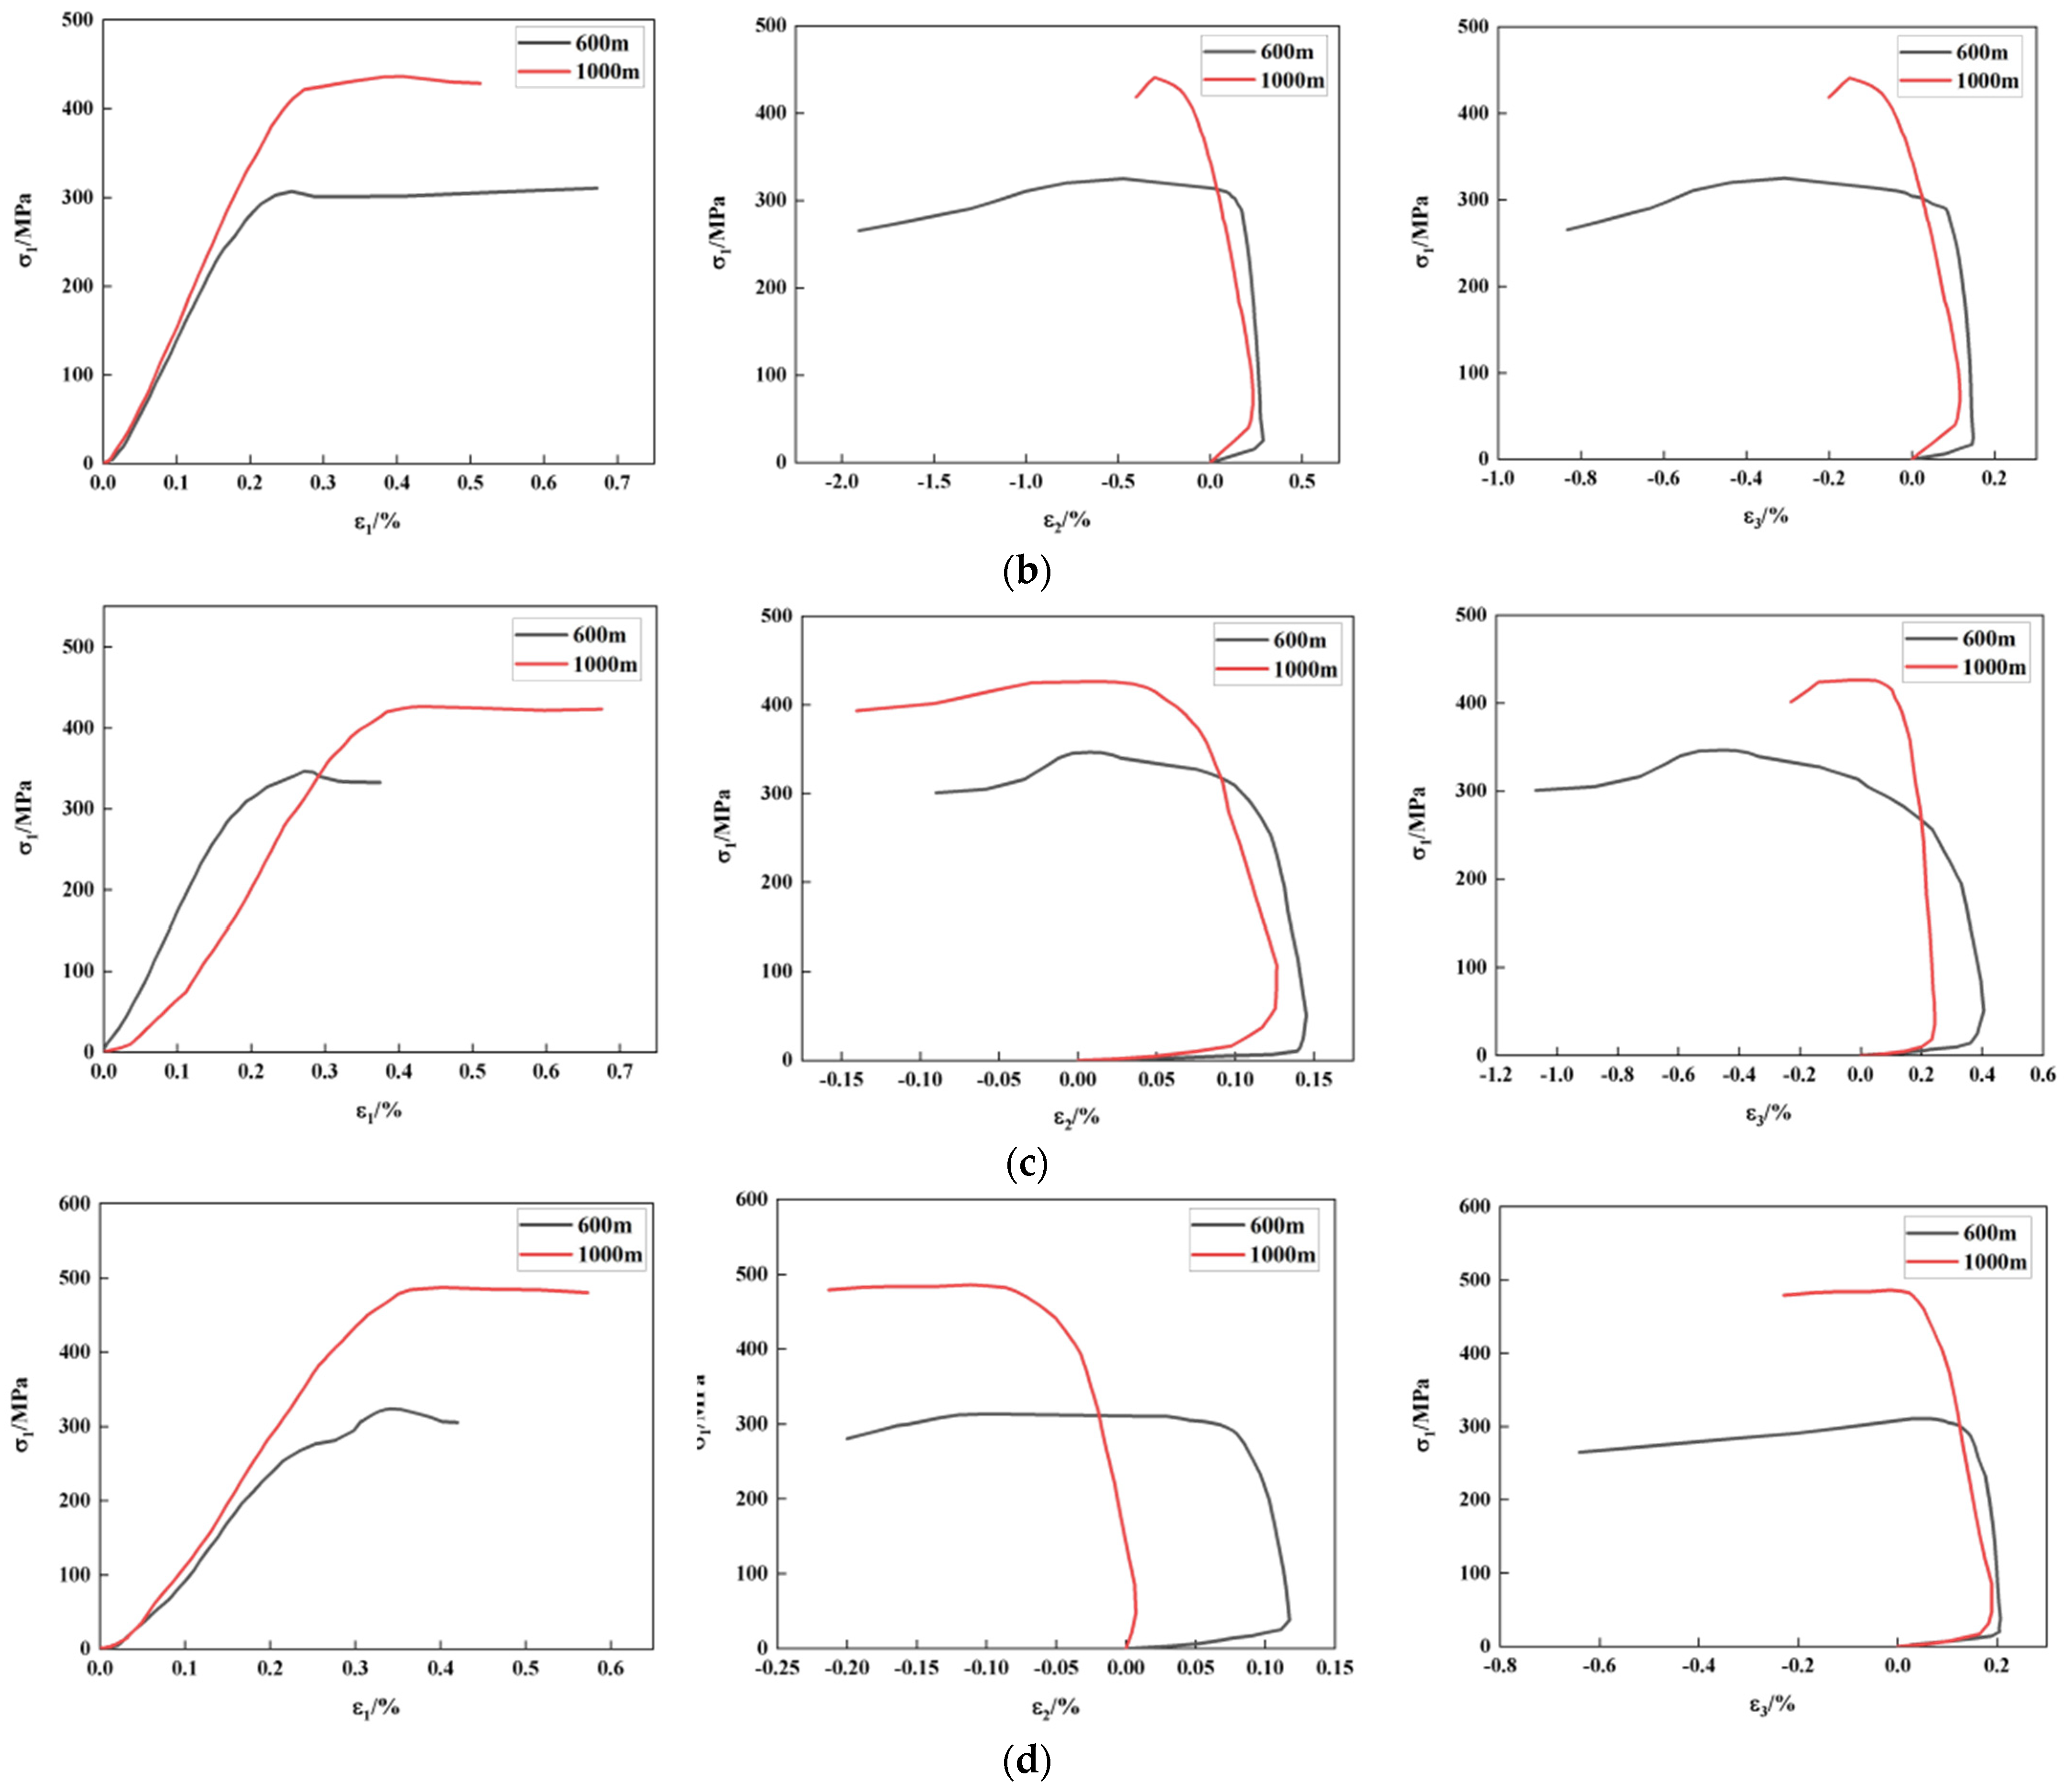
To further investigate the effect of σ2 on the deformation characteristics of sandstone specimens, the comprehensive stress–strain diagram under a consistent stress ratio (σ2/σ3) is illustrated in Figure 8. Notable differences are observable in the principal stress–strain curves throughout the entire precise triaxial deformation process of sandstone at various burial depths. This is primarily due to the deformation memory effect of sandstone when subjected to external forces [21], where simulated depths align with the profound impact of high in situ stress in deep strata on the rock mass. Deeper strata facilitate the exhibition of complex rock-like properties under high initial in situ stress, enhancing resistance to deformation. Simultaneously, substantial amounts of elastic energy are stored within the rock. When deep roadways are excavated and pressure is relieved, the released energy causes the rock fractures to connect with groundwater, potentially leading to mine water inrush disasters. This suggests that this strong effect may be a primary cause of frequent accidents in underground engineering.
3.3. Energy Characteristics
There are numerous characteristic parameters associated with acoustic emission [22]. Due to the similarity in the patterns derived from experimental data, the acoustic emission energy (ENE) for each stage preceding and succeeding the rock’s peak strength has been identified and distinguished by Gu et al. [23]. Additionally, the damage evolution characteristics of rock during compression failure are analyzed. The modified damage variable D is represented by both the acoustic emission event count and the cumulative event count, which are defined as follows:
where D is the damage variable, Cd is the sum of acoustic emission counts in the whole process of rock compression failure, C0 is the acoustic emission event count in the stage, σC is the residual strength, and σP is the peak intensity.
The change trend of the damage variable curve in Figure 9 indicates that the damage process can be divided into four stages: initial damage stage (OA), stable damage development stage (AB), rapid damage development stage (BC), and damage failure stage (CD). It corresponds to the steady, slow increasing, active, and attenuation phases of acoustic emission energy, respectively.
OA stage: during this initial compaction phase, small cracks and dense voids within the rock are progressively compressed and merged. Consequently, micro-cracks and fissures become scarce, leading to sparse acoustic emission signals and low acoustic emission energy. Only a minimal amount of elastic waves are released, resulting in a low damage variable for the rock.
AB stage: this stage marks the end of rock compaction and transitions into the elastic deformation phase. Numerous large new cracks appear locally within the rock sample, leading to significant accumulation of strain energy. As this energy is released, there is a gradual increase in acoustic emission energy and a further increase in auditory emission activity.
BC stage: as the rock progresses into the stable fracture stage, continuous axial pressure induces the formation of many new cracks, alongside the expansion of existing ones. Rock particles within the failure zone are compacted and abraded under axial load, causing local failure zones to converge and create a macro-fracture surface. This interaction between cracks intensifies, leading to rapid increases in both acoustic emission counts and energy. Shortly after the macroscopic failure of the rock samples, acoustic emission energy peaks. During this stage, the loading exceeds the rock’s damage threshold, causing acoustic emission events to escalate rapidly and the rate of sandstone damage to accelerate.
CD stage: upon entering the residual plastic flow stage, the rock sample retains a certain level of bearing capacity, despite the confining pressure. Increased axial load continues to induce numerous secondary cracks, in addition to significant primary fissures. At this juncture, the damage variable value reaches 1.
Observational insights from Figure 9: the peak in acoustic emission energy from red sandstone slightly lags behind the macroscopic failure time of the rock samples. This delay suggests that confining pressure helps mitigate the failure of rock by enhancing micro-element strength and stiffness and reducing crack sliding. Not only does this improve the rock’s failure strength but also boosts its post-peak bearing capacity. The variation in horizontal stress differences further influences the deflection stress of the material. According to the cohesive crack model, extensive damage at the crack tip correlates with increased accumulated energy from crack initiation to failure. Overall, the characteristic curve of the damage variable closely aligns with the axial stress curve of the rock, effectively reflecting the damage evolution and failure process, thus providing a solid theoretical basis for early warnings of rock instability.
3.4. Analysis of Strength and Failure Characteristics
Rock is a typical heterogeneous material, and its failure results from the formation, propagation, intersection, and penetration of micro-cracks, ultimately leading to localized failure. The shape of the fracture section is primarily influenced by the rock’s physical properties and stress state. In actual triaxial stress (σ1 > σ2 > σ3), according to Griffith’s strength theory in Zheng and Luo [24], the σ3 minimum means the controlling sandstone σ3 direction deformation is the weakest. A large number of micro-cracks will be generated; the concentrated tensile stress derived from the end of the micro-crack will indirectly accelerate the growth of sandstone in σ1 compression deformation in that direction. Large expansion deformation occurs in the order of ε3, resulting in multiple shear cracks in the rock. The propagation and penetration of these shear cracks create multiple shear failure surfaces that penetrate the entire rock specimen.
In the context of coal mining, as per the mine pressure control theory, the mechanical behavior of deep floor rock is depicted in Figure 10.
Among them, ① and ⑤ are areas with original rock stress distribution areas, the ② area is a stress reduction zone, the ③ area is a stress increase zone, and the ④ area is the goaf; as well, H represents the mining failure depth, θ represents the fault dip angle, γ represents the unit weight of the overlying strata, and H represents the occurrence depth.
It can be seen from Figure 11 that when the fault is far from the front of the work, the surrounding rock stress of the upper and lower walls of the fault is the original rock stress; at this time, the fault is not affected by mining. When the fault is far behind the working face, the stress of the surrounding rock in the hanging wall and footwall of the fault will return to the original rock stress, which is not favorable for the continuous expansion of fractures and the formation of water inrush channels; when the fault is located below the working face, the surrounding rock of the hanging wall of the fault is affected by the high front support pressure in front of the working face. The closer the working face is, the greater the pressure stress. The surrounding rock of the hanging wall of the fault is affected by the stress release of the original rock behind the working face, and the closer the working face is, the greater the stress release area of the original rock is. At this time, the fault is most affected by mining, which is conducive to the activation of the fault and the generation and expansion of cracks at the upper end of the fault, and it is easy to form a water inrush channel leading to water inrush at the working face.
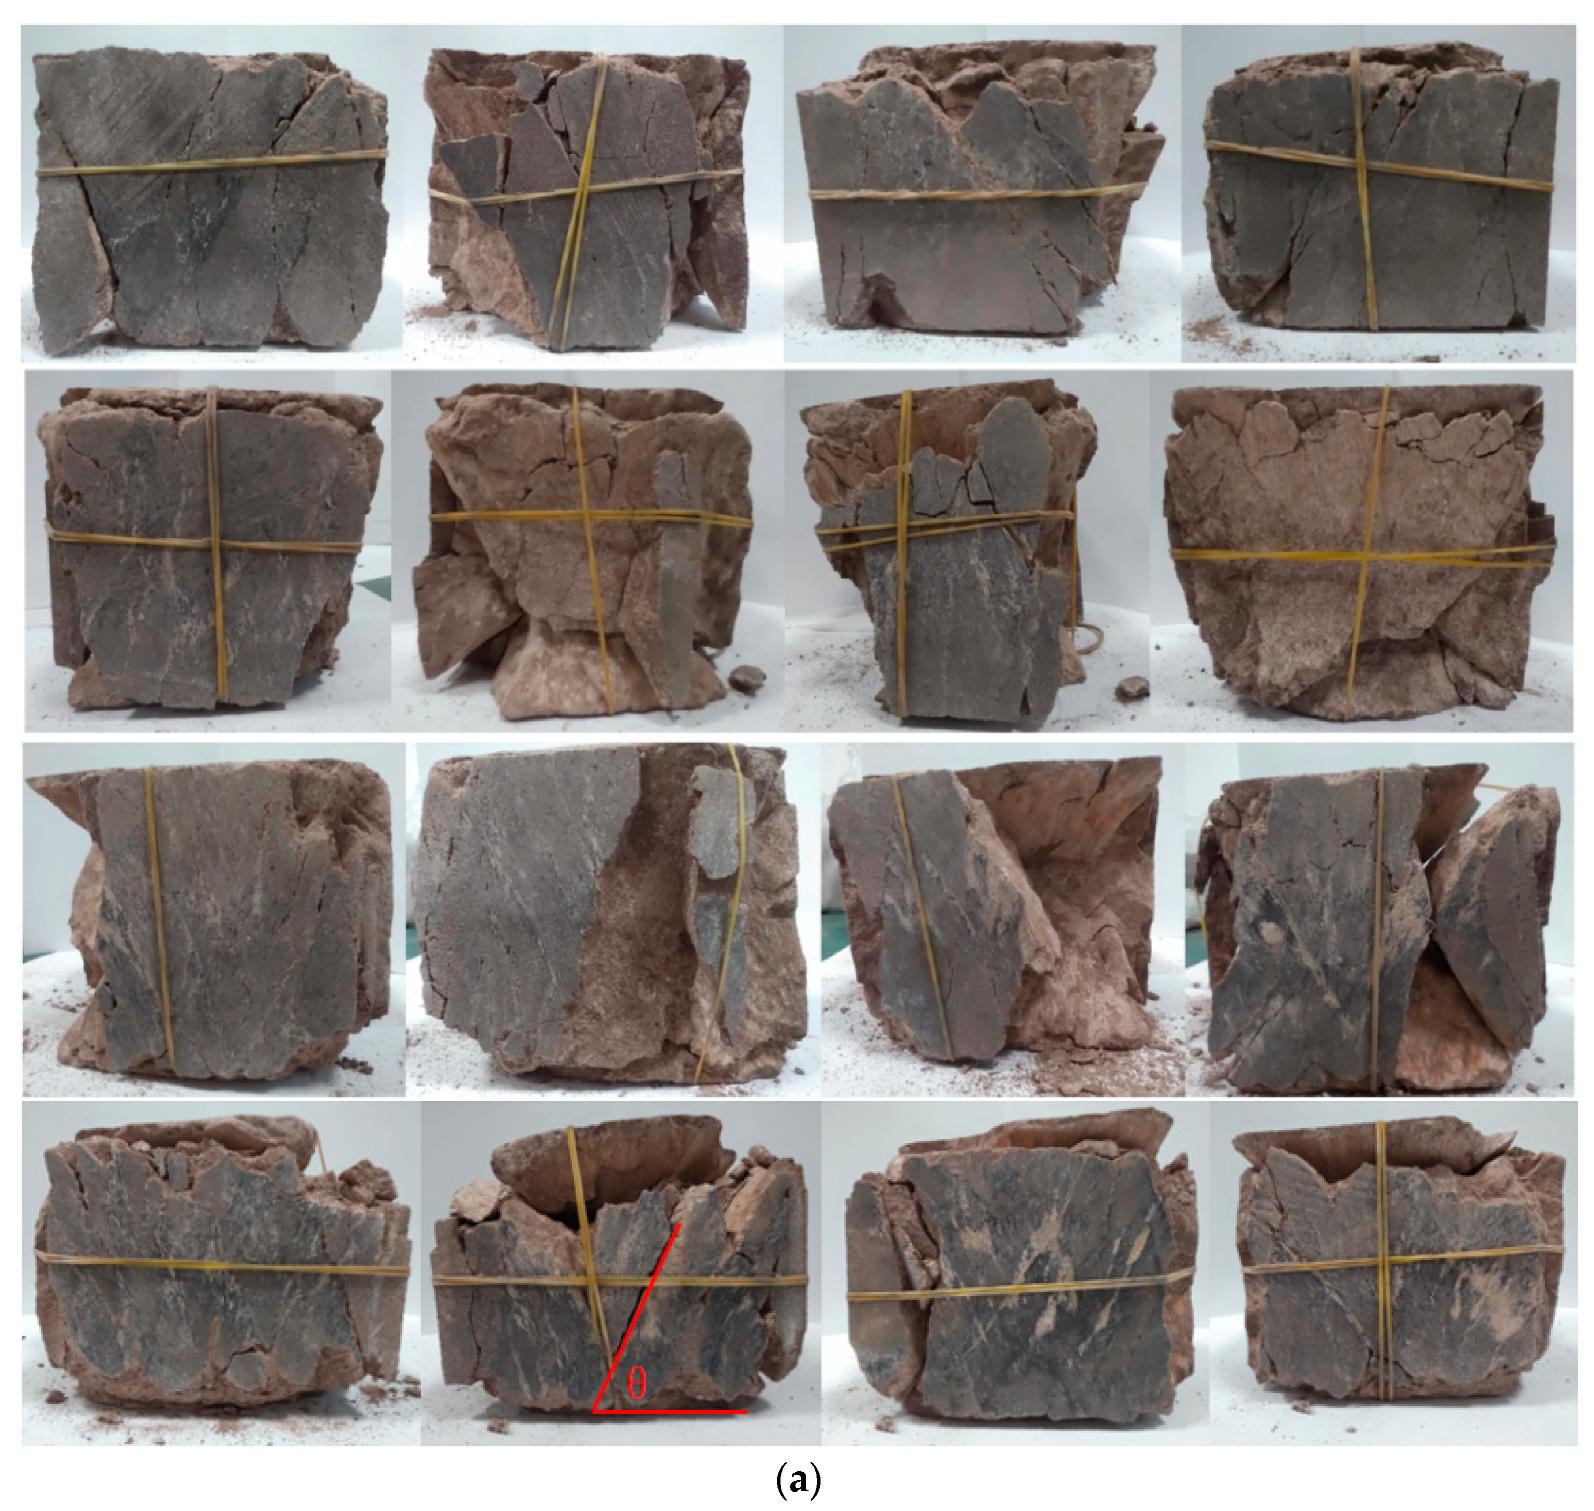
It can be seen from the crushed rock specimen that under the stress environment of 600 m, the red sandstone mainly experiences shear failure and a minor tensile failure, and the failure crack exhibits a “V”-type failure pattern, one main crack runs through the entire test piece, and several other cracks intersect with it obliquely, forming a strike parallel to σ2, with the shear failure surface having a certain angle with σ3 and generate debris at the failure surface [25]. Moreover, the damage is more serious, and the number of cracks increases at the place where the axial stress is applied on the top of the specimen. Under the stress environment of 1000 m, there are both “V”-type failures and “X”-type failures. Multiple through-cracks are generated in the test piece, and the through-cracks intersect with other micro-cracks, forming a network shape in three-dimensional space. There is a substantial amount of rock powder left by shear friction, as well as a few small flake-like rock blocks inside. The rock failure mode is mainly a shear failure formed by axial compression. In addition to shear failure, the bottom corner of the test piece also experiences damage; this phenomenon is one of the typical failure modes of rock because the rock is a heterogeneous body with joints; it will fracture in the process of compression. Due to the internal cracks, local small-scale cracks appear at the bottom corner of the rock sample. Under the stress environment of 1400 m, the damage degree of the sample is relatively weak. The main crack runs through the whole test piece. There are some small cracks in the lower part of the test piece that are almost parallel to the height of the test piece, and no crack network is formed. Comprehensive analysis shows that with increasing depth, the failure mode of the rock changes from axial splitting failure to simple shear failure, the roughness of the fracture surface decreases, and the proportion of the crushing area increases.
As shown in Figure 12, by comparing these three groups of specimens, it can be found that the breaking angle θ is generally greater than 45°, and the shear fracture surface angle increases with the increase in confining pressure, but the increasing rate decreases. The main reason is that the considerable confining pressure effectively restricts the initiation and propagation of tensile cracks, resulting in more shear cracks. The failure mode of the test block changes from tensile failure to a combination of tensile and shear failure and, finally, to shear failure.
4. Conclusions
(1) Confining pressure is a critical factor in the failure of red sandstone. At low pressures, tensile failure is the predominant mode. Throughout the loading process, numerous damaged areas emerge within the specimen. As the load increases, insufficient confining pressure leads to the development of complex, irregularly shaped macro-cracks in most damaged areas. Eventually, these macro-cracks and micro-cracks interconnect to form a complex network. As confining pressure increases, shear failure supersedes tensile failure. This strong inhibition restricts the expansion of damaged areas, enhances rock flexibility, reduces the number of prominent cracks, decreases the overall degree of fragmentation, and reflects an increased bearing capacity.
(2) Rock failure is influenced by the effective intermediate stress, σ2, on the failure surface. Rock deformation exhibits axial compression and dilation along the direction of minimum principal stress. At peak strength, the deformation of the specimen aligns parallel to the σ2 direction, forming a shear failure surface at an angle, typically greater than 45°, relative to the σ3 direction. This angle increases with σ2, enhancing the ductility of rock failure. This behavior results from stress concentration at the tip of large cracks and a stress differential across the specimen, akin to shear loading. At low confining pressures, the rock’s strength and its resistance to direct shear deformation are compromised, resulting in a combination of direct and oblique shear failures. With increased confining pressure, the specimen’s strength and resistance improve, primarily exhibiting oblique shear failure.
(3) The peak of acoustic emission ring counts in sandstone under varying confining pressures occurs slightly after the macroscopic failure of rock samples. This suggests that confining pressure mitigates the failure of rock particles and the sliding of cracks, enhancing not only the shear failure strength but also the post-peak bearing capacity of rock samples. Additionally, intense acoustic emissions related to these conditions promote the fracturing of rock samples, resulting in an overall delay in the failure process.
(4) In sandstone samples, the crack morphology shifts from tensile to shear with increasing depth. Shear cracks, characterized by easy initiation, long propagation distances, and rapid spread, are the primary factors in the formation of water inrush channels and are critical in the occurrence of water inrush accidents.
Author Contributions
Conceptualization, S.S. and S.Z.; software, X.H.; validation, S.S.; formal analysis, S.Z.; investigation, S.Z.; resources, X.H.; data curation, S.S.; writing—original draft preparation, S.Z.; writing—review and editing, X.H.; visualization, X.H.; supervision, S.Z.; project administration, S.Z.; funding acquisition, S.Z. All authors have read and agreed to the published version of the manuscript.
Funding
This research was funded by the Open Fund of State Key Laboratory of Water Resource Protection and Utilization in Coal Mining, grant number GJNY-20-113-19, the National Natural Science Foundation of China, grant numbers 51974173 and 52004147, and the Natural Science Foundation of Shandong Province, grant number ZR2020QE129.
Institutional Review Board Statement
Not applicable.
Informed Consent Statement
Not applicable.
Data Availability Statement
The data used to support the findings of this study are available from the corresponding author upon request.
Acknowledgments
Thank you to Wenhang Meng from State Power Investment Corporation Limited for conceptualizing, preparing the initial draft, and managing the data for this paper.
Conflicts of Interest
The authors declare no conflict of interest.
References
- Townsend, K.F.; Clark, M.K.; Zekkos, D. Profiles of Near-Surface Rock Mass Strength Across Gradients in Burial, Erosion, and Time. J. Geophys. Res. 2021, 126, e2020JF005694. [Google Scholar] [CrossRef]
- Kamran, P.; Aliakbar, G.; Takato, T. Rock failure assessment based on crack density and anisotropy index variations during triaxial loading tests. Geomech. Eng. 2015, 9, 793–813. [Google Scholar]
- Cai, W.Q.; Zhu, H.H.; Liang, W.H. Three-dimensional tunnel face extrusion and reinforcement effects of underground excavations in deep rock masses. Int. J. Rock Mech. Min. Sci. 2022, 150, 104999. [Google Scholar] [CrossRef]
- Liu, Y.; Li, X.; Weng, L.; Wu, Q.H.; Wang, H.F. Unconfined and Triaxial Compression Tests on Hollowed Cylindrical Sandstones to Explore the Infilling Effects on the Deformation and Mechanical Behaviors. Adv. Mater. Sci. Eng. 2021, 2021, 8521438. [Google Scholar] [CrossRef]
- Tang, Y.; Zhang, H.L.; Xu, J.; Okubo, S.; Liu, X.R. Loading Rate Dependence of Rock Strength Under Triaxial Compression. Front. Earth Sci. 2021, 9, 728366. [Google Scholar] [CrossRef]
- Du, J.; Qiu, Z.G. Experimental research on dilatancy characteristics of coarse-grained soils by triaxial compression test. J. Phys. Conf. Ser. 2021, 2021, 012067. [Google Scholar] [CrossRef]
- Zhao, B.Y.; Huang, T.Z.; Liu, D.Y.; Liu, Y.; Wang, X.P.; Liu, S.; Yu, G.B. Study on the mechanical properties test and constitutive model of rock salt. Geomech. Eng. 2019, 18, 291–298. [Google Scholar]
- Iyare, U.C.; Blake, O.O.; Ramsook, R.; Faulkner, D.R. Experimental study of the anisotropic behaviour of the Naparima Hill argillite. Int. J. Rock Mech. Min. Sci. 2022, 153, 105083. [Google Scholar] [CrossRef]
- Ji, H.; Yan, L.; Xu, J.R. Experimental Investigation on Anisotropic Strength and Deformation Behaviors of Columnar Jointed Rock Mass in Confined State. Int. J. Geomech. 2021, 21, 06021022. [Google Scholar] [CrossRef]
- Guo, J.Q.; Huang, W.F.; Liu, X.R.; Chen, J.G.; Jiang, J.G. Rock expansion criterion based on releasable strain energy. J. China Coal Soc. 2019, 44, 2094–2102. [Google Scholar]
- Yossef, H.H.; Feng, X.T.; Li, S.J.; Gong, Y.B.; Quan, J. Tunnel reinforcement in columnar jointed basalts: The role of rock mass anisotropy. Tunn. Undergr. Space Technol. Inc. Trenchless Technol. Res. 2015, 46, 1–11. [Google Scholar]
- Mogi, K. Flow and Fracture of Rocks Under General Triaxial Compression. Appl. Math. Mech. Engl. Ed. 1981, 2, 635–651. [Google Scholar] [CrossRef]
- Chen, J.T.; Feng, X.T. True triaxial experimental study on rock with high geostress. Chin. J. Rock Mech. Eng. 2006, 25, 1537–1543. [Google Scholar]
- Zhou, L.L.; Chu, X.H.; Zhang, X.; Xu, Y.J. Numerical investigations on breakage behaviour of granular materials under triaxial stresses. Geomech. Eng. 2016, 11, 639–655. [Google Scholar] [CrossRef]
- Gao, Y.H.; Feng, X.T.; Wang, Z.F.; Zhang, X.W. Strength and failure characteristics of jointed marble under true triaxial compression. Bull. Eng. Geol. Environ. 2020, 79, 891–905. [Google Scholar] [CrossRef]
- Rajendra, P.T.; Rao, K.S. Response of an Anisotropic Rock Mass under Polyaxial Stress State. J. Mater. Civ. Eng. 2007, 19, 393–403. [Google Scholar]
- Chang, X.; Zhang, X.; Dang, F.N.; Zhang, F.B.; Chang, F.Q. Failure Behavior of Sandstone Specimens Containing a Single Flaw Under True Triaxial Compression. Rock Mech. Rock Eng. 2022, 55, 2111–2127. [Google Scholar] [CrossRef]
- Li, Y.Y.; Xu, Y.D.; Zhang, S.C.; Fan, J.; Duan, G.B. Analysis of the crack propagation rules and regional damage characteristics of rock specimens. Geomech. Eng. 2021, 24, 215–226. [Google Scholar]
- Yin, L.M. Basic Experimental Study on Water Inrush Mechanism of Deep Coal Mining Floor. Ph.D. Thesis, Shandong University of Science and Technology, Tsingtao, China, 2011. [Google Scholar]
- Zhang, J.W.; Song, Z.X.; Fan, W.B.; Ding, L.J.; Yao, Z.X.; Huo, Y.H.; Su, W.T. Experimental investigation on progressive damage mechanical behavior of sandstone under true triaxial condition. J. China Coal Soc. 2019, 44, 2700–2709. [Google Scholar]
- Wang, H.J.; Dyskin, A.V.; Hsieh, A.; Dight, P. The mechanism of the deformation memory effect and the deformation rate analysis in layered rock in the low stress region. Comput. Geotech. 2012, 44, 83–92. [Google Scholar] [CrossRef]
- Tao, J.N.; Zhang, K.L.; Zheng, J.F. Research of parameter of acoustic emission under rock failure. Chin. J. Rock Mech. Eng. 1996, 4, 452–455. [Google Scholar]
- Gu, Q.H.; Ning, J.G.; Tan, Y.L.; Liu, X.S.; Ma, Q. Damage constitutive model of brittle rock considering the compaction of crack. Geomech. Eng. 2018, 15, 1081–1089. [Google Scholar]
- Zheng, A.X.; Luo, X.Q. Research on combined fracture criterion of rock under compression-shear stress. Rock Soil Mech. 2015, 36, 1892–1898. [Google Scholar]
- Huang, D.; Guo, Y.Q.; Cen, D.F.; Song, Y.X. Experimental Investigation on Shear Mechanical Behavior of Sandstone Containing a Pre-existing Flaw Under Unloading Normal Stress with Constant Shear Stress. Rock Mech. Rock Eng. 2020, 53, 3779–3792. [Google Scholar] [CrossRef]
Figure 1.
Stress characteristics of rock mass in different areas during water inrush of coal mine floor.
Figure 1.
Stress characteristics of rock mass in different areas during water inrush of coal mine floor.

Figure 2.
Prepared red sandstone samples.

Figure 3.
Test system diagram: (a) triaxial test system; (b) PCI-2 acoustic emission monitoring system; (c) acoustic emission sensor layout diagram.
Figure 3.
Test system diagram: (a) triaxial test system; (b) PCI-2 acoustic emission monitoring system; (c) acoustic emission sensor layout diagram.

Figure 4.
Schematic diagram of true triaxial loading of sample.

Figure 5.
Relationship between principal stress and principal strain: (a) 600 m buried depth; (b) 1000 m buried depth.
Figure 5.
Relationship between principal stress and principal strain: (a) 600 m buried depth; (b) 1000 m buried depth.

Figure 6.
Relationship between intermediate principal stress and failure stress and time: (a) relationship between the maximum failure principal stress and the intermediate principal stress; (b) stress time relationship diagram of each stage of 600 m; (c) relationship between stress and time at each stage of 1000 m.


Figure 7.
Relationship between principal stress and volume strain under different intermediate stresses: (a) 600 m buried depth; (b) 1000 m buried depth; (c) volume deformation at each stage.
Figure 7.
Relationship between principal stress and volume strain under different intermediate stresses: (a) 600 m buried depth; (b) 1000 m buried depth; (c) volume deformation at each stage.

Figure 8.
Full stress–strain relationship under different burial depths and the same stress ratio: (a) σ2/σ3 = 1.2; (b) σ2/σ3 = 1.4; (c) σ2/σ3 = 1.6; (d) σ2/σ3 = 1.8.
Figure 8.
Full stress–strain relationship under different burial depths and the same stress ratio: (a) σ2/σ3 = 1.2; (b) σ2/σ3 = 1.4; (c) σ2/σ3 = 1.6; (d) σ2/σ3 = 1.8.


Figure 9.
Acoustic emission relation diagram of test piece: (a) 600 m axial stress–energy relationship curve; (b) 600 m axial stress–damage relationship curve; (c) 1000 m axial stress–energy relationship curve; (d) 1000 m axial stress–damage relationship curve; (e) 1400 m axial stress–energy relationship curve; (f) 1400 m axial stress–damage relationship curve.

Figure 10.
Stress model of bottom plate.

Figure 11.
Crack propagation pattern at each burial depth: (a) surrounding rock failure of 600 m fault; (b) surrounding rock failure of 1000 m fault; (c) surrounding rock failure of 1400 m fault.
Figure 11.
Crack propagation pattern at each burial depth: (a) surrounding rock failure of 600 m fault; (b) surrounding rock failure of 1000 m fault; (c) surrounding rock failure of 1400 m fault.

Figure 12.
Failure pattern of red sandstone sample: (a) 600 m buried depth; (b) 1000 m buried depth; (c) 1400 m buried depth.
Figure 12.
Failure pattern of red sandstone sample: (a) 600 m buried depth; (b) 1000 m buried depth; (c) 1400 m buried depth.


Table 1.
Experimental scheme.
| No. | Depth | σ2/σ3 | σ2/MPa | σ3/MPa |
|---|---|---|---|---|
| 1 | 600 m | 1.2 | 19.4 | 16.2 |
| 1.4 | 22.7 | |||
| 1.6 | 25.9 | |||
| 1.8 | 29.2 | |||
| 2 | 1000 m | 1.2 | 32.4 | 27.0 |
| 1.4 | 37.8 | |||
| 1.6 | 43.2 | |||
| 1.8 | 48.6 | |||
| 3 | 1400 m | 1.2 | 45.4 | 37.8 |
| 1.4 | 52.9 | |||
| 1.6 | 60.5 | |||
| 1.8 | 68.0 |
Disclaimer/Publisher’s Note: The statements, opinions and data contained in all publications are solely those of the individual author(s) and contributor(s) and not of MDPI and/or the editor(s). MDPI and/or the editor(s) disclaim responsibility for any injury to people or property resulting from any ideas, methods, instructions or products referred to in the content. |
© 2024 by the authors. Licensee MDPI, Basel, Switzerland. This article is an open access article distributed under the terms and conditions of the Creative Commons Attribution (CC BY) license (https://creativecommons.org/licenses/by/4.0/).
Share and Cite
MDPI and ACS Style
Zhang, S.; Song, S.; Han, X. Experimental Study on Energy Release Mechanism and Crack Propagation Evolution of Sandstone under True Triaxial Loading. Appl. Sci. 2024, 14, 3655. https://0-doi-org.brum.beds.ac.uk/10.3390/app14093655
AMA Style
Zhang S, Song S, Han X. Experimental Study on Energy Release Mechanism and Crack Propagation Evolution of Sandstone under True Triaxial Loading. Applied Sciences. 2024; 14(9):3655. https://0-doi-org.brum.beds.ac.uk/10.3390/app14093655
Chicago/Turabian StyleZhang, Shichuan, Shilong Song, and Xuexian Han. 2024. "Experimental Study on Energy Release Mechanism and Crack Propagation Evolution of Sandstone under True Triaxial Loading" Applied Sciences 14, no. 9: 3655. https://0-doi-org.brum.beds.ac.uk/10.3390/app14093655
Note that from the first issue of 2016, this journal uses article numbers instead of page numbers. See further details here.