
Research on an Alpha Navigation Signal Detection Method Based on Multichannel Orthogonal Correlation


1
National Time Service Center, Chinese Academy of Sciences, Xi’an 710600, China
2
Key Laboratory of Time Reference and Applications Chinese Academy of Sciences, Xi’an 710600, China
3
Laboratory of Science and Technology on Marine Navigation and Control, China State Shipbuilding Corporation, Tianjin 300131, China
4
Tianjin Navigation Instrument Research Institute, Tianjin 300131, China
*
Author to whom correspondence should be addressed.
Appl. Sci. 2024, 14(9), 3620; https://0-doi-org.brum.beds.ac.uk/10.3390/app14093620
Submission received: 13 March 2024
/
Revised: 21 April 2024
/
Accepted: 22 April 2024
/
Published: 25 April 2024
(This article belongs to the Special Issue Signal Acquisition and Processing for Measurement and Testing)
Abstract
:The Alpha navigation system is the only operating radio system based on very-low-frequency (VLF) signals that can be used to research VLF navigation, timing, and ionospheric characteristics. The detection of the Alpha navigation signal is the key step in the Alpha receiver; however, the received Alpha navigation signal is susceptible to noise and mutual interference, which deteriorates signal detection performance. This paper presents a multichannel orthogonal correlation method for Alpha navigation signal detection. Once the three frequency signals of the Alpha navigation system are obtained using a notch filter, station identification is realized using a multichannel orthogonal correlation method and signal format. The selection of key parameters and the detection performance under noise and mutual interference are analyzed. This method’s detection probability exceeds 90% when the signal-to-noise ratio (SNR) is greater than −10 dB. The influence of mutual interference on the signal correlation peak is less than 1% when the signal-to-interference ratio (SIR) of the mutual interference is greater than −28 dB. The proposed method is verified using an actual signal collected using an Alpha receiver. The results show that an Alpha signal can be detected at an extremely low SNR. This method has strong practicability and satisfies the application requirements of an Alpha receiver.
1. Introduction
Very-low-frequency (VLF) radio signals have a frequency range of 3–30 kHz and propagate in the Earth–ionosphere waveguide cavity. They are widely used in navigation, timing, and ionospheric research owing to their long propagation distance, stable phase, and high permeability [1,2,3]. In the 1960s, the United States developed the Omega navigation system based on low-frequency radio signals. In 1982, the system achieved global coverage of navigation signals using eight stations that transmit signals at different frequencies [4,5,6]. However, with the widespread use of the Global Positioning System (GPS), which accelerated the process of updating navigation systems, the United States shut down the Omega navigation system in 1997 [7]. The Alpha navigation system is an Omega-like ultra-long-range navigation system that was developed by the Soviet Union and put into operation in 1970. Alpha is the only VLF-based navigation system still in operation internationally, and it uses five stations to provide navigation services to its coverage area [8,9,10].
The weaknesses of Global Navigation Satellite Systems (GNSSs) include weak signals, poor penetration ability, susceptibility to interference, poor anti-interference ability, and an inability to enter water. The sole reliance on a GNSS for navigation and timing carries serious risks [11,12,13]. However, VLF and satellite signals have significant differences in operating frequency (low- and high-frequency), operating mode (land- and satellite-based), and signal strength (high- and low-level). In general, such signals do not lose their service capabilities when subjected to intentional or unintentional interference. Therefore, many countries are now researching VLF-based radio navigation and timing systems to reduce the risk of relying on GNSS [7,14]. The most representative is the Spatial, Temporal and Orientation Information in Contested Environments (STOIC) project released by the United States Defense Advanced Research Projects Agency (DARPA) on 12 June 2014, which aims to find a positioning, navigation, and timing (PNT) system for various military services that does not rely on a GPS but has the same level of accuracy as a GPS, where the signals used are VLF signals [15,16]. According to the test results published in 2019, the positioning accuracy after the correction of the propagation delay of the VLF signals can reach 40 m.
The Alpha navigation system is a good source of signals for research on VLF technology. Its signal transmission frequency ranges from 10 to 15 kHz, and the frequency reference of the system is generated by a highly stable cesium atomic clock [17]. Therefore, Alpha can not only be applied to navigation but also to research VLF timing technology, new VLF navigation technologies, solar activity monitoring, and signal propagation characteristics [5,17]. Related applications and research based on Alpha must accurately measure the field intensity and phase signal parameters of different stations with different frequencies using receiving equipment. Signal detection is the first step in the signal-receiving equipment of an Alpha navigation system. The purpose of this is to automatically detect the expected station signal and determine the starting position of the signal at different frequency points of the expected station. However, owing to the large number of stations in the Alpha navigation system and because each station broadcasts three different frequency signals, it is possible to simultaneously receive different frequency signals from multiple stations, which causes mutual interference with the expected stations and makes signal detection difficult. When detecting expected station signals, it is necessary to suppress the signals from other stations and reduce their impact on the detection of expected station signals. Simultaneously, noise is received at the same time during the receiving process of the Alpha signal, which affects the accuracy of the expected station detection and signal parameter measurement. In particular, when the signal is weak, noise and mutual interference must be suppressed to improve the quality of Alpha navigation signals.
Alpha positioning was realized using hyperbolic positioning technology after calculating the phase difference between the signals received from different stations. The phase difference was measured by detecting the indirect phase difference between the different frequency signals at each station and the reference frequency signals [5,18]. Phase difference measurements require a highly stable clock and a reference signal of the same order as that of the transmitted signal, which not only imposes high time synchronization requirements on the receiving equipment but also precludes automated phase difference detection. Currently, signal delay correlation and envelope detection methods exist for detecting pulse signals similar to Alpha navigation signals [19,20,21]. The signal delay correlation method was used to correlate the two sets of signals before and after obtaining the correlation results. This method requires a high SNR, and the multivalue of the correlation results can lead to large detection errors. The envelope detection method uses the Hilbert variation to obtain the signal envelope and then detects the station signals according to the order of the broadcasting signals. This method generates mutual interference between signal envelopes of different frequencies, which affects the detection performance. In the field of radio timing and navigation signal processing, noise suppression methods include classical bandpass filtering and modern filtering. The classical bandpass filter can either be a finite impulse response (FIR) filter or an infinite impulse response (IIR) filter. Modern filtering methods include wavelet filtering, empirical mode decomposition, kalman filtering, etc. [22,23]. Although the modern filtering method has the advantage of strong anti-noise ability, it is more complicated to implement on a hardware platform with high digital signal processing timing. The classical bandpass filter is simple to realize and can fulfill the requirements of the receiver, so it is often used in engineering implementation. Therefore, this paper primarily considers the use of a bandpass filter to suppress the noise.
To address the detection problems of noise and mutual interference in Alpha navigation signal reception, a multichannel orthogonal correlation detection method is proposed in this study. Upon extracting the three frequency signals of all stations in Alpha, an orthogonal correlation was performed for each frequency signal to obtain the correlation peaks, and station identification was achieved according to the broadcasting order of the three frequency signals of the different stations in the Alpha system. In this study, the performance of the detection method was simulated under noise and mutual interference, and real signals were used to verify the method. The results show that the method not only has the advantage of strong mutual interference resistance but can also achieve the detection of Alpha navigation signals under the condition of a lower signal-to-noise ratio (SNR) and meet the application requirements of the Alpha receiver.
2. Materials and Methods
In this section, we describe the basic situation of the Alpha navigation system and its signal broadcast formats. The realization process of the signal detection method based on multichannel orthogonal correlation is presented by combining the signal characteristics and frequency transmission sequence of the Alpha navigation system. The principle of the detection method is described in detail, and the key parameters that affect its effectiveness are discussed.
2.1. Signal Format for Alpha Navigation System
Currently, the Alpha navigation system is the only operational long-range land-based navigation system based on VLF signals [7]. The Alpha navigation system contains five stations, including one main station and four secondary stations, and the working area covers approximately 70% of the world. The transmitter power of each station is approximately 200–250 kW, and the antenna radiation power ranges from 50 to 80 kW [24,25]. The positioning accuracy of the system is in the range of 2–4 n mile. To solve the signal propagation delay correction problem, Russia established 31 Alpha signal propagation measurement stations in the operating area of the Alpha system, and the positioning accuracy can be improved to 200 m from 1000 m by using the propagation delay correction. The distribution of Alpha navigation system stations is shown in Figure 1 [26,27]. As can be observed from the distribution of stations, the system is a resource that China can use for research on VLF timing and navigation.
The five stations in the Alpha navigation system broadcast three frequency signals: , , and . The stations are distinguished based on the transmission order of the three signals. Table 1 lists the transmission frequency and sequence of signals at each station in the system [5,9]. The time taken for each station to broadcast a signal frame was 3.6 s, and each frame consisted of six time periods with a length of 600 ms [7,17]. According to the signal broadcasting format designed by Alpha, although multiple signals of the same frequency will not be received at any location or time within the coverage range of the system, signals of different frequencies will be received simultaneously.
2.2. Multichannel Orthogonal Correlation Detection Method
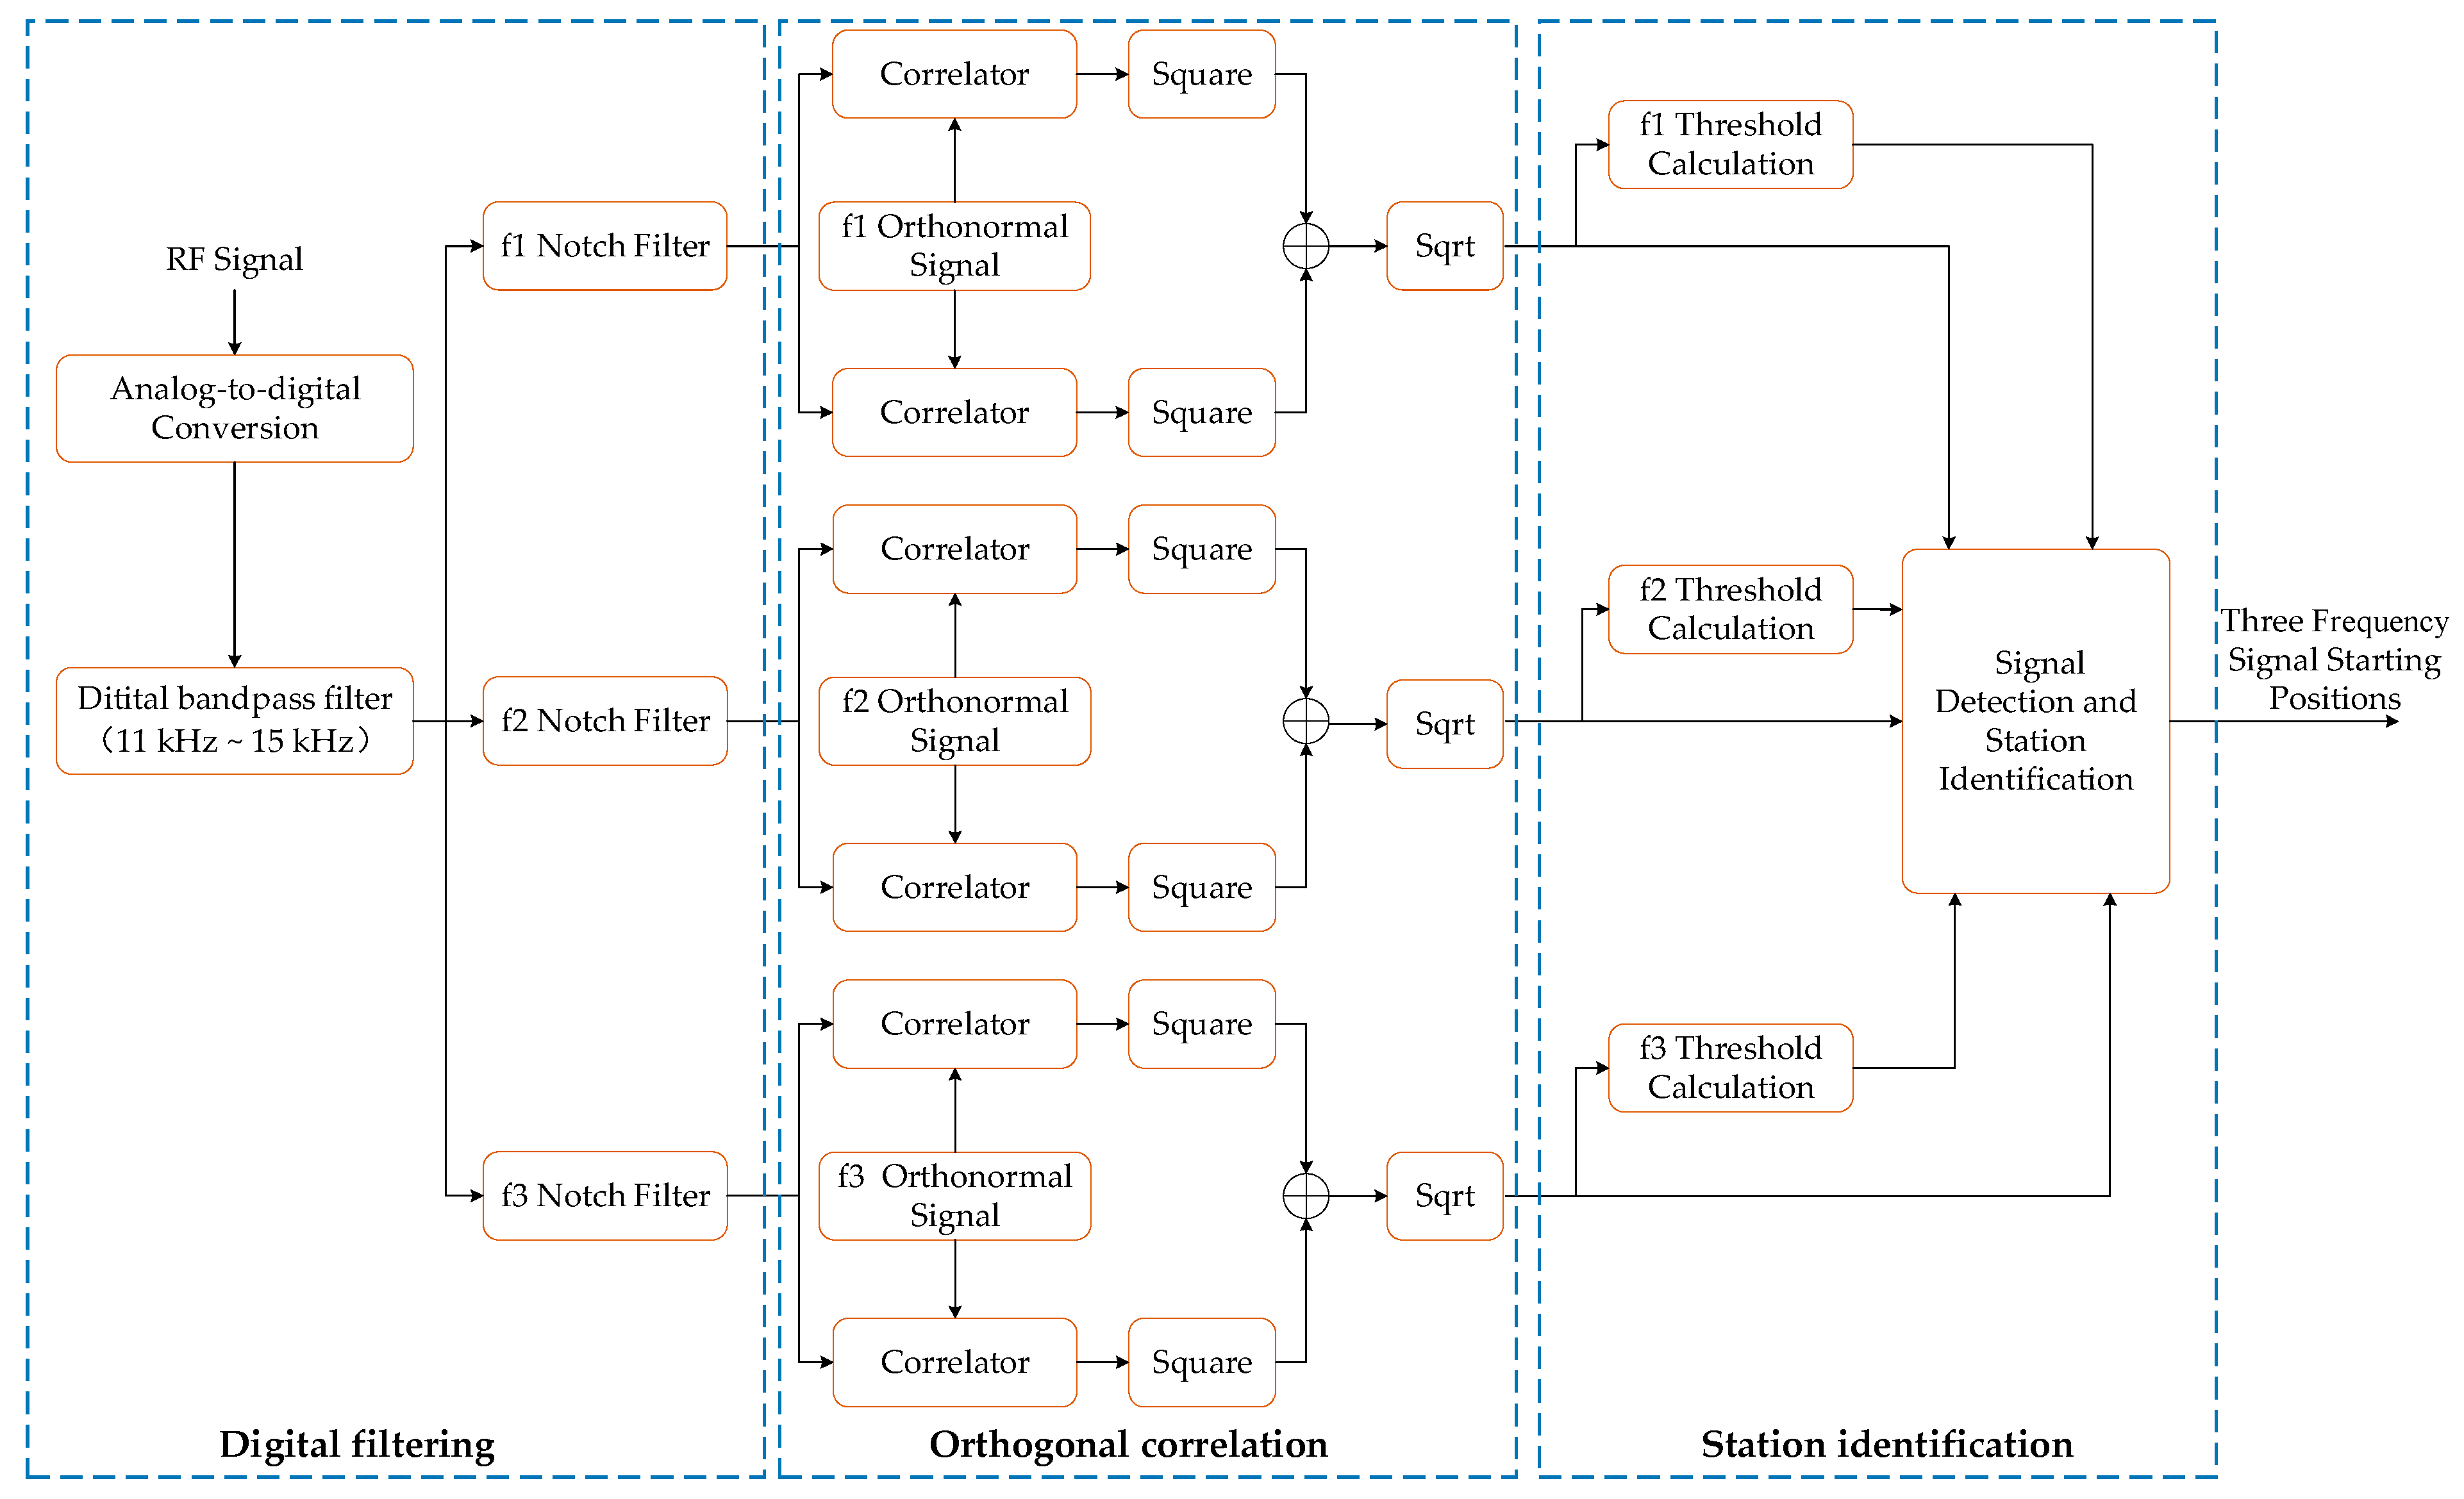
The detection of the Alpha navigation signal is the first step in signal processing in the receiving equipment, with the purpose being to find the starting position of the expected station of the three frequency signals [28]. To accurately identify the three frequency signals of each station in an Alpha navigation system under the influence of noise and mutual interference, this paper presents a multichannel orthogonal correlation method by which the recognition and signal detection of Alpha navigation stations can be realized. Figure 2 illustrates the implementation process of the proposed method. The proposed method is realized through three processes: digital filtering, orthogonal correlation, and station identification.
2.2.1. Signal Digital Filtering
Before signal detection, the received signal must be denoised, and three frequency signals must be extracted. Digital signal filtering entails two steps. First, a digital bandpass filter is used to attenuate interference and the out-of-band noise to improve the signal detection probability. The bandpass filter uses an FIR filter. The bandwidth of the filter was 10–15 kHz, and the order was 256-order Hamming. The out-of-band signal suppression ability of the filter exceeded 40 dB. Subsequently, three frequency signals, denoted , , and , were extracted using three frequency notch filters. The notch filter uses a second-order IIR filter [29,30]. We used the error signals of the three notch filters as the three extracted frequency signals. The three frequency signals were obtained after processing using three notch filters, which reduced the interaction of the frequency signals between different stations. The transfer function of the second-order IIR notch filter is as follows [31]:
where is the bandwidth control parameter of the notch filter; is the frequency control parameter of the notch filter. The two parameters are designed as
where signifies the angular frequency of the notch signal; denotes the bandwidth of the trap; and indicates the SNR of the notch signal. Equations (2) and (3) show that the corresponding notch filter can be designed based on the frequency of the three signals of the Alpha navigation signal.
The signal processed by the notch filter is expressed as
where represents the three frequency signals of , , and ; denotes the signal frequency; is the signal amplitude; and indicates the noise in the signal after the notch filter.
2.2.2. Multichannel Orthogonal Correlation
After obtaining the three frequency signals via notching, an orthogonal correlation method was used to obtain the correlation peaks of the three frequency signals. The correlation method not only obtains high-gain correlation peaks but also further suppresses noise and other frequency signals left by the notch. We performed a sliding correlation operation of length between and the orthogonal carrier signals at frequency fi. The two correlation results can be expressed as follows [32,33]:
where denotes the correlation length, and 2πfit indicates the phase difference between the Alpha navigation signal and the local orthogonal carrier signal of the same frequency.
Owing to the strong correlation between the orthogonal carrier signal and the received signal as well as the weak correlation between the orthogonal carrier signal and the noise, the received signal can be enhanced. However, the noise is not completely independent of the orthogonal carrier signal. Therefore, residual noise exists after correlation. Equations (5) and (6) can be expressed as follows:
where and represent the residual noises after the correlation. The result of the second term in the formula is so small that it can be disregarded [34]. Thus, Equations (7) and (8) can be expressed as follows:
To eliminate the phase difference , the operations in Equation (11) are performed on Equations (9) and (10). Thus, we can obtain the orthogonal correlation results:
where represents the residual noise after orthogonal correlation.
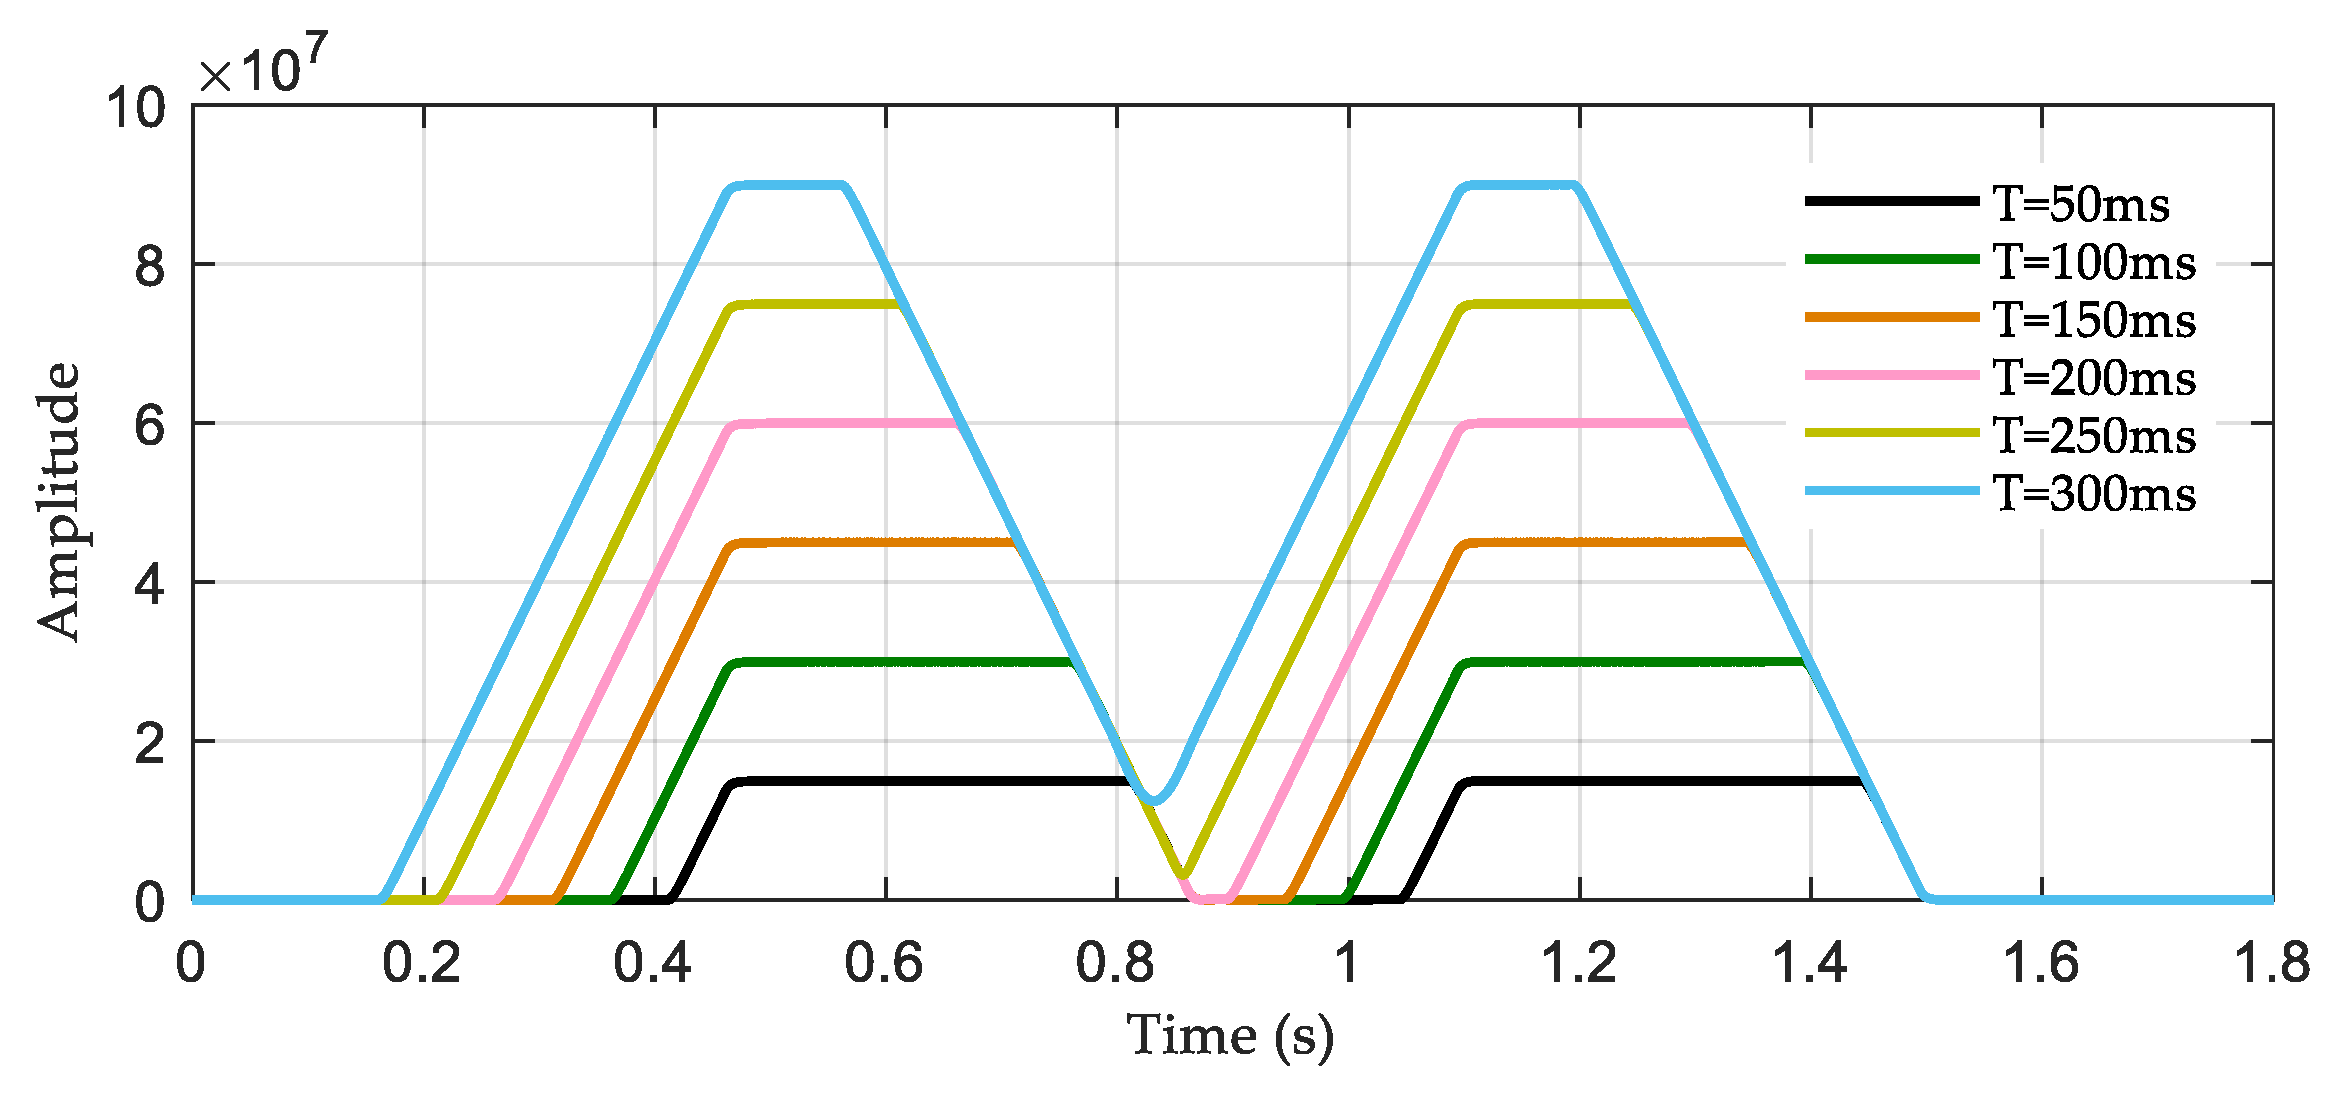
As observed in the orthogonal correlation process, the correlation length is a critical parameter that can be used to obtain an ideal correlation peak. We obtained six correlation peaks through simulation with values of 50, 100, 150, 200, 250, and 300 . Figure 3 presents the correlation results.
As illustrated in Figure 3, with an increase in the correlation length T, the amplitude of the correlation peaks not only increases but also becomes sharper, which can improve the sensitivity of detection. However, a longer correlation length leads to a wider correlation peak, resulting in a correlation peak overlap between the two stations with the same frequency signal and the detection of the signal not being used. When the correlation length T is too short, the correlation gain decreases. Therefore, we comprehensively consider selecting a correlation length of ms to ensure the gain of the correlation peaks and prevent overlap between them. This is beneficial to improve the detection sensitivity of the Alpha navigation signal.
We performed a sliding correlation of 150 ms between the three frequency signals (, , and ) outputted by the notch filter and the corresponding orthogonal carrier signals, which resulted in three correlation results: , , and .
2.2.3. Signal Detection and Station Identification
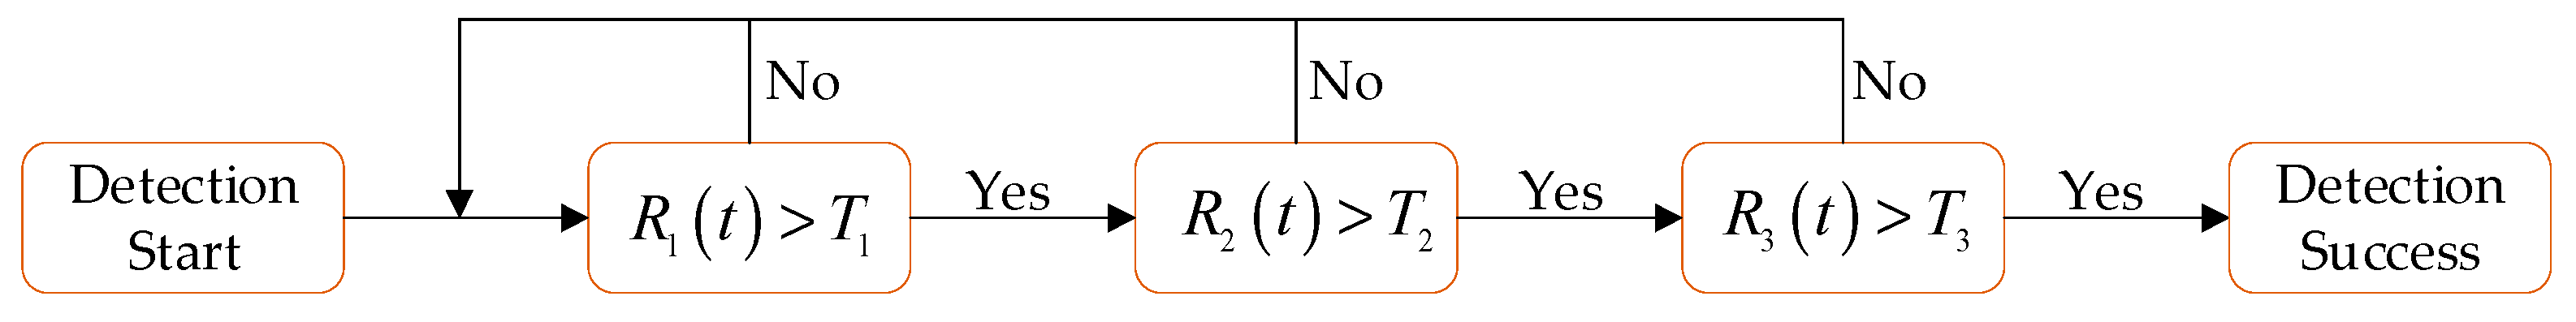
Station identification detects the expected stations based on the different transmission sequences of , , and , which are the frequency signals of the five stations of the Alpha navigation system. The specific goal was to detect the correlation peak by comparing the correlation results, namely , , and , of the three frequency signals with their corresponding thresholds. Figure 4 illustrates the station identification process.
The conditions for the successful detection of the five stations in the Alpha navigation system are described below.
The condition for the master station signal to be detected successfully.
When the correlation results of the frequency signal are all greater than the threshold in the time period ms to ms, all of the correlation results of the frequency signal are greater than the threshold in the time period ms to ms, and all of the correlation results of the frequency signal are greater than the threshold in the time period t + 1210 ms to ms; therefore, we confirm that the main station detection is successful. The threshold calculations for the three frequency signals of the main station are as follows:
The condition for the western secondary station signal to be detected successfully.
When the correlation results of the frequency signal are all greater than the threshold in the time period ms to ms, all of the correlation results of the frequency signal are greater than the threshold in the time period ms to ms, and all of the correlation results of the frequency signal are greater than the threshold in the time period ms to ms; therefore, we confirm that the western secondary station detection is successful. The threshold calculations for the three frequency signals of the western secondary station are as follows:
The condition for the eastern secondary station signal to be detected successfully.
When the correlation results of the frequency signal are all greater than the threshold in the time period ms to ms, all of the correlation results of the frequency signal are greater than the threshold in the time period ms to ms, and all of the correlation results of the frequency signal are greater than the threshold in the time period ms to ms; therefore, we confirm that the eastern secondary station detection is successful. The threshold calculations for the three frequency signals of the eastern secondary station are as follows:
The condition for the northern secondary station signal to be detected successfully.
When the correlation results of the frequency signal are all greater than the threshold in the time period ms to ms, all of the correlation results of the frequency signal are greater than the threshold in the time period ms to ms, and all of the correlation results of the frequency signal are greater than the threshold in the time period ms to ms; therefore, we confirm that the northern secondary station detection is successful. The threshold calculations for the three frequency signals of the northern secondary station are as follows:
The condition for the southern secondary station signal to be detected successfully.
When the correlation results of the frequency signal are all greater than the threshold in the time period ms to ms, all of the correlation results of the frequency signal are greater than the threshold T2 in the time period ms to ms, and all of the correlation results of the frequency signal are greater than the threshold in the time period ms to ms; therefore, we confirm that the southern secondary station detection is successful. The threshold calculations for the three frequency signals of the southern secondary station are as follows:
3. Results
In this section, we analyze the effectiveness and performance of the proposed detection method using simulations. We verify the detection method using an actual Alpha signal.
3.1. Method Validation
We verified the rationality and validity of the detection method through a simulation. The simulation signal included the master station and the western secondary station. The SNR of the master station is −5 dB, and the signal amplitude ratio of the master station to that of the west secondary is −9.5 dB. The proposed method was used to detect signals from the master station. Figure 5 shows the generated Alpha navigation signal waveform and spectrum diagram.
Figure 5 shows that although the time-domain waveform has been completely submerged in the noise, the spectrogram clearly shows the transmission signal of the two stations in different time periods. Subsequently, bandpass filtering was performed on the waveform and notch to extract the three frequency signals.
Figure 6 shows that the signal is more pronounced after applying the bandpass filter and that the noise is well suppressed. However, because the signal from the secondary station is relatively strong, the expected signal from the master station remains difficult to distinguish. Hence, we used three notch filters to extract the three frequency signals, and we used an orthogonal correlation to detect the master station signal.
Figure 7 shows the signals extracted by the notch filters and the correlation results. The three frequency signals were separated by notch filters, and obvious correlation peaks were obtained via the orthogonal correlation method. Since the signal extracted by the notch filter is a continuous wave signal of three frequencies, multiple values will exist in the detection, resulting in increasing detection errors. In addition to not aliasing, the orthogonal correlation of different frequency signals has a unique correlation peak. According to the threshold calculation method and the detection conditions of the master station described in Section 2.2.3, the positions of the three frequency signals of the master station can be accurately detected, thereby proving the effectiveness of the proposed method.
3.2. Anti-Noise Performance
The received Alpha navigation signal in space will carry noise, which will reduce the SNR of the signal, thus affecting signal detection. In general, Alpha receivers are required to be able to detect signals with an SNR greater than −10 dB. Therefore, we generate signals with −30 dB < SNR < 0 dB to obtain the detection probability of the detection method under different SNRs.
Figure 8 shows the signal detection probability under different SNRs. When the SNR is greater than −7 dB, the detection probability is 100%. Although the performance of the detection method decreases faster when the SNR is greater than −10 dB, the detection probability of the signal is exceeds 90%. Therefore, it is proven that the proposed method has good anti-noise performance. The proposed detection method can fulfill the requirement of Alpha navigation signal detection by receiver.
3.3. The Effect of Mutual Interference
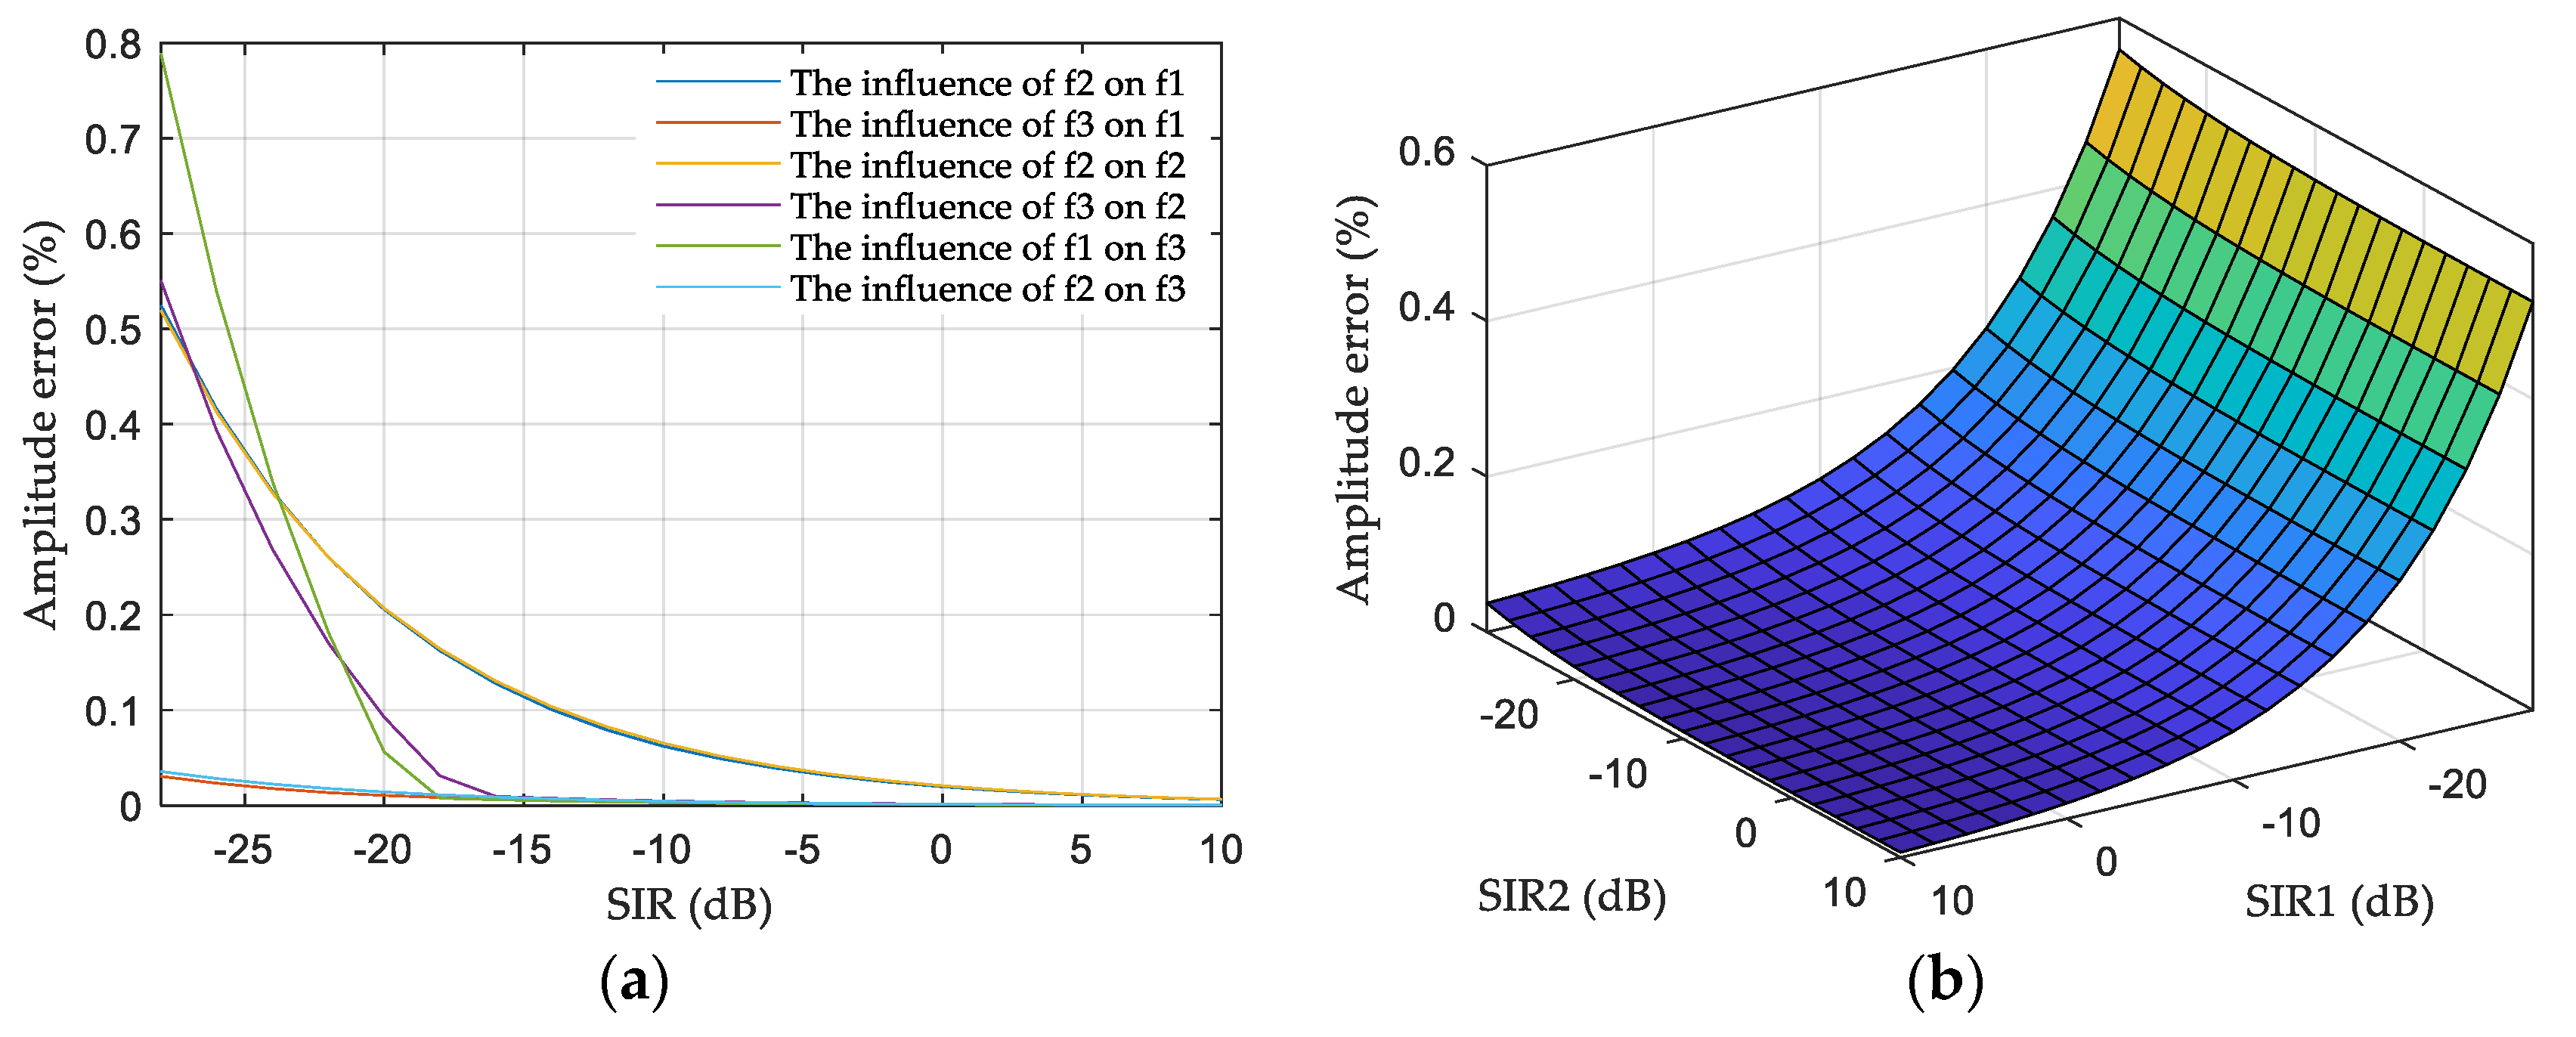
Mutual interference is the simultaneous reception of signals of different frequencies from different stations in an Alpha navigation system that interfere with the detection of the expected signal. When the expected detection signal and the mutual interference signal are received simultaneously, the mutual interference signal affects the waveform of the expected signal, which affects the amplitudes of the correlation peaks. According to the signal transmission time sequence of each station of the Alpha navigation system presented in Table 1, at most, three different frequency signals can be received simultaneously. Hence, when detecting the expected station, one or two mutual interference signals are received simultaneously. To comprehensively evaluate the detection ability of the proposed method under mutual interference, we analyzed the impact of one or two mutual interferences on the amplitude of the expected signal correlation peak. The range of the signal-to-interference ratio (SIR) between the expected signal and the interference signal is −28 dB to 10 dB.
Figure 9a shows the proportion of the correlated peak amplitude errors caused by any pairwise comparison of , , and . Figure 9b shows the proportions of the correlated peak amplitude errors caused by the and frequency signals to the frequency signal. The proportion of the correlation peak errors caused by interference among the three frequencies is less than 0.8%. The ratio of correlation peak errors caused by both and is less than 0.6%. Generally, when the SIR exceeds −28 dB, the influence of mutual interference on the correlation results of the expected signal is less than 1% by using the detection method proposed in this paper. Therefore, it is shown that the proposed detection method can suppress mutual interference and reduce the influence of mutual interference on the correlation peak of the expected signal.
3.4. Experimental Verification
We tested the detection method by receiving an Alpha navigation signal in space. Figure 10 shows the testing scheme. A magnetic antenna was used to receive the Alpha signal in space, and the radio frequency (RF) signal was amplified using the Alpha receiver. We used a high-speed data collection board to obtain the Alpha navigation signal received by the antenna. The detection method proposed in this study was used to process the collected Alpha digital signal.
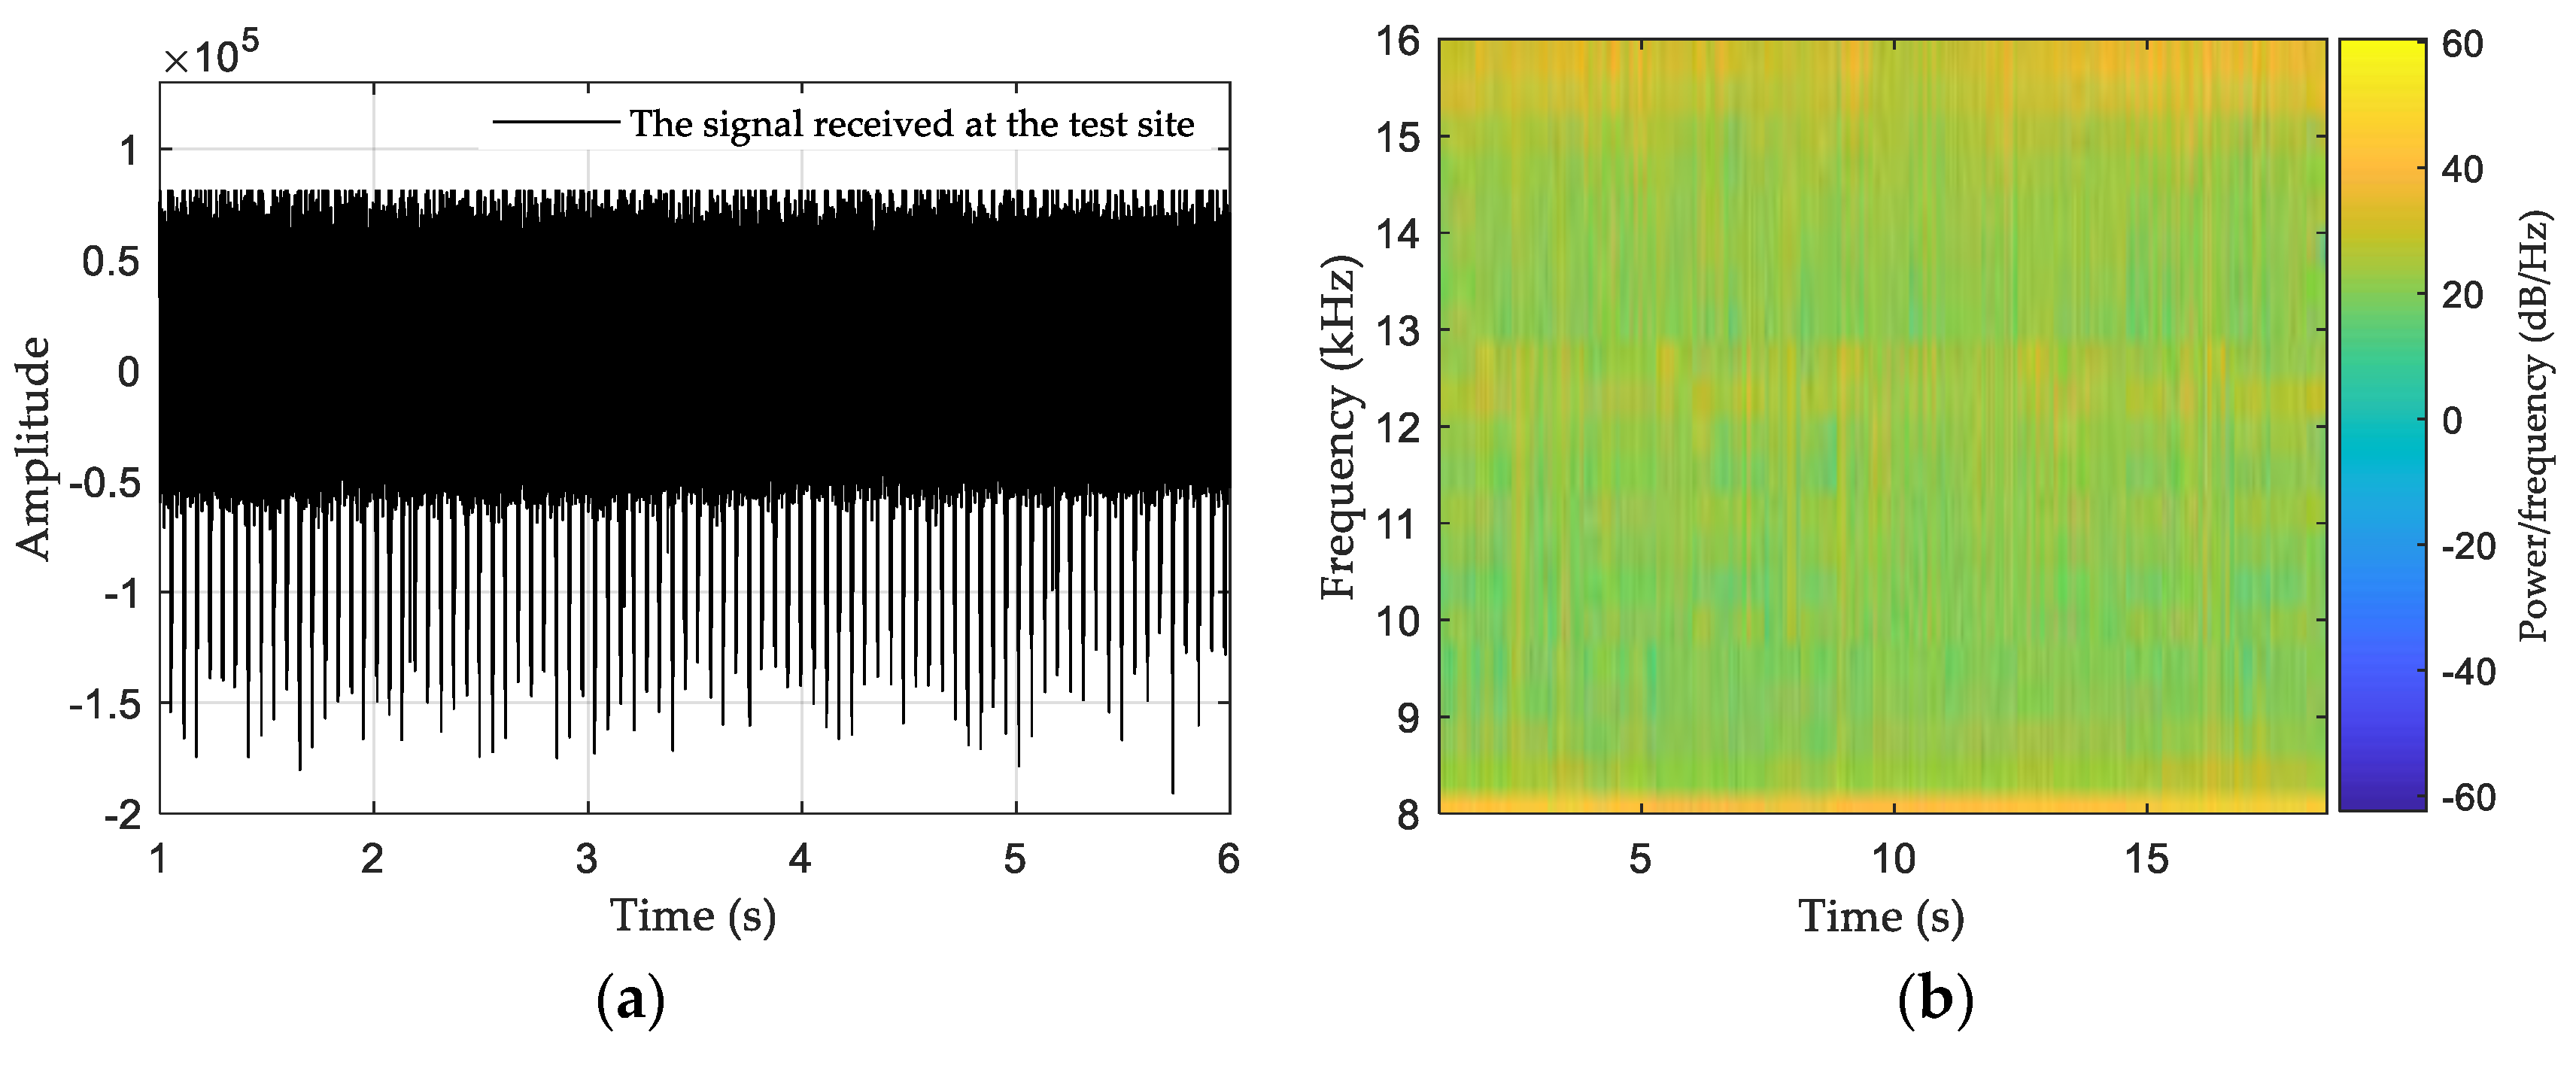
Since the Alpha navigation system was not transmitting signals at the time, we used the Alpha navigation signal collected in February 2019. The test site is located in Xi’an City, and its coordinates are (034°15′ N, 108°54′ E). The great circle distance of the test site from the eastern secondary station is 6640 km. Figure 11 shows the signal waveforms and spectrograms at the test site. The waveform diagram shows that the received signal is not only weak but also has many continuous wave and pulse interferences. Although the spectrogram can slightly distinguish the existence of an Alpha navigation signal, the signal is weak, meaning that the signal belongs to an extremely low SNR signal.
We used the proposed detection method to process the collected signals. Figure 12 shows the three frequency signals obtained after the notch and their correlation peaks. In Figure 12a, it can be observed that the notch filter can easily extract the three obvious frequency signals. In Figure 12b–d, the correlation peaks of the three frequency signals are sharp and obvious after orthogonal correlation. We used the threshold calculation method and the station sentence condition in Section 2.2.3 to detect the correlation peaks’ positions for the three frequency signals. The detection results show that the three correlation peaks adhere to the transmission order of the eastern secondary station signal, showing that the eastern secondary station detection is successful. In this section, the proposed method is verified by using real signals, and it is proven that the method proposed in this paper can detect extremely weak signals.
4. Discussion
The multichannel orthogonal correlation detection method proposed in this paper aims to tackle the problem of multi-station multi-frequency signal detection. Through simulation and actual measurement, it was shown that the proposed method can satisfy the detection of the Alpha navigation signal. The proposed method can be easily implemented on a field-programmable gate array (FPGA) digital chip, which changes the problem of signal detection and timing synchronization in an analog circuit of an Alpha navigation receiver. This method not only satisfies the requirement of alpha navigation signal detection, but also satisfies the strict requirement of timing in navigation and timing applications after it is implemented on an FPGA chip. Although this method is practical, the following two points can be further explored:
- (1)
- To pursue the practicability of the method, a classical bandpass filter was adopted in this study to suppress the noise. In future work, we can study the performance of the detection method using modern filtering techniques such as empirical mode decomposition and wavelet filtering. We believe that the application of these techniques will not only improve the anti-noise performance of the proposed method, but also make the phase measurement of the alpha navigation signal more accurate.
- (2)
- Although the detection method is proposed for the transmission characteristics of Alpha navigation signals, the three frequency signals of each station extracted by the notch filtering in the method can be used for the detection of signal parameters, and they meet the phase difference measurement of digital signals in the Alpha positioning receiver. Therefore, the detection method will be applied in research on signal parameter measurement and the positioning method of an Alpha receiver in the future.
5. Conclusions
When GNSS signals are rejected, VLF radio navigation and timing can be used as a supplement and backup. Since the Alpha navigation system is the only navigation system based on VLF signals worldwide, it can provide a good signal source for VLF timing and navigation research. A multichannel orthogonal correlation method for Alpha navigation signal detection was proposed to solve the problems of noise and mutual interference in Alpha navigation signal detection. We verified the practicability of the proposed detection method and analyzed the detection performance of the method under different noise and mutual interference conditions. The results showed that the probability of successful signal detection reached more than 90% when the SNR was greater than −10 dB. The influence of mutual interference on the correlation peak of the expected signal was less than 1% when the SIR exceeded −28 dB. Hence, the proposed Alpha navigation signal detection method exhibited good performance. Finally, we designed experiments to verify the detection method using actual signals. The measured signal is the signal of the eastern secondary station, which is 6600 km from the receiving point. The quality of the signal is also very poor, and we cannot distinguish the signal through the spectrum diagram. However, after processing using the proposed method, the detection of the eastern secondary station could be easily realized.
In addition to having good performance, the proposed detection method has a high application value and can be easily implemented on the hardware platform. It can fulfill the requirements of signal detection at the receiving end of navigation, timing, ionospheric research, etc. In the future, the performance of the detection method will be further improved through more advanced noise reduction processing.
Author Contributions
Conceptualization, W.Y. and S.L.; methodology, W.Y. and X.M.; validation, W.Y., S.L. and Y.S.; formal analysis, Y.S.; investigation, W.Y. and Y.S.; resources, J.Y.; data curation, W.Y. and J.Y.; writing—original draft preparation, W.Y.; writing—review and editing, W.Y. and Y.H.; visualization, J.Y. and X.M.; supervision, Y.H. and S.L.; project administration, W.Y. All authors have read and agreed to the published version of the manuscript.
Funding
This work was supported by the Chinese Academy of Sciences (CAS) “Light of West China” Program (Grant No. XAB2022YN19) and the Open Fund Program of the Laboratory of Science and Technology on Marine Navigation and Control, China State Shipbuilding Corporation (Grant No. 2023010106).
Institutional Review Board Statement
Not applicable.
Informed Consent Statement
Not applicable.
Data Availability Statement
Restrictions apply to the availability of these data. The ownership of the data belongs to the National Time Service Center (NTSC). These data can be available from the corresponding author with the permission of the NTSC.
Acknowledgments
The authors would like to thank their colleagues for testing the data provided in this manuscript. We are also very grateful to our reviewers who provided insights and expertise that greatly assisted the research.
Conflicts of Interest
Author Wenhe Yan was employed by the company China State Shipbuilding Corporation. The remaining authors declare that the re-search was conducted in the absence of any commercial or financial relationships that could be construed as a potential conflict of interest.
References
- Koronczay, D.; Lichtenberger, J.; Juhász, L.; Steinbach, P.; Hospodarsky, G. VLF Transmitters as tools for monitoring the plasmasphere. J. Geophys. Res. Space Phys. 2018, 123, 9312–9324. [Google Scholar] [CrossRef]
- Zhang, X.; Zhao, S.F.; Ruzhin, Y.; Liu, J.; Song, R. The spatial distribution features of three Alpha transmitter signals at the topside ionosphere. Radio Sci. 2017, 52, 653–662. [Google Scholar] [CrossRef]
- Zhima, Z.; Hu, Y.; Shen, X.; Chu, W.; Piersanti, M.; Parmentier, A.; Zhang, Z.; Wang, Q.; Huang, J.; Zhao, S. Storm-time features of the ionospheric ELF/VLF waves and energetic electron fluxes revealed by the China seismo-electromagnetic satellite. Appl. Sci. 2021, 11, 2617. [Google Scholar] [CrossRef]
- Qiu, M. Omega Navigation System, 1st ed.; China Communication Press: Beijing, China, 1978; pp. 1–15. [Google Scholar]
- Alexander, V.N.; Joseph, W. Radio systems for long-range navigation. In Aerospace Navigation Systems, 1st ed.; Wiley Online Library: Chichester, UK, 2016; pp. 110–138. [Google Scholar]
- Zhen, W.M.; Ding, C.C. Development status and trend of land-based radio navigation system. GNSS World China 2019, 44, 10–15. [Google Scholar] [CrossRef]
- Hu, A.P. Research on the development of land-based ultra-long-rang radio navigation. Navig. Position Timing 2018, 5, 1–6. [Google Scholar] [CrossRef]
- Gu, W.Y.; Chen, L.J.; Xia, Z.Y.; An, X.; Horne, R.B. Alpha transmitter signal reflection and triggered emissions. Geophys. Res. Lett. 2020, 47, e2020GL090165. [Google Scholar] [CrossRef]
- Gu, X.D.; Chen, H.; Wang, S.W.; Lu, Z.L.; Ni, B.B.; LI, G.J.; Cheng, W. Extraction of Alpha transmitter signals from single-station observations using the direction-finding method. China Technol. 2022, 65, 1727–1737. [Google Scholar] [CrossRef]
- Chen, Y.; Yang, G.; Ni, B.; Zhao, Z.; Gu, X.; Zhou, C.; Wang, F. Development of ground-based elf/vlf receiver system in wuhan and its first results. Adv. Space Res. 2016, 57, 1871–1880. [Google Scholar] [CrossRef]
- Yan, W.H.; Dong, M.; Li, S.F.; Yang, C.Z.; Yuan, J.B.; Hu, Z.P.; Hua, Y. An eloran signal cycle identification method based on joint time–frequency domain. Remote Sens. 2022, 14, 250. [Google Scholar] [CrossRef]
- Ren, S.H.; Lou, Y.L.; Yang, N.; Zheng, X.X.; Kang, S.L. Navigation warfare and its countermeasures. J. Navig. Position 2020, 8, 100–104. [Google Scholar] [CrossRef]
- Carrasco, P.; Cuesta, F.; Caballero, R.; Perez-Grau, F.J.; Viguria, A. Multi-Sensor fusion for aerial robots in industrial GNSS-denied environments. Appl. Sci. 2021, 11, 3921. [Google Scholar] [CrossRef]
- Offermans, G.; Bartlett, S.; Schue, C. Providing a Resilient Timing and UTC Service Using eLoran in the United States. Navig. J. Inst. Navig. 2017, 64, 339–345. [Google Scholar] [CrossRef]
- DARPA Developing Very Low Frequency (VLF) Systems to Provide GPS Like Position and Timing Technologies in Contested, Underwater and Underground Environments. Available online: https://idstch.com/technology/electronics/darpa-developing-gps-like-position-timing-technologies-contested-underwater-underground-environments/ (accessed on 11 October 2023).
- Strategy for the Department of Defense Position, Navigation and Timing (PNT) Enterprise. Available online: https://rntfnd.org/wp-content/uploads/DoD-PNT-Strategy.pdf (accessed on 28 December 2023).
- Gao, X.J. Aeronautical Radio Navigation System, 1st ed.; Jilin Science and Technology Press: Changchun, China, 2007; pp. 120–146. [Google Scholar]
- Peterson, B.; Gross, K.; Chamberlin, E.; Montague, T. Integrated CIS/VLF Omega receiver design. In Proceedings of the National Technical Meeting of the Institute of Navigation, San Diego, CA, USA, 27–29 January 1992; pp. 311–318. [Google Scholar]
- Chen, Y.P.; Ni, B.B.; Gu, X.D.; Zhao, Z.Y.; Yang, G.B.; Zhou, C.; Zhang, Y.N. First observations of low latitude whistlers using WHU ELF/VLF receiver system. Sci. China Technol. Sci. 2017, 60, 166–174. [Google Scholar] [CrossRef]
- Li, S.F.; Wang, Y.L.; Hua, Y.; Yuan, J.B. Loran-C signal fast acquisition method and its performance analysis. J. Electron. Inf. Technol. 2013, 35, 2175–2179. [Google Scholar] [CrossRef]
- Juhana, J. Phase Estimation in a Navigation Receiver. Master’ Thesis, Aalto University, Espoo, Finland, 11 April 2011. [Google Scholar]
- Elouaham, S.; Dliou, A.; Elkamoun, N.; Latif, R.; Said, S.; Zougagh, H.; ElKhadiri, K. Denoising electromyogram and electroencephalogram signals using improved complete ensemble empirical mode decomposition with adaptive noise. Indones. J. Electr. Eng. Comput. Sci. 2021, 23, 829–836. [Google Scholar] [CrossRef]
- Elouaham, S.; Nassiri, B.; Dliou, A.; Zougagh, H.; Kamoun, N.E.; Khadiri, K.E.; Said, S. Combination time-frequency and empirical wavelet transform methods for removal of composite noise in EMG signals. TELKOMNIKA Telecommun. Comput. Electron. Control. 2023, 21, 1373–1381. [Google Scholar] [CrossRef]
- Felski, A. The russian ALFA system in the context of the development of radio navigation in the 21st century. TransNav Int. J. Mar. Navig. Saf. Sea Transp. 2021, 15, 723–728. [Google Scholar] [CrossRef]
- Peterson, B.B. The Soviet VLF navigation system. In Proceedings of the National Technical Meeting of The Institute of Navigation, Phoenix, AZ, USA, 22–24 January 1991; pp. 455–463. [Google Scholar]
- Gu, W.; Chen, L.; Xia, Z.; Horne, R.B. Direct evidence reveals transmitter signal propagation in the magnetosphere. Geophys. Res. Lett. 2021, 48, e2021GL093987. [Google Scholar] [CrossRef]
- Akhmetov, O.I.; Belakhovsky, V.B.; Mingalev, I.V.; Mingalev, O.V.; Larchenko, A.V.; Suvorova, Z.V. About the propagation of RSDN-20 “Alpha” signals in the earth-ionosphere waveguide during geomagnetic disturbances. Radio Sci. 2022, 58, 1–19. [Google Scholar] [CrossRef]
- Yan, W.H.; Zhao, K.J.; Li, S.F.; Wang, X.H.; Hua, Y. Precise Loran-c signal acquisition based on envelope delay correlation method. Sensors 2020, 20, 2329. [Google Scholar] [CrossRef]
- Richard, G.L. Understanding Digital Signal Processing, 2nd ed.; Prentice Hall: Upper Saddle River, NJ, USA, 2004; pp. 411–416. [Google Scholar]
- Joshi, Y.V.; Roy, S.C.D. Design of IIR digital notch filters. Circuits Syst. Signal Process. 1997, 16, 415–427. [Google Scholar] [CrossRef]
- He, H.b.; Nie, J.W.; Xu, B.; Ou, G. Performance comparison of the unambiguous tracking techniques for high-order BOC Modulated signal. GNSS World China 2014, 39, 13–18. [Google Scholar] [CrossRef]
- Kong, S.H. High sensitivity and fast acquisition signal processing techniques for GNSS receivers from fundamentals to state-of-the-art gnss acquisition technologies. IEEE Signal Process. Mag. 2017, 34, 59–63. [Google Scholar] [CrossRef]
- Yang, M.H.; Wu, H.; Wang, Q.Q.; Zhao, Y.X.; Liu, Z.Y. A BeiDou signal acquisition approach using variable length data accumulation based on signal delay and multiplication. Sensors 2020, 20, 1309. [Google Scholar] [CrossRef]
- Geiger, B.C.; Vogel, C.; Soudan, M. Comparison between ratio detection and threshold comparison for GNSS acquisition. IEEE Trans. Aerosp. Electron. Syst. 2012, 48, 1172–1179. [Google Scholar] [CrossRef]
Figure 1.
Schematic diagram of Alpha navigation system distribution.

Figure 2.
Implementation process of detection method.

Figure 3.
Correlation peaks at different correlation lengths.

Figure 4.
Flow chart of Alpha navigation station identification.

Figure 5.
Alpha navigation signal. (a) Time-domain waveform. (b) Spectrogram.

Figure 6.
Signal after band-pass filtering. (a) Signal waveform. (b) Signal spectrogram.

Figure 7.
Notch filter results and signal detection results. (a) signal obtained via notch filter. (b) signal detection results. (c) signal obtained via notch filter. (d) signal detection results. (e) signal obtained via notch filter. (f) signal detection results.
Figure 7.
Notch filter results and signal detection results. (a) signal obtained via notch filter. (b) signal detection results. (c) signal obtained via notch filter. (d) signal detection results. (e) signal obtained via notch filter. (f) signal detection results.

Figure 8.
Detection probabilities under different SNR values.

Figure 9.
The proportion of the influence of mutual interference on the correlation peak of the expected station. (a) The amplitude error of a mutual interference condition. (b) The amplitude error of two mutual interference conditions.
Figure 9.
The proportion of the influence of mutual interference on the correlation peak of the expected station. (a) The amplitude error of a mutual interference condition. (b) The amplitude error of two mutual interference conditions.

Figure 10.
The testing scheme of the proposed detection method.

Figure 11.
Signal collected at test site. (a) Signal waveform. (b) Signal spectrogram.

Figure 12.
Notch filter and signal detection results of received signal. (a) Three frequency signals signal obtained via notch filter. (b) signal detection results. (c) signal detection results. (d) signal detection results.
Figure 12.
Notch filter and signal detection results of received signal. (a) Three frequency signals signal obtained via notch filter. (b) signal detection results. (c) signal detection results. (d) signal detection results.


Table 1.
Alpha navigation system broadcast signals and sequences.
| Station | The Transmission Sequence of a Frame Signal | Frequency | |||||
|---|---|---|---|---|---|---|---|
| Master | 0 | 0 | 0 | 0 = No broadcast | |||
| Western secondary | 0 | 0 | 0 | ||||
| Eastern secondary | 0 | 0 | 0 | ||||
| Northern secondary | 0 | 0 | 0 | ||||
| Southern secondary | 0 | 0 | 0 | ||||
Disclaimer/Publisher’s Note: The statements, opinions and data contained in all publications are solely those of the individual author(s) and contributor(s) and not of MDPI and/or the editor(s). MDPI and/or the editor(s) disclaim responsibility for any injury to people or property resulting from any ideas, methods, instructions or products referred to in the content. |
© 2024 by the authors. Licensee MDPI, Basel, Switzerland. This article is an open access article distributed under the terms and conditions of the Creative Commons Attribution (CC BY) license (https://creativecommons.org/licenses/by/4.0/).
Share and Cite
MDPI and ACS Style
Yan, W.; Li, S.; Ma, X.; Song, Y.; Yuan, J.; Hua, Y. Research on an Alpha Navigation Signal Detection Method Based on Multichannel Orthogonal Correlation. Appl. Sci. 2024, 14, 3620. https://0-doi-org.brum.beds.ac.uk/10.3390/app14093620
AMA Style
Yan W, Li S, Ma X, Song Y, Yuan J, Hua Y. Research on an Alpha Navigation Signal Detection Method Based on Multichannel Orthogonal Correlation. Applied Sciences. 2024; 14(9):3620. https://0-doi-org.brum.beds.ac.uk/10.3390/app14093620
Chicago/Turabian StyleYan, Wenhe, Shifeng Li, Xinze Ma, Yuhang Song, Jiangbin Yuan, and Yu Hua. 2024. "Research on an Alpha Navigation Signal Detection Method Based on Multichannel Orthogonal Correlation" Applied Sciences 14, no. 9: 3620. https://0-doi-org.brum.beds.ac.uk/10.3390/app14093620
Note that from the first issue of 2016, this journal uses article numbers instead of page numbers. See further details here.