Article

Improving Agility and Reactive Agility in Basketball Players U14 and U16 by Implementing Fitlight Technology in the Sports Training Process

1
Faculty of Physical Education and Mountain Sports, Transilvania University, 500068 Brasov, Romania
2
“Petru Maior” Faculty of Sciences and Letters, “George Emil Palade” University of Medicine Pharmacy Science and Technology, 540142 Targu Mures, Romania
*
Author to whom correspondence should be addressed.
Submission received: 1 April 2024 / Revised: 19 April 2024 / Accepted: 22 April 2024 / Published: 24 April 2024
(This article belongs to the Special Issue Advances in Performance Analysis and Technology in Sports)

Abstract

:
The main aim of this research was to evaluate the impact of the implementation of Fitlight technology in the process of sports training and motor assessment on the improvement in agility and reactive agility of junior basketball players. The age groups studied were under-14 (U14) and under-16 (U16). This study included 70 male basketball athletes, structured in two experimental groups: U14 (18 subjects) and U16 (17 subjects); two control groups: U14 (18 subjects) and U16 (17 subjects). Arithmetic averages of the anthropometric characteristics of the subject groups: experimental group U14: height 172.89 cm, weight 58.22 kg, BMI 19.56; control group U14: height 165.44 cm, weight 50.17 kg, BMI 18.53; experimental group U16: height 179.94 cm, weight 70.82 kg, BMI 20.35; control group U16: height 183.88 cm, weight 73.41 kg, BMI 20.83. An 18-week experimental program that integrates Fitlight technology in order to develop coordination and agility skills and corrective agility was implemented in the experimental groups. This study included six tests: T agility test, T agility test with ball, reactive T agility test, reactive T agility test with ball, Illinois agility test, and Illinois agility test with ball. The results of this study showed statistically significant progress between the initial and final testing for the experimental group, p < 0.05. The Cohen’s values of the experimental groups were above 0.8, which denotes a large effect size; for the control group, these sizes were small and medium. The comparative analysis of the experimental and control groups, U14 and U16, highlights significant statistical differences in favor of the experimental groups, for all the agility tests of this study. This study highlights the effectiveness of incorporating advanced training tools like Fitlight in sports training, particularly for young basketball players. This approach surpasses traditional methods in enhancing agility, suggesting a paradigm shift towards technology-integrated training in sports.

1. Introduction

The technique of the basketball game is in a continuous dynamic, being dependent on the level of physical training, the technical level of the players, and the sports experience. Current basketball is influenced by the contribution of information technology, the diversification of technological equipment adapted to the specifics of sports training, and the monitoring and evaluation process. Basketball is characterized by rapid and forceful motion in various directions, swift decelerations and directional shifts, along with leaps and intricate techniques in handling the ball [1,2,3]. During every phase of the game, athletes execute diverse technical and tactical plays that are significantly impacted by a range of physical abilities, including speed, agility, strength, and power [4,5]. Skill-related physical fitness consists of six parts: agility, balance, coordination, strength, speed, and reaction time [6,7,8]. Prior research indicates a substantial influence of physical skills on game performance [9]. The newest studies have highlighted the critical role of agility in actions with or without ball in basketball [10,11].
Agility is defined by a prolonged initiation of bodily movement and an alteration in direction, along with swift acceleration or rapid slowing down of physical responsiveness [1]. In basketball, agility stands as a crucial motor skill, with both offensive and defensive maneuvers primarily involving diverse and multidirectional movements [12]. Research has highlighted that the notion of agility is extensively debated among sports researchers [13,14,15]. Agility is an important component of psychomotricity, being the ability that is made up of motor coordination, mobility, and balance; agility consists of the ability to quickly change the direction of movement of the body or limbs according to different stimuli (visual, tactile, etc.) [1,13,14,15,16,17]. Understanding the concept of agility requires understanding its complexity and practical implications depending on the specifics of the sport practiced. [8,16,17,18]. The initiation of actions that require a change in direction of movement or execution must be correlated with the rapid and continuous changes of the game, determining a distinct form of agility that has been called reactive agility, as identified in numerous studies [18,19,20,21,22,23,24].
The concept “reactive agility” was coined to distinctly differentiate between the pre-planned speed of direction change and agility, which incorporates elements of perception and decision-making [25]. The distinction between agility and reactive agility lies in that agility relies on altering direction within a predetermined movement, while reactive agility pertains to the athlete’s capacity to respond to a visual stimulus without a fixed or preset movement pattern [20]. Reactive agility is characterized as sprints involving directional shifts triggered by a specific stimulus [25,26,27]. Hassan [8] further notes that reactive agility is a vital attribute for players in all positions within basketball.
Building on these insights into the critical role of reactive agility in basketball, we encounter the emergence of advanced training technologies like Fitlight technology [28]. These innovative tools are designed to enhance players’ responsiveness, aligning perfectly with the demands of the sport. Fitlight technology, for instance, introduces a unique approach to training, focusing on improving reaction times and decision-making under dynamic conditions [28,29,30,31]. The implementation of technologies in the sports training process by adapting exercises can determine the optimization of sports performance with a focus on improving reaction time, coordination, and ability to transform movements in relation to the technical requirements and dynamics of the basketball game [32,33,34]. In the last decade, light technologies and specialized intelligent sensors have appeared with applicability in basketball aimed at monitoring the physical and technical parameters of the players, among which we identify the following: Fitlight, BlazePod, and XLiGHT [35,36,37]. Comparing Fitlight technology with the other BlazePod and XLiGHT simulation technologies with applicability in basketball, we consider that the advantages would be ergonomics; reliability of the software; the irreplaceability and duration of the batteries; functional capabilities of the sensor (signal response); uploading, storing and synchronizing data; the availability of spot packages in sets of 4, 8, and 24 (the other systems have a maximum of eight sports); and the colorful variety of spot lighting (eight colors) compared to the other systems that only have two colors [34,37,38,39]. Compared to Fitlight, the use of BlazePod and XLiGHT technology in the process of evaluating physical abilities presents an instability in the interaction response time; Fitlight sensors have the fastest data auto-download time, etc. [35,39]. As for the limitations of Fitlight technology, the high price and greater weight of the sensors compared to other technologies have been identified [35,39]. Based on the previously mentioned considerations, we opted for the use of Fitlight technology in this study. The novel aspects of this study consist of the adaptation of the training methodology and the tools for evaluating the agility and reactive agility of the U14 and U16 junior basketball players through the implementation of Fitlight technology. Based on the previously mentioned arguments, we established the following aim of this study to evaluate the impact of the implementation of Fitlight technology in the process of sports training and motor assessment on the improvement in agility and reactive agility of junior basketball players. The hypothesis of this study started from the assumption that by implementing an experimental program of 18 weeks including exercises adapted to the game of basketball in which Fitlight technology is used, the agility and reactive agility of U14 and U16 basketball players can be improved.

2. Materials and Methods

2.1. Participants

This study focused on young, active basketball players who were part of the country’s junior men’s competition, more specifically, in the National Junior Championships in Romania. The age groups studied were under-14 (U14) and under-16 (U16). This study included a total of 70 male basketball athletes, structured in 2 experimental groups: U14 (18 subjects) and U16 (17 subjects); 2 control groups: U14 (18 subjects) and U16 (17 subjects). Arithmetic averages of the anthropometric characteristics of the subject groups: experimental group U14: height 172.89 cm, weight 58.22 kg, BMI 19.56; control group U14: height 165.44 cm, weight 50.17 kg, BMI 18.53; experimental group U16: height 179.94 cm, weight 70.82 kg, BMI 20.35; control group U16: height 183.88 cm, weight 73.41 kg, BMI 20.83. Inclusion criteria in this study: active athletes; clinically healthy; additional experience of at least 2 years for U14 and at least 4 years for U16; practicing the entire sports training program for the entire duration of this study; performing all the evaluation tests of the study, at the initial and final testing; during this study, each group (experiment and control) performed 4 training sessions per week; all study groups performed 3 physical and technical training sessions per week in which agility was an important objective; the content of the training was adapted to the particularities of age and level of sports training for U14 and U16. Participants in this study voluntarily engaged, having in adherence to the principles outlined in the Declaration of Helsinki.

2.2. Testing Procedure

Six tests were applied in this study to evaluate the agility of basketball players: T agility test, T agility test with ball, reactive T agility test, reactive T agility test with ball, Illinois agility test, and Illinois agility test with ball. All study groups—experiment and control (U14 and U16)—were evaluated through all 6 tests and under the same test conditions regarding the order of their performance, the number of trials (two trials were performed for each test and the best result was quantified), and the test period. The Fitlight technology was set the same for testing all groups.
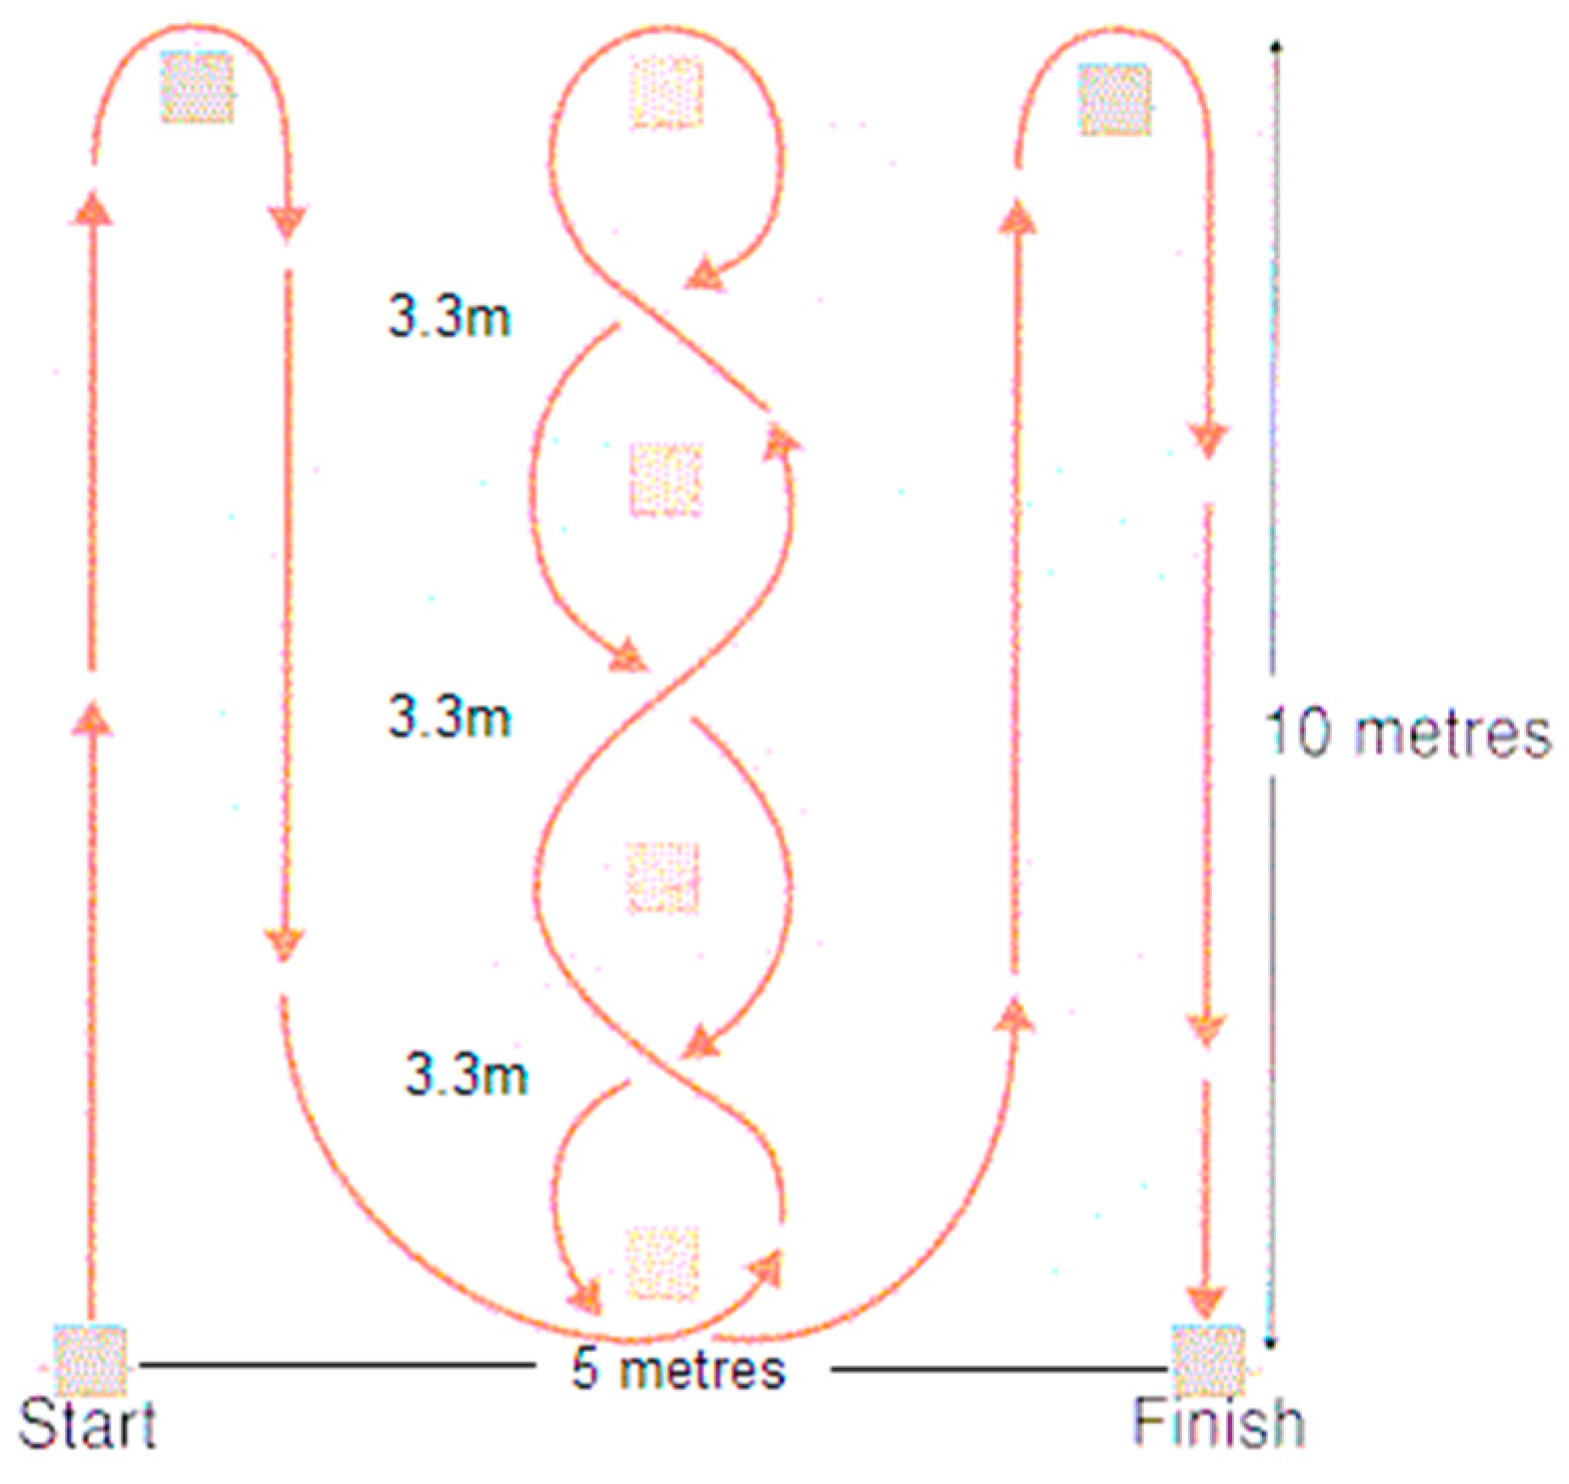
T Agility Test (standardized): This test required participants to perform a series of quick movements in a ‘T’-shaped pattern as described in Figure 1a. It was designed to evaluate their agility and speed without the use of any additional equipment and the tests validity for determining agility was approved by scientific research [40]. The athletes were timed (s) according to their ability to quickly perform the test in relation to the speed of foot execution and coordination ability. This agility test is very effective for basketball athletes due to the similarity between the test design and fundamental basketball movements [41,42].
T Agility Test with Ball: Similar to the T agility test, this variation added the complexity of dribbling a ball. Participants were required to maneuver through the ‘T’ pattern while maintaining control of the ball, testing their coordination between movement and ball-handling skills. This test is especially important since lateral dribble and dribbling the ball while moving backwards are important parts of basketball. The athletes were timed (s) according to their ability to quickly perform the test.
Reactive Agility T Test: This test incorporated the use of a Fitlight system placed on cones, like seen in Figure 1b. Athletes had to quickly react to light signals, rapidly changing direction in response. This version of the T agility test focused on the participants’ reaction time and agility, assessing their ability to respond to visual cues under time pressure. The Fitlight technology was set so that when the second spot (in the middle) is touched, randomly, one of the two spots arranged at the ends of the T, which indicates the direction of further travel, automatically lights up. Many researchers have studied reactive agility and developed new tests to measure it [14,43,44]; however, our distinctive way of modifying a standardized test by integrating Fitlight technology adds significant value to the field of research of reactive agility. The athletes were timed (s) according to their ability to quickly perform the test.
Reactive Agility T Test with Dribbling: Building upon the reactive agility T test, this test added the element of dribbling. Athletes were tasked with responding to the Fitlight signals while controlling the ball. The Fitlight technology was set so that when the second spot (in the middle) is touched, randomly, one of the two spots arranged at the ends of the T, which indicates the direction of further travel, automatically lights up. This test challenged their ability to combine agility, reaction time, and ball-handling skills under dynamic conditions. The athletes were timed (s) according to their ability to quickly perform the test.
Illinois Agility Test (standardized): This is a classic assessment that involves a series of quick turns and sprints around a rectangular formation. It measures the participants’ agility, speed, and flexibility, requiring them to perform the course in the shortest possible time. Research has demonstrated the effectiveness of this test in determining the agility levels of male team sport players [45]. The athletes were timed (s) according to their ability to quickly perform the test.
Illinois Agility Test with Ball (standardized): Athletes performed the Illinois Agility Test while dribbling the basketball (Figure 2). This addition tested their ability to maintain ball control under physically demanding conditions, blending agility and precision in ball handling, providing a comprehensive assessment of their skills while being agile [46]. The athletes were timed (s) according to their ability to quickly perform the test.
Figure 1. (a) T agility test; (b) T reactive agility test.
Applsci 14 03597 g001
Figure 2. Illinois agility test.
Applsci 14 03597 g002

2.3. Research Design

This study was structured as follows: initial testing was conducted from 7 to 11 August 2023; an experimental program was implemented to improve agility for 18 weeks; the final testing took place from 18 to 22 December 2023. The experimental program included exercises adapted for the use of Fitlight technology [28], in order to improve the agility of the players from the U14 and U16 experimental groups. The subjects from the U14 and U16 control groups practiced the classic sports training program without the use of equipment or other information technologies. The experimental program using Fitlight technology to improve the agility of the players in the U14 and U16 experimental groups was practiced 3 times/week for a duration of 60 min (after a specific 20 min warm-up). During this study, each group (experiment and control) performed 4 training sessions per week, of which 3 physical and technical training sessions per week out of the 4 training sessions per week were focused on improving agility under technical conditions specific to basketball. The content of the training was adapted to the particularities of age and level of sports preparation for U14 and U16.

2.4. Statistical Analysis

The statistical analysis was performed with the help of IBM-SPSS Statistics 26 and it includes descriptive statistics like the number of participants (N), minimum (Min), maximum (Max), mean, standard deviation (St. Dev.), variance, skewness, and coefficient of variation (CV); 95% confidence intervals, t-values, degrees of freedom (df), significance levels (Sig. 2-tailed), and Cohen’s effect size (r) were assessed for each test. These statistics were calculated, indicating the performance metrics in initial testing (It) and final testing (Ft). The statistical analysis also included paired t-tests (Student’s t-test), comparing the (It) and (Ft) in terms of their performance improvements in the same agility tests. Cohen’s was calculated to measure the effect size of the training program on the performance improvements in agility tests. The independent samples test tables provide additional insights. We calculated the Levene’s test for equality of variances and t-tests for equality of means, which were used to compare the initial and final performances between the experimental and control groups across our agility tests. For this study, the level of statistical probability was p < 0.05.

2.5. Training Procedure

The training program under discussion, which incorporated Fitlight technology, represents a comprehensive approach to enhancing both the specific basketball skills and the agility and coordination elements critical for player development. During each week, players engaged in three practices, wherein each session included the execution of five distinct drills drawn from the larger set of exercises as described in Figure 3. This design ensured consistent exposure and practice of various techniques, thereby allowing for the reinforcement of skills and the assimilation of coordination capabilities over the duration of the program. The categorization of exercises was dual-faceted, targeting both the enhancement of basketball skills and the development of coordinative elements.
Correspondingly, the coordinative elements fortified through the exercises comprised the following:
Hand–eye coordination (48 exercises): improving the synchrony between visual input and hand movement, crucial for all aspects of basketball;
Reaction time (58 exercises): focusing on decreasing latency between stimulus and response, an essential aspect for competitive play;
Balance (25 exercises): developing stability and control of body movements during gameplay;
Spatial orientation (20 exercises): enhancing the player’s awareness of their position relative to the court, opponents, and teammates;
Agility (24 exercises): increasing the ability to move quickly and easily, essential for both offensive and defensive strategies;
Capacity to combine movements (41 exercises): fostering the ability to perform multiple movements fluidly and effectively during training and basketball game.
The use of Fitlight technology across all exercises signified an innovative approach, providing real-time feedback and measurable data that could fine-tune player reactions, speed, and decision-making processes. This technology-driven methodology potentially allowed for a more engaging and quantifiable improvement in the players’ skill set. In summary, the program’s structured and multi-dimensional design aimed to elevate the athletes’ performance by intensively targeting the enhancement of fundamental basketball skills and by systematically improving their physical and coordinative abilities, thereby preparing them for the dynamic and demanding nature of competitive basketball.

3. Results

3.1. Descriptive Statistics

The descriptive statistics for the U14 experimental group in the (It) and (Ft) (Table 1) show that in the T agility test, initially, the mean time was 12.35 s with a standard deviation of 1.22 s, showing a moderate variability in performance. The final mean improved to 10.98 s, with a reduced standard deviation of 0.49 s, indicating more consistent performances post-training. The coefficient of variation (CV), which represents the ratio of the standard deviation to the mean, decreased from 9.88% to 4.46%, further evidencing improved consistency. In the T agility test with ball, the initial mean time was 17.13 s and the final mean was 13.61 s. The standard deviation decreased from 2.12 to 0.90, and the CV reduced from 12.38% to 6.61%, indicating enhanced performance and consistency in the final test. The trend of improved mean scores and reduced variability is also evident in other tests for the U14 experimental group, such as the T reactive agility test (initial mean: 14.28 s; final mean: 12.23 s); T reactive agility test with ball (initial mean: 19.61 s; final mean: 15.79 s); the Illinois agility test (initial mean: 17.83 s; final mean: 16.02 s); and the Illinois agility test with ball (initial mean: 20.41 s; final mean: 17.08 s). For the U14 control group, similar agility tests show less pronounced improvements. For the T agility test, the initial mean was 13.32 s, and the final mean was 13.09 s, with a slight increase in the CV from 7.36% to 8.10%. The Illinois agility test shows a similar pattern, with a modest decrease in mean time from 19.00 to 18.68 s, and a slight reduction in CV. Overall, the U14 experimental group shows more significant improvements in mean times and consistency (lower standard deviation and CV) across all agility tests compared to the U14 control group. This suggests that the training program of the experimental group was effective in enhancing agility and reactive agility (Table 1).
In Table 2, descriptive statistics for the U16 experimental and control groups in both initial (It) and final (Ft) phases of different agility tests are detailed. For the U16 Experimental group, improvements are seen in agility test performances from the initial to the final phase. In the T agility test, the initial mean time was 12.41 s with a standard deviation of 1.35, and this improved to a final mean of 11.08 s with a standard deviation of 0.76. The coefficient of variation (CV) also decreased from 10.88% to 6.86%, indicating increased consistency in performances. In the T agility test with a ball, the initial mean was 14.02 s, which improved to 12.25 s in the final test, with a decrease in standard deviation from 2.23 to 1.23 and a reduction in CV from 15.91% to 10.04%. Similar patterns of improvement are observed in the other tests like the T reactive agility test (initial mean: 13.77 s; final mean: 12.03 s), T reactive agility test with ball (initial mean: 15.99 s; final mean: 13.01 s), Illinois agility test (initial mean: 19.66 s; final mean: 18.45 s), and the Illinois agility test with ball (initial mean: 20.82 s; final mean: 18.87 s). These results indicate effective training, leading to better performance and consistency. For the U16 control group, the changes are less pronounced. In the T agility test, the initial mean time was 10.98 s and the final mean was 10.91 s, with a slight increase in CV from 3.28% to 3.39%. The Illinois agility test shows a similar pattern, with a small increase in mean time from 16.22 to 16.12 s and a slight rise in CV. Overall, the U16 experimental group shows more substantial improvements in performance and consistency across the agility tests compared to the U16 control group, as evidenced by reduced mean times and lower standard deviations and CVs.

3.2. T-Paired Student Test

As seen in Table 3, in the T agility test, the experimental group showed a significant mean improvement of 1.37 s, with a standard deviation of 0.86 s. The confidence interval ranged from 0.95 to 1.80 s, and the t-value was 6.79, indicating statistical significance with a p-value of 0.00. The effect size, measured by Cohen’s d, was large at 1.47. In contrast, the control group had a smaller mean improvement of 0.23 s, a standard deviation of 0.26 s, and a lower Cohen’s d of 0.23, reflecting a more modest effect. For the T agility test with a ball, the experimental group showed an even greater mean improvement of 2.05 s, with a standard deviation of 0.92 s and a Cohen’s d of 1.61, indicating a large effect size. The control group, however, had a mean improvement of 0.34 s and a Cohen’s d of 0.33, which is substantially smaller compared to the experimental group. In the T reactive agility test, the experimental group’s improvement was striking, with a mean difference of 3.52 s, a high Cohen’s d of 2.16, signifying a very large effect size. The control group had a modest improvement with a mean difference of 0.53 s and a Cohen’s d of 0.26. Similarly, in the T reactive agility test with a ball, the experimental group showed a substantial mean improvement of 3.82 s and a very high Cohen’s d of 2.51. The control group’s improvement was less significant, with a mean difference of 0.45 s and a lower Cohen’s d of 0.17. The Illinois agility test results followed a similar pattern. The experimental group improved by a mean of 1.81 s, with a Cohen’s d of 1.56, while the control group showed a smaller mean improvement of 0.32 s and a Cohen’s d of 0.25. Finally, in the Illinois agility test with a ball, the experimental group had a significant mean improvement of 3.32 s and a high Cohen’s d of 1.85. The control group’s improvement was 0.39 s on average, with a Cohen’s d of 0.27. Overall, these results demonstrate that the experimental group exhibited significantly greater improvements in agility test performances compared to the control group. This is indicated by the larger mean differences, lower p-values, and higher effect sizes in the experimental group for all the agility tests. The substantial differences in Cohen’s d values between the experimental and control groups across all tests highlight the effectiveness of the training or intervention provided to the experimental group.
In Table 4, for the U16 experimental group, significant improvements were noted across all tests. In the T agility test, the mean difference between It and Ft was 1.33 s, with a Cohen’s D of 1.21, indicating a substantial effect. The T agility test with a ball also showed a notable mean difference of 1.74 s and a Cohen’s D of 1.28. In the T reactive agility test, the experimental group improved by 1.77 s, while the improvement in the test with a ball was even greater, at 2.98 s. These changes correspond to Cohen’s D values of 0.98 and 1.13, respectively. The Illinois agility test and the version with a ball also showed significant improvements, with mean differences of 1.21 and 1.95 s and Cohen’s D values of 1.18 and 1.54, respectively. Comparatively, the U16 control group exhibited minimal improvements. The T agility test and its variation with a ball showed mean improvements of only 0.07 and 0.04 s, and Cohen’s D values of 0.19 and 0.11, respectively. The T reactive agility test and its ball variation had mean differences of 0.10 s each, with Cohen’s D values of 0.17 and 0.14. Similarly, the Illinois agility test and its ball variant showed slight improvements with mean differences of 0.10 s and corresponding Cohen’s D values of 0.10 and 0.11. These results underscore the significantly greater improvements in agility and coordination for the U16 experimental group compared to the control group, as evidenced by the higher mean differences and Cohen’s D values in the experimental group. The control group’s minimal improvements suggest a lower impact of the training or natural development over the same period.

3.3. Independent Samples T test

In Table 5, the independent samples T test for the U14 age group compares the performance of the experimental (GE) and control (GC) groups in both initial (It) and final (Ft) phases across various agility tests. For the T agility test at the initial phase, Levene’s test shows no significant difference in variances between groups (F = 0.68; p = 0.42), allowing for a standard t-test. The t-test indicates a significant mean difference of −0.97 s (t = −2.64; p = 0.01) favoring the experimental group. The final phase of the T agility test shows a larger mean difference of −2.12 s (t = −7.67; p < 0.001), suggesting more pronounced improvements in the experimental group. In the T agility test with ball, both initial and final phases show significant mean differences between the groups. The initial mean difference is −1.48 s (t = −2.15; p = 0.04), while the final mean difference is −4.48 s (t = −8.56; p < 0.001), again indicating a larger impact of the training in the experimental group. For the T reactive agility test, the initial phase shows a mean difference of −0.89 s (t = −1.99; p = 0.06), and the final phase a mean difference of −2.61 s (t = −8.39; p < 0.001). The T reactive agility test with a ball has initial and final mean differences of −1.88 s (t = −2.51; p = 0.02) and −5.26 s (t = −7.87; p < 0.001), respectively. The Illinois agility test also shows significant differences. The initial mean difference is −1.17 s (t = −2.46; p = 0.02), and the final difference is −2.65 s (t = −8.41; p < 0.001). In the Illinois agility test with a ball, the final phase shows a substantial mean difference of −3.62 s (t = −9.44; p < 0.001), while the initial phase difference is not statistically significant. These results indicate that for most agility tests, the U14 experimental group significantly outperformed the control group, both in initial capabilities and improvements over time. The differences in final performances are particularly pronounced, highlighting the effectiveness of the training or interventions experienced by the experimental group.
Table 6, the interpretation, considering the initial better preparation of the control group and the subsequent catch-up by the experimental group, reveals significant insights. Initially, in the T agility test, the experimental group was significantly outperformed by the control group, as indicated by a mean difference of 1.43 s and a significant t-value of 4.22. However, by the final phase, this gap narrowed considerably, with a non-significant mean difference of only 0.17 s, suggesting that the experimental group caught up effectively. A similar trend is observed in the T agility test with a ball. Initially, the control group led by a significant 1.99 s, but this difference was reduced to a non-significant 0.33 s in the final phase, again illustrating the substantial improvements made by the experimental group. In the T reactive agility test and its ball variant, the initial performance gaps were 2.01 and 3.56 s, respectively, favoring the control group. By the final phase, these differences decreased to 0.31 and 0.69 s. Although these final phase differences were still significant, the reduced gaps indicate considerable progress by the experimental group. The Illinois agility test results reinforce this pattern. The initial phase showed the control group leading by 3.44 and 3.98 s in the standard and ball variants, respectively. By the final phase, these differences reduced to 2.33 and 2.14 s. Although the experimental group did not completely close the gap, the significantly reduced differences in the final phase demonstrate their marked improvement.
Overall, these results highlight two key points: the control group’s initial superior performance, likely due to their better preparation, and the experimental group’s notable catch-up by the final testing. The experimental group’s significant improvements across all agility tests suggest the effectiveness of their training program in enhancing agility skills to a level comparable with a initially more prepared control group.
For the U14 category, the experimental group consistently showed significant improvements over the control group in both initial and final phases of the agility tests (Table 6). This trend was evident across various tests, such as the T agility test and the Illinois agility test, with the experimental group not only starting with better performances but also gaining more from the training or interventions. The results suggest a uniform and effective impact of the training program on the U14 experimental group, leading to significant improvements in agility and performance. In contrast, the U16 category presented a different scenario. Initially, the control group was significantly better prepared, as evidenced by their higher qualifications in the national championship. This initial superiority was reflected in the agility tests, where the control group had better performances in the initial phases. However, as the training progressed, the experimental group made substantial gains, effectively catching up to the control group by the final testing. For example, in the T agility test with a ball, the experimental group initially lagged behind but demonstrated significant improvements, reducing the performance gap by the final phase. This catch-up indicates the effectiveness of the training program in enhancing the agility skills of the U16 experimental group, despite the control group’s initial advantage. Both age groups illustrate the positive impact of targeted training programs on agility and performance. While the U14 experimental group showed consistent superiority over the control group, the U16 experimental group’s ability to catch up despite an initially better-prepared control group highlights the effectiveness of the training in leveling the playing field and enhancing performance competencies (Table 6).

4. Discussion

In our study, we focused on evaluating the impact of the implementation of Fitlight technology in the process of sports training and motor assessment on the improvement in agility and reactive agility of junior basketball players. The results of this study reflect significant progress in the experimental group between the final and initial testing. Likewise, the progress in the experimental group was statistically significantly superior to that of the control group, which proves that the implementation of the experimental program in which we used Fitlight technology was effective for both categories of U14 and U16 basketball players. The results of our study confirm the hypotheses of previous studies and contribute to the expansion of knowledge regarding the impact of Fitlight technology on improving agility by implementing an experimental program in which specific basketball exercises were adapted to this technology [30,31,32,33,34]. Analyzing recent research, we identified a series of studies with aligning our study and its relevant results [8,47,48]. Hassan [8] delves into the efficacy of the Fitlight Training System in improving agility and performance in young basketball players. The common thread is their focus on the innovative use of technology—specifically, the Fitlight system—to enhance agility and overall athletic performance, underscoring a burgeoning interest in incorporating technological tools in sports training regimes. We provide a broader view of agility’s role in basketball, examining the impact of Fitlight training on overall agility and comparing it with traditional training methods. This comparative approach gives a comprehensive understanding of how traditional training measures up against more technologically advanced methods. In our study, we approached the development of agility through the use of information technologies on different age groups, U14 and U16. In contrast, Hassan [8] narrows its focus, concentrating on the specific impacts of reactive agility exercises on visual reaction time and dribbling skills, adding depth to our understanding of how Fitlight training can target and enhance specific skills crucial for basketball. In our study, the development of agility is approached through the use of information technologies for different age groups. In comparison, Hassan [8] focuses on a single group’s improvement in specific skills, providing a detailed look at the system’s potential to enhance particular aspects of a player’s performance. In summary, while both underscore the beneficial role of Fitlight training in improving agility and performance among young basketball players, we bring additional value by comparing the new method with traditional training techniques and offering a more diversified analysis across age groups. This comparative and comprehensive approach not only affirms the advantages of using advanced technology in sports training but also broadens our understanding of its application and effectiveness in developing young athletes.
While our study offers a broad analysis of the Fitlight system across various age groups in basketball, Hadzovic [49] zooms in on a specific segment of athletes, highlighting a targeted approach in agility training for professional female basketball players. It introduces innovative protocols for evaluating non-reactive agility, a component crucial in basketball but often less highlighted; in contrast, our contribution lies in our comparative analysis of traditional and modern training methods across various age groups, offering a broader perspective on agility training efficacy in youth basketball.
While Bekris [50] lays the theoretical groundwork for understanding and measuring agility across different sports, we take it a step further by applying this understanding in a practical training context, using Fitlight technology. Our exploration of Fitlight training provides evidence of the potential benefits of embracing technological advancements in sports training regimes, particularly for the youth. This aligns with the agility demands identified by Bektris [50] and suggests a progressive approach to enhancing agility, which could be beneficial across various sports beyond basketball. Building on the theoretical underpinnings and practical applications of agility training, the study by Silvestri [51] complements our findings by delving into the cognitive aspects and training complexities, offering a holistic view of athlete development. Silvestri [51] highlights the multifaceted benefits of Fitlight training, but also draws attention to the complexities involved in effectively integrating technology into sports training exploring the cognitive dimensions and the intricacies of training duration and its effectiveness. This combined knowledge can guide coaches and sports scientists in designing training programs that are not only physically demanding but also cognitively stimulating, thereby preparing young athletes more holistically. Incorporating both physical and cognitive training elements, as highlighted by Silvestri [51], our study resonates with Lucia’s [52] research, which explores a multifaceted training approach in elite basketball, while we distinctly focus on the impact of Fitlight training on younger athletes. Lucia [52] explores a multicomponent training approach in elite basketball players, emphasizing sprinting, agility, and decision-making while we distinctively contribute to the field by specifically evaluating the effects of Fitlight training on the agility of junior basketball players, compared directly to traditional methods. This emphasis on the younger demographic is crucial, offering insights into the developmental aspects of sports training. Furthermore, our detailed statistical analysis of various agility tests before and after the training regimen not only underlines the efficacy of modern training tools but also provides a nuanced understanding of their impact on young athletes, making it a valuable resource for those working in youth sports coaching and training.
Our comprehensive analysis across multiple studies reveals a significant trend towards the integration of advanced technology, like the Fitlight Training System, in sports training, particularly for youth basketball. While studies like Hassan’s [8] focus on specific skill enhancements and Hadzovic’s [49] on professional female athletes, our research broadens the spectrum by comparing traditional and modern methods across various age groups. This holistic approach, enriched by theoretical insights from Bekris [50] and cognitive perspectives from Silvestri [51], underscores the multifaceted benefits of such training. The integration of physical agility improvements with cognitive development, as seen in our study and Lucia’s [52], not only demonstrates the efficacy of these modern training tools but also opens new avenues for developing more comprehensive training programs.
This evolution in training methodologies has the potential to significantly impact the development of young athletes, preparing them more effectively for the demands of competitive sports [53,54,55,56,57]. In accordance with the trends of modernization and technology of sports training, we consider that in order to identify the theoretical and practical methodological aspects, an interdisciplinary approach is necessary in order to improve sports performances [58,59,60,61,62].
As practical implications, we consider that the use of Fitlight technologies represents an attractive and reliable alternative to classic exercises with only the ball, both in the preparation process and in the assessment of physical and technical skills specific to basketball. The implementation of Fitlight technology facilitates the improvement of physical and technical skills based on the development of the athletes’ visual skills to bright and colorful stimuli. The implementation of Fitlight technology, which uses bright spots in the training program for basketball athletes, facilitates the versatility and dynamics of training, contributing to improving agility based on the development of stimulus receptivity, hand–eye and foot–eye coordination, and motor control, which are essential for the formation of a athlets. The workouts that use Fitlight technology benefit from real-time feedback regarding the monitoring of reaction time parameters, agility, coordination, etc. The reliability and diversified ways of using Fitlight technology allow for its use depending on the training requirements and the characteristics of the practiced sport, with the technology being adaptable to most sports. Based on the results of our study, we believe that the use of Fitlight technology contributes to the efficiency of agility training and to increasing the attractiveness of basketball training, which can be adapted to most sports.
Strengths of this study: adaptation of an experimental program by implementing Fitlight technology; adaptation of motor assessment tests by implementing Fitlight technology; designing 24 exercises using Fitlight technology and incorporating them into the experimental sports training program; the inclusion in the study and the comparative analysis of the results of the agility tests for two categories of subjects depending on the age characteristics of U14 and U16 players.
Limitations of this study: the inclusion of only groups of boys; limiting the study only to the analysis of agility tests, without including other coordinating components; relatively small number of subjects; implementation of the training program only for a duration of 18 weeks; female samples were not included in this study; agility was not tested under competitive conditions, in official games; only Fitlight was used in this study and no other smart technologies or sensors were used; training methodologies should implement diversified and specialized technologies on the development of physical and technical training components in basketball.

5. Conclusions

The relevant results of this study demonstrate that in all tests of agility and reactive agility, the experimental groups U14 and U16 recorded superior and statistically significant progress compared to the control groups U14 and U16. Our study revealed significant improvements in the dribbling skills of the players in the experimental groups on the support provided by agility development, thus contributing to the optimization of the basketball players’ performance. Our study emphasizes the impact of the Fitlight technology implemented in the training methodology of basketball players. The implementation of information technologies adapted to the characteristics of training and competition in basketball will contribute to the improvement of the physical and technical performance potential of players and to the achievement of sports mastery. Future studies may be aimed at identifying the way in which the implementation of information technologies adapted to the particularities of different sports will contribute to the improvement of the motor capacity and technical skills of different categories of athletes, depending on the level of training and the specifics of the sports practiced.

Author Contributions

Conceptualization, N.S., D.B. and A.B.; methodology, N.S., D.B. and A.B.; formal analysis, N.S., D.B. and A.B.; writing—original draft preparation, N.S., D.B. and A.B.; writing—review and editing, N.S., D.B. and A.B. All authors have read and agreed to the published version of the manuscript.

Funding

This research received no external funding.

Institutional Review Board Statement

This study was conducted in accordance with the Declaration of Helsinki, and approved on 11/1 October 2021 by Transilvania University of Brasov, Romania.

Informed Consent Statement

Oral informed consent to participate in this study was provided by the participants.

Data Availability Statement

The original contributions presented in the study are included in the article, further inquiries can be directed to the corresponding author.

Acknowledgments

This study is part of Steff Norber’s doctoral thesis, under the supervision of Dana Badau, within the Interdisciplinary Doctoral School of Transilvania University in Brasov, Romania.

Conflicts of Interest

The authors declare no conflicts of interest.

References

  1. Versic, S.; Pehar, M.; Modric, T.; Pavlinovic, V.; Spasic, M.; Uljevic, O.; Corluka, M.; Sattler, T.; Sekulic, D. Bilateral Symmetry of Jumping and Agility in Professional Basketball Players: Differentiating Performance Levels and Playing Positions. Symmetry 2021, 13, 1316. [Google Scholar] [CrossRef]
  2. Cui, Y.; Liu, F.; Gómez, M.Á. Key anthropometric and physical determinants for different playing positions during National Basketball Association draft combine test. Front. Psychol. 2019, 10, 2359. [Google Scholar] [CrossRef] [PubMed]
  3. Abdelkrim, N.B.; Chaouachi, A.; Chamari, K.; Chtara, M.; Castagna, C. Positional role and competitive-level differences in elite-level men’s basketball players. J. Strength Cond. Res. 2010, 24, 1346–1355. [Google Scholar] [CrossRef] [PubMed]
  4. Fort-Vanmeerhaeghe, A.; Montalvo, A.; Latinjak, A.; Unnithan, V. Physical characteristics of elite adolescent female basketball players and their relationship to match performance. J. Hum. Kinet. 2016, 53, 167–178. [Google Scholar] [CrossRef] [PubMed]
  5. Hoare, D.G. Predicting success in junior elite basketball players—The contribution of anthropometic and physiological attributes. J. Sci. Med. Sport 2000, 3, 391–405. [Google Scholar] [CrossRef] [PubMed]
  6. Zou, L. Relationship between functional movement screening and skill-related fitness in college students. Age 2016, 20, 2–062016. [Google Scholar]
  7. Jami, S.; Irandoust, K. Improving agility performance among athletes by Jami Agility Table (JAT). Int. J. Sport Stud. Health 2022, 5, 1–5. [Google Scholar] [CrossRef]
  8. Hassan, A.K.; Alhumaid, M.M.; Hamad, B.E. The effect of using reactive agility exercises with the FITLIGHT training system on the speed of visual reaction time and dribbling skill of basketball players. Sports 2022, 10, 176. [Google Scholar] [CrossRef] [PubMed]
  9. Hoffman, J.R.; Tenenbaum, G.; Maresh, C.M.; Kraemer, W.J. Relationship between athletic performance tests and playing time in elite college basketball players. J. Strength Cond. Res. 1996, 10, 67–71. [Google Scholar]
  10. Horníková, H.; Zemková, E. Determinants of Y-Shaped Agility Test in Basketball Players. Appl. Sci. 2022, 12, 1865. [Google Scholar] [CrossRef]
  11. Čaušević, D.; Čović, N.; Abazović, E.; Rani, B.; Manolache, G.M.; Ciocan, C.V.; Zaharia, G.; Alexe, D.I. Predictors of Speed and Agility in Youth Male Basketball Players. Appl. Sci. 2023, 13, 7796. [Google Scholar] [CrossRef]
  12. Abdelkrim, N.B.; El Fazaa, S.; El Ati, J. Time–motion analysis and physiological data of elite under-19-year-old basketball players during competition. Br. J. Sports Med. 2007, 41, 69–75. [Google Scholar] [CrossRef]
  13. Sheppard, J.M.; Young, W.B.; Doyle, T.L.A.; Sheppard, T.A.; Newton, R.U. An evaluation of a new test of reactive agility and its relationship to sprint speed and change of direction speed. J. Sci. Med. Sport 2006, 9, 342–349. [Google Scholar] [CrossRef] [PubMed]
  14. Delextrat, A.; Grosgeorge, B.; Bieuzen, F. Determinants of performance in a new test of planned agility for young elite basketball players. Int. J. Sports Physiol. Perform. 2015, 10, 160–165. [Google Scholar] [CrossRef]
  15. Sekulic, D.; Pehar, M.; Krolo, A.; Spasic, M.; Uljevic, O.; Calleja-González, J.; Sattler, T. Evaluation of Basketball-Specific Agility: Applicability of Preplanned and Nonplanned Agility Performances for Differentiating Playing Positions and Playing Levels. J. Strength Cond. Res. 2017, 31, 2278–2288. [Google Scholar] [CrossRef]
  16. Vukasevic, V.; Mitrovic, M.; Masanovic, B. A comparative study of motor ability between elite basketball players from different regions. Sport Mont 2020, 18, 3–7. [Google Scholar] [CrossRef]
  17. Young, W.B.; Dawson, B.; Henry, G.J. Agility and change-of direction speed are independent skills: Implications for training for agility in invasion sports. Int. J. Sports Sci. Coach. 2015, 10, 159–169. [Google Scholar] [CrossRef]
  18. Chatzopoulos, D.; Galazoulas, C.; Patikas, D.; Kotzamanidis, C. Acute effects of static and dynamic stretching on balance, agility, reaction time and movement time. J. Sports Sci. Med. 2014, 13, 403. [Google Scholar]
  19. Hoffman, J.R. Evaluation of a reactive agility assessment device in youth football players. J. Strength Cond. Res. 2020, 34, 3311–3315. [Google Scholar] [CrossRef]
  20. McNeil, D.G.; Spittle, M.; Mesagno, C. Imagery training for reactive agility: Performance improvements for decision time but not overall reactive agility. Int. J. Sport Exerc. Psychol. 2021, 19, 429–445. [Google Scholar] [CrossRef]
  21. Horicka, P.; Simonek, J. Age-related changes of reactive agility in football. Phys. Act. Rev. 2021, 1, 16–23. [Google Scholar] [CrossRef]
  22. Popowczak, M.; Cichy, I.; Rokita, A.; Domaradzki, J. The relationship between reactive agility and change of direction speed in professional female basketball and handball players. Front. Psychol. 2021, 12, 708771. [Google Scholar] [CrossRef]
  23. Latorre, E.C.; Zuniga, M.D.; Arriaza, E.; Moya, F.; Nikulin, C. Automatic registration of footsteps in contact regions for reactive agility training in sports. Sensors 2020, 20, 1709. [Google Scholar] [CrossRef]
  24. Horička, P.; Šimonek, J.; Paška, Ľ. Relationship between reactive agility, cognitive abilities, and intelligence in adolescents. J. Phys. Educ. Sport 2020, 20, 2263–2268. [Google Scholar] [CrossRef]
  25. Scanlan, A.; Humphries, B.; Tucker, P.S.; Dalbo, V. The influence of physical and cognitive factors on reactive agility performance in men basketball players. J. Sports Sci. 2014, 32, 367–374. [Google Scholar] [CrossRef] [PubMed]
  26. Brughelli, M.; Cronin, J.; Levin, G.; Chaouachi, A. Understanding change of direction ability in sport: A review of resistance training studies. Sports Med. 2008, 38, 1045–1063. [Google Scholar] [CrossRef]
  27. Salaj, S.; Markovic, G. Specificity of jumping, sprinting, and quick change-of-direction motor abilities. J. Strength Cond. Res. 2011, 25, 1249–1255. [Google Scholar] [CrossRef]
  28. Fitlight Tehnology. Available online: https://www.fitlighttraining.com/products/fitlight-system (accessed on 20 January 2024).
  29. Badau, D.; Badau, A. Optimizing Reaction Time in Relation to Manual and Foot Laterality in Children Using the Fitlight Technological Systems. Sensors 2022, 22, 8785. [Google Scholar] [CrossRef] [PubMed]
  30. Hastürk, G.; Akyıldız Munusturlar, M. The Effects of Exergames on Physical and Psychological Health in Young Adults. Games Health J. 2022, 11, 425–434. [Google Scholar] [CrossRef]
  31. Badau, D.; Badau, A.; Ene-Voiculescu, C.; Larion, A.; Ene-Voiculescu, V.; Mihaila, I.; Fleancu, J.L.; Tudor, V.; Tifrea, C.; Cotovanu, A.S.; et al. The Impact of Implementing an Exergame Program on the Level of Reaction Time Optimization in Handball, Volleyball, and Basketball Players. Int. J. Environ. Res. Public Health 2022, 19, 5598. [Google Scholar] [CrossRef]
  32. Cheng, Y.; Liang, X.; Xu, Y.; Kuang, X. Artificial Intelligence Technology in Basketball Training Action Recognition. Front. Neurorobot. 2022, 16, 819784. [Google Scholar] [CrossRef] [PubMed]
  33. Hong, X. Kinect and Few-Shot Technology-Based Simulation of Physical Fitness and Health Training Model for Basketball Players in Plateau Area. Comput. Intell. Neurosci. 2022, 2022, 2256522. [Google Scholar] [CrossRef] [PubMed]
  34. Chi, Y.; Li, J. Concrete Application of Computer Virtual Image Technology in Modern Sports Training. Comput. Intell. Neurosci. 2022, 2022, 6807106. [Google Scholar] [CrossRef] [PubMed]
  35. Ezhov, A.; Zakharova, A.; Kachalov, D. Modern Light Sport Training Systems: Critical Analysis of Their Construction and Performance Features. In Proceedings of the 9th International Conference on Sport Sciences Research and Technology Support, Online, 28–29 October 2021; pp. 123–129. [Google Scholar] [CrossRef]
  36. Çağin, M.; Polat, S.Ç.; Orhan, Ö.; Çetin, E.; Abdioğlu, M.; Yarim, İ.; Cicioğlu, H.İ. Reliability and Validity of ÇAĞIN Hand and Foot Reaction Tests Protocol. J. Educ. Future 2024, 25, 59–74. [Google Scholar] [CrossRef]
  37. Bădescu, D.; Zaharie, N.; Stoian, I.; Bădescu, M.; Stanciu, C. A Narrative Review of the Link between Sport and Technology. Sustainability 2022, 14, 16265. [Google Scholar] [CrossRef]
  38. Zakharova, A.; Mekhdieva, K.; Krasilnikov, V.; Timokhina, V. Soccer Players’ Agility: Complex Laboratory Testing for Differential Training. In Proceedings of the 7th International Conference on Sport Sciences Research and Technology Support, Vienna, Austria, 20–21 September 2019; pp. 90–96. [Google Scholar] [CrossRef]
  39. Katanić, B.; Ilić, P.; Stojmenović, A.; Vitasović, M. The application of Fitlight trainer system in sports. Fizička Kult. 2020, 74, 115–126. [Google Scholar] [CrossRef]
  40. Pauole, K.; Madole, K.; Garhammer, J.; Lacourse, M.; Rozenek, R. Reliability and validity of the T-test as a measure of agility, leg power, and leg speed in college-aged men and women. J. Strength Cond. Res. 2000, 14, 443–450. [Google Scholar] [CrossRef]
  41. Jakovljevic, S.T.; Karalejic, M.S.; Pajic, Z.B.; Macura, M.M.; Erculj, F.F. Speed and agility of 12-and 14-year-old elite male basketball players. J. Strength Cond. Res. 2012, 26, 2453–2459. [Google Scholar] [CrossRef] [PubMed]
  42. Maggioni, M.A.; Bonato, M.; Stahn, A.; La Torre, A.; Agnello, L.; Vernillo, G.; Castagna, C.; Merati, G. Effects of Ball Drills and Repeated-Sprint-Ability Training in Basketball Players. Int. J. Sports Physiol. Perform. 2019, 14, 757–764. [Google Scholar] [CrossRef]
  43. Sekulic, D.; Krolo, A.; Spasic, M.; Uljevic, O.; Peric, M. The development of a New Stop’n’go reactive-agility test. J. Strength Cond. Res. 2014, 28, 3306–3312. [Google Scholar] [CrossRef]
  44. Henry, G.; Dawson, B.; Lay, B.; Young, W. Validity of a reactive agility test for Australian football. Int. J. Sports Physiol. Perform. 2011, 6, 534–545. [Google Scholar] [CrossRef]
  45. Hachana, Y.; Chaabène, H.; Nabli, M.A.; Attia, A.; Moualhi, J.; Farhat, N.; Elloumi, M. Test-retest reliability, criterion-related validity, and minimal detectable change of the Illinois agility test in male team sport athletes. J. Strength Cond. Res. 2013, 27, 2752–2759. [Google Scholar] [CrossRef] [PubMed]
  46. Moselhy, S.H. Effect of speed, agility, and quickness (SAQ) training with and without ball on all types of dribble skill for junior female basketball players. Int. Sci. J. Phys. Educ. Sport Sci. 2020, 8, 171–184. [Google Scholar] [CrossRef]
  47. Hassan, A.K.; Alibrahim, M.S.; Sayed Ahmed, Y.A.R. The effect of small-sided games using the FIT LIGHT training system on some harmonic abilities and some basic skills of basketball players. Front. Sports Act. Living 2023, 5, 1080526. [Google Scholar] [CrossRef] [PubMed]
  48. Hasegawa, R.; Goto, F.; Watanabe, H.; Ido, H.; Okayama, N.; Islam, M.M. The Relationship between Functional Fitness and Ability to Ride a Bicycle among Community-Dwelling Older Adult in Japan. Phys. Act. Health 2021, 5, 45–54. [Google Scholar] [CrossRef]
  49. Hadžović, M.M.; Đorđević, S.N.; Jorgić, B.M.; Stojiljković, N.Đ.; Olanescu, M.A.; Suciu, A.; Peris, M.; Plesa, A. Innovative Protocols for Determining the Non-Reactive Agility of Female Basketball Players Based on Familiarization and Validity Tests. Appl. Sci. 2023, 13, 6023. [Google Scholar] [CrossRef]
  50. Bekris, E.; Gioldasis, A.; Zacharakis, E.; Noutsos, K.; Meletakos, P.; Smirniotou, A. Assessment of change of direction and agility. Running and dribbling among soccer, basketball and handball players: The concept of “agility deficit”. Cent. Eur. J. Sport Sci. Med. 2023, 44, 63–77. [Google Scholar] [CrossRef]
  51. Silvestri, F.; Campanella, M.; Bertollo, M.; Albuquerque, M.R.; Bonavolontà, V.; Perroni, F.; Baldari, C.; Guidetti, L.; Curzi, D. Acute effects of fitlight training on cognitive-motor processes in young basketball players. Int. J. Environ. Res. Public Health 2023, 20, 817. [Google Scholar] [CrossRef] [PubMed]
  52. Lucia, S.; Digno, M.; Madinabeitia, I.; Di Russo, F. Testing a multicomponent training designed to improve sprint, agility and decision-making in elite basketball players. Brain Sci. 2023, 13, 984. [Google Scholar] [CrossRef]
  53. Pehar, M.; Sisic, N.; Sekulic, D.; Coh, M.; Uljevic, O.; Spasic, M.; Krolo, A.; Idrizovic, K. Analyzing the relationship between anthropometric and motor indices with basketball specific pre-planned and non-planned agility performances. J. Sports Med. Phys. Fit. 2018, 58, 1037–1044. [Google Scholar] [CrossRef]
  54. Badau, D.; Badau, A.; Joksimović, M.; Manescu, C.O.; Manescu, D.C.; Dinciu, C.C.; Margarit, I.R.; Tudor, V.; Mujea, A.M.; Neofit, A.; et al. Identifying the Level of Symmetrization of Reaction Time According to Manual Lateralization between Team Sports Athletes, Individual Sports Athletes, and Non-Athletes. Symmetry 2024, 16, 28. [Google Scholar] [CrossRef]
  55. Drugau, S. Study on the Detent Efficiency through the Use of Modern Training. Bull. Transilv. Univ. Braşov. Ser. IX Sci. Hum. Kinet. 2018, 10, 45–50. [Google Scholar]
  56. Cojanu, F.; Naiba, O.; Catanescu, A. Methodical Contributions for the Training of the Representative Basketball Teams at the High School Level. Bull. Transilv. Univ. Braşov. Ser. IX Sci. Hum. Kinet. 2021, 14, 147–152. [Google Scholar] [CrossRef]
  57. Martoma, A. Statistical and Experimental Methods Used in Medical Education Related to the Aerobic and Anaerobic Effort Capacity at Athletes. In Proceedings of the WSEAS international conferences, Iwate, Japan, 4–6 October 2010; pp. 102–108. [Google Scholar]
  58. Curitianu, I.M.; Turcu, I.; Alexe, D.I.; Alexe, C.I.; Tohanean, D.I. Effects of Tabata and HIIT Programs Regarding Body Composition and Endurance Performance among Female Handball Players. Balneo PRM Res. J. 2022, 13, 500. [Google Scholar] [CrossRef]
  59. Hogea, T.; Suciu, B.A.; Ivănescu, A.D.; Carașca, C.; Chinezu, L.; Arbănași, E.M.; Russu, E.; Kaller, R.; Arbănași, E.M.; Mureșan, A.V.; et al. Increased Epicardial Adipose Tissue (EAT), Left Coronary Artery Plaque Morphology, and Valvular Atherosclerosis as Risks Factors for Sudden Cardiac Death from a Forensic Perspective. Diagnostics 2023, 13, 142. [Google Scholar] [CrossRef] [PubMed]
  60. Alim, A.; Tomoliyus, T.; Refiater, U.H.; Gani, I. Herramienta de medición de agilidad reactiva basada en sensores para deportes grupales de juegos en red: Validez del contenido (Sensor-Based Reactive Agility Measurement Tool for Net Game Group Sports: Content Validity). Retos 2024, 51, 167–171. [Google Scholar] [CrossRef]
  61. Mocanu, G.D.; Murariu, G. The influence of the specificity of sports specializations on the values of muscle power for female university students. Balneo PRM Res. J. 2023, 14, 563. [Google Scholar] [CrossRef]
  62. Corredor-Serrano, L.F.; Garcia-Chaves, D.C.; Davila Bernal, A.; su lay villay, W. Composición corporal, fuerza explosiva y agilidad en jugadores de baloncesto profesional (Body composition, explosive strength, and agility in professional basketball players). Retos 2023, 49, 189–195. [Google Scholar] [CrossRef]
Figure 3. Gant chart about experimental training program.
Applsci 14 03597 g003
Table 1. Descriptive statistics of agility tests for U14 experimental and control groups in the (It) and (Ft).
GroupAgility TestTestNMinMaxMeanSDVarianceSkewnessCV
StatisticSE
U14
experiment
T agility testIt1810.5914.9412.351.221.490.510.549.88%
Ft1810.2212.1110.980.490.240.530.544.46%
T agility test with ballIt1813.8322.7017.132.124.491.000.5412.38%
Ft1811.3115.2513.610.900.81−0.330.546.61%
T reactive agility testIt1811.4516.3114.281.592.52−0.310.5411.13%
Ft1811.0413.7712.230.840.70−0.010.546.87%
T reactive agility test with ballIt1816.8923.4419.611.833.350.550.549.33%
Ft1812.9817.2415.791.131.27−0.720.547.16%
Illinois agility testIt1815.7421.4917.831.522.300.740.548.52%
Ft1814.9817.1216.020.630.400.240.543.93%
Illinois agility test with ballIt1817.4126.3020.412.455.990.940.5412.00%
Ft1815.9918.2217.080.670.450.110.543.92%
U14
control
T agility testIt1811.5115.1213.320.980.950.240.547.36%
Ft1810.6614.9213.091.061.13−0.190.548.10%
T agility test with ballIt1813.5522.0618.612.034.14−0.490.5410.91%
Ft1812.8821.9418.092.034.11−0.490.5411.22%
T reactive agility testIt1813.0816.8915.171.041.09−0.100.546.86%
Ft1812.9916.7314.831.021.04−0.050.546.88%
T reactive agility test with ballIt1813.9824.8821.492.606.79−1.220.5412.10%
Ft1813.3324.7921.042.606.76−1.300.5412.36%
Illinois agility testIt1816.7921.6019.001.331.760.180.547.00%
Ft1816.6220.6918.681.181.40−0.010.546.32%
Illinois agility test with ballIt1818.6823.4521.091.442.08−0.170.546.83%
Ft1817.9523.0920.701.482.20−0.320.547.15%
It—initial test; Ft—final test; SD—standard deviation; SE—standard error; N—number of subjects; U—under; CV—coefficient of variation.
Table 2. Descriptive statistics of agility tests for the U16 experimental and control groups in the (It) and (Ft).
GroupAgility TestTestNMinMaxMeanSDVarianceSkewnessCV
StatisticSE
U16
experiment
T agility testIt1710.8916.6612.411.351.832.120.5510.88%
Ft1710.2213.6611.080.760.582.590.556.86%
T agility test with ballIt1712.0720.2914.022.234.961.810.5515.91%
Ft1710.9914.8812.251.231.521.140.5510.04%
T reactive agility testIt1712.0418.2113.771.642.691.470.5511.91%
Ft1710.9815.0812.031.011.021.860.558.40%
T reactive agility test with ballIt1712.6725.8915.993.4912.151.870.5521.83%
Ft1711.8815.8813.011.311.701.480.5510.07%
Illinois agility testIt1718.0923.3719.661.341.791.590.556.82%
Ft1717.8719.8918.450.570.321.150.553.09%
Illinois agility test with ballIt1718.9125.2120.821.612.601.390.557.73%
Ft1718.0121.2218.870.780.611.850.554.13%
U16
control
T agility testIt1710.2711.5610.980.360.13−0.130.553.28%
Ft1710.2111.4810.910.370.14−0.380.553.39%
T agility test with ballIt1711.1413.7412.030.670.450.890.555.57%
Ft1710.7812.8811.920.590.35−0.220.554.95%
T reactive agility testIt1711.0212.8011.770.480.230.420.554.08%
Ft1710.9812.4511.720.450.200.010.553.84%
T reactive agility test with ballIt1711.5614.8012.430.740.542.170.555.95%
Ft1711.2214.2012.330.660.441.190.555.35%
Illinois agility testIt1714.9719.0216.220.950.911.600.555.86%
Ft1714.8018.9116.120.990.981.310.556.14%
Illinois agility test with ballIt1715.6019.4616.840.970.941.200.555.76%
Ft1715.5818.9916.740.890.791.050.555.32%
It—initial test; Ft—final test; SD—standard deviation; SE—standard error; N—number of subjects; U—under; CV—coefficient of variation.
Table 3. Statistical analysis of agility tests for the U14 experimental and control groups between the (It) and (Ft).
Agility TestGroupTestsMeanSDSEM95% CItpd
LowerUpper
T agility testExperimentalFt–It1.370.860.200.951.806.790.001.47
ControlFt–It0.230.260.060.100.363.670.000.23
T agility test with ballExperimentalFt–It2.050.920.221.602.519.480.001.61
ControlFt–It0.340.290.070.190.484.900.000.33
T reactive agility testExperimentalFt–It3.521.490.352.784.2610.010.002.16
ControlFt–It0.530.420.100.320.745.290.000.26
T reactive agility test with ballExperimentalFt–It3.821.110.263.274.3814.590.002.51
ControlFt–It0.450.410.100.250.654.700.000.17
Illinois agility testExperimentalFt–It1.811.010.241.312.317.580.001.56
ControlFt–It0.320.250.060.200.455.420.000.25
Illinois agility test with ballExperimentalFt–It3.322.150.512.254.396.570.001.85
ControlFt–It0.390.240.060.270.516.810.000.27
It—initial test; Ft—final test; t—Student T value; SD—standard deviation; SEM—standard error mean; CI—confidence interval of the difference; p—statistically significant value; d—effect size.
Table 4. Statistical analysis of agility tests for the U14 experiment and control groups between the (It) and (Ft).
Agility TestGroupTestsMeanSDSEM95% CItpd
LowerUpper
T agility testExperimentalFt–It1.330.680.170.971.688.010.001.21
ControlFt–It0.070.120.030.000.132.260.040.19
T agility test with ballExperimentalFt–It1.740.870.211.302.198.290.001.28
ControlFt–It0.040.080.020.000.092.200.040.11
T reactive agility testExperimentalFt–It1.771.220.291.142.395.990.000.98
ControlFt–It0.100.220.05−0.010.222.000.050.17
T reactive agility test with ballExperimentalFt–It2.982.470.601.714.254.970.001.13
ControlFt–It0.100.190.050.010.202.240.040.14
Illinois agility testExperimentalFt–It1.210.960.230.721.705.220.001.18
ControlFt–It0.100.190.050.000.202.070.050.10
Illinois agility test with ballExperimentalFt–It1.951.100.271.392.517.330.001.54
ControlFt–It0.100.140.030.030.183.040.010.11
It—initial test; Ft—final test; t—Student T value; SD—standard deviation; SEM—standard error mean; CI—confidence interval of the difference; p—statistically significant value; d—effect size.
Table 5. Independent samples t-test of agility tests for the U14 control and experimental groups in the (It) and (Ft).
Agility TestGroupsTestLevene’s Test t-Test for Equality of Means
FptdfpMean Diff.SED95% CI
LowerUpper
T agility testGE–GCIt0.680.42−2.6434.000.01−0.970.37−1.72−0.22
GE–GCFt8.100.01−7.6734.000.00−2.120.28−2.68−1.56
T agility test with ballGE–GCIt0.010.92−2.1534.000.04−1.480.69−2.89−0.08
GE–GCFt4.480.04−8.5634.000.00−4.480.52−5.54−3.41
T reactive agility testGE–GCIt5.070.03−1.9934.000.06−0.890.45−1.800.02
GE–GCFt0.400.53−8.3934.000.00−2.610.31−3.24−1.98
T reactive agility test with ballGE–GCIt0.680.41−2.5134.000.02−1.880.75−3.41−0.36
GE–GCFt4.220.05−7.8734.000.00−5.260.67−6.62−3.90
Illinois agility testGE–GCIt0.800.38−2.4634.000.02−1.170.48−2.13−0.20
GE–GCFt5.240.03−8.4134.000.00−2.650.32−3.30−2.01
Illinois agility test with ballGE–GCIt2.990.09−1.0234.000.31−0.680.67−2.040.68
GE–GCFt8.800.01−9.4434.000.00−3.620.38−4.39−2.84
GE—experimental group; GC—control group; SED—standard error of difference; It—initial test; Ft—final test; t—Student T value; CI—confidence interval of the difference; p—statistically significant value.
Table 6. Independent samples T test for the U16 control and experimental groups in the (It) and (Ft).
Agility Test Levene’s Test t-Test for Equality of Means
GroupsTestFSig.tdfpMean Diff.SED95% CI
LowerUpper
T agility testGE–GCIt7.080.014.2232.000.001.430.340.742.12
GE–GCFt0.930.340.8332.000.410.170.21−0.250.59
T agility test with ballGE–GCIt9.430.003.5332.000.001.990.560.843.14
GE–GCFt6.230.021.0032.000.320.330.33−0.341.01
T reactive agility testGE–GCIt11.160.004.8432.000.002.010.411.162.85
GE–GCFt2.850.101.1532.000.260.310.27−0.240.85
T reactive agility test with ballGE–GCIt12.390.004.1332.000.003.560.861.805.32
GE–GCFt4.360.041.9432.000.060.690.35−0.041.41
Illinois agility testGE–GCIt1.370.258.6432.000.003.440.402.634.25
GE–GCFt2.140.158.4032.000.002.330.281.762.89
Illinois agility test with ballGE–GCIt4.240.058.7432.000.003.980.463.064.91
GE–GCFt0.570.467.4532.000.002.140.291.552.72
GE—experimental group; GC—control group; SED—standard error of difference; It—initial test; Ft—final test; t—Student T value; CI—confidence interval of the difference; p—statistically significant value.
Disclaimer/Publisher’s Note: The statements, opinions and data contained in all publications are solely those of the individual author(s) and contributor(s) and not of MDPI and/or the editor(s). MDPI and/or the editor(s) disclaim responsibility for any injury to people or property resulting from any ideas, methods, instructions or products referred to in the content.

