Study of the Targeted Regulation of Rice Drying Characteristics and Quality


1
Academy of National Food and Strategic Reserves Administration, Beijing 100037, China
2
College of Mechanical and Electrical Engineering, Xinjiang Production and Construction Corps Key Laboratory of Utilization and Equipment of Special Agricultural and Forestry Products in Southern Xinjiang, Tarim University, Alar 843300, China
3
National Engineering Research Centre for Grain Storage and Logistics, Beijing 102209, China
*
Author to whom correspondence should be addressed.
Appl. Sci. 2024, 14(9), 3587; https://0-doi-org.brum.beds.ac.uk/10.3390/app14093587
Submission received: 22 March 2024
/
Revised: 10 April 2024
/
Accepted: 15 April 2024
/
Published: 24 April 2024
(This article belongs to the Section Agricultural Science and Technology)
Abstract
:As the pre-process of storage and processing, rice drying is a key link to ensuring grain quality. A scientific and reasonable drying process can maintain grain quality and realize grain loss reduction, energy savings, and emission reduction. By establishing the response surface (RSM) regression model, the relationship between various experimental factors and quality indicators was analyzed, and the reasons for the results were explained. The optimized parameter combination was a hot air temperature of 43.14 °C, hot air humidity of 48.00%, initial moisture content of 23.80%, hot air velocity of 0.70 m/s, and hysteresis ratio of 3.55. Under this parameter combination, the drying characteristics (net drying time = 157.61 min, germination rate = 94.15%), processing quality (burst waist increase rate = 3.48%, whole rice rate = 70.458%), and nutritional quality (fatty acid value = 20.93 mg, resistant starch concentration = 195.26 μg/g, protein content change = 8.53 g/100 g, fat content change = 2.37 g/100 g) of rice after drying improved. The relative error between the validation results and the optimized results was 4.68%, indicating that the optimized process parameters can improve the efficiency and quality of rice drying. According to the regression model, the process reference chart with the process retrieval and prediction function was drawn, and the corresponding high-quality control scheme was given, providing a reference for the parameter settings of actual drying operations. The optimized drying process parameter combination effectively reduced the moisture gradient inside rice grains, drying stress, and the occurrence of cracks, thereby improving the appearance, quality and nutritional value of rice after drying. Moreover, the process reference chart can provide a reference for the actual preliminary processing technology of rice after production and a theoretical basis for an in-depth exploration of the mechanism of changes in rice quality.
1. Introduction
Rice drying is a complex nonlinear process, and the drying efficiency and quality of rice are easily affected by different drying factors. In the past two decades, experts and scholars in the field of grain drying have explored various methods to ensure the quality of rice drying. China’s “14th Five-Year Plan” advocates the “quality and freshness of grain” and pays attention to the “nutrition and health of grain”, indicating that post-production grain quality is a key issue that should be given attention in the grain industry. In the world, there are three main methods to ensure the drying quality of rice: Rufino Franco. et al. introduced the analytical model of continuous and “intermittent drying” of fixed beds, and the results showed that intermittent drying can improve the drying efficiency and quality compared with continuous drying [1]; Xianzhe, Z. et al. found that, based on the glass transformation of the “variable temperature drying”, its burst waist increase rate is significantly reduced [2]; and Jin, Y. et al. established a model of rice quality and cumulative temperature of drying by drying and slow drying, which improved the processing quality [3,4]. Most scholars have explored the changes in rice indexes based on the changes in some parameters of the soothing period, such as drying period parameters and soothing period time. For example, Zhou. X. et al. [5] explored the effects of two drying methods, infrared radiation and heat pump drying, and different soothing ratios on the quality of rice milling. Zhonghua, W. et al. [6,7] discussed the effects of drying and soothing temperatures on the crack rate of rice and the effects of soothing temperature, soothing ratio, and soothing time on the drying rate; Mahmood, N. et al. [8,9] studied the effects of hot-air-assisted radio frequency combined drying technology on the thermal uniformity, drying structure characteristics, and quality of rice drying and found that it has the advantages of high drying speed and energy consumption reduction and improves the quality of rice. The main physical and chemical components of starch, protein, fat, and water in rice have a significant impact on its flavor and nutritional value [10], and the drying process can cause changes in these physical and chemical components. In research on rice drying quality, the accurate regulation of rice drying quality is challenging due to the influence of hot air and air speed, grain internal moisture gradient distribution, internal thermal stress, and other factors. In this regard, scholars from various countries have carried out many practical studies on the regulation of rice drying quality [11]. In addition, research groups have systematically carried out experimental studies on the directional regulation of high-quality rice quality in the early stage [1,3,12,13]. Various physical and chemical indicators of rice are affected by the temperature, relative humidity, air speed, and hysteresis ratio of the drying medium to varying degrees, and there are mutual incentive and transformation phenomena in the drying process [4]. Based on this, a set of rice quality regression models have been established, and a theoretical system of quality directional regulation has been preliminarily constructed [3].
Therefore, in view of the few comprehensive indexes of directional regulation and the lack of drying process parameters, only processing index is a comprehensive consideration. This paper adds drying characteristic index, nutrition index, and processing index after the new test. Therefore, this study started from the drying quality change mechanism of high-quality japonica rice to study the characteristics of rice quality change, designed a response surface (RSM) experiment, analyzed the mapping relationship between drying parameters and drying quality indicators, and established a regression model. RSM comprehensively analyzed the effects of various process parameters on rice quality and optimized the parameters to establish a mathematical model relationship between the regulation parameters and drying quality, providing a reference for revealing the internal mechanism of changes in the parameters of hot air drying and quality indicators in rice [3,12]. In addition, a process reference chart based on net drying time, waist burst increase rate, whole rice rate, fatty acid value, resistant starch concentration, germination rate, protein mass fraction, and fat mass fraction was drawn. This set of process reference charts can provide a reference for the actual post-production primary processing technology of rice. It also lays the foundation for the subsequent development of an intelligent control system.
2. Materials and Methods
2.1. Materials
High-quality variety Nanjing 5055 was purchased in Zhangjiagang City, China, in November 2023. For sample preparation, the initial harvest moisture of rice was 30% (w.b.), and the initial waist bursting rate was 1% using the 105 °C oven method and ignoring the effect of natural drying on waist bursting. The accuracy of the moisture analyzer was calibrated using the oven method. The rice moisture required for the experiment was reached before the experiment began. A moisture analyzer was used to measure the drying moisture in real time to ensure that the moisture required for the experiment was reached. Before the experiment, rice seeds of uniform color and plump grains were manually removed to obtain rice seeds with broken, germinated, and small grains as experimental materials. The samples were then sealed in polyethylene bags and stored in cold storage at an ambient temperature of 4 ± 1 °C.
2.2. Drying Equipment and Procedure
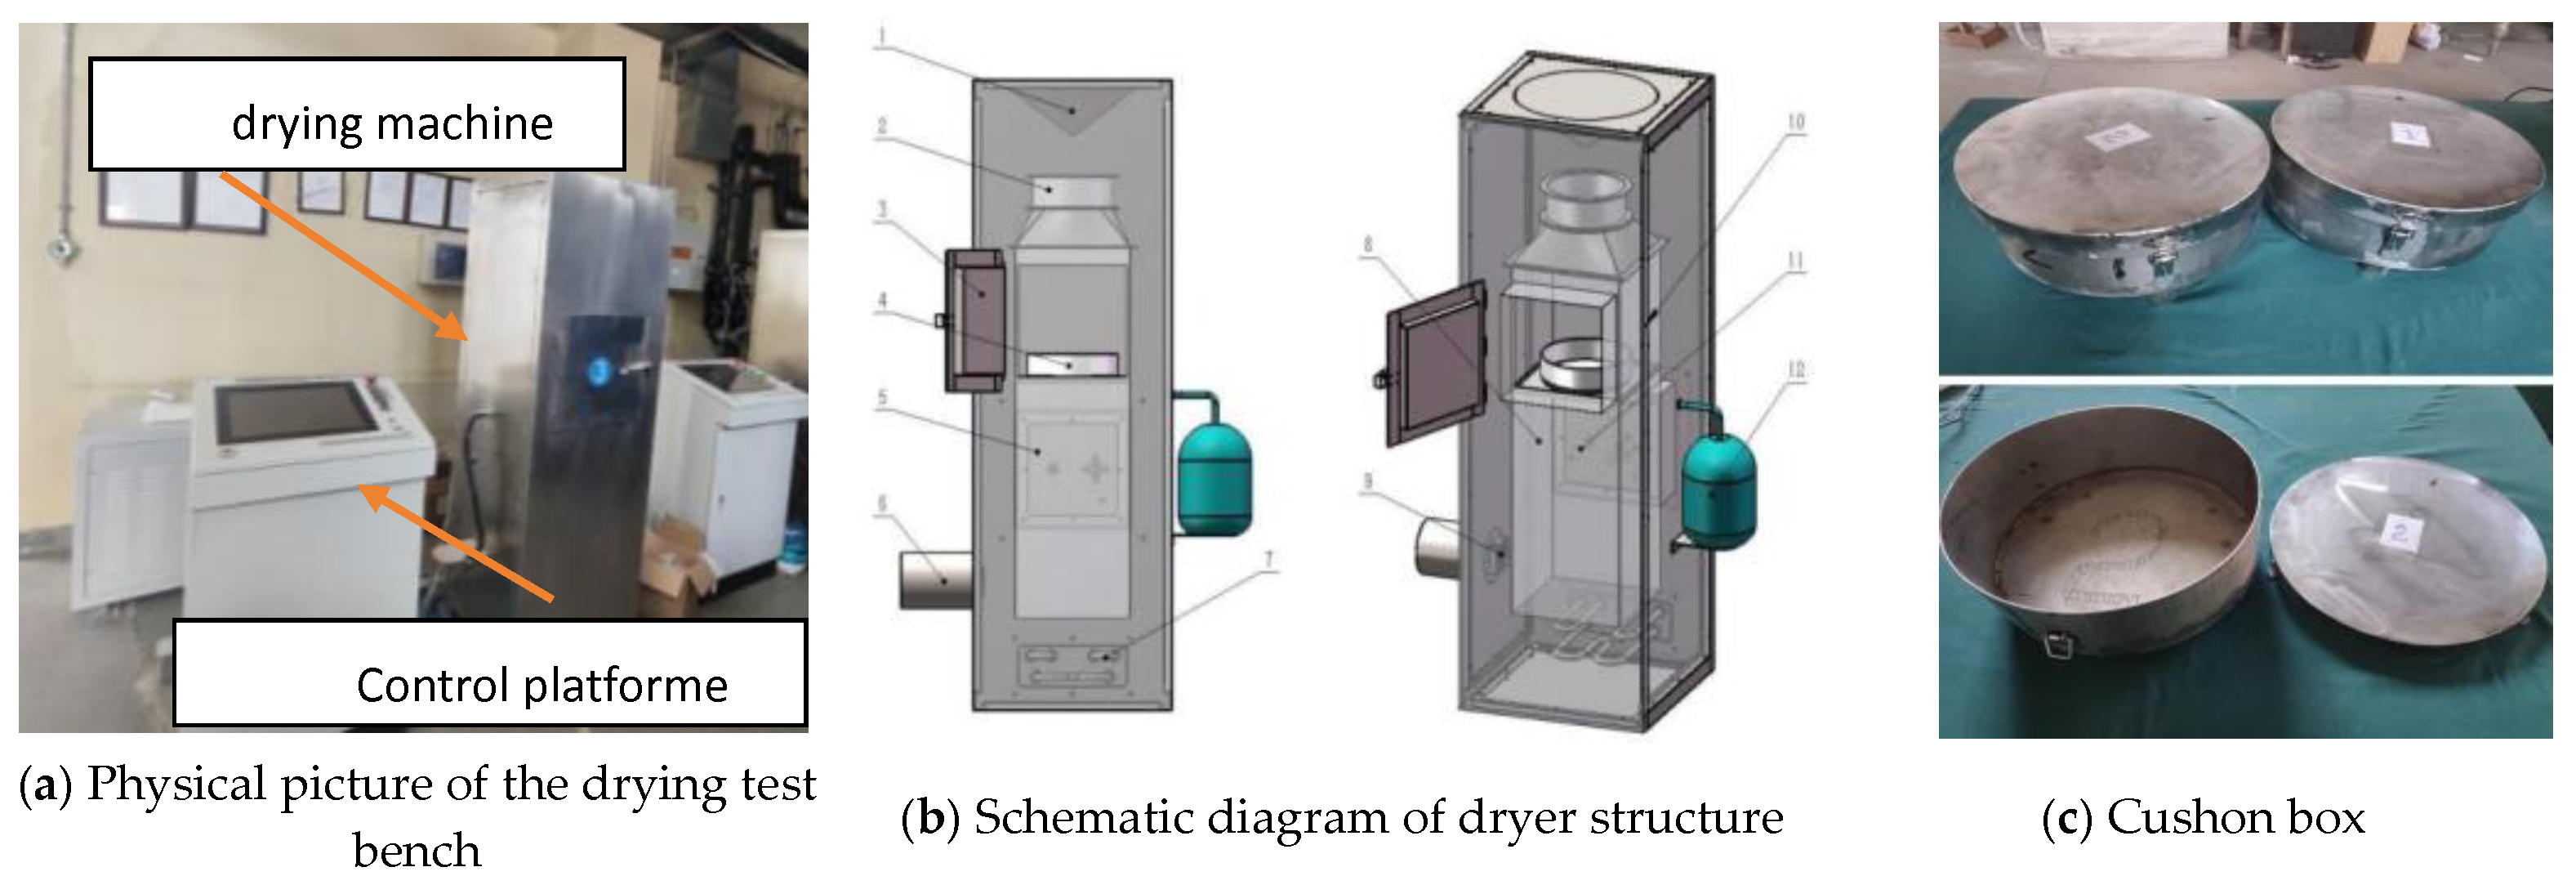
The test was conducted at the Changping Pilot Plant of the National Food and Strategic Reserves Administration in Beijing, China, using an independently developed drying test device [14]. Other experimental instruments and equipment are shown in Table 1. The structure of the test device is shown in Figure 1. The device monitored and controlled the temperature, relative humidity, and flow rate of the drying medium during the drying process, accurately controlled the drying parameters of the material, and simulated the drying microenvironment in the grain dryer. The control accuracy was as follows: hot air temperature ± 0.5 °C, hot air relative humidity ± 1%, and hot air speed ± 0.1 m s−1.
2.3. Methodology
Before the experiment, the drying temperature, air speed, relative humidity, and other experimental parameters were set in advance in the control panel of the console. The experimental equipment was preheated for 20 min to achieve the set stable state. At the same time, the rice was removed from cold storage and left standing in an indoor environment. For each experiment, 1000 g rice samples were placed into the material chamber to dry. A digital electronic scale with an accuracy of ±0.01 g was used to record the weight of rice every 15 min. Then, the rice was tempered in the oven at the same temperature. The thaw time was determined according to the thaw ratio. The sample was thawed in a special thaw box with good sealing performance to simulate the real thaw environment. All drying experiments were completed when the moisture content of the sample reached 14% (w.b.). The dry rice was placed at room temperature for 48 h to measure the increase rate of burst waist, the rice percentage, the concentration of resistant starch, and the germination rate. The rice was then placed in a refrigerator at 4 °C for preservation. The rice was used to detect the fatty acid value, protein and fat content, and other rice qualities. Three parallel experiments were conducted for each group.
2.4. Indicator Determination
- (1)
- Determination of water content
The methodology used in “oil moisture and volatile content determination” was used to determine the rice moisture content and wet basis moisture content of the sample [15], which was calculated according to Equation (1).
where MC represents the wet basis moisture content of the sample (%), mt is the wet sample mass (g), and md is the dry sample mass (g).
- (2)
- Determination of waist burst rate and waist burst rate (ACP)
After drying for 24 h, use “Inspection of grain and oilseeds--Methods for determination of yellow-coloured rice and cracked kernels “tested rice for waist burst [16]. The waist burst rate and waist burst rate are calculated as follows (Formulas (2) and (3)):
where nc and nt are the number of cracked grains and total grain number, respectively, Cpt and Cp0 represent dry waist burst rate (%) and initial waist burst rate (%), respectively, and ACP is the waist burst rate (%) increase.
- (3)
- Determination of whole rice rate (HRY)
The whole rice rate was determined according to “rice whole rice rate inspection method” [17]. The experiment was repeated three times, and the average value was used in the calculation. The whole rice rate was calculated as follows:
where B is the quality of whole rice (g), and A is the total quality of rice (g).
- (4)
- Resistant starch concentration
The resistant starch concentration was determined following “rice and products in the determination of resistant starch spectrophotometric method” [18].
- (5)
- Fatty acid value determination
The fatty acid value was determined following “Inspection of grain and oils—Determination of fat acidity of cereal and cereal products—Instrumental analysis method” [19].
- (6)
- Protein content determination
The protein content was determined following grain and oil inspection “rice crude protein content determination” using the near-infrared method. The change value of protein content is calculated by the following formula [19]:
PCV = PC − RGPC
Among them, PCV is the change value of protein content (g/100 g), PC is the protein content after drying (g/100 g), and RGPC is the protein content of raw grain.
- (7)
- Fat content determination
The fat content was determined following “National Standard for Food Safety Determination of Fat in Food”. The change value of fat content is calculated as follows [20]:
where FCV is the change value of fat content (g/100 g), FC is the fat content after drying (g/100 g), and RGFC is the fat content of raw grains.
FCV = FC − RGFC
- (8)
- Determination of germination rate
The germination rate is an important indicator reflecting the seed quality, and its formula is shown in Equation (7). In this chapter, to directly reflect the loss of the germination rate after drying, the germination rate ratio was used as the output indicator, and it was calculated as follows:
where n and m are the number of developed buds and the total grains of rice, respectively.
- (9)
- Calculation of drying time
The drying period of rice in the test bed was recorded as the net drying time (Dtn), and the total drying time (Dtt) was the sum of the net drying time and recovery time.
2.5. Response Surface Methodology
The orthogonal experiment design scheme of five factors and five levels was constructed by RSM through Design-Expert-v.13 software. Compared with the previous research scheme, this scheme responds to quality indicators more comprehensively. The results were fitted with the second-order model to determine the interaction between the studied variables. The central composite design (CCD) was selected as the experimental design of RSM, including 59 experimental groups, 32 factor designs, 10 axis points, and 17 center points. Different levels of drying temperature (T, 35~55 °C), air humidity (RH, 30–50%), initial moisture content (MC, 20–28%), air speed (V, 0.36–0.84 m/s), and recovery ratio (TR, 1–4) were selected. The factor levels are shown in Table 2. The effects of five factors on the response parameters after drying included drying characteristics (net drying time), processing indicators (burst waist increase rate, milled rice rate), and nutritional quality (fatty acid value, resistant starch concentration, germination rate, change in protein content, change in fat content). The experimental scheme and results of the response surface methodology are shown in Figure 2.
According to the test results in Table 3, the independent variable is fitted with the quadratic polynomial equation of the response according to Formula (8), and table in Section 3.1 is obtained.
where Y is the response calculated by the model, β0, βi, βii, and βij are regression coefficients for the intercept, linear, quadratic, and interaction terms, respectively, and ε is the random error.
3. Results and Discussion
3.1. Evaluation of Regression Model and Analysis of Variance
A quadratic multinomial regression model was established between drying temperature, humidity, slow Su ratio, initial water content, net drying time, burst waist increase rate, McLeaned rice rate, fatty acid value, resistant starch concentration, germination rate, protein change amount, and fat change amount. The regression equations obtained after eliminating insignificant factors are shown in Table 4.
3.2. Influence of Interaction among Various Factors on Test Indexes
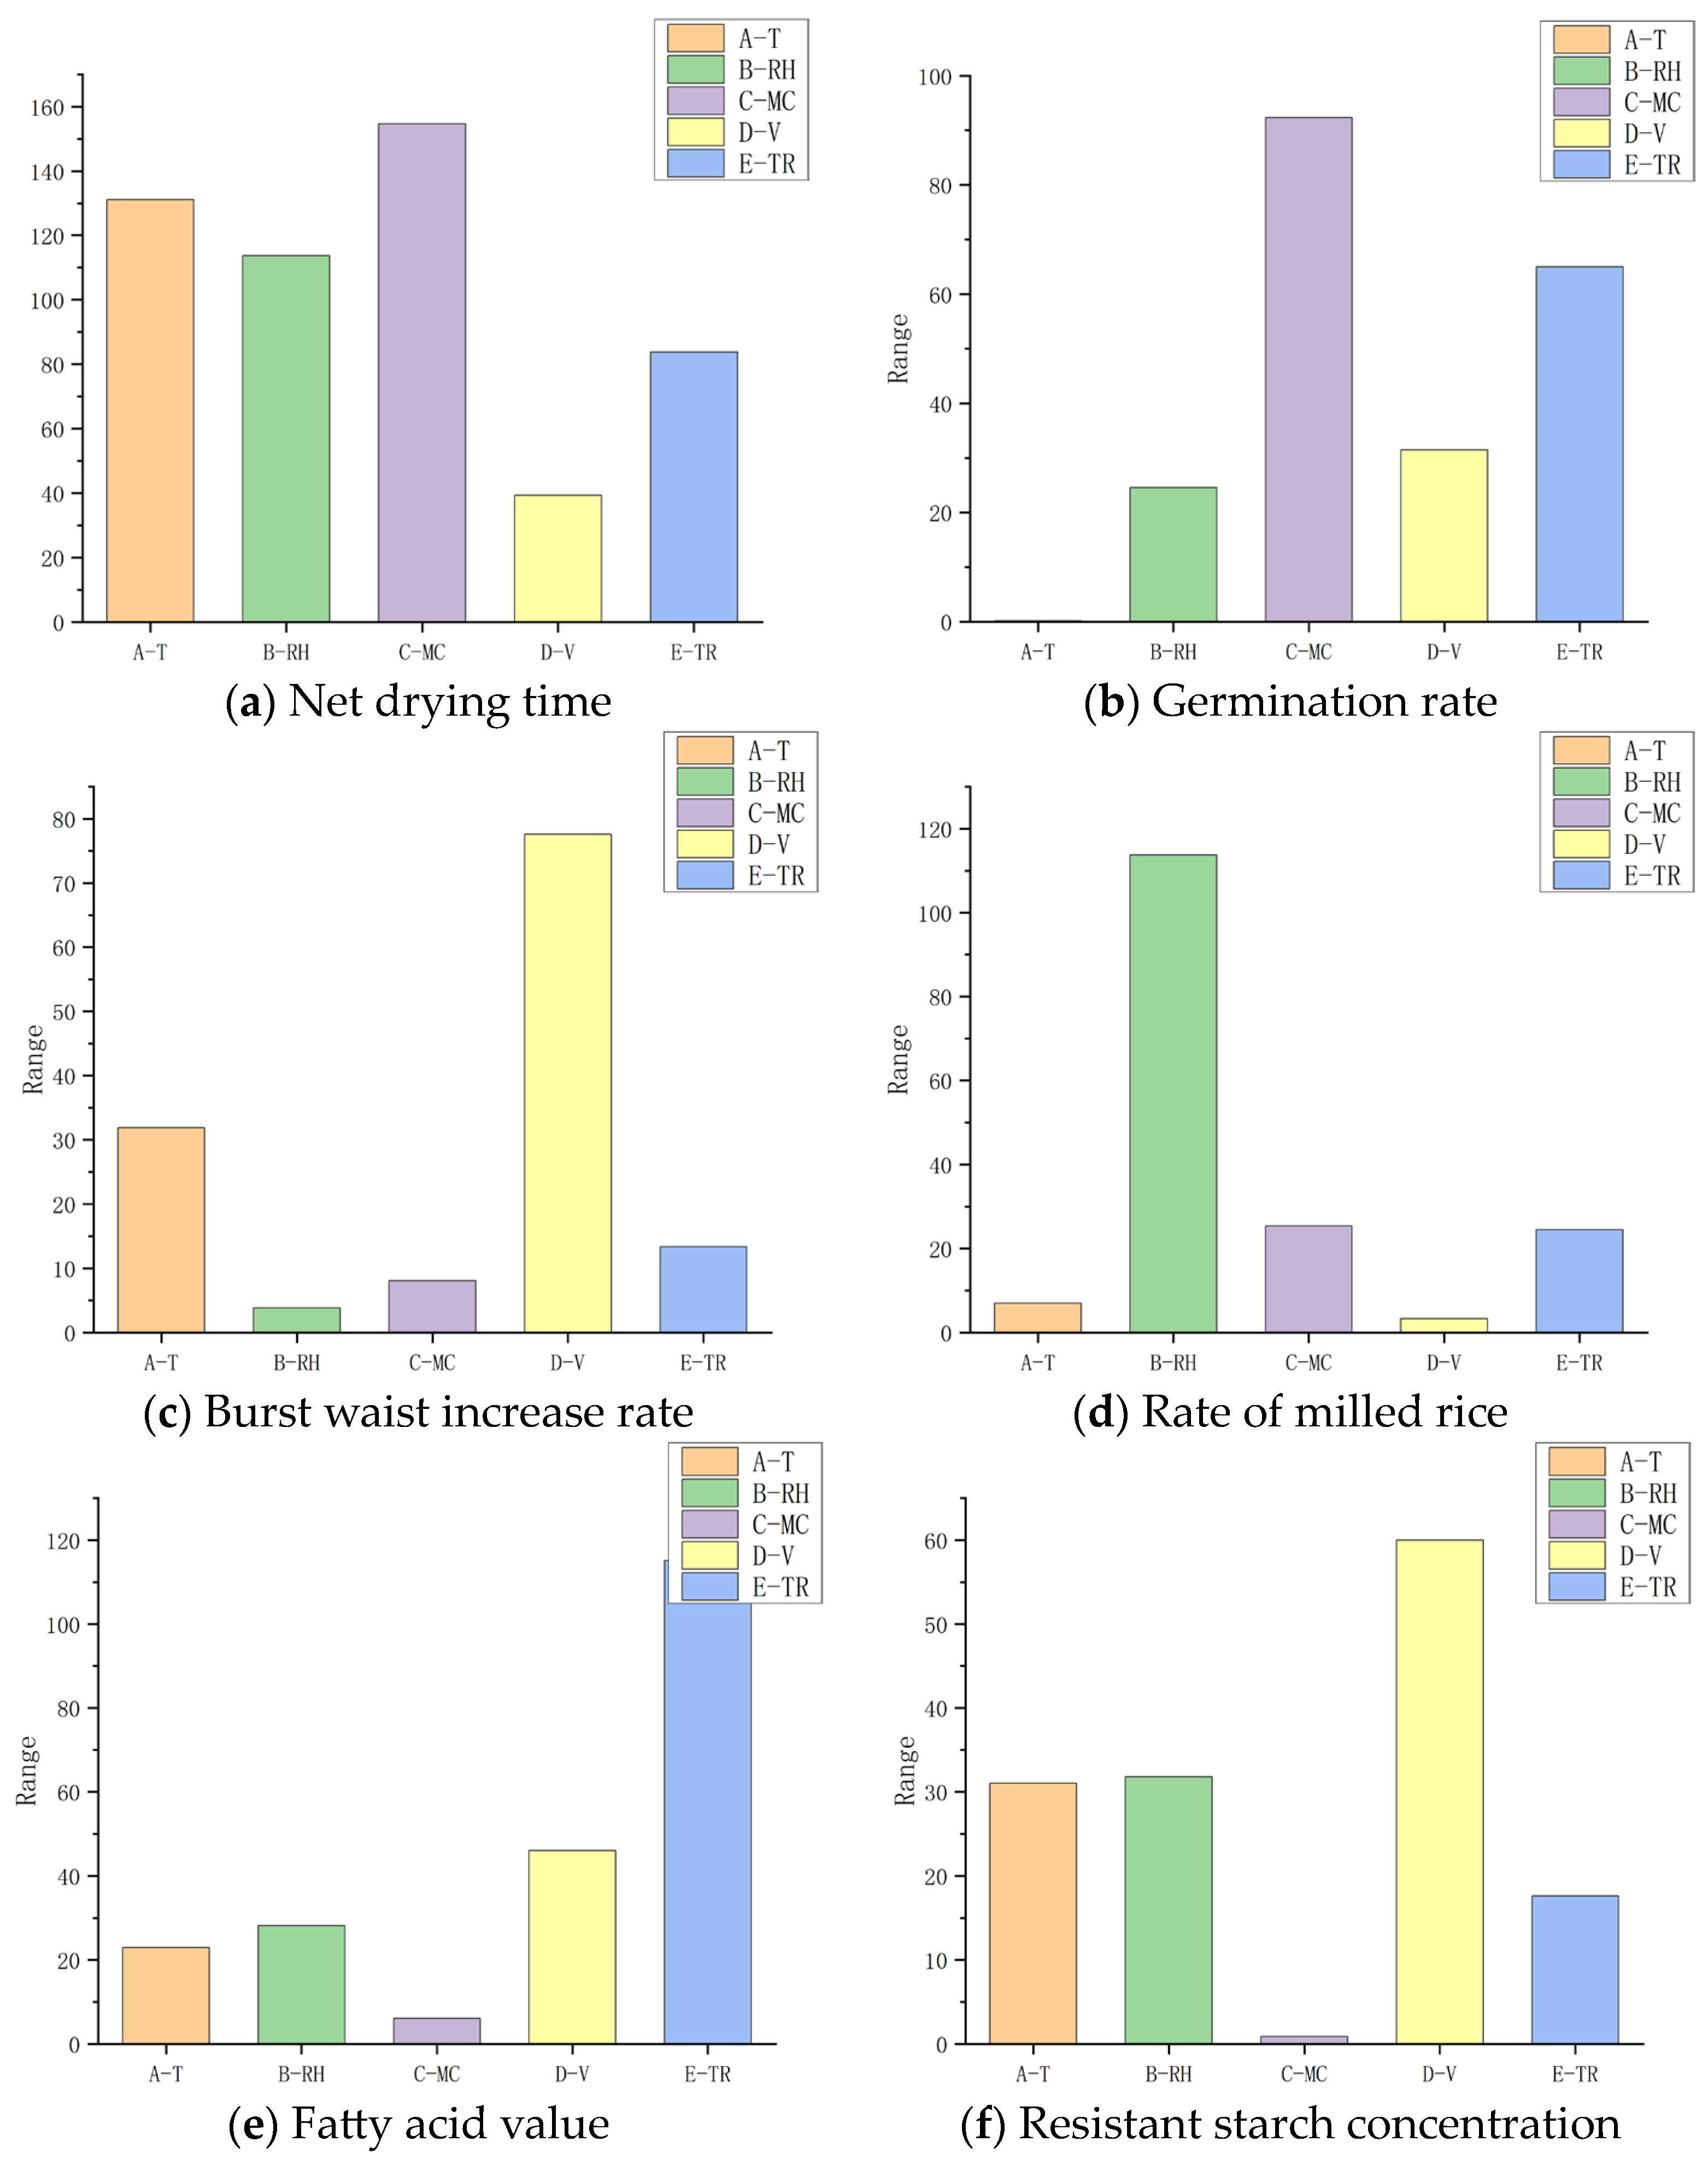
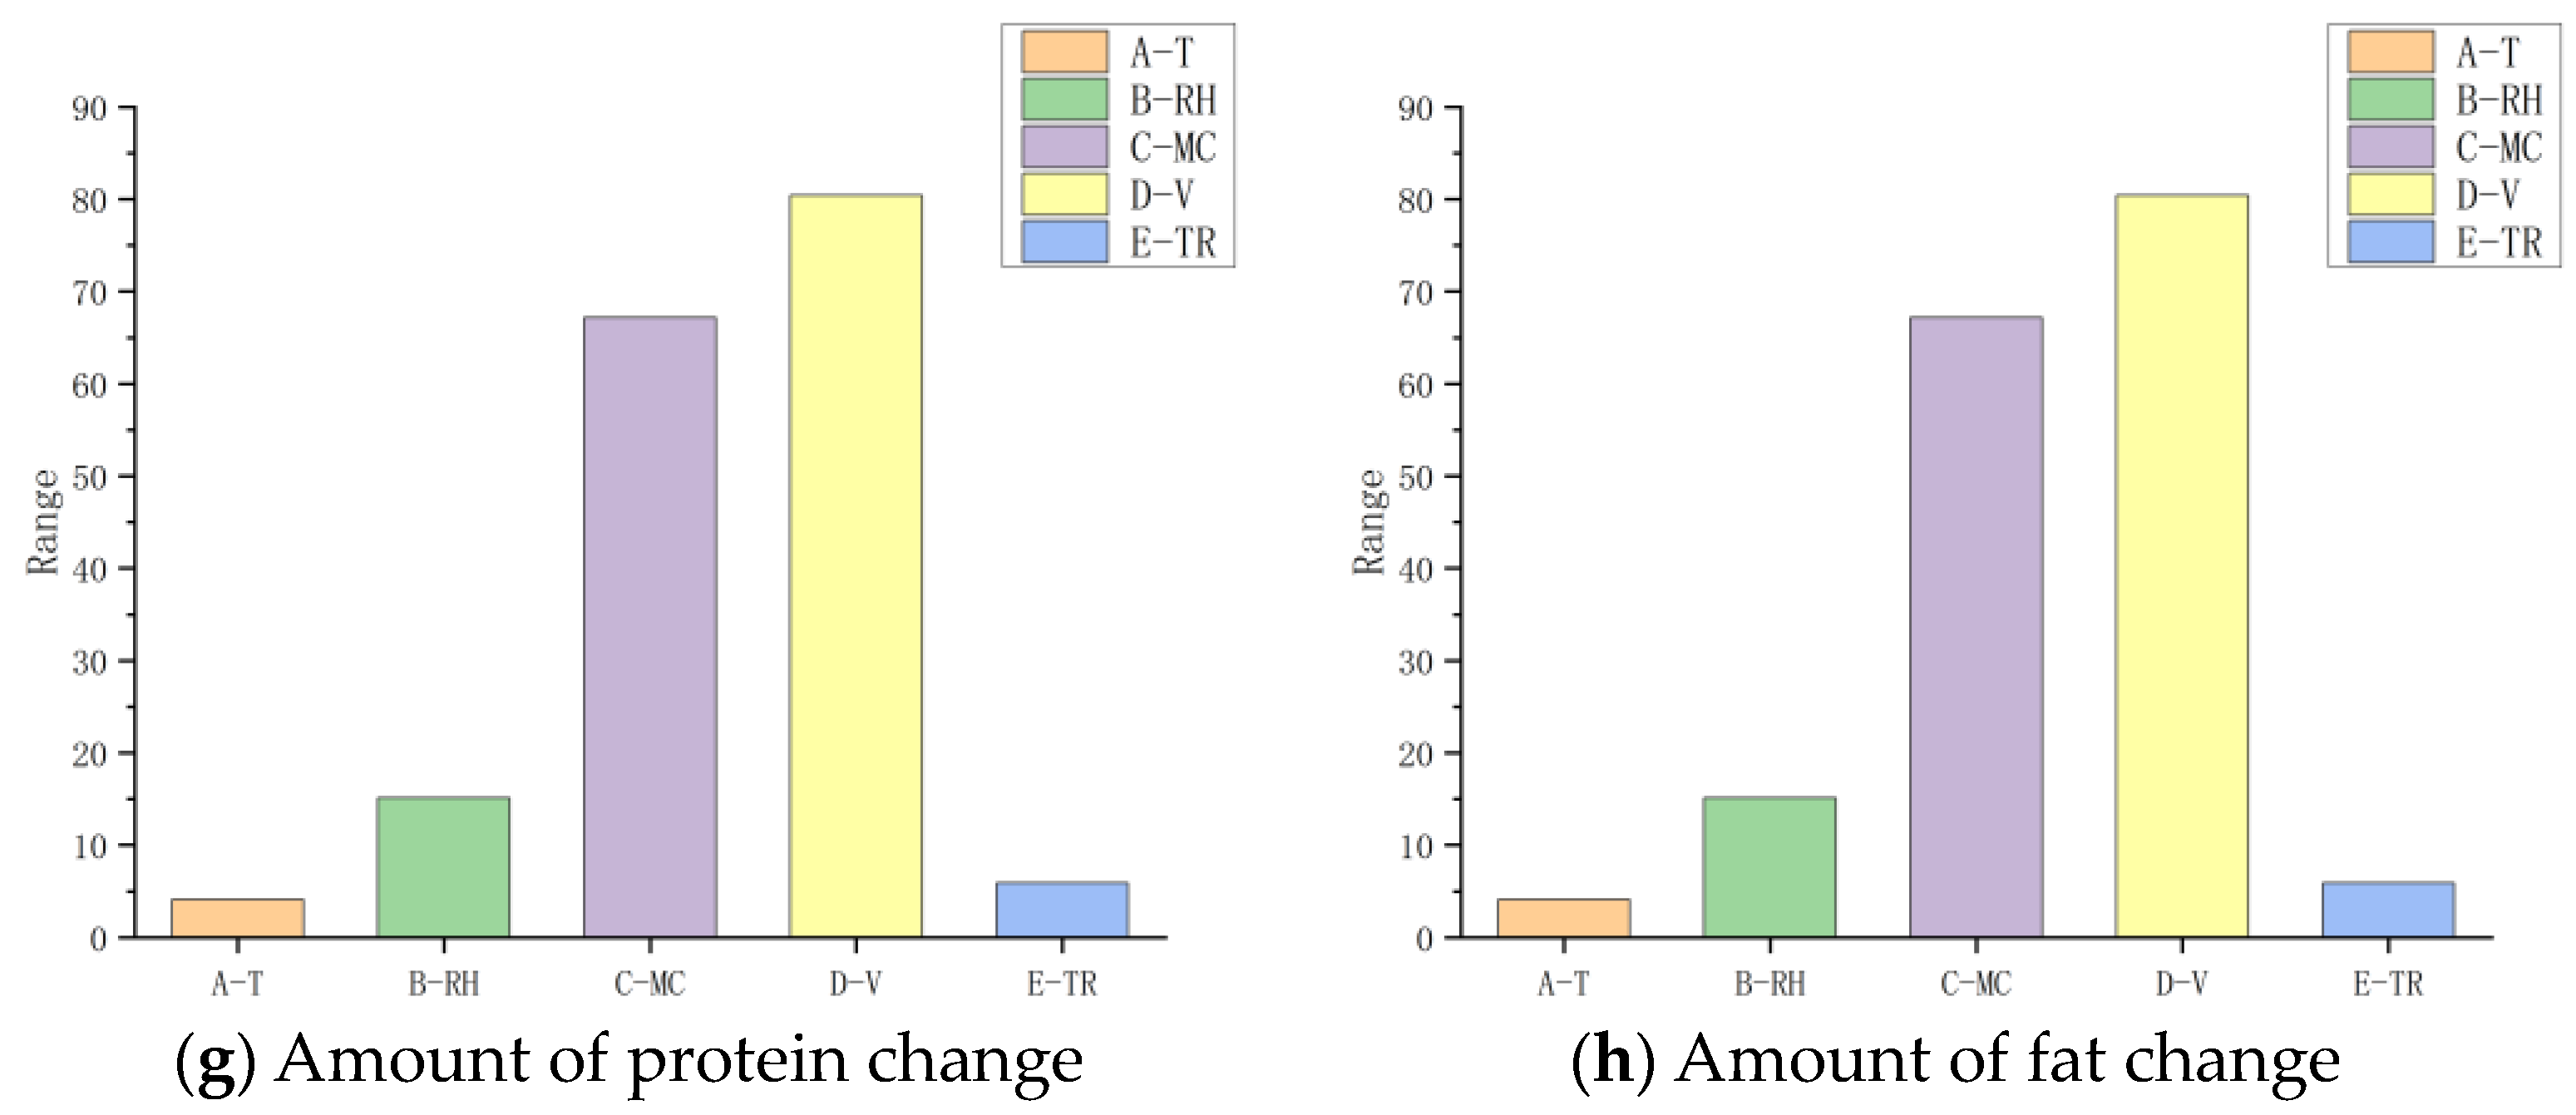
The experimental results were analyzed and processed using Design Expert software. According to the established regression model, a response surface diagram of the interaction between factors on each index was obtained, as shown in Figure 3, Figure 4, Figure 5, Figure 6, Figure 7, Figure 8, Figure 9 and Figure 10. According to the results in Table 5, the F value reflects the degree of influence of each factor on the response. Table 6 lists the F value of each factor on the response index. A contribution diagram of the factors on the response index was drawn using the F value (Figure 2). The p value of the model was <0.01, and R2 was >0.89, indicating that the model had high accuracy. The regression equation showed that the influence of each factor on the response value was not a simple linear relationship but was also affected by the interaction.
Figure 3.
Influence of the interaction on Dtn.

Figure 4.
Influence of the interaction on germination rate.

Figure 5.
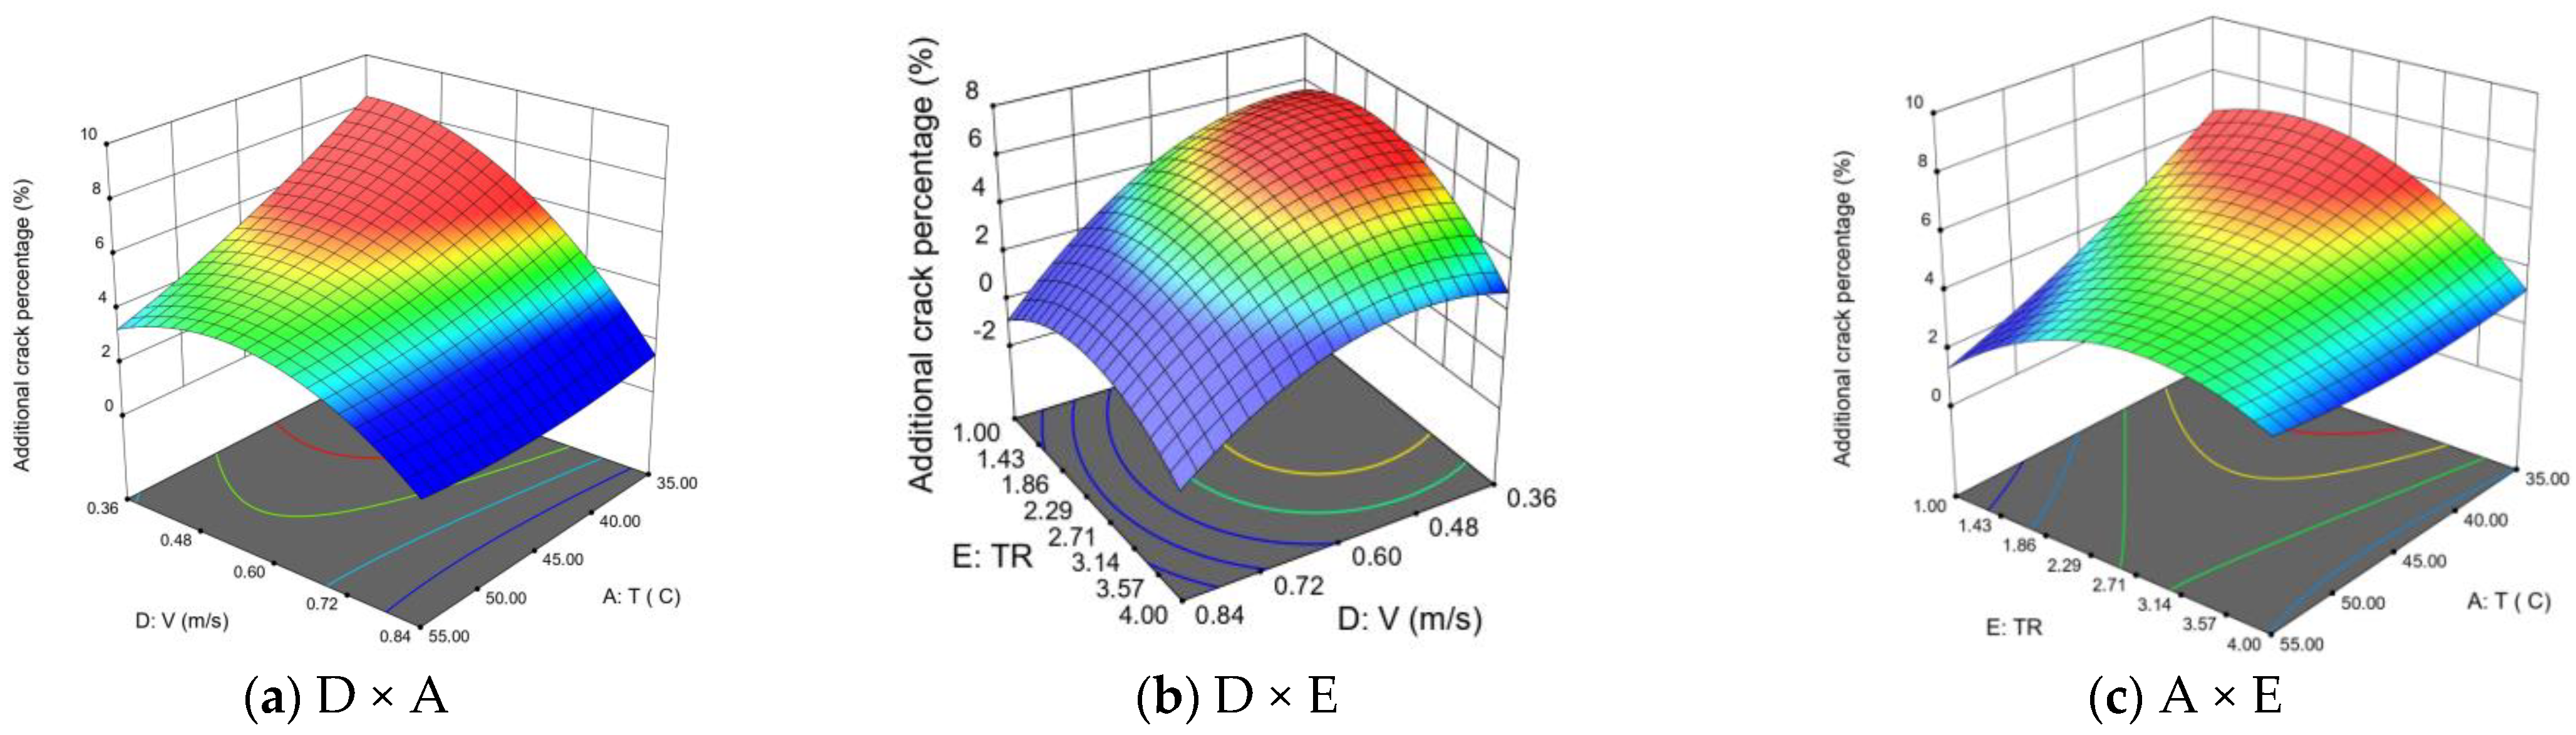
Influence of the interaction on ACP.

Figure 6.
Influence of the interaction on HRY.

Figure 7.
Influence of interaction on fatty acid value.

Figure 8.
Influence of the interaction on the resistant starch concentration.

Figure 9.
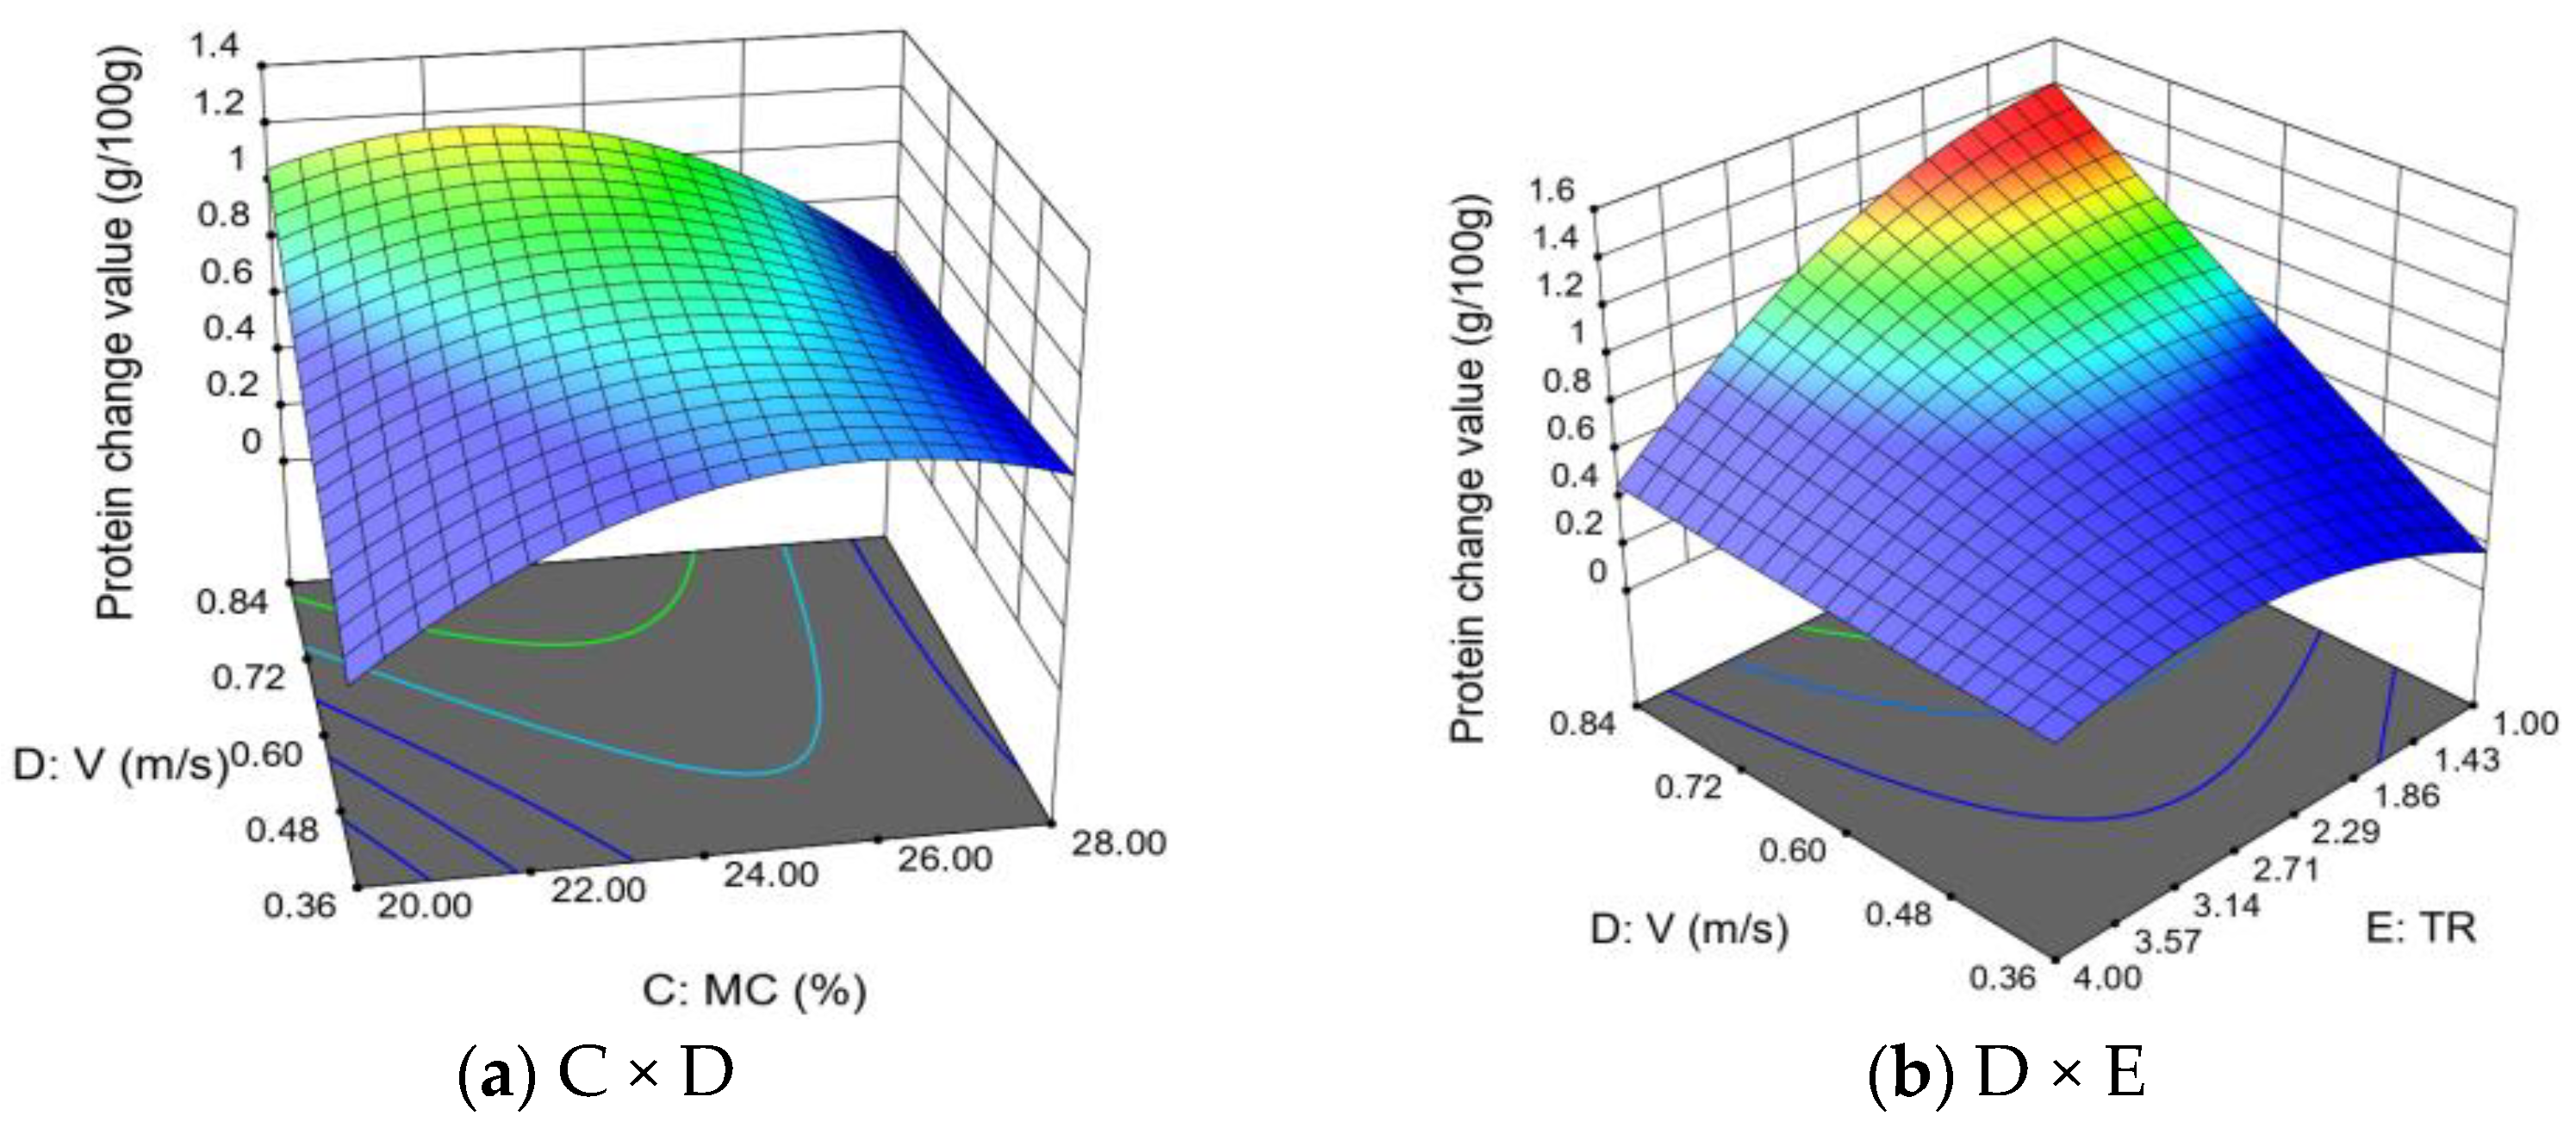
Influence of the interaction on the amount of protein change.

Figure 10.
Influence of the interaction on changes in body fat.

Note: The change trend of output variables is represented by the change of color. The 3D diagram of the response surface in this paper shows the gradually increasing trend of output variables from cool color (dark blue) to warm color (big red).
3.2.1. Drying Characteristic Index
- (1)
- Influence of test factors on Dtn
Net drying time (Dtn, total drying time minus recovery time) is a characteristic of reaction drying efficiency. The contribution rate shown in Figure 2a was drawn by the F value, and the order of factors affecting Dtn was MC > T > RH > TR > V, indicating that MC, T, and RH were the main factors affecting Dtn. The Dtn regression equation based on the variance analysis results in Table 5 after excluding insignificant terms is shown in Table 4. The coefficient of determination (R2) of the model was 0.8977, and the CV value was 3.2%. The model had good fitting ability and reliability. As shown in Figure 3a, in the low Dtn area, the effect of changing temperature and initial moisture level on the reduction of Dtn was not obvious, as in the high Dtn area. Excessively shortening Dtn and adjusting the process did not significantly improve drying efficiency but increased energy consumption and quality degradation. As shown in Figure 3b, in the high humidity area, the change in V was obvious; in the low humidity area, the change in air speed was not obvious, indicating that the higher the humidity, the more obvious the impact of air speed on Dtn. In the case of low initial moisture content, high humidity, and high recovery ratio, Dtn was short, indicating that the appropriate recovery process was beneficial to the drying process. Figure 3c shows that when SRR is high, the increase in SRR decreases Dtn, which is particularly obvious at low humidity, indicating that there is a critical value for SRR and that prolonging the SRR will not improve the drying efficiency. When SRR was prolonged to a certain time, the internal moisture was basically balanced, and Dtn no longer improved. Bertotto and Jin et al. reached similar results [12,21].
- (2)
- Influence of test factors on germination rate (PG)
The germination rate is an important indicator for evaluating the activation of rice seeds after drying. Figure 2b shows the contribution rate using the F value, and the order of factors affecting PG was MC > TR > V > RH > T. MC and TR had the greatest impact on the germination rate, while V and RH had smaller impacts. T had almost no impact on the germination rate. The regression equation of the germination rate after removing insignificant terms is shown in Table 4. R2 of the model was 0.9482, and the CV value was 0.47%. The model had good fitting ability and reliability [22,23].
As shown in Figure 4a, the curved surface presented the highest part of the curved area, indicating that the germination rate was best at a high air speed and low humidity and at a low air speed and high humidity. Because the evaporation rate of water on the surface of rice is slow, it is conducive to maintaining the water balance inside the rice [23]. As shown in Figure 4b,c, the germination rate was also higher when the initial moisture content was high and the slow-sudden ratio was high. This is because the water balance inside the rice and the drying process are more uniform, making the inside of the rice more active. These factors are conducive to improving germination rates. Because the hot air speed makes the moisture on the surface of rice evaporate faster, and water migration brings the internal moisture to the surface faster, it can reduce the retention time of the internal moisture of the grain and reduce the risk of mold and bacterial mildew [24,25].
3.2.2. Processing Quality
- (1)
- Effects of test factors on ACP
The increase rate of burst waist is the change rate of burst waist after reaction drying and before drying, which is an important indicator for evaluating rice quality after drying. As shown in Figure 2c, the order of factors affecting HRY was V > T > TR > MC > RH, and V had the greatest impact on ACP, followed by hot air temperature. The ACP regression equation is shown in Table 4. R2 of the model was 0.9631, and the CV value was 3.33%, indicating that the model had good fitting ability and reliability. The steeper the surface, the greater the impact of the reaction interaction on the response value. Figure 4a shows the obvious interaction between V, T, and TR, which is consistent with the results of the contribution rate plotted by the F value in Figure 2b. As shown in Figure 5a, the increase rate of burst waist was greatly affected by hot air temperature at low air speed, while at a high air speed, the increase rate of burst waist was not obviously affected by hot air temperature, and the increase rate of burst waist was the lowest at a high air speed. At a high air speed, the air flow was more intense, the residence time of the hot air temperature was reduced, and the rice surface was heated unevenly, which may lead to the insignificant effect of burst waist on hot air temperature. Moreover, when the air speed is too low, the rice is in a glassy state with high hardness and elastic modulus, and internal stress exceeding its own hardness is generated due to the existence of an internal moisture gradient, which also makes the rice extremely susceptible to burst waist [23,26].
As shown in Figure 5b,c, when the slow-softening ratio was low but the air speed was high, a large moisture gradient formed inside the rice, leading to further expansion of the glass transition temperature difference between the inner and outer layers and further increasing the expansion coefficient and stress difference between the inner and outer layers. When the stress was greater than the strength of rice, the cracking rate increased. As shown in Figure 5c, the slow-softening ratio was low, and the high-temperature area showed that the increase rate of waist burst decreased. This is because the evaporation rates of water on the surface and inside of rice are relatively consistent, reducing the uneven internal stress and the gap between inner and outer moisture, making overall drying more uniform, which is consistent with the research results of Dong [27] and Cnossen [28] et al. However, when the slow-softening ratio was high, as shown in Figure 4c, the temperature had little effect on the waist burst rate, which inhibited waist burst. However, slow-softening for too long reduced the drying efficiency of rice.
- (2)
- Influence of test factors on HRY
Homogeneous rice yield (HRY) is a direct indicator of rice quality, which plays a key role in rice grading and drying quality evaluation [29]. Figure 2d shows the contribution rate. The order of factors affecting HRY was RH > MC > RH > T > V. RH had the greatest impact on HRY, followed by MC and RH. The HRY regression equation is shown in Table 4. R2 of the model was 0.8977, with a CV value of 0.35%. The model had good fitting ability and reliability.
As shown in Figure 6a–c, when the humidity changed within the range of 38–50 °C, HRY changed more drastically, indicating that ACP was more susceptible to humidity changes at higher humidity levels. Appropriate drying humidity helps control the balance of internal and external moisture in rice [23].
3.2.3. Nutritional Quality
- (1)
- Influence of test factors on fatty acid value (FAV)
The fatty acid value reflects an important indicator of rice nutritional value and eating quality. The order of factors affecting FAV was TR > V > RH > T > MC, as shown in Figure 2e of the Factor Contribution Rate. The maximum influence of SRB on fatty acid value was found. The regression model of fatty acid values is shown in Table 4. R2 of the model was 0.8909, and the CV value was 3.25%. The model had good fitting ability and reliability.
As shown in Figure 7, the fatty acid value was positively correlated with air speed and initial moisture and negatively correlated with SRB. This is because when the air speed decreases, the drying rate of rice slows down, and the time of oil exposure to air is prolonged, increasing the possibility of oil oxidation and decreasing the fatty acid value. At the same time, a sustained high air speed destroys the specific spatial structure of enzyme proteins, and the activity of rice lipase decreases, which reduces the production of lipid hydrolysis and free fatty acids in rice, resulting in an increase in the fatty acid value [26]. When the initial moisture is high, it takes longer for rice to remove water during the drying process, which may lead to an increase in the degree of oxidation of fatty acids. A high SRB leads to a slow drying rate, which is conducive to reducing the fatty acid value.
- (2)
- Influence of test factors on resistant starch concentration (RSC)
Resistant starch, also known as “indigestible starch”, is recognized as a beneficial dietary fiber. The increase of its concentration can delay the increase of blood sugar, improve the glucose and lipid metabolism and insulin resistance of the body, have a preventive effect on chronic metabolic diseases, play its digestive characteristics, and promote the comprehensive quality of rice [30,31]. The factor contribution is shown in Figure 2f. The order of factors affecting the resistant starch concentration was V > RH > T > TR > MC. The resistant starch concentration regression model is shown in Table 4. R2 of the model was 0.9081, and the CV value was 4.34%. The model had good fitting ability and reliability.
As shown in Figure 8a, the resistant starch concentration of the RSM reached a peak value. This is because resistant starch can promote the transformation of starch into resistant starch at appropriate temperatures and humidity. However, when the temperature or humidity is too high or too low, it leads to the degradation of starch or the competition of other reaction pathways, thereby reducing the formation of resistant starch. As shown in Figure 8b, the concentration of resistant starch decreased with the decrease in temperature and the increase in initial moisture content and decreased with the decrease in humidity.
- (3)
- Influence of test factors on the protein change value (PCV)
Protein content can affect the nutritional value and processing quality of rice. The difference in the protein content before and after drying under different technological conditions is called the protein change value. The contribution rate of each factor is shown in Figure 2g, and the regression equation of the protein change value is shown in Table 4. The order of factors affecting HRY was V > MC > RH > TR > T. R2 of the model was 0.89, and the CV value was 4.46%. The model had good fitting ability and reliability.
As shown in Figure 9, the interaction between the initial moisture content and air speed was obvious. The protein change value at low initial moisture content was sharper than that at high initial moisture content and increased with an increase in air speed. The protein change value was highest at low sensitivity and high air speed [32,33,34]. A high air speed for too long promotes the change in rice grain germ organization structure, accelerates the oxidation degeneration of protein, and thus reduces the protein content [35,36,37].
- (4)
- Effects of experimental factors on the fat change value (FCV)
During the rice drying process, environmental conditions such as high temperature and high humidity lead to fat hydrolysis and produce peroxides, glycerol, and free fatty acids and promote lipid oxidation to produce aldehydes and ketones, which affect the change in the fatty acid value, thus affecting the aging and taste index of rice. Figure 2h shows the contribution rate of each factor. The order of factors affecting the fat change value was RH > T>MC > V > TR. The regression equation of the fat change value is shown in Table 4. R2 of the model was 0.8991, and the CV value was 23.36%. The model had good fitting ability and reliability. The fat mass fraction of rice during the drying process showed a decreasing trend. On the one hand, it is because fat hydrolysis produces peroxides, glycerol, and free fatty acids during the rice drying process. On the other hand, high temperatures can also promote lipid oxidation to produce aldehydes and ketones, and the fat mass fraction decreases the fastest at 37 °C. Lipase belongs to hydrolytic enzymes and is the first enzyme to participate in the reaction of fat decomposition.
As shown in Figure 10, the lipase activity decreases continuously during the drying process because the fatty acid content of dry rice increases, and the pH value decreases, leading to a decrease in lipase activity. The higher the storage temperature, the more the lipase activity of rice decreases, which is because a high temperature promotes the production of fatty acids, leading to a decrease in pH value and further inhibiting lipase activity.
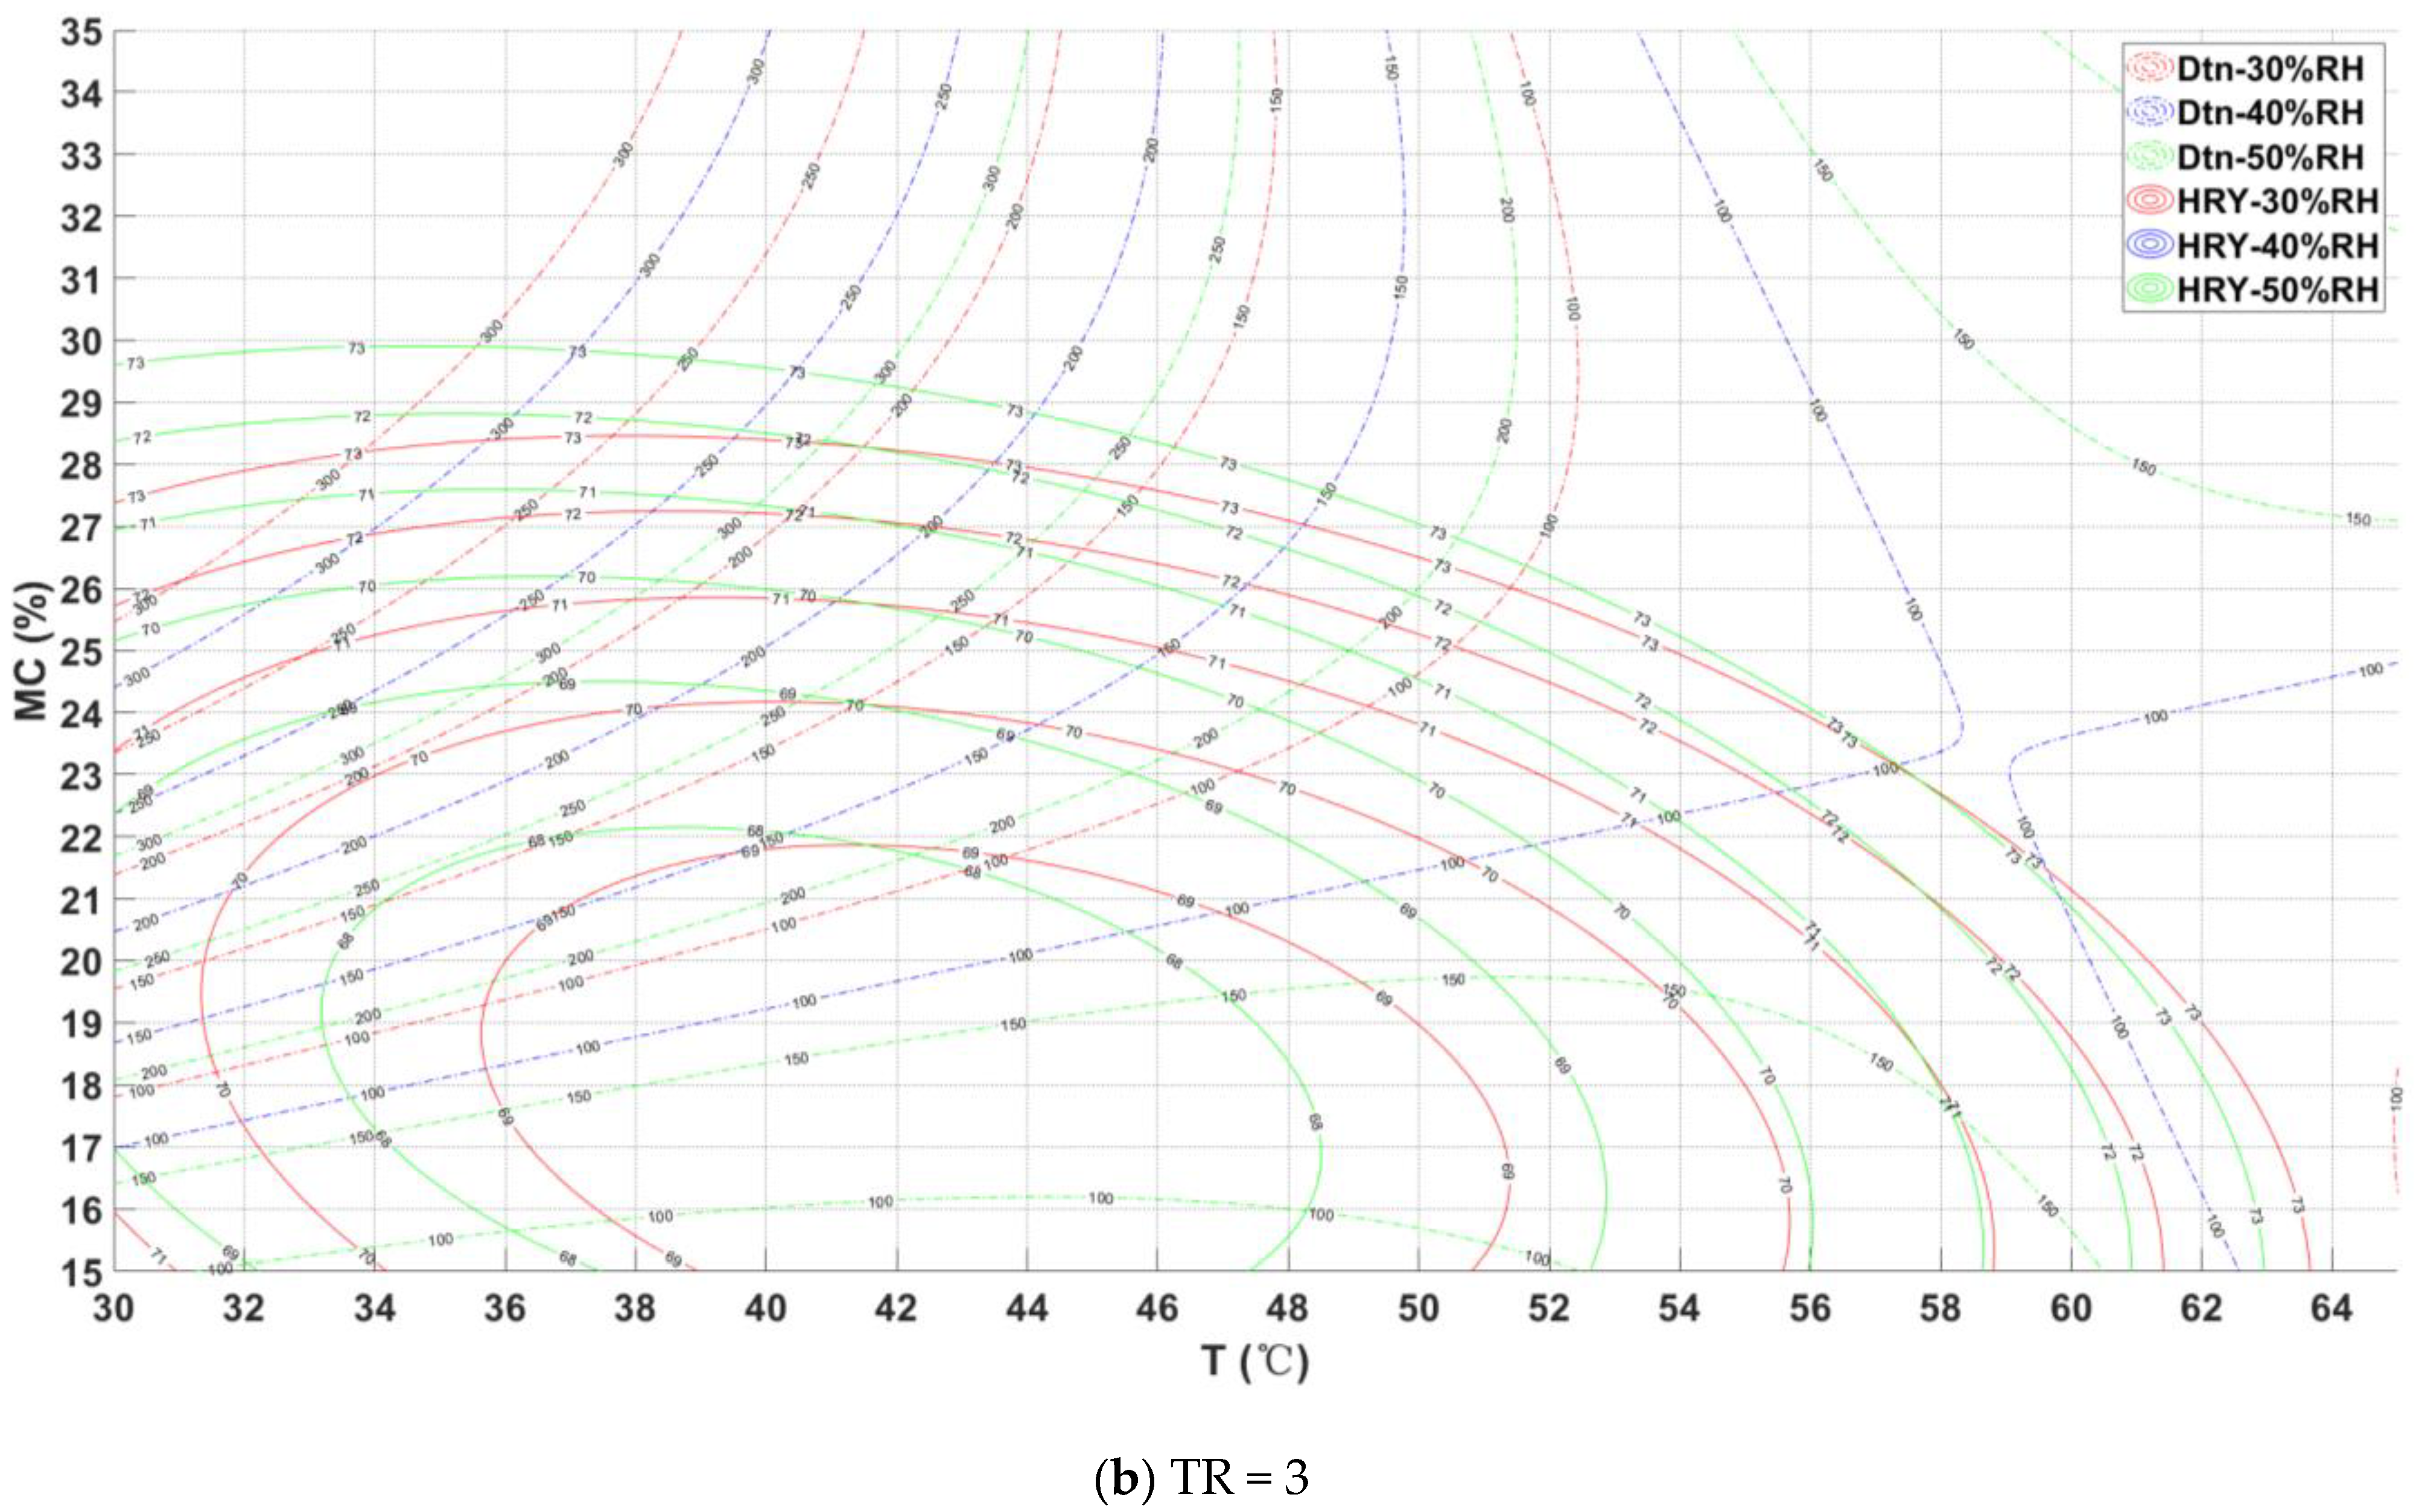
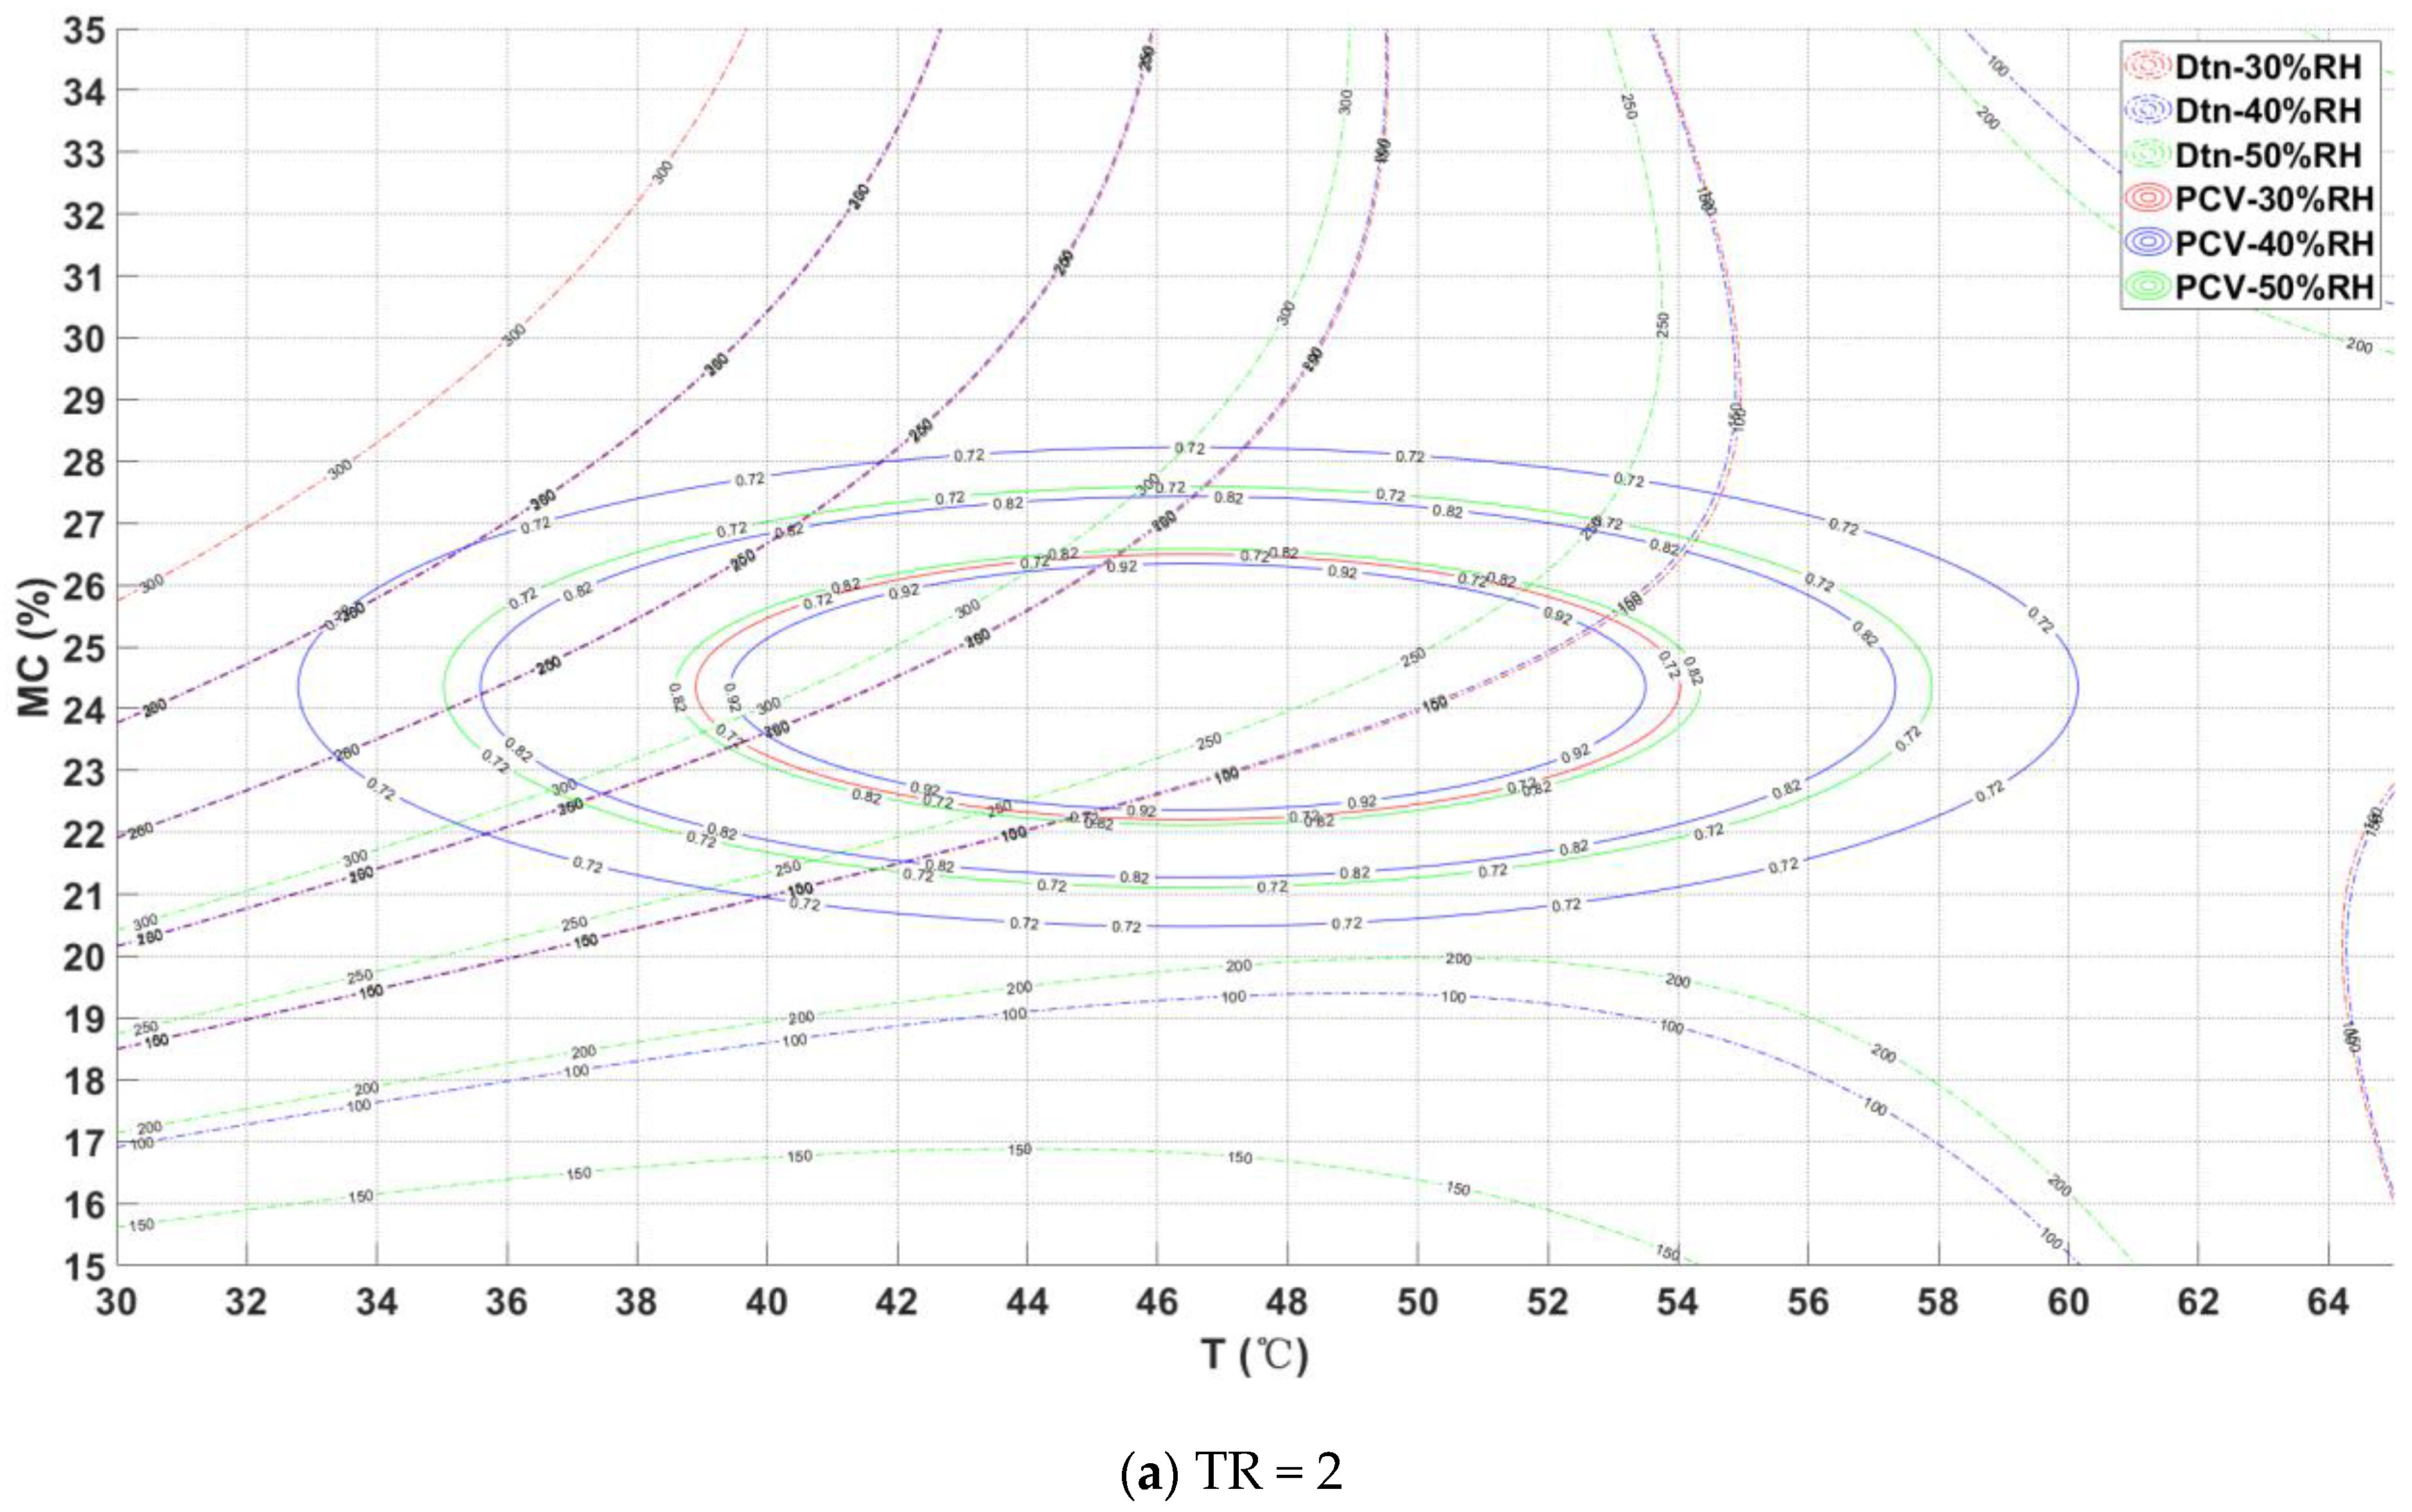
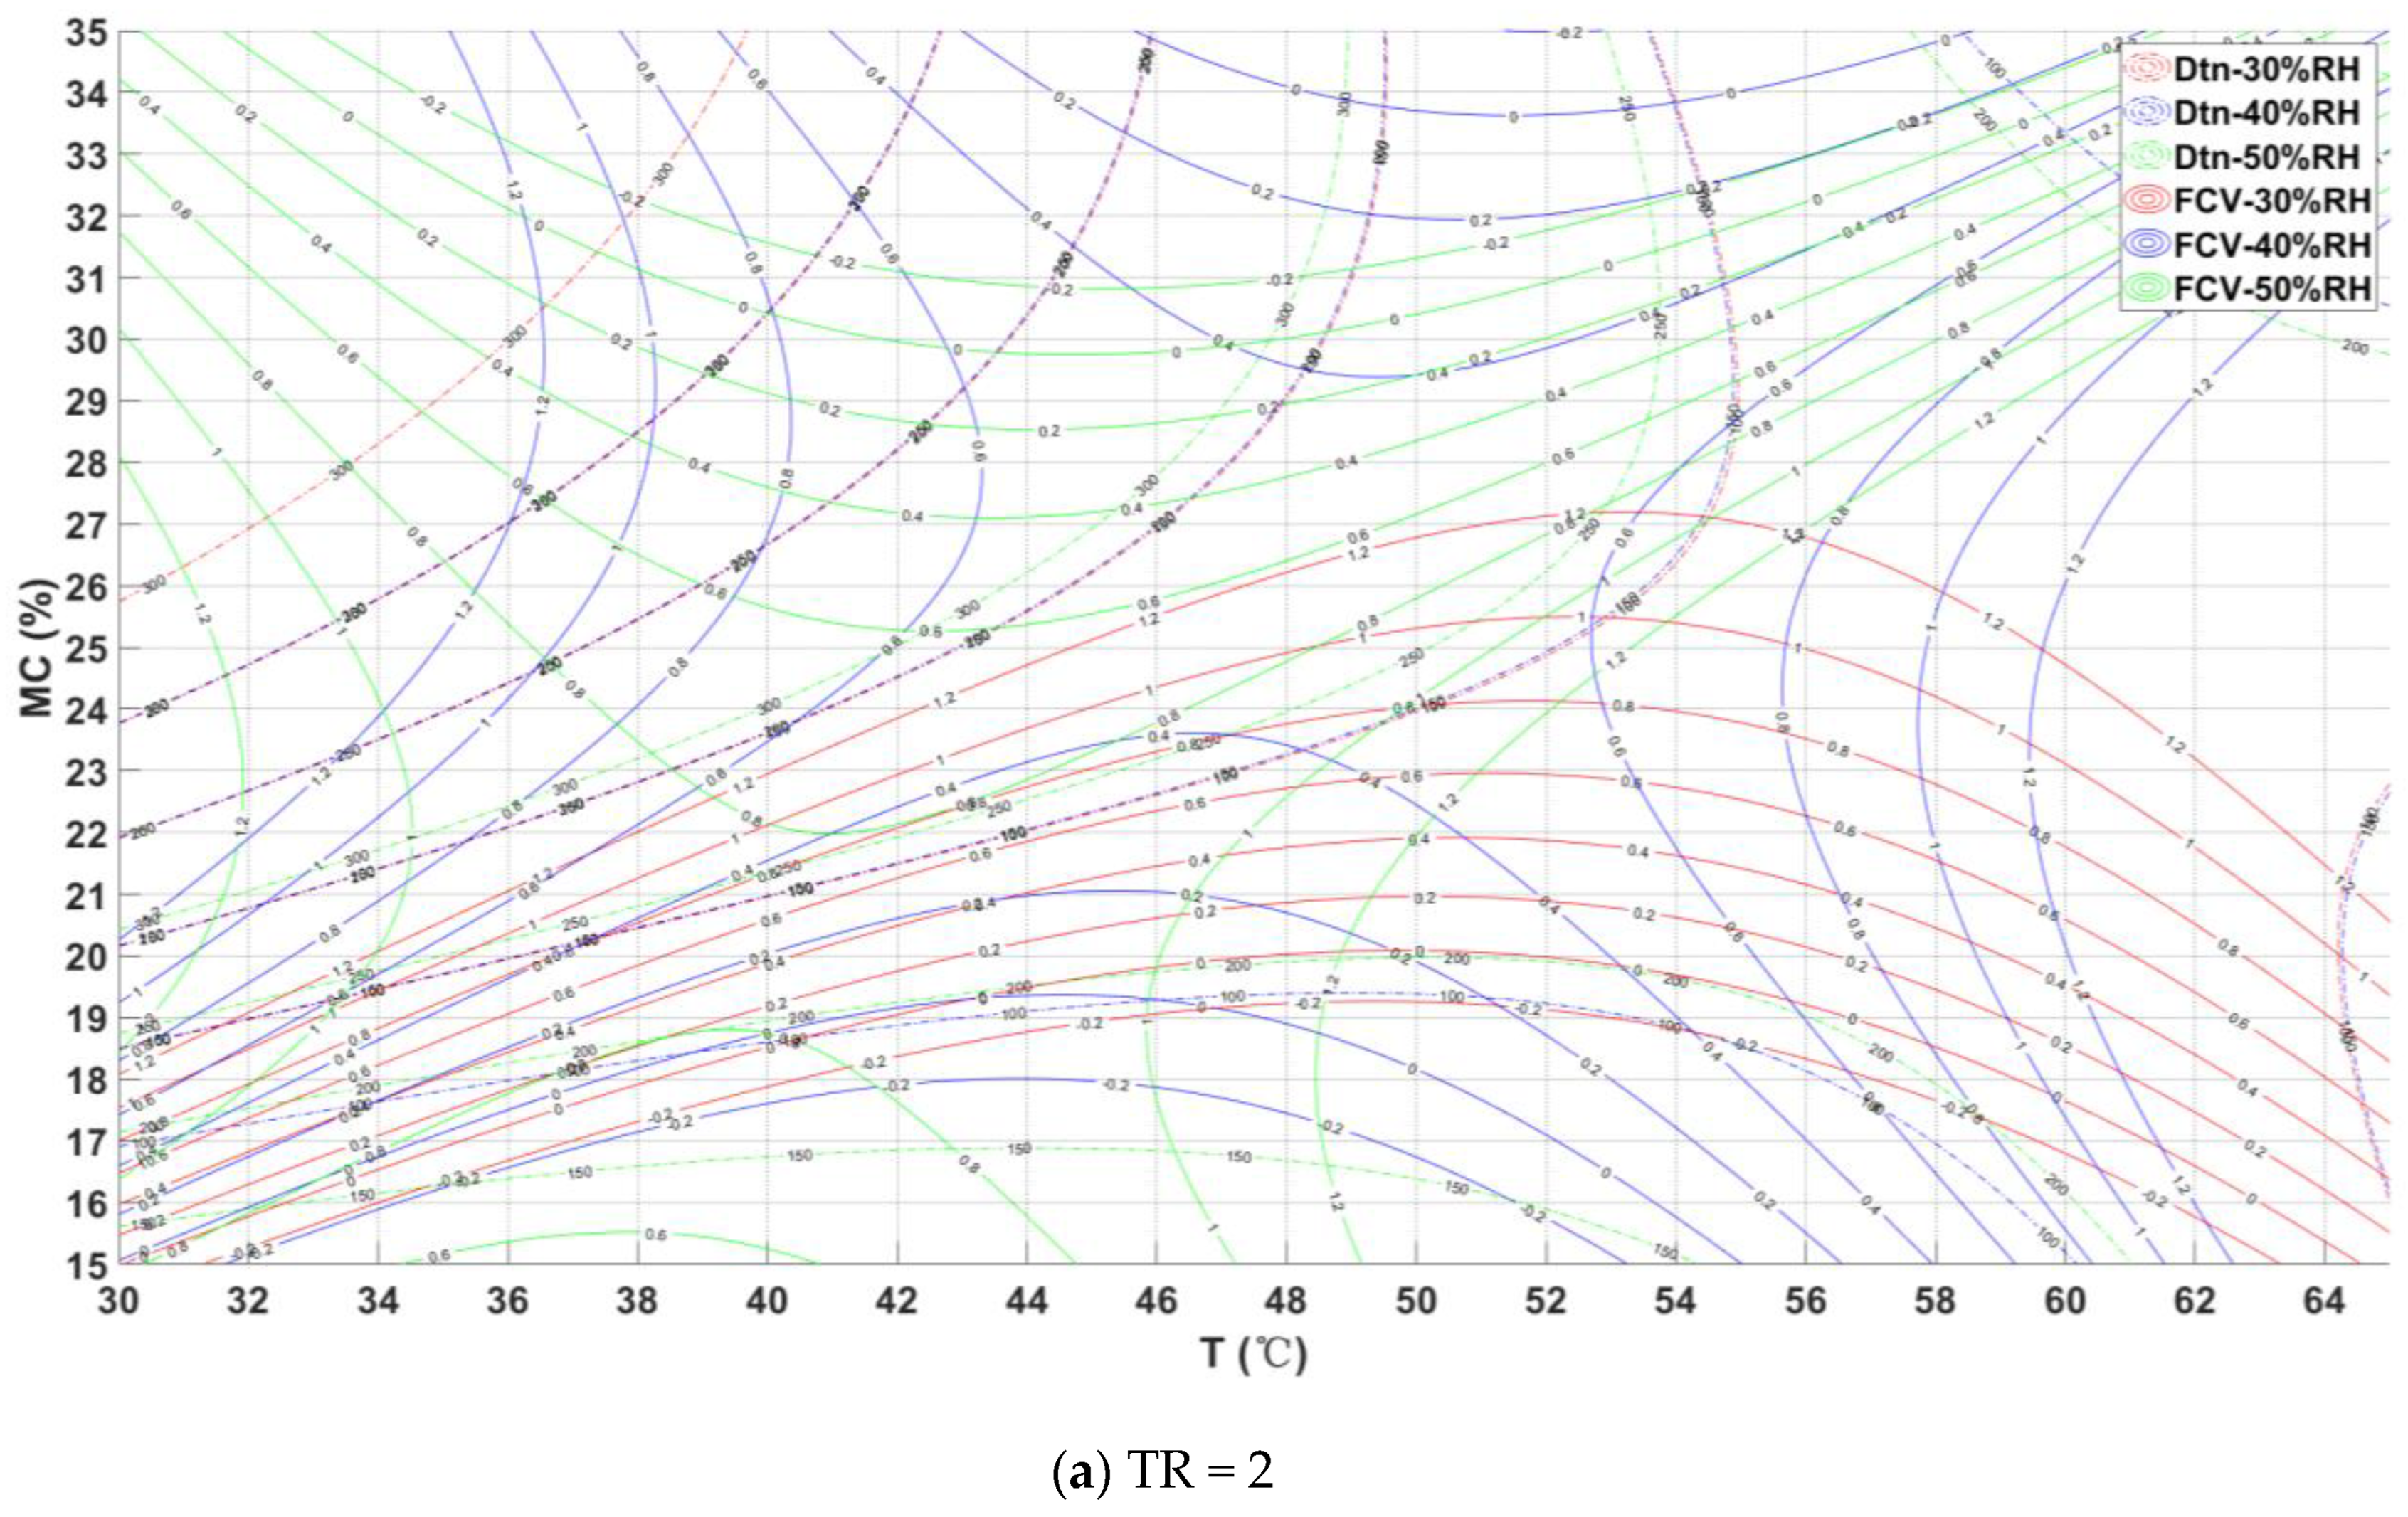
3.3. Process Reference Chart
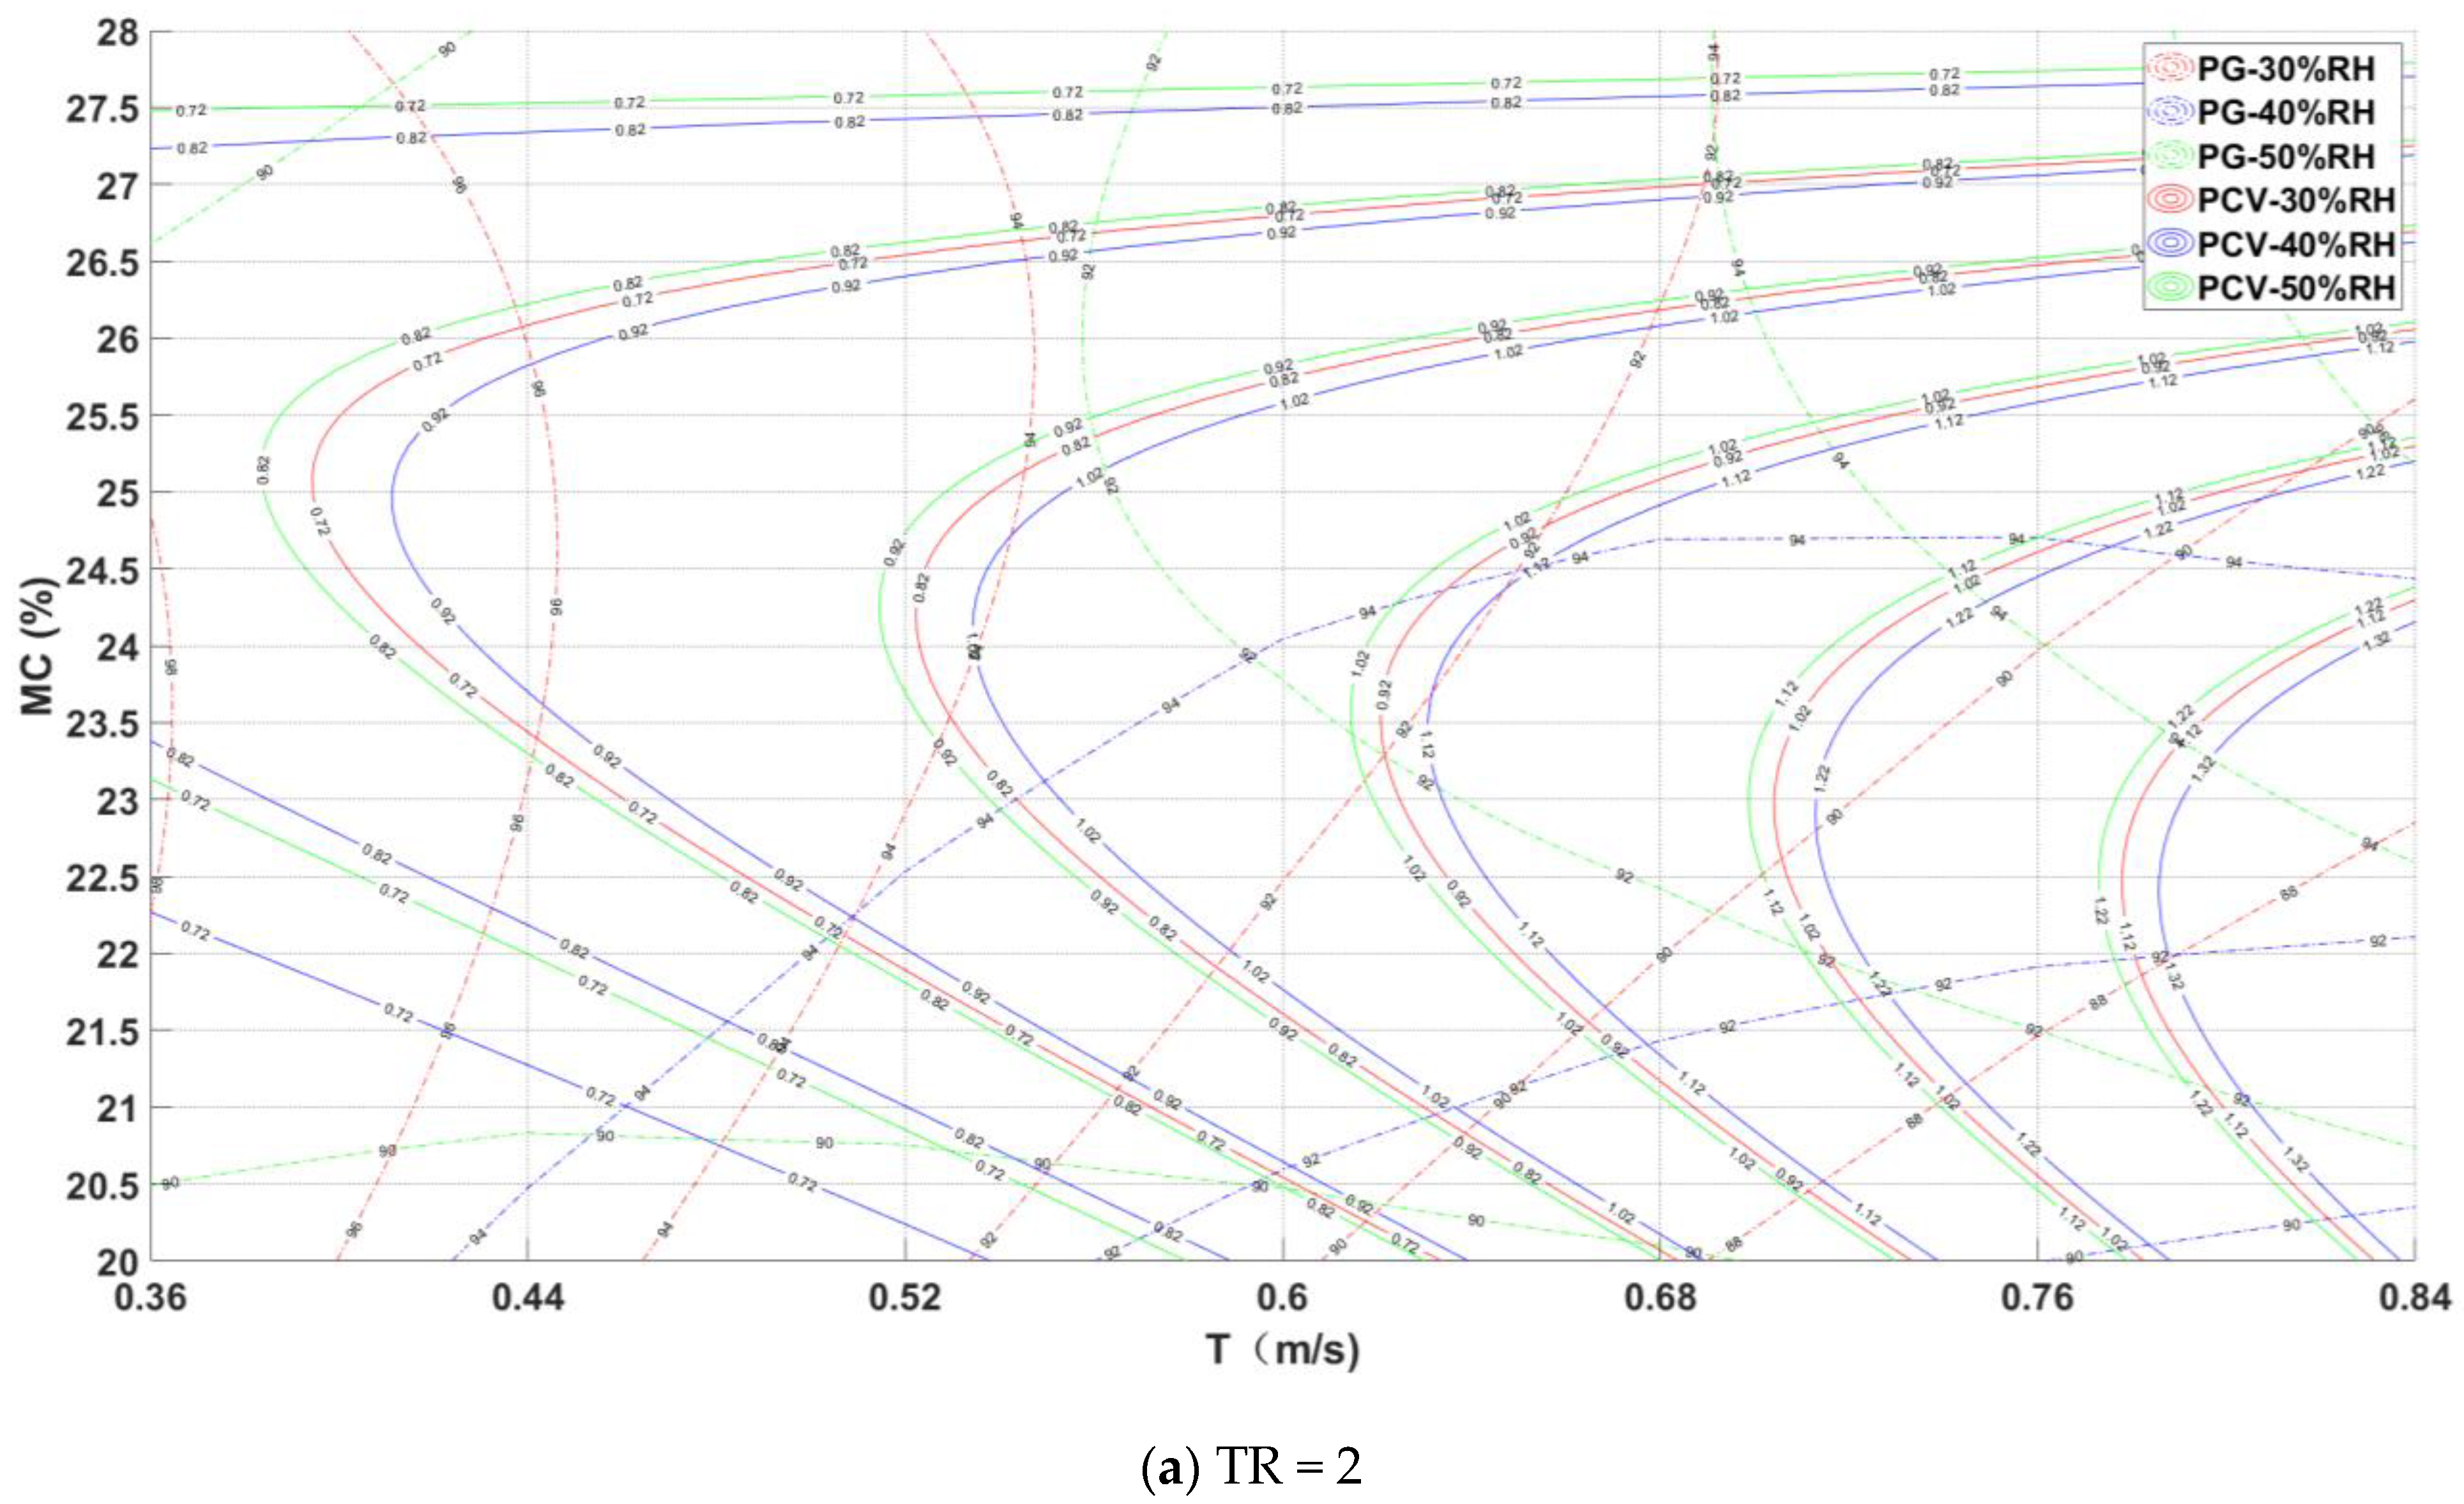
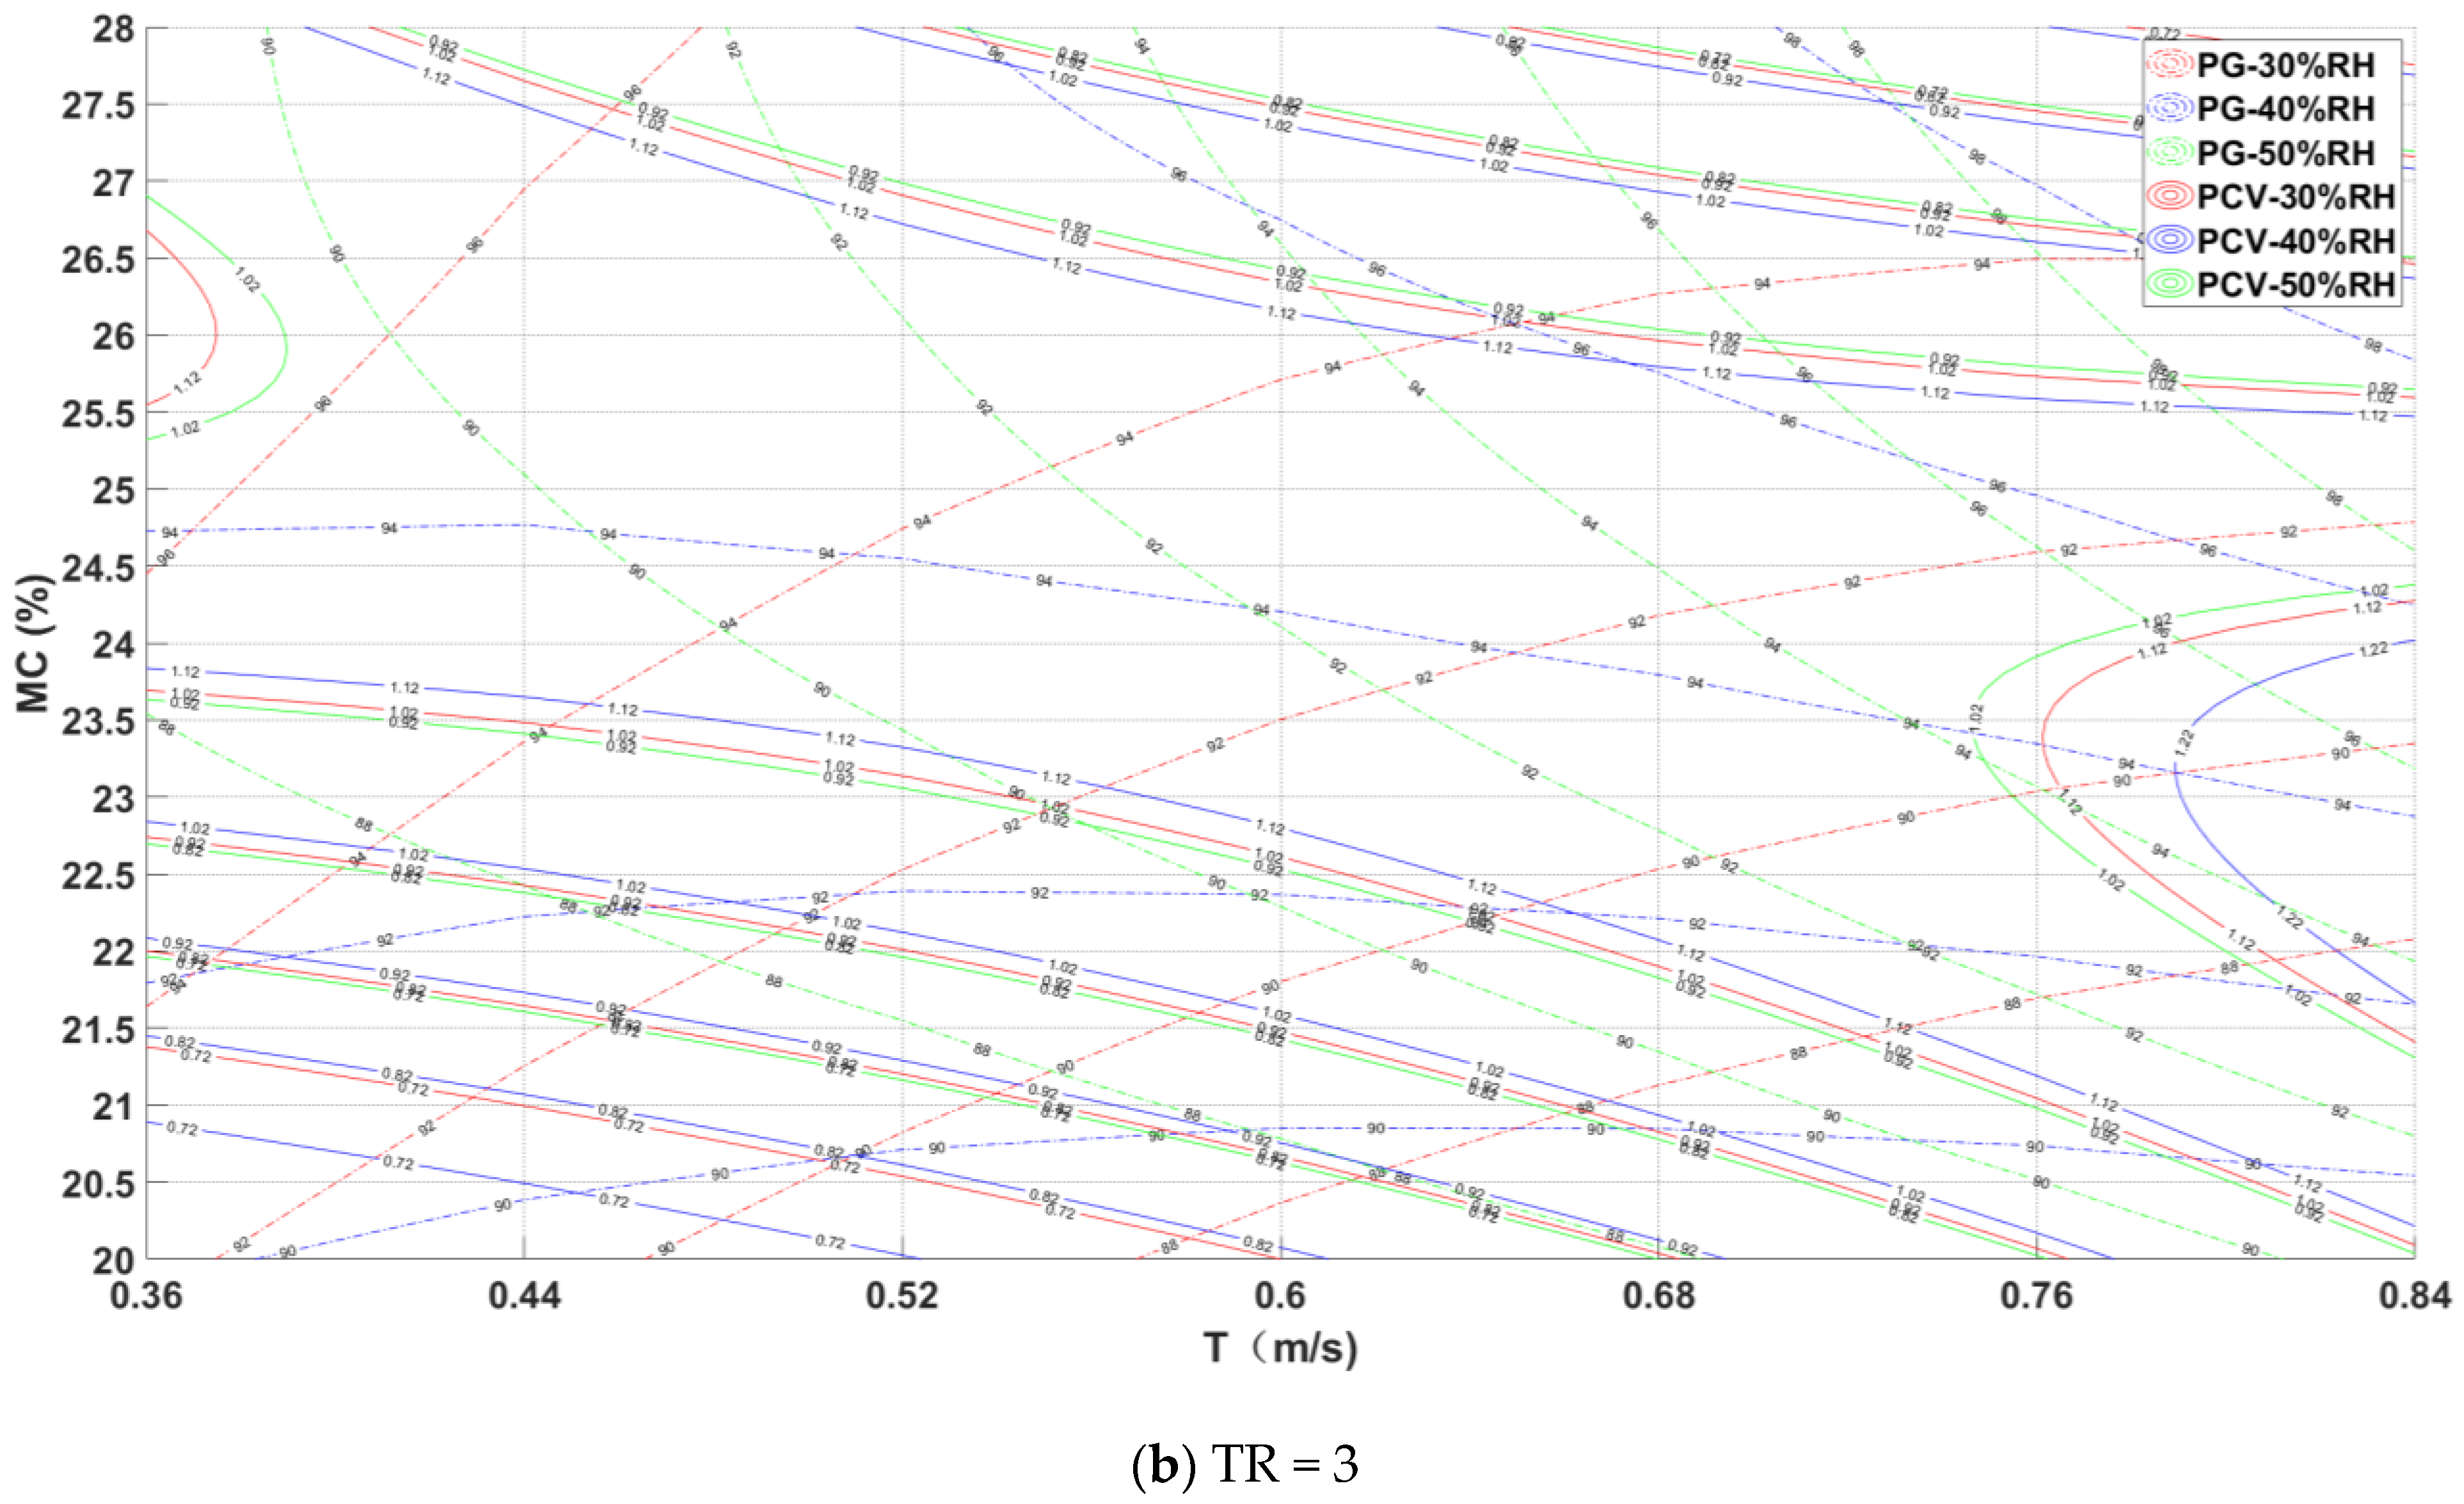
Based on the previous grinding quality process reference chart [4,12], this paper generated a process reference chart with the targets of drying characteristics, processing, and nutrition quality indexes to shorten the drying process and ensure quality. The chart reflects the predicted value of one or several quality indexes in rice that may be obtained when drying rice under different process parameters and can also set the target value of one or several indexes to retrieve the corresponding drying process parameters. For the experimental results, considering the sensitivity and adjustable factors, the hot air temperature is proposed as the main process parameter to be investigated in the process reference chart, and the initial moisture and humidity can be considered secondary parameters in the process reference chart. Figure 11a,b show the process reference chart of multiple indexes when the easing ratio is 2 and 3, respectively, which can meet the easing ratio of different grain dryers. Figure 11 shows the process reference chart coupling Dtn and ACP. When the initial moisture was high (humidity is about 28%), the net drying time value decreased with the increase in temperature, while the waist bursting rate first decreased and then increased with the increase in temperature. When the initial moisture was low and the drying temperature was high, the drying time of rice decreased, while the waist bursting rate increased, indicating that the waist bursting rate was relatively low (about 3% or less) at 46–48 °C. The same waist bursting increase rate and different humidity contours meet at a point. At the top of the point, the waist bursting increase rate of humidity was large, and at the bottom of the point, it was the opposite, which further explains the negative correlation between RH and MC on ACP. According to the national standard “Grain and oilseed inspection—Determination method of yellow rice and cracked grain” [16], the waist swelling rate of dry rice should not exceed 3%. For the net drying time, a relatively moderate value (230 min) was selected according to the prediction results of the experimental model, which agrees with the requirements of most quality indicators. The area with ACP ≤ 3% and Dtn ≤ 230 min was the optimal interval. Using Figure 11a, 50% RH as an example, the area enclosed by the curves with Dtn and ACP at 50% RH (X axis and Y axis, the slant part of the shadow) is the required optimal interval.
To illustrate the use of the reference process diagram, set the initial moisture of the raw grain to be 24.8%, the humidity measurement result inside the dryer to be 50%, the explosive waist increase rate to be 3%, and consult the reference process diagram Figure 11a to dry at 57.3 °C (point A); then, the drying time is 230 min.
In addition to coupling drying time and waist bursting increase rate, other milling, activation, and quality indexes can also be coupled to regulate multiple quality indexes at the same time. For example, Appendix A (Figure A1, Figure A2, Figure A3, Figure A4, Figure A5, Figure A6 and Figure A7) show a process reference diagram for coupling each index with Dtn and other quality indexes.
3.4. Parameter Optimization and Model Validation
To obtain the optimal combination of slow-drying parameters, the target value of net drying time, waist bursting increase rate, fatty acid value, and fat mass fraction was limited to the minimum, while the whole rice rate, resistant starch concentration, germination rate, and protein mass fraction were maximized. The model was optimized by Design-Expert software, and the optimal combination of process parameters within the test range was obtained as follows: hot air temperature, 43.138 °C; hot air humidity, 48.003%; initial moisture content, 23.8%; hot air speed, 0.7 m/s; and slow-drying ratio, 3.55. At this time, the net drying time was 157.606 min, the waist bursting increase rate was 3.479%, the whole rice rate was 70.454%, the fatty acid value was 20.932 mg, the resistant starch concentration was 20.932 μg/g, the germination rate was 94.151%, the protein mass fraction was 8.531 g/100 g, and the fat mass fraction was 2.372 g/100 g.
The optimized parameters were used to conduct the validation tests. To eliminate random errors, three parallel experiments were conducted, and the test results are shown in Table 7. The analysis showed that the average error between the test value and the software optimization parameter value was 3.71%, indicating that the test results were basically consistent with the optimization results and that the selection of influencing factors of rice drying quality was reasonable [38].
4. Conclusions
A response regression model of rice drying under multiple factors was established using RSM with a central composite design, and a process reference chart was drawn. The results showed that the quadratic polynomial model of response quantity was statistically significant. Based on the analysis of the effects on drying characteristics and drying quality, the following conclusions were drawn:
(1) Combined with the analysis of Design-Expert software, hot air temperature, hot air humidity, initial moisture content, hot air velocity, and slow-recovery ratio had significant effects on many indicators of rice drying efficiency and quality (p < 0.05). The initial moisture content had no significant effect on the fatty acid value. The hot air temperature had no significant effect on the germination rate, and the hot air temperature and slow-recovery ratio had no significant effect on the change in protein quality (p > 0.05). There were certain interactions among multiple factors. At the p < 0.05 level, TMC had a significant effect on net drying time, total drying time, and waist burst increase rate. T*TR had a significant interaction with total drying time, and RHTR had a significant effect on net drying time and waist burst increase rate. RH*MC had a significant effect on the waist burst increase rate. The effects of the other indicators were analyzed in detail in the main text.
(2) Through the central composite experimental design, the optimal parameter combination of the slow-recovery drying process was confirmed as follows: hot air temperature, 43.138 °C; hot air humidity, 48.003%; initial moisture content, 23.8%; hot air velocity, 0.7 m/s; slow-recovery ratio, 3.55. Under this parameter combination, the net drying time of rice after drying was 157.606 min, the increase rate of waist burst was 3.479%, the rice percentage was 70.454%, the fatty acid value was 20.932 mg, the concentration of resistant starch was 195.259 μg/g, the germination rate was 94.151%, the protein mass fraction was 8.531 g/100 g, and the fat mass fraction was 2.372 g/100 g. Under this parameter combination, the dried rice showed good quality, and the relative error between the validation test results and the optimization results was 4.68%, indicating that the optimized process parameters could improve the rice drying quality.
(3) Using the RSM regression model, a process reference chart with a process retrieval and prediction function was drawn. The chart can provide practical guidance for the parameter regulation of drying operations, useful references for the early processing technology of rice after production, and a theoretical basis for exploring the mechanism of change in rice quality.
Author Contributions
Conceptualization, J.L. and Y.J.; methodology, J.L.; software, J.L.; validation, J.L. and Y.J.; formal analysis, X.Y.; investigation, J.L.; resources, Y.J.; data curation, J.L.; writing—original draft preparation, Y.J.; writing—review and editing, Y.J.; project administration, J.L.; funding acquisition, Y.J. All authors have read and agreed to the published version of the manuscript.
Funding
This research was funded by the Academy of National Food and Strategic Reserves Administration, grant number JY2303, and Henana Key Laboratory of Grain and oil storage facility & safety, HAUT, Zhengzhou, 450001, China, grant number 2020KF-A02.
Data Availability Statement
The data presented in this paper are available for verification by readers.
Acknowledgments
We express our gratitude to the reviewers for their invaluable guidance on this article.
Conflicts of Interest
The authors declare no conflict of interest.
Appendix A
Figure A1.
Dtn-HRY.


Figure A2.
Dtn-fatty acid value.


Figure A3.
Dtn-resistant starch concentration.


Figure A4.
Dtn-germination rate.


Figure A5.
Dtn-amount of protein change.


Figure A6.
Dtn-amount of fat change.


Figure A7.
Germination rate-amount of protein change.


References
- Rufino Franco, C.M.; Barbosa de Lima, A.G.; de Oliveira Farias, V.S.; Machado, E.A. Intermittent Drying of Rice Grains with Husk: Modelling and Experimentation. Dif. Found. 2020, 25, 9–36. [Google Scholar] [CrossRef]
- Xianzhe, Z.; Hui, L.; Liuyang, S.; Jinwu, W.; Lei, W.; Yong, Z. Study on the drying process of rice with variable temperature and hot air based on glass transition. JTCS Agric. Mach. 2020, 51, 10. [Google Scholar] [CrossRef]
- Jin, Y.; Yin, J.; Xie, H.; Zhang, Z. Reconstruction of Rice Drying Model and Analysis of Tempering Characteristics Based on Drying Accumulated Temperature. Appl. Sci. 2021, 11, 1113. [Google Scholar] [CrossRef]
- Jin, Y.; Wong, K.W.; Wu, Z.; Qi, D.; Wang, R.; Han, F.; Wu, W. Relationship between accumulated temperature and quality of paddy. Int. J. Food Prop. 2019, 22, 19–33. [Google Scholar] [CrossRef]
- Zhou, X.; Liu, L.; Fu, P.; Lyu, F.; Zhang, J.; Gu, S.; Ding, Y. Effects of infrared radiation drying and heat pump drying combined with tempering on the quality of long-grain paddy rice. Int. J. Food Sci. Technol. 2018, 53, 2448–2456. [Google Scholar] [CrossRef]
- Zhonghua, W.; Shanshan, W.; Xiaolin, D.; Lijuan, Z.; Zhongjie, Z. Numerical simulation and optimization of rice isothermal drying-slow quenching process. JFS 2019, 40, 7. [Google Scholar] [CrossRef]
- Zhonghua, W.; Bing, L.; Dandan, W.; Corning; Lijuan, Z. Study on drying retarding characteristics and crack generation law of rice. JTCS. Agricul. Mach. 2018, 49, 7. [Google Scholar] [CrossRef]
- Mahmood, N.; Liu, Y.; Munir, Z.; Zhang, Y.; Niazi, B.M.K. Effects of hot air assisted radio frequency drying on heating uniformity, drying characteristics and quality of paddy. LWT-Food Sci. Technol. 2022, 158, 113131. [Google Scholar] [CrossRef]
- Mahmood, N.; Liu, Y.; Saleemi, M.A.; Munir, Z.; Zhang, Y.; Saeed, R. Investigation of Physicochemical and Textural Properties of Brown Rice by Hot Air Assisted Radio Frequency Drying. Food Bioprocess Technol. 2023, 16, 1555–1569. [Google Scholar] [CrossRef]
- Behera, G.; Sutar, P.P. Starch gelatinization and drying of paddy using microwave rotary drum dryer: Optimization, kinetics, and cooking studies. Drying Technol. 2020, 39, 965–981. [Google Scholar] [CrossRef]
- Chen, J.; Wu, W.; Cheng, R.; Jin, Y.; Liu, Z. Optimization of hot air drying process of corn using genetic algorithm and response surface methodology. Int. J. Food Prop. 2020, 23, 753–764. [Google Scholar] [CrossRef]
- Jin, Y.; Yin, J.; Xie, H.; Zhang, Z. Investigation of a Precise Control Scheme for Rice Quality. Appl. Sci. 2023, 13, 7532. [Google Scholar] [CrossRef]
- Jin, Y.; Wong, K.W.; Yang, D.; Zhang, Z.; Wu, W.; Yin, J. A neural network model used in continuous grain dryer control system. Drying Technol. 2021, 40, 1901–1922. [Google Scholar] [CrossRef]
- Wu, W.; Jin, Y.; Zhang, Y.; Han, F.; Xu, Y.; Chen, L.; Qin, X.; Wu, Y.; Liu, E.; Wang, T.; et al. The Utility Model Relates to a Vertical Moisture Heat Controlled Speed Thin Layer Drying Test Bed. CN105486073B, 13 April 2016. [Google Scholar]
- GB/T 14489.1-2008; Oilseeds—Determination of Moisture and Volatile Matter Content. Standardization Administration of China: Beijing, China, 2008.
- GB/T 5496-1985; Inspection of Grain and Oilseeds--Methods for Determination of Yellow-Coloured Rice and Cracked Kernels. Standardization Administration of China: Beijing, China, 1985.
- GB/T 21719-2008; Determination of Head Rice Yield of Paddy. Standardization Administration of China: Beijing, China, 2008.
- NY/T 2638-2014; Determination of Resistant Starch in Rice and Its Products—Spectrophotometric Method. Standardization Administration of China: Beijing, China, 2014.
- GB/T 29405-2012; Inspection of Grain and Oils—Determination of Fat Acidity of Cereal and Cereal Products—Instrumental Analysis Method. Standardization Administration of China: Beijing, China, 2012.
- GB/T 24897-2010; Inspection of Grain and Oils—Crude Protein Determination in Rice—Near-Infrared Method. Standardization Administration of China: Beijing, China, 2010.
- Bertotto, M.M.; Gastón, A.; Sánchez Sarmiento, G.; Gove, B. Effect of drying conditions on the quality of IRGA 424 rice. J. Sci. Food Agric. 2018, 99, 1651–1659. [Google Scholar] [CrossRef] [PubMed]
- Wang, D.; Li, C.; Zhang, B.; Ma, J.; Jin, H. Development of germinating rate model and influencing parameters for paddy rice drying in a deep fixed-bed. TCS. Agricul. Engin. 2009, 25, 266–270. [Google Scholar]
- Danyang, W.; Jie, W.; Wenze, Y.; Zhipeng, W.; Benhua, Z.; Bo, X.; Hong, G. Research on drying characteristics of rice and construction of dynamic model. J. Shenyang Agric. Univ. 2021. [Google Scholar]
- Shen, L.; Gao, M.; Zhu, Y.; Liu, C.; Wang, L.; Kamruzzaman, M.; Liu, C.; Zheng, X. Microwave drying of germinated brown rice: Correlation of drying characteristics with the final quality. Innovative Food Sci. Emerg. Technol. 2021, 70, 102673. [Google Scholar] [CrossRef]
- Huang, W.; Song, E.; Lee, D.; Seo, S.; Lee, J.; Jeong, J.; Chang, Y.-H.; Lee, Y.-M.; Hwang, J. Characteristics of functional brown rice prepared by parboiling and microwave drying. J. Stored Prod. Res. 2021, 92, 101796. [Google Scholar] [CrossRef]
- Wang, D.; Wang, J.; Q IU, S.; zhan, T.; tao, D.; Zhang, B. Optimization and experiment of process parameters of rice drying with hot air. JTCS. Agricul. Mach. 2021, 37, 285–292. [Google Scholar]
- Dong, J.; Liu, J.; Tao, F.; Xu, X.; Wang, J. Spatio-temporal changes in annual accumulated temperature in China and the effects on cropping systems, 1980s to 2000. Clim. Res. 2009, 40, 37–48. [Google Scholar] [CrossRef]
- Mukhopadhyay, S.; Siebenmorgen, T.J.; Mauromoustakos, A. Effect of tempering approach following cross-flow drying on rice milling yields. Drying Technol. 2019, 37, 2137–2151. [Google Scholar] [CrossRef]
- Nanvakenari, S.; Movagharnejad, K.; Latifi, A. Multi-objective optimization of hybrid microwave-fluidized bed drying conditions of rice using response surface methodology. J. Stored Prod. Res. 2022, 97, 101956. [Google Scholar] [CrossRef]
- Liu, T.; Zhang, B.; Wang, L.; Zhao, S.; Qiao, D.; Zhang, L.; Xie, F. Microwave reheating increases the resistant starch content in cooked rice with high water contents. Int. J. Biol. Macromol. 2021, 184, 804–811. [Google Scholar] [CrossRef] [PubMed]
- You, H.; Liang, C.; Zhang, O.; Xu, H.; Xu, L.; Chen, Y.; Xiang, X. Variation of resistant starch content in different processing types and their starch granules properties in rice. Carbohydr. Polym. 2022, 276, 118742. [Google Scholar] [CrossRef] [PubMed]
- Meza, S.L.R.; Cañizares, L.; Dannenberg, B.; Peres, B.B.; Rodrigues, L.A.; Mardade, C.; de Leon, M.A.; Gaioso, C.A.; Egea, I.; de Oliveira, M. Sustainable rice bran protein: Composition, extraction, quality properties and applications. Trends Food Sci. Technol. 2024, 145, 104355. [Google Scholar] [CrossRef]
- Abd Rahim, F.N.; Ibadullah, W.Z.W.; Saari, N.; Brishti, F.H.; Mustapha, N.A.; Ahmad, N.; Arulrajah, B. The effect of alkaline extraction and drying techniques on the physicochemical, structural properties and functionality of rice bran protein concentrates. Int. J. Biol. Macromol. 2023, 242, 124908. [Google Scholar] [CrossRef] [PubMed]
- Singh, T.P.; Sogi, D.S. Comparative study of structural and functional characterization of bran protein concentrates from superfine, fine and coarse rice cultivars. Int. J. Biol. Macromol. 2018, 111, 281–288. [Google Scholar] [CrossRef] [PubMed]
- Donghao, Z.; Yeon-bae., C.; Laufi; Jihong, W. Research progress on the relationship between rice protein and rice taste quality. JFS 2023, 44, 270–277. [Google Scholar]
- Zhen, L. Correlation between physical and chemical properties of rice and eating quality. JGO 2017, 30, 89–92. [Google Scholar] [CrossRef]
- Qingyu, Z.; Hui, G.; Bolui, C.; Qun, S. Quality change and dynamics of rice during storage. JFS 2020, 41, 204–212. [Google Scholar]
- Yin, X.; Yang, M.; Li, G.; Zhang, X.; Zhou, Y.; Yang, L. Optimization of thin layer hot air drying process of rice and mathematical model fitting. JFS 2017, 38, 198–205. [Google Scholar]
Figure 1.
Multi-parameter thin-layer hot air drying system: 1. air shunt; 2. axial flow fan; 3. material bin door; 4. material tray; 5. sensor bin; 6. electric sealing valve; 7. heating pipe; 8. inner tank; 9. wet exhaust fans; 10. test-bed shell; 11. sensor group; and 12. humidifier.
Figure 1.
Multi-parameter thin-layer hot air drying system: 1. air shunt; 2. axial flow fan; 3. material bin door; 4. material tray; 5. sensor bin; 6. electric sealing valve; 7. heating pipe; 8. inner tank; 9. wet exhaust fans; 10. test-bed shell; 11. sensor group; and 12. humidifier.

Figure 2.
Contribution diagram of factor response indexes. Note: T represents drying temperature, RH represents hot air humidity, MC represents initial moisture content, V represents air speed, TR represents hysteresis ratio.
Figure 2.
Contribution diagram of factor response indexes. Note: T represents drying temperature, RH represents hot air humidity, MC represents initial moisture content, V represents air speed, TR represents hysteresis ratio.


Figure 11.
Dtn-ACP process reference chart.


Table 1.
Test instruments and manufacturers.
| Name of Instrument and Equipment | Manufacturing Enterprise |
|---|---|
| BC-2 Thin-layer Drying Test Bench | Changchun JIDA Scientific Instrument Equipment Co., Ltd., Changchun City, China. |
| AL204-IC Model 1/10,000 Balance | Mettler-Toledo (Changzhou) Instrument Co., Ltd., Changzhou, China. |
| BLH-3250 grain elevator | Zhejiang Bethlehem Instrument Equipment Co., Ltd., Taizhou City, China. |
| CM-5 Minolta Spectrophotometer | Konica Minolta Holdings, Inc., Tokyo, Japan. |
| DPCZ-II type amylose tester | Beijing Zhihai Electronic Instrument Co., Ltd., Beijing, China. |
| DGG-9250GD type electric heating constant temperature blower drying oven | Shanghai Senxin Laboratory Instrument Co., Ltd., Shanghai, China. |
| controlled tube grinder | IKA Works GmbH & Co., Staufen, Germany. |
| OS-200 Rail-Type Oscillator | Hangzhou Aosheng Instrument Co., Ltd., Hangzhou, China. |
| TG16K Centrifuge | Changsha Dongwang Experimental Instrument Co., Ltd., Changsha, China. |
| HS153 Moisture Analyzer | Mettler-Toledo (Changzhou) Instrument Co., Ltd., Changzhou, China. |
Table 2.
Response surface test factor level.
| Factor | Symbol | Encoded and Unencoded Values | ||||
|---|---|---|---|---|---|---|
| −α = 2.378 | −1 | 0 | 1 | α = 2.378 | ||
| dry medium temperature (°C) | T | 35 | 40.8 | 45 | 49.2 | 55 |
| relative medium humidity (%) | RH | 30 | 35.8 | 40 | 44.2 | 50 |
| initial water content (%) | MC | 20 | 22.3 | 24 | 25.7 | 28 |
| hot air speed (m/s) | V | 0.36 | 0.5 | 0.6 | 0.7 | 0.84 |
| slow sophomore | TR | 1 | 1.9 | 2.5 | 3.1 | 4 |
Note: The recovery ratio is the ratio of a single recovery time to the drying time.
Table 3.
Experimental data for various drying processes using central composite design (CCD).
| Runs | T (°C) | RH (%) | MC (%) | V (m/s) | TR | Dtn (min) | ACP (%) | HRY (%) | FAV (mg) | RSC (μg/g) | PG (%) | PCV (g/100 g) | FCV (g/100 g) |
|---|---|---|---|---|---|---|---|---|---|---|---|---|---|
| 1 | 40.8 | 35.8 | 22.3 | 0.5 | 1.9 | 154.17 | 5.00 | 71.00 | 25.81 | 172.86 | 93.69 | 0.77 | 0.57 |
| 2 | 49.2 | 35.8 | 22.3 | 0.5 | 1.9 | 113.95 | 4.64 | 70.88 | 26.03 | 163.37 | 94.38 | 0.73 | 0.32 |
| 3 | 40.8 | 44.2 | 22.3 | 0.5 | 1.9 | 204.10 | 5.92 | 69.00 | 23.72 | 161.88 | 92.75 | 0.87 | 0.42 |
| 4 | 49.2 | 44.2 | 22.3 | 0.5 | 1.9 | 176.18 | 4.53 | 70.00 | 23.92 | 162.69 | 93.31 | 0.80 | 0.56 |
| 5 | 40.8 | 35.8 | 25.7 | 0.5 | 1.9 | 201.64 | 4.35 | 70.13 | 27.38 | 212.39 | 94.13 | 0.83 | 1.05 |
| 6 | 49.2 | 35.8 | 25.7 | 0.5 | 1.9 | 139.25 | 3.50 | 70.13 | 26.35 | 212.56 | 95.00 | 0.88 | 0.70 |
| 7 | 40.8 | 44.2 | 25.7 | 0.5 | 1.9 | 261.51 | 5.30 | 70.00 | 25.34 | 163.78 | 92.75 | 0.85 | 0.57 |
| 8 | 49.2 | 44.2 | 25.7 | 0.5 | 1.9 | 207.32 | 3.61 | 71.00 | 25.18 | 177.64 | 93.13 | 0.92 | 0.47 |
| 9 | 40.8 | 35.8 | 22.3 | 0.7 | 1.9 | 131.56 | 4.13 | 71.88 | 26.26 | 199.89 | 91.19 | 1.17 | 0.75 |
| 10 | 49.2 | 35.8 | 22.3 | 0.7 | 1.9 | 98.21 | 4.86 | 71.00 | 27.20 | 165.74 | 90.88 | 1.07 | 0.40 |
| 11 | 40.8 | 44.2 | 22.3 | 0.7 | 1.9 | 169.36 | 4.24 | 70.00 | 25.20 | 182.82 | 92.94 | 1.23 | 0.64 |
| 12 | 49.2 | 44.2 | 22.3 | 0.7 | 1.9 | 150.66 | 4.01 | 70.00 | 26.36 | 188.34 | 92.00 | 1.13 | 0.64 |
| 13 | 40.8 | 35.8 | 25.7 | 0.7 | 1.9 | 195.37 | 5.08 | 70.00 | 24.66 | 178.44 | 93.00 | 0.98 | 0.87 |
| 14 | 49.2 | 35.8 | 25.7 | 0.7 | 1.9 | 128.74 | 4.63 | 70.00 | 24.69 | 153.74 | 92.06 | 0.91 | 0.45 |
| 15 | 40.8 | 44.2 | 25.7 | 0.7 | 1.9 | 249.30 | 4.72 | 69.88 | 22.30 | 160.98 | 95.06 | 1.08 | 0.43 |
| 16 | 49.2 | 44.2 | 25.7 | 0.7 | 1.9 | 182.38 | 4.30 | 71.13 | 21.19 | 163.80 | 92.81 | 0.91 | 0.35 |
| 17 | 40.8 | 35.8 | 22.3 | 0.5 | 3.1 | 141.73 | 4.11 | 71.00 | 22.31 | 169.24 | 90.88 | 0.99 | 0.13 |
| 18 | 49.2 | 35.8 | 22.3 | 0.5 | 3.1 | 93.57 | 4.86 | 70.00 | 22.06 | 158.77 | 92.13 | 1.02 | 0.28 |
| 19 | 40.8 | 44.2 | 22.3 | 0.5 | 3.1 | 178.29 | 4.61 | 70.00 | 20.19 | 161.17 | 90.31 | 0.96 | 0.33 |
| 20 | 49.2 | 44.2 | 22.3 | 0.5 | 3.1 | 124.18 | 4.50 | 70.00 | 21.02 | 171.62 | 89.69 | 0.99 | 0.70 |
| 21 | 40.8 | 35.8 | 25.7 | 0.5 | 3.1 | 187.62 | 4.19 | 69.75 | 21.44 | 223.59 | 94.13 | 1.09 | 0.41 |
| 22 | 49.2 | 35.8 | 25.7 | 0.5 | 3.1 | 122.63 | 3.73 | 69.13 | 22.05 | 220.01 | 94.94 | 1.16 | 0.37 |
| 23 | 40.8 | 44.2 | 25.7 | 0.5 | 3.1 | 224.72 | 4.52 | 70.13 | 21.81 | 175.54 | 92.75 | 1.03 | 0.13 |
| 24 | 49.2 | 44.2 | 25.7 | 0.5 | 3.1 | 160.29 | 3.98 | 71.00 | 22.81 | 189.06 | 92.94 | 1.12 | 0.45 |
| 25 | 40.8 | 35.8 | 22.3 | 0.7 | 3.1 | 121.54 | 4.06 | 70.88 | 25.71 | 208.26 | 90.88 | 1.12 | 0.16 |
| 26 | 49.2 | 35.8 | 22.3 | 0.7 | 3.1 | 77.00 | 5.26 | 70.13 | 25.00 | 173.99 | 91.25 | 1.05 | 0.16 |
| 27 | 40.8 | 44.2 | 22.3 | 0.7 | 3.1 | 139.52 | 3.99 | 70.00 | 23.16 | 214.31 | 91.88 | 1.10 | 0.36 |
| 28 | 49.2 | 44.2 | 22.3 | 0.7 | 3.1 | 105.28 | 4.16 | 70.00 | 23.71 | 213.52 | 90.94 | 0.98 | 0.83 |
| 29 | 40.8 | 35.8 | 25.7 | 0.7 | 3.1 | 167.81 | 4.85 | 70.13 | 22.51 | 213.12 | 94.75 | 1.11 | 0.19 |
| 30 | 49.2 | 35.8 | 25.7 | 0.7 | 3.1 | 104.19 | 5.62 | 68.88 | 22.96 | 165.30 | 95.13 | 1.13 | 0.11 |
| 31 | 40.8 | 44.2 | 25.7 | 0.7 | 3.1 | 186.78 | 4.55 | 71.00 | 21.17 | 170.90 | 95.69 | 1.08 | 0.04 |
| 32 | 49.2 | 44.2 | 25.7 | 0.7 | 3.1 | 133.07 | 5.04 | 71.00 | 20.57 | 165.50 | 95.38 | 1.06 | 0.26 |
| 33 | 35 | 40 | 24 | 0.6 | 2.5 | 228.91 | 5.38 | 71.00 | 22.14 | 156.58 | 91.56 | 1.04 | 0.72 |
| 34 | 55 | 40 | 24 | 0.6 | 2.5 | 104.65 | 5.30 | 71.00 | 21.55 | 146.56 | 90.50 | 1.03 | 0.73 |
| 35 | 45 | 30 | 24 | 0.6 | 2.5 | 110.23 | 5.17 | 70.00 | 24.17 | 169.58 | 92.88 | 1.06 | 0.65 |
| 36 | 45 | 50 | 24 | 0.6 | 2.5 | 223.53 | 5.08 | 69.88 | 22.16 | 153.98 | 92.25 | 1.03 | 0.70 |
| 37 | 45 | 40 | 20 | 0.6 | 2.5 | 92.57 | 5.29 | 71.00 | 23.61 | 158.06 | 90.00 | 0.88 | 0.13 |
| 38 | 45 | 40 | 28 | 0.6 | 2.5 | 184.06 | 5.39 | 69.88 | 22.92 | 178.35 | 96.13 | 0.90 | 0.08 |
| 39 | 45 | 40 | 24 | 0.36 | 2.5 | 173.97 | 2.85 | 70.88 | 22.64 | 192.14 | 95.00 | 1.10 | 0.60 |
| 40 | 45 | 40 | 24 | 0.84 | 2.5 | 129.75 | 3.33 | 71.00 | 23.59 | 196.05 | 95.00 | 1.28 | 0.50 |
| 41 | 45 | 40 | 24 | 0.6 | 1 | 202.09 | 3.03 | 70.00 | 26.46 | 208.66 | 92.94 | 0.90 | 0.51 |
| 42 | 45 | 40 | 24 | 0.6 | 4 | 122.12 | 3.15 | 70.00 | 22.05 | 230.36 | 93.13 | 1.05 | −0.17 |
| 43 | 45 | 40 | 24 | 0.6 | 2.5 | 150.10 | 4.87 | 69.50 | 25.22 | 188.33 | 95.00 | 1.22 | 0.27 |
| 44 | 45 | 40 | 24 | 0.6 | 2.5 | 145.30 | 5.06 | 69.50 | 24.39 | 191.52 | 94.25 | 1.19 | 0.10 |
| 45 | 45 | 40 | 24 | 0.6 | 2.5 | 145.90 | 5.06 | 70.00 | 25.43 | 191.94 | 93.50 | 1.15 | 0.23 |
| 46 | 45 | 40 | 24 | 0.6 | 2.5 | 147.10 | 4.81 | 70.00 | 25.94 | 205.98 | 93.75 | 1.08 | 0.48 |
| 47 | 45 | 40 | 24 | 0.6 | 2.5 | 154.60 | 4.94 | 69.50 | 26.00 | 206.62 | 94.25 | 1.14 | 0.29 |
| 48 | 45 | 40 | 24 | 0.6 | 2.5 | 140.20 | 5.19 | 69.50 | 26.03 | 212.79 | 93.75 | 1.15 | 0.16 |
| 49 | 45 | 40 | 24 | 0.6 | 2.5 | 149.70 | 4.87 | 69.50 | 25.22 | 188.33 | 95.00 | 1.22 | 0.27 |
| 50 | 45 | 40 | 24 | 0.6 | 2.5 | 143.60 | 5.06 | 69.50 | 24.39 | 191.52 | 94.25 | 1.19 | 0.10 |
| 51 | 45 | 40 | 24 | 0.6 | 2.5 | 139.40 | 5.06 | 70.00 | 25.43 | 191.94 | 93.50 | 1.15 | 0.23 |
| 52 | 45 | 40 | 24 | 0.6 | 2.5 | 150.10 | 4.81 | 70.00 | 26.42 | 205.98 | 93.75 | 1.08 | 0.48 |
| 53 | 45 | 40 | 24 | 0.6 | 2.5 | 145.30 | 4.94 | 69.50 | 25.94 | 206.62 | 94.25 | 1.14 | 0.29 |
| 54 | 45 | 40 | 24 | 0.6 | 2.5 | 145.90 | 5.19 | 69.50 | 26.00 | 212.79 | 93.75 | 1.15 | 0.16 |
| 55 | 45 | 40 | 24 | 0.6 | 2.5 | 147.10 | 5.06 | 69.50 | 24.39 | 191.52 | 94.25 | 1.19 | 0.10 |
| 56 | 45 | 40 | 24 | 0.6 | 2.5 | 154.60 | 5.06 | 70.00 | 25.43 | 191.94 | 93.50 | 1.15 | 0.23 |
| 57 | 45 | 40 | 24 | 0.6 | 2.5 | 140.20 | 4.81 | 70.00 | 26.42 | 205.98 | 93.75 | 1.08 | 0.48 |
| 58 | 45 | 40 | 24 | 0.6 | 2.5 | 149.70 | 4.94 | 69.50 | 26.51 | 206.62 | 94.25 | 1.14 | 0.29 |
| 59 | 45 | 40 | 24 | 0.6 | 2.5 | 143.60 | 4.91 | 69.50 | 26.98 | 212.79 | 93.75 | 1.15 | 0.16 |
Note: T represents drying temperature, RH represents hot air humidity, MC represents initial moisture content, V represents air speed, TR represents hysteresis ratio, Dtn represents net drying time, PG represents germination rate, ACP represents explosive waistline growth rate, HRY represents whole rice rate, FAV represents fatty acid value, RSC represents resistant starch concentration, PCV represents protein content change, FCV fat content change. The other comments on abbreviations in this article are the same and will not be explained later.
Table 4.
Quadratic polynomial regression model equation.
| Response | Polynomial Regression Model Equation | R2 | CV (%) |
|---|---|---|---|
| Dtn | 0.9896 | 3.2 | |
| PG | 0.9482 | 0.47 | |
| ACP | 0.9631 | 3.33 | |
| HRY | 0.8977 | 0.35 | |
| FAV | 0.8909 | 3.25 | |
| RSC | 0.9081 | 4.34 | |
| PCV | 0.8901 | 4.56 | |
| FCV | 0.9080 | 22.66 |
Note: The comments for the abbreviations are the same as those in Table 3.
Table 5.
Variance analysis results of the regression model.
| Indicators | Source of Variation | Sum of Squares | Degree of Freedom | Mean Square | F Value | p Value | |
|---|---|---|---|---|---|---|---|
| Dtn | Model | 87,902.35 | 20 | 4395.12 | 180.68 | <0.0001 | Significant |
| Residual error | 924.36 | 38 | 24.33 | ||||
| Loss of approximation term | 596.02 | 22 | 27.09 | 1.32 | 0.2877 | Not significant | |
| Error | 328.34 | 16 | 20.52 | ||||
| ACP | Model | 23.68 | 20 | 1.18 | 49.64 | <0.0001 | Significant |
| Residual error | 0.9065 | 38 | 0.0239 | ||||
| Loss of approximation term | 0.6593 | 22 | 0.03 | 1.94 | 0.089 | Not significant | |
| Error | 0.2472 | 16 | 0.0154 | ||||
| HRY | Model | 20.6 | 20 | 1.03 | 16.67 | <0.0001 | Significant |
| Residual error | 2.35 | 38 | 0.0618 | ||||
| Loss of approximation term | 1.38 | 22 | 0.0626 | 1.03 | 0.483 | Not significant | |
| Error | 0.9706 | 16 | 0.0607 | ||||
| FAV | Model | 192.41 | 20 | 9.62 | 15.51 | <0.0001 | Significant |
| Residual error | 23.57 | 38 | 0.6201 | ||||
| Loss of approximation term | 14.04 | 22 | 0.638 | 1.07 | 0.4518 | Not significant | |
| Error | 9.53 | 16 | 0.5956 | ||||
| RSC | Model | 24,650.42 | 20 | 1232.52 | 18.77 | <0.0001 | Significant |
| Residual error | 2495.09 | 38 | 65.66 | ||||
| Loss of approximation term | 1083.19 | 22 | 49.24 | 0.558 | 0.8987 | Not significant | |
| Error | 1411.9 | 16 | 88.24 | ||||
| PG | Model | 130.86 | 20 | 6.54 | 34.8 | <0.0001 | Significant |
| Residual error | 7.14 | 38 | 0.188 | ||||
| Loss of approximation term | 3.66 | 22 | 0.1663 | 0.7637 | 0.7259 | Not significant | |
| Error | 3.49 | 16 | 0.2178 | ||||
| PCV | Model | 0.7995 | 15 | 0.0533 | 23.23 | <0.0001 | Significant |
| Residual error | 0.0987 | 43 | 0.0023 | ||||
| Loss of approximation term | 0.0710 | 27 | 0.0026 | 1.52 | 0.1917 | Not significant | |
| Error | 0.0277 | 16 | 0.0017 | ||||
| FCV | Model | 3.12 | 17 | 0.1834 | 23.80 | <0.0001 | Significant |
| Residual error | 0.3159 | 41 | 0.0077 | ||||
| Loss of approximation term | 0.0580 | 25 | 0.0023 | 0.1440 | 1.0000 | Not significant | |
| Error | 0.2579 | 16 | 0.0161 |
Note: The comments for the abbreviations are the same as those in Table 3, the terms in the formula are non-coded (actual) values.
Table 6.
F value of each factor on each response index.
| Factor F-Score | Dtn | ACP | HRY | FAV | RSC | PG | PCV | FCV |
|---|---|---|---|---|---|---|---|---|
| A-T | 131.11 | 31.87 | 6.98 | 22.94 | 31.05 | 0.1502 | 4.10 | 13.25 |
| B-RH | 113.66 | 3.83 | 113.75 | 28.13 | 31.80 | 24.53 | 15.10 | 62.43 |
| C-MC | 154.66 | 8.08 | 25.35 | 6.09 | 0.8578 | 92.37 | 67.16 | 14.06 |
| D-V | 39.28 | 77.60 | 3.30 | 46.05 | 59.99 | 31.43 | 80.40 | 7.43 |
| E-TR | 83.81 | 13.38 | 24.45 | 115.15 | 17.60 | 65.02 | 5.89 | 4.11 |
Table 7.
Test results of optimized parameters.
| Trial Group | Dtn (min) | ACP (%) | HRY (%) | FAV (mg) | RSC (μg/g) | PG (%) | PCV (g/100 g) | FCV (g/100 g) |
|---|---|---|---|---|---|---|---|---|
| 1 | 165.82 | 3.46 | 68.90 | 21.05 | 193.51 | 97.30 | 7.73 | 2.24 |
| 2 | 159.92 | 3.51 | 69.26 | 20.22 | 196.51 | 93.79 | 8.01 | 2.68 |
| 3 | 158.53 | 3.63 | 69.96 | 19.96 | 200.33 | 95.18 | 8.89 | 2.49 |
| 4 | 161.67 | 3.46 | 72.39 | 21.02 | 189.53 | 93.86 | 8.96 | 2.42 |
| Average test value | 161.49 | 3.52 | 70.13 | 20.56 | 194.97 | 95.03 | 8.40 | 2.46 |
| Model predicted value | 157.60 | 3.48 | 70.45 | 20.93 | 193.64 | 94.15 | 8.53 | 2.37 |
| Model error | 2.47% | 1.18% | −0.46% | −1.78% | 0.69% | 0.93% | −1.54% | 3.71% |
Note: The contents of protein and fat in unpolished grains were 7.58 and 1.9 g/100 g, respectively. To verify the established regression model, four groups of parameter values were randomly generated within the range for verification experiments. The predicted values were obtained according to the regression equation, and the relative errors between the experimental values and the predicted values were calculated. As shown in Table 8, the relative average errors between the experimental values and the model values were all within 6% [25,26], indicating that the model can effectively predict various indicators.
Table 8.
Predicted and actual values of each response index.
| Indicators | Trial Group | T (°C) | RH (%) | MC (%) | V (m/s) | TR | Predicted Value | Actual Value | Error |
|---|---|---|---|---|---|---|---|---|---|
| Dtn (min) | 1 | 38.2 | 33.1 | 22.5 | 0.44 | 1.9 | 157.52 | 160.84 | 2.11% |
| 2 | 51 | 40.5 | 22.1 | 0.75 | 2.9 | 80.69 | 84.98 | 5.32% | |
| 3 | 42.4 | 49 | 22.8 | 0.73 | 3.6 | 149.3 | 144.18 | −3.43% | |
| 4 | 47.6 | 40.4 | 23.2 | 0.4 | 1.5 | 183.52 | 178.47 | −2.75% | |
| ACP (%) | 1 | 51.2 | 36.2 | 22.4 | 0.57 | 3.3 | 5.04 | 5.21 | 3.33% |
| 2 | 50.5 | 31.2 | 26.2 | 0.83 | 1.5 | 4.35 | 4.48 | 3.08% | |
| 3 | 40.9 | 46.3 | 20.2 | 0.46 | 2 | 6.88 | 6.52 | −5.16% | |
| 4 | 46.5 | 32.7 | 24.2 | 0.77 | 2.2 | 4.8 | 4.98 | 3.85% | |
| HRY (%) | 1 | 53 | 35.5 | 22.4 | 0.79 | 1.1 | 72.81 | 74.93 | 2.91% |
| 2 | 54.1 | 47.9 | 26.7 | 0.6 | 3.2 | 73.67 | 70.90 | −3.76% | |
| 3 | 47.7 | 47.5 | 21.9 | 0.5 | 1.9 | 69.23 | 65.90 | −4.81% | |
| 4 | 46.7 | 35.6 | 26.1 | 0.77 | 1.7 | 70.38 | 71.75 | 1.95% | |
| FAV (mg) | 1 | 40.1 | 38.9 | 24.3 | 0.75 | 1.8 | 24.21 | 23.73 | −1.97% |
| 2 | 42.8 | 33.6 | 22.7 | 0.4 | 3.2 | 19.38 | 18.56 | −4.21% | |
| 3 | 45.3 | 31.7 | 24.4 | 0.57 | 1.6 | 26.96 | 26.06 | −3.32% | |
| 4 | 41.5 | 41.1 | 20.7 | 0.66 | 1.7 | 26.21 | 27.19 | 3.73% | |
| RSC (μg/g) | 1 | 39.6 | 39.2 | 25.7 | 0.41 | 3.1 | 213.27 | 214.91 | 0.77% |
| 2 | 42.8 | 41.5 | 20 | 0.59 | 2.6 | 160.81 | 160.83 | 0.01% | |
| 3 | 52.2 | 34.5 | 22.7 | 0.42 | 1.1 | 148.51 | 153.04 | 3.05% | |
| 4 | 48.9 | 44.8 | 20.7 | 0.51 | 3.4 | 161.59 | 167.86 | 3.88% | |
| PG (%) | 1 | 35.7 | 44.1 | 20.8 | 0.38 | 2.5 | 90.24 | 87.45 | −3.09% |
| 2 | 54.9 | 36.3 | 27.8 | 0.82 | 1.4 | 96 | 101.20 | 5.42% | |
| 3 | 38.7 | 48.3 | 24.5 | 0.63 | 2.5 | 92.73 | 98.16 | 5.86% | |
| 4 | 45 | 38.7 | 20 | 0.66 | 2.6 | 94.09 | 95.80 | 1.82% | |
| PCV (g/100 g) | 1 | 50.2 | 32.9 | 21.1 | 0.61 | 2.5 | 87.7 | 92.96 | 6.00% |
| 2 | 54.2 | 32.7 | 21.6 | 0.46 | 1 | 23.61 | 23.57 | −0.17% | |
| 3 | 39.2 | 33.8 | 24.8 | 0.41 | 3.2 | 108.5 | 103.75 | −4.38% | |
| 4 | 42.5 | 32.6 | 25 | 0.54 | 2.5 | 102.42 | 107.42 | 4.88% | |
| FCV (g/100 g) | 1 | 39.2 | 47.8 | 24 | 0.43 | 2.5 | 65.84 | 65.01 | −1.26% |
| 2 | 36.5 | 35 | 25.8 | 0.58 | 1 | 214.31 | 206.25 | −3.76% | |
| 3 | 43 | 38.9 | 23.3 | 0.63 | 2.9 | 17.88 | 17.63 | −1.40% | |
| 4 | 36.7 | 41 | 21.4 | 0.71 | 2.4 | 61.39 | 64.19 | 4.56% |
Disclaimer/Publisher’s Note: The statements, opinions and data contained in all publications are solely those of the individual author(s) and contributor(s) and not of MDPI and/or the editor(s). MDPI and/or the editor(s) disclaim responsibility for any injury to people or property resulting from any ideas, methods, instructions or products referred to in the content. |
© 2024 by the authors. Licensee MDPI, Basel, Switzerland. This article is an open access article distributed under the terms and conditions of the Creative Commons Attribution (CC BY) license (https://creativecommons.org/licenses/by/4.0/).
Share and Cite
MDPI and ACS Style
Li, J.; Yi, X.; Jin, Y. Study of the Targeted Regulation of Rice Drying Characteristics and Quality. Appl. Sci. 2024, 14, 3587. https://0-doi-org.brum.beds.ac.uk/10.3390/app14093587
AMA Style
Li J, Yi X, Jin Y. Study of the Targeted Regulation of Rice Drying Characteristics and Quality. Applied Sciences. 2024; 14(9):3587. https://0-doi-org.brum.beds.ac.uk/10.3390/app14093587
Chicago/Turabian StyleLi, Jinquan, Xiaokang Yi, and Yi Jin. 2024. "Study of the Targeted Regulation of Rice Drying Characteristics and Quality" Applied Sciences 14, no. 9: 3587. https://0-doi-org.brum.beds.ac.uk/10.3390/app14093587
Note that from the first issue of 2016, this journal uses article numbers instead of page numbers. See further details here.