
Lactiplantibacillus plantarum ST-III and Lacticaseibacillus rhamnosus KF7 Enhance the Intestinal Epithelial Barrier in a Dual-Environment In Vitro Co-Culture Model

 , , and
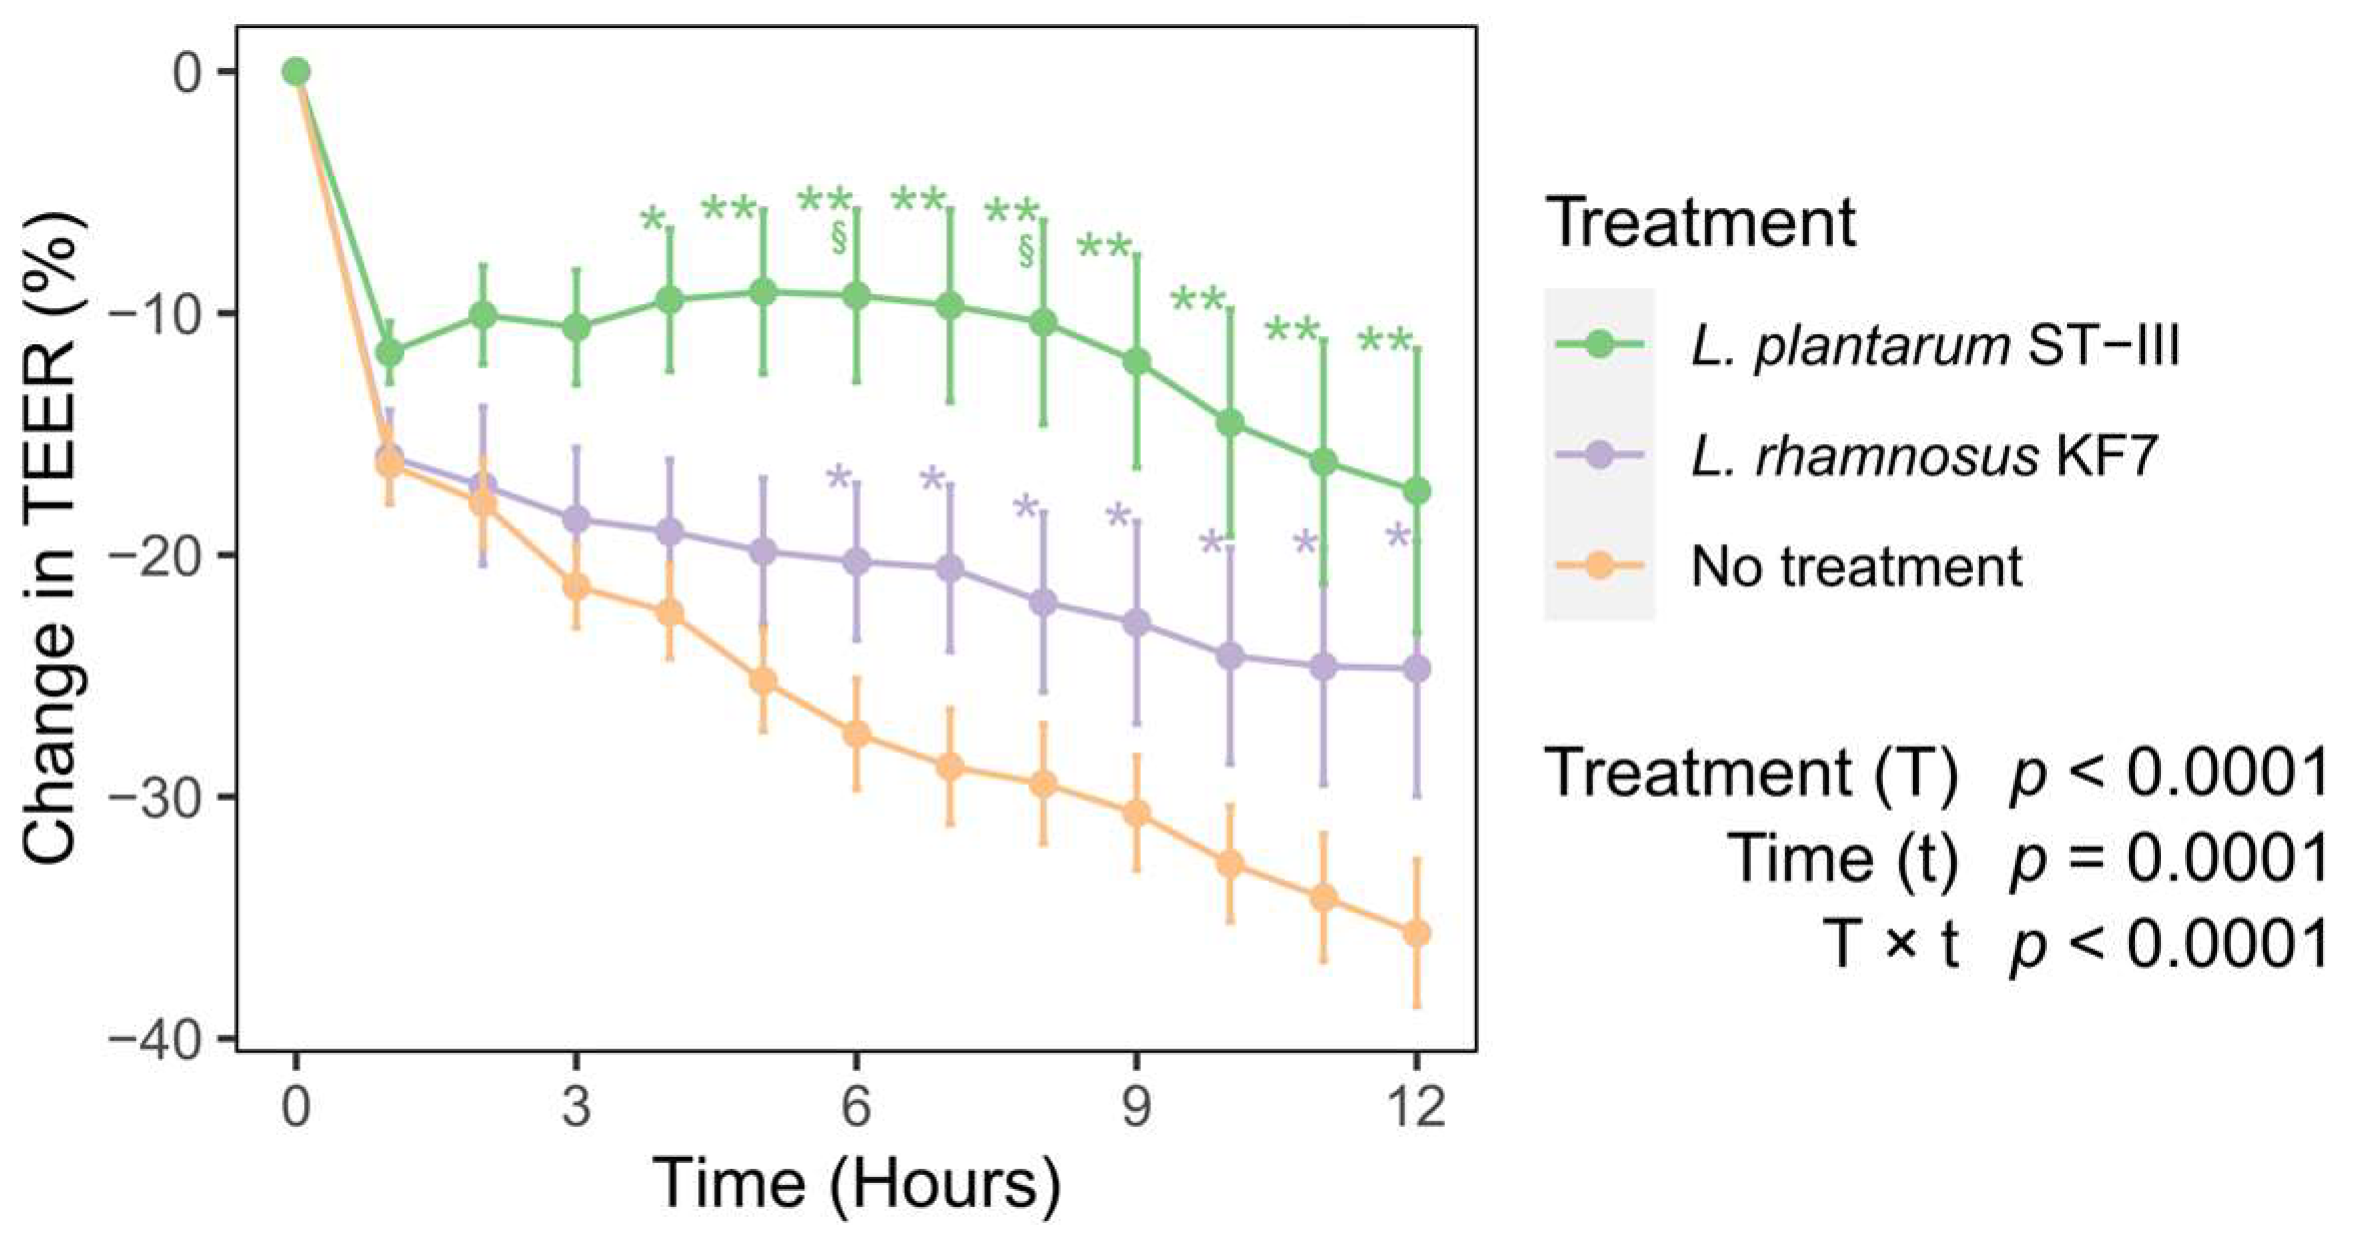
Abstract
:1. Introduction
2. Methods
2.1. Mammalian Cell Culture
2.2. Bacterial Strains and Growth Conditions
2.3. Dual-Environment Co-Culture System
2.4. Co-Culture of Mammalian and Bacterial Cells under Apical–Anaerobic Conditions
2.5. Transepithelial Electrical Resistance Assay
2.6. Analysis of Tight Junction Protein Localisation
2.7. Semi-Quantification of Tight Junction Proteins
2.8. Gene Expression Analysis
2.9. Statistical Analysis
3. Results
3.1. Epithelial Barrier Function Was Maintained in the Apical–Anaerobic Model
3.2. Probiotics Improved Transepithelial Electrical Resistance
3.3. Co-Localisation of Occludin and Zona Occludens-1 Was Not Affected by Probiotic Treatment
3.4. Probiotics Modulated Occludin and Zona Occludens-1 Protein Abundance
3.5. Effect of Probiotics on Tight Junction Gene Expression Was Both Strain- and Time-Dependent
4. Discussion
Supplementary Materials
Author Contributions
Funding
Data Availability Statement
Acknowledgments
Conflicts of Interest
References
- Chelakkot, C.; Ghim, J.; Ryu, S.H. Mechanisms regulating intestinal barrier integrity and its pathological implications. Exp. Mol. Med. 2018, 50, 1–9. [Google Scholar] [CrossRef] [PubMed]
- Lee, B.; Moon, K.M.; Kim, C.Y. Tight Junction in the Intestinal Epithelium: Its Association with Diseases and Regulation by Phytochemicals. J. Immunol. Res. 2018, 2018, 2645465. [Google Scholar] [CrossRef] [PubMed]
- Michielan, A.; D‘Incà, R. Intestinal Permeability in Inflammatory Bowel Disease: Pathogenesis, Clinical Evaluation, and Therapy of Leaky Gut. Mediators Inflamm. 2015, 2015, 628157. [Google Scholar] [CrossRef] [PubMed]
- Zhou, Q.; Zhang, B.; Verne, G.N. Intestinal membrane permeability and hypersensitivity in the irritable bowel syndrome. Pain 2009, 146, 41–46. [Google Scholar] [CrossRef] [PubMed]
- Jauregi-Miguel, A. Chapter Four—The tight junction and the epithelial barrier in coeliac disease. Int. Rev. Cell Mol. Biol. 2021, 358, 105–132. [Google Scholar] [PubMed]
- Paray, B.A.; Albeshr, M.F.; Jan, A.T.; Rather, I.A. Leaky Gut and Autoimmunity: An Intricate Balance in Individuals Health and the Diseased State. Int. J. Mol. Sci. 2020, 21, 9770. [Google Scholar] [CrossRef]
- Rose, E.C.; Odle, J.; Blikslager, A.T.; Ziegler, A.L. Probiotics, Prebiotics and Epithelial Tight Junctions: A Promising Approach to Modulate Intestinal Barrier Function. Int. J. Mol. Sci. 2021, 22, 6729. [Google Scholar] [CrossRef]
- Anderson, R.C.; Cookson, A.L.; McNabb, W.C.; Kelly, W.J.; Roy, N.C. Lactobacillus plantarum DSM 2648 is a potential probiotic that enhances intestinal barrier function. FEMS Microbiol. Lett. 2010, 309, 184–192. [Google Scholar] [CrossRef]
- Blackwood, B.P.; Yuan, C.Y.; Wood, D.R.; Nicolas, J.D.; Grothaus, J.S.; Hunter, C.J. Probiotic Lactobacillus Species Strengthen Intestinal Barrier Function and Tight Junction Integrity in Experimental Necrotizing Enterocolitis. J. Probiotics Health 2017, 5, 5. [Google Scholar] [CrossRef] [PubMed]
- Anderson, R.C.; Cookson, A.L.; McNabb, W.C.; Park, Z.; McCann, M.J.; Kelly, W.J.; Roy, N.C. Lactobacillus plantarum MB452 enhances the function of the intestinal barrier by increasing the expression levels of genes involved in tight junction formation. BMC Microbiol. 2010, 10, 316. [Google Scholar] [CrossRef]
- Qin, H.L.; Shen, T.Y.; Gao, Z.G.; Fan, X.B.; Hang, X.M.; Jiang, Y.Q.; Zhang, H.Z. Effect of lactobacillus on the gut microflora and barrier function of the rats with abdominal infection. World J. Gastroenterol. 2005, 11, 2591–2596. [Google Scholar] [CrossRef] [PubMed]
- Karczewski, J.; Troost, F.J.; Konings, I.; Dekker, J.; Kleerebezem, M.; Brummer, R.J.; Wells, J.M. Regulation of human epithelial tight junction proteins by Lactobacillus plantarum in vivo and protective effects on the epithelial barrier. Am. J. Physiol. Gastrointest. Liver Physiol. 2010, 298, G851–G859. [Google Scholar] [CrossRef] [PubMed]
- Seth, A.; Yan, F.; Polk, D.B.; Rao, R.K. Probiotics ameliorate the hydrogen peroxide-induced epithelial barrier disruption by a PKC- and MAP kinase-dependent mechanism. Am. J. Physiol. Gastrointest. Liver Physiol. 2008, 294, G1060–G1069. [Google Scholar] [CrossRef] [PubMed]
- Wang, Y.; Chen, C.; Ai, L.; Zhou, F.; Zhou, Z.; Wang, L.; Zhang, H.; Chen, W.; Guo, B. Complete genome sequence of the probiotic Lactobacillus plantarum ST-III. J. Bacteriol. 2011, 193, 313–314. [Google Scholar] [CrossRef] [PubMed]
- Meng, C.; Meng, Z.-j.; Guo, B.-h.; Han, J. Optimization of the cultural conditions for Lactobacillus rhamnosus KF7 to biosynthesize mono-amine oxidase inhibitors by response surface methodology. Food Ferment. Ind. 2013, 39, 107–112. [Google Scholar] [CrossRef]
- Liu, J.; Gu, Z.; Zhang, H.; Zhao, J.; Chen, W. Preventive effects of Lactobacillus plantarum ST-III against Salmonella infection. LWT 2019, 105, 200–205. [Google Scholar] [CrossRef]
- Zotta, T.; Parente, E.; Ricciardi, A. Aerobic metabolism in the genus Lactobacillus: Impact on stress response and potential applications in the food industry. J. Appl. Microbiol. 2017, 122, 857–869. [Google Scholar] [CrossRef] [PubMed]
- Eikmeyer, F.G.; Heinl, S.; Marx, H.; Puhler, A.; Grabherr, R.; Schluter, A. Identification of Oxygen-Responsive Transcripts in the Silage Inoculant Lactobacillus buchneri CD034 by RNA Sequencing. PLoS ONE 2015, 10, e0134149. [Google Scholar] [CrossRef] [PubMed]
- Siciliano, R.A.; Pannella, G.; Lippolis, R.; Ricciardi, A.; Mazzeo, M.F.; Zotta, T. Impact of aerobic and respirative life-style on Lactobacillus casei N87 proteome. Int. J. Food Microbiol. 2019, 298, 51–62. [Google Scholar] [CrossRef] [PubMed]
- Ulluwishewa, D.; Anderson, R.C.; Young, W.; McNabb, W.C.; van Baarlen, P.; Moughan, P.J.; Wells, J.M.; Roy, N.C. Live Faecalibacterium prausnitzii in an apical anaerobic model of the intestinal epithelial barrier. Cell. Microbiol. 2015, 17, 226–240. [Google Scholar] [CrossRef] [PubMed]
- Pinto, M.; Robine, S.; Appay, M.D. Enterocyte-like differentiation and polarization of the human colon carcinoma cell line CACO-2 in culture. Biol. Cell 1983, 47, 323–330. [Google Scholar]
- Hidalgo, I.J.; Raub, T.J.; Borchardt, R.T. Characterization of the human colon carcinoma cell line (Caco-2) as a model system for intestinal epithelial permeability. Gastroenterology 1989, 96, 736–749. [Google Scholar] [CrossRef] [PubMed]
- Ulluwishewa, D.; Anderson, R.C.; McNabb, W.C.; Moughan, P.J.; Wells, J.M.; Roy, N.C. Regulation of tight junction permeability by intestinal bacteria and dietary components. J. Nutr. 2011, 141, 769–776. [Google Scholar] [CrossRef] [PubMed]
- Maier, E.; Anderson, R.C.; Altermann, E.; Roy, N.C. Live Faecalibacterium prausnitzii induces greater TLR2 and TLR2/6 activation than the dead bacterium in an apical anaerobic co-culture system. Cell. Microbiol. 2018, 20, e12805. [Google Scholar] [CrossRef] [PubMed]
- Schindelin, J.; Arganda-Carreras, I.; Frise, E.; Kaynig, V.; Longair, M.; Pietzsch, T.; Preibisch, S.; Rueden, C.; Saalfeld, S.; Schmid, B.; et al. Fiji: An open-source platform for biological-image analysis. Nat. Methods 2012, 9, 676–682. [Google Scholar] [CrossRef] [PubMed]
- Geiss, G.K.; Bumgarner, R.E.; Birditt, B.; Dahl, T.; Dowidar, N.; Dunaway, D.L.; Fell, H.P.; Ferree, S.; George, R.D.; Grogan, T.; et al. Direct multiplexed measurement of gene expression with color-coded probe pairs. Nat. Biotechnol. 2008, 26, 317–325. [Google Scholar] [CrossRef] [PubMed]
- Pinheiro, J.; Bates, D.; DebRoy, S.; Sarkar, D. R Core Team nlme: Linear and Nonlinear Mixed Effects Models_. R Package Version 3.1-164. Available online: https://CRAN.R-project.org/package=nlme (accessed on 22 December 2023).
- R Core Team. R: A Language and Environment for Statistical Computing; R Core Team: Vienna, Austria, 2023. [Google Scholar]
- Lenth, R.V. Emmeans: Estimated Marginal Means, aka Least-Squares Means. R Package Version 1.10.0. Available online: https://CRAN.R-project.org/package=emmeans (accessed on 22 December 2023).
- Rohart, F.; Gautier, B.; Singh, A.; Le Cao, K.A. mixOmics: An R package for ‘omics feature selection and multiple data integration. PLoS Comput. Biol. 2017, 13, e1005752. [Google Scholar] [CrossRef] [PubMed]
- Wheeler, B.; Torchiano, M. lmPerm: Permutation Tests for Linear Models_. R Package Version 2.1.0. Available online: https://CRAN.R-project.org/package=lmPerm (accessed on 22 December 2023).
- Luo, D.; Ganesh, S.; Koolaard, J. predictmeans: Predicted Means for Linear and Semi Parametric Models_. R Package Version 1.0.9. Available online: https://CRAN.R-project.org/package=predictmeans (accessed on 22 December 2023).
- Kanehisa, M.; Goto, S. KEGG: Kyoto encyclopedia of genes and genomes. Nucleic Acids Res. 2000, 28, 27–30. [Google Scholar] [CrossRef] [PubMed]
- Kanehisa, M.; Sato, Y.; Kawashima, M. KEGG mapping tools for uncovering hidden features in biological data. Protein Sci. 2022, 31, 47–53. [Google Scholar] [CrossRef] [PubMed]
- Lian, P.; Braber, S.; Varasteh, S.; Wichers, H.J.; Folkerts, G. Hypoxia and heat stress affect epithelial integrity in a Caco-2/HT-29 co-culture. Sci. Rep. 2021, 11, 13186. [Google Scholar] [CrossRef] [PubMed]
- Kuo, W.T.; Odenwald, M.A.; Turner, J.R.; Zuo, L. Tight junction proteins occludin and ZO-1 as regulators of epithelial proliferation and survival. Ann. N. Y. Acad. Sci. 2022, 1514, 21–33. [Google Scholar] [CrossRef] [PubMed]
- Anderson, R.C.; MacGibbon, A.K.H.; Haggarty, N.; Armstrong, K.M.; Roy, N.C. Bovine dairy complex lipids improve in vitro measures of small intestinal epithelial barrier integrity. PLoS ONE 2018, 13, e0190839. [Google Scholar] [CrossRef] [PubMed]
- Shi, Y.; Li, R.; Yang, J.; Li, X. No tight junctions in tight junction protein-1 expressing HeLa and fibroblast cells. Int. J. Physiol. Pathophysiol. Pharmacol. 2020, 12, 70–78. [Google Scholar] [PubMed]
- Balda, M.S.; Whitney, J.A.; Flores, C.; Gonzalez, S.; Cereijido, M.; Matter, K. Functional dissociation of paracellular permeability and transepithelial electrical resistance and disruption of the apical-basolateral intramembrane diffusion barrier by expression of a mutant tight junction membrane protein. J. Cell Biol. 1996, 134, 1031–1049. [Google Scholar] [CrossRef]
- Furuse, M.; Hirase, T.; Itoh, M.; Nagafuchi, A.; Yonemura, S.; Tsukita, S.; Tsukita, S. Occludin: A novel integral membrane protein localizing at tight junctions. J. Cell Biol. 1993, 123, 1777–1788. [Google Scholar] [CrossRef] [PubMed]
- Ikenouchi, J.; Furuse, M.; Furuse, K.; Sasaki, H.; Tsukita, S.; Tsukita, S. Tricellulin constitutes a novel barrier at tricellular contacts of epithelial cells. J. Cell Biol. 2005, 171, 939–945. [Google Scholar] [CrossRef] [PubMed]
- Morita, K.; Furuse, M.; Fujimoto, K.; Tsukita, S. Claudin multigene family encoding four-transmembrane domain protein components of tight junction strands. Proc. Natl. Acad. Sci. USA 1999, 96, 511–516. [Google Scholar] [CrossRef] [PubMed]
- Aijaz, S.; D‘Atri, F.; Citi, S.; Balda, M.S.; Matter, K. Binding of GEF-H1 to the tight junction-associated adaptor cingulin results in inhibition of Rho signaling and G1/S phase transition. Dev. Cell 2005, 8, 777–786. [Google Scholar] [CrossRef] [PubMed]
- Walsh, S.V.; Hopkins, A.M.; Chen, J.; Narumiya, S.; Parkos, C.A.; Nusrat, A. Rho kinase regulates tight junction function and is necessary for tight junction assembly in polarized intestinal epithelia. Gastroenterology 2001, 121, 566–579. [Google Scholar] [CrossRef] [PubMed]
- Gonzalez-Mariscal, L.; Tapia, R.; Chamorro, D. Crosstalk of tight junction components with signaling pathways. Biochim. Biophys. Acta 2008, 1778, 729–756. [Google Scholar] [CrossRef] [PubMed]
- Chen, X.; Macara, I.G. Par-3 controls tight junction assembly through the Rac exchange factor Tiam1. Nat. Cell Biol. 2005, 7, 262–269. [Google Scholar] [CrossRef] [PubMed]
- Lemmers, C.; Michel, D.; Lane-Guermonprez, L.; Delgrossi, M.-H.; Médina, E.; Arsanto, J.-P.; Le Bivic, A. CRB3 Binds Directly to Par6 and Regulates the Morphogenesis of the Tight Junctions in Mammalian Epithelial Cells. Mol. Biol. Cell 2004, 15, 1324–1333. [Google Scholar] [CrossRef] [PubMed]
- Krock, B.L.; Perkins, B.D. The Par-PrkC polarity complex is required for cilia growth in zebrafish photoreceptors. PLoS ONE 2014, 9, e104661. [Google Scholar] [CrossRef] [PubMed]
- Shen, L.; Turner, J.R. Role of Epithelial Cells in Initiation and Propagation of Intestinal Inflammation. Eliminating the static: Tight junction dynamics exposed. Am. J. Physiol. Gastrointest. Liver Physiol. 2006, 290, G577–G582. [Google Scholar] [CrossRef] [PubMed]
- Liu, Y.; Nusrat, A.; Schnell, F.J.; Reaves, T.A.; Walsh, S.; Pochet, M.; Parkos, C.A. Human junction adhesion molecule regulates tight junction resealing in epithelia. J. Cell Sci. 2000, 113, 2363–2374. [Google Scholar] [CrossRef] [PubMed]
- Otani, T.; Nguyen, T.P.; Tokuda, S.; Sugihara, K.; Sugawara, T.; Furuse, K.; Miura, T.; Ebnet, K.; Furuse, M. Claudins and JAM-A coordinately regulate tight junction formation and epithelial polarity. J. Cell Biol. 2019, 218, 3372–3396. [Google Scholar] [CrossRef] [PubMed]


Disclaimer/Publisher’s Note: The statements, opinions and data contained in all publications are solely those of the individual author(s) and contributor(s) and not of MDPI and/or the editor(s). MDPI and/or the editor(s) disclaim responsibility for any injury to people or property resulting from any ideas, methods, instructions or products referred to in the content. |
© 2024 by the authors. Licensee MDPI, Basel, Switzerland. This article is an open access article distributed under the terms and conditions of the Creative Commons Attribution (CC BY) license (https://creativecommons.org/licenses/by/4.0/).
Share and Cite
Zhang, Y.; Anderson, R.C.; You, C.; Purba, A.; Yan, M.; Maclean, P.; Liu, Z.; Ulluwishewa, D. Lactiplantibacillus plantarum ST-III and Lacticaseibacillus rhamnosus KF7 Enhance the Intestinal Epithelial Barrier in a Dual-Environment In Vitro Co-Culture Model. Microorganisms 2024, 12, 873. https://0-doi-org.brum.beds.ac.uk/10.3390/microorganisms12050873
Zhang Y, Anderson RC, You C, Purba A, Yan M, Maclean P, Liu Z, Ulluwishewa D. Lactiplantibacillus plantarum ST-III and Lacticaseibacillus rhamnosus KF7 Enhance the Intestinal Epithelial Barrier in a Dual-Environment In Vitro Co-Culture Model. Microorganisms. 2024; 12(5):873. https://0-doi-org.brum.beds.ac.uk/10.3390/microorganisms12050873
Chicago/Turabian StyleZhang, Yilin, Rachel C. Anderson, Chunping You, Ajitpal Purba, Minghui Yan, Paul Maclean, Zhenmin Liu, and Dulantha Ulluwishewa. 2024. "Lactiplantibacillus plantarum ST-III and Lacticaseibacillus rhamnosus KF7 Enhance the Intestinal Epithelial Barrier in a Dual-Environment In Vitro Co-Culture Model" Microorganisms 12, no. 5: 873. https://0-doi-org.brum.beds.ac.uk/10.3390/microorganisms12050873