Article

A Study on the Regional Evolution of the Hefei Political and Cultural New District Skyline Based on Exploratory Factor Analysis and Semantic Segmentation

1
Anhui Cultural Tourism Innovative Development Research Institute, Anhui Jianzhu University, Hefei 230601, China
2
School of Arts, Anhui Jianzhu University, Hefei 230601, China
3
Social Innovation Design Research Centre, Anhui University, Hefei 203106, China
4
Anhui Institute of Contemporary Studies, Anhui Academy of Social Sciences, Hefei 203106, China
*
Author to whom correspondence should be addressed.
Submission received: 9 March 2024 / Revised: 21 April 2024 / Accepted: 24 April 2024 / Published: 26 April 2024
(This article belongs to the Special Issue Urban Wellbeing: The Impact of Spatial Parameters)

Abstract

:
The general population’s assessment and perception of a city can be influenced by its skyline, which is one of its representatives. This paper uses semantic segmentation and exploratory factor analysis to conduct a study from two different perspectives, aiming to analyse the development and current situation of the skyline of Hefei’s political and cultural new district. By collecting pictures of the skyline of the New Administrative and Cultural District, the New Administrative and Cultural District of Hefei’s skyline is being studied for overall changes using the semantic segmentation method, and to evaluate the quality of the skyline in various years, the entropy weight–TOPSIS is employed. Through the literature investigation and creation status of the new political and cultural district, the index system is scientifically formulated to conduct a questionnaire survey, and its reliability and validity are tested. This study is conducted with exploratory factor analysis of factors that are vital in the city skyline. The results of this study show that (1) after the semantic segmentation of the pictures, it is found that the proportion of buildings and the proportion of vegetation are both rising; the proportion of buildings tends to level off after 2018, and the proportion of vegetation shows a uniform increase. In the relative proximity ranking, the overall trend is increasing, and the skyline is ranked first in 2024. (2) Two variables were identified based on the findings of the exploratory factor analysis: ‘skyline value’ and ‘neighbourhood ecological quality’. The results of this study show that the skyline of Hefei’s New Administrative and Cultural District in 2024 is the best overall, and that the skyline of the New Administrative and Cultural District has developed into one of the city images of Hefei, and that its optimisation can be considered in terms of the “quality of the surrounding ecological environment”.

1. Introduction

The rapid development of urbanisation [1] has also brought innovations in architectural technology, and the count of urban high-rise buildings has been on the rise [2], creating a distinctive landscape of urban silhouettes. Some of the most significant structures on the skyline are tall ones [3,4]. Although the elevation of high-rise buildings varies depending on the surroundings, it is typically between 20 and 30 m in various nations [5]. The fact that many high-rise structures are more recent constructions than other types of buildings gives them some degree of influence over the skyline and adds to their significance. In any event, it is crucial to remember that high-rise structures can significantly alter the urban skyline [6,7].
Cities are the most densely populated places for human life. The United Nations World Urbanization Development Report projects that by 2050, 68% of people on Earth will reside in cities [8]. A city’s culture, spirit, and development concepts are carried by its city image [9]. People form impressions of a city’s personality and characteristics based on its decisions, behaviours, and visual symbols [10]. The city skyline has emerged as one of the key ideas in urban planning in recent years. Cities now compete against each other not just on the basis of economics but also on other factors, such as image. In addition to being material, a positive city image also possesses spiritual and cultural soft power [11]. As a result, a lot of the world’s developed cities place a high value on enhancing their reputation and developing and utilising their intangible assets.
Skylines are essential to beauty, meaning, and city landscape [12,13], and skylines are also used as man-made skylines of the overall urban fabric. The “urban skyline” describes the features of buildings that comprise the landscape during the day and the shadows that form it at night [14]. Theoretical research on the skyline was first conducted in developed nations such as the United States and Europe, where advancements in industry and technology were made possible, placing developed countries in Europe and the United States on the city scale; high-rise building development is at the leading level [15], and therefore it is also the earliest attention given to and research on the form and development characteristics of the city skyline [16]. At the end of the nineteenth century, architectural critic Montgomery Schaller presented the formation of the cityscape of the skyscrapers in Chicago known as the “skyline”, which triggered scholars to carry out a series of studies on the city skyline, which highly summarised the characteristics of the overall image of the city [17]. In 1960, Kevin Lynch’s book Urban Imagery depicted a lot of content about the skyline and urban form, and his theory can be regarded as the basis of the theory of the city skyline [18].
The current construction of new cities seeks speed and quantity and does not invest enough in shaping the spatial hierarchy, resulting in a new city skyline with a single hierarchy, lacking rhythm and cultural connotation, and disconnected from the old city and the natural environment. A city’s unique skyline can serve as a representative image of the city, and in the above context, the study of the city skyline has strong practical significance [19]. Puspitasari A W et al. obtained that linear clusters have higher visibility by comparing different layouts of circular, rectangular, and linear geographic area organisations in high-rise complexes [20]. Mehrdad Karimimoshaver et al. used respondents’ judgments of colour images of the skyline on the three types of natural, traditional, and modern skylines and obtained that people preferred natural and traditional skylines [19]. Caner Guney et al. considered Istanbul’s skyline as a unique asset, and to maintain the original architectural composition of the skyline and to study the aesthetics of the city’s skyline and its change as a result of tall structures, a study was conducted by using a GIS system for transformations that occur; this is achieved by customising the geographic model in a GIS environment [13]. However, scholars have paid less attention to the city skyline and studied it less, and little research has been conducted on how a city’s skyline evolves and develops, through which the development of the skyline can be used to visualise a city’s change and growth process.
Semantic segmentation, another term for the act of putting regions of an image that belong to the same object class together, can be used to analyse and process the city skyline as 2D image information [21]. The other two primary picture tasks are detection and image level categorisation [22,23]. Applications for semantic image segmentation include land use and land cover categorisation, colon crypt segmentation, and road sign detection [24,25,26]. Gonghu H et al. extracted the proportion of streetscape elements from GSVP images by semantic segmentation and performed correlation and regression analyses between the VIWP rated values and the streetscape elements; Masatomo Suzuki et al. looked into the connection between property values and the cityscape in residential low-rise buildings’ neighbourhoods in suburban Tokyo, Japan, using Google Street View photo semantic segmentation [27]. Laura Martinez-sanchez et al. trained and analysed skyline images by the semantic segmentation method and concluded that changes in the landscape’s skyline photographs are applicable for estimating the distance to trees that are far off from trees on the horizon [28]. The above study shows that the semantic segmentation method is used to process the city skyline as image data for research, while this method can avoid the influence of subjective elements to some extent.
Waqar A et al. used exploratory factor analysis to assess the barriers to the implementation of DTT in the development of Malaysia’s smart cities and concluded that personalisation barriers are very important [29]. Sapsağlam Ö and Eryilmaz A, in order to encourage the growth of “child-friendly cities”, employed a factor analysis of exploration to construct the Child-Friendly Cities Scale-Children’s Form to exclude the influence of some unnecessary factors [30]. The most direct way to find out whether a city’s architecture is a landmark is through the evaluation of the public, but no scholars have used exploratory factor analysis to evaluate the city skyline yet, which can be used to understand the importance of evaluation factors in order of importance and the importance of sub-indicators [31].
Hefei City designed and built the New Administrative and Cultural District, a comprehensive new district with impressive building outcomes over the last 10 years. The new city’s construction is primarily focused on speed. A significant influence of the growing number of buildings and high-rise structures has been felt on the original urban spatial form, particularly on the original urban landmarks [32]. This study’s goal is to focus on the current situation in Hefei, taking the skyline of Hefei City’s political and cultural new district as the object of study, and to approach it from two angles: 1. To analyse the evolution process of the city skyline by using the semantic segmentation method; 2. to find out the status quo of the city skyline in the political and cultural new district and the existing problems by using the exploratory factor analysis method. In this way, it gives an objective analysis and evaluation and puts forward corresponding suggestions and targeted measures to promote the development of the area.

2. Research Domain and Methods

2.1. Research Domain

Hefei Culture and Government Affairs, Hefei City’s New District, lies to the southwest and is connected to the south by the zone for technological and economic development, the Jinzhai Road elevated in the east, the west’s High-Tech Development Zone, and to the north, the Old City (Figure 1). The planning area of the new district is 12.67 square kilometres, with an existing resident urban population of 125,000 people, and according to the requirements of “world vision, domestic first-class, Hefei characteristics”, is a significant component of the city’s primary metropolitan area of Hefei’s “141” urban spatial development strategy but also a set of administrative offices, cultural, educational and sports, financial, and commercial facilities. It is also a new city district integrating administrative offices, culture, education and sports, finance, commerce and trade, tourism and holiday, residence, and leisure functions, with unique ecological characteristics of human habitation and has been developed into a new political and economic centre and commercial and cultural centre of Hefei, the provincial capital. In recent years, the New Administrative and Cultural District has been awarded the “Anhui Province Habitat Environment Example Award” and “China Habitat Environment Example Award”, etc. The Hefei Administrative Centre, Hefei Sports Centre, Hefei Grand Theatre, and other key projects in the district have been successively awarded as “Garden Style Units” and “Garden Style Units”. The Hefei Government Affairs Centre, Hefei Sports Centre, Hefei Grand Theatre, and other key projects in the area have successively been awarded as “garden-style units”, and the regional greening project is expected to be awarded as “Anhui Province Greening Model County (City, District)”.
Hefei is the capital of Anhui Province (located between latitude 30°57′ and 32°32′ N and longitude 116°41′ and 117°58′ E), and the city now covers an area of 11,429.68 km2, constituting 8.2% of the province’s total land area. Set in the central region of the province of Anhui, Hefei is a historic city with a more than 2000-year history. It consists of one county-level city, four municipal districts, and four counties [33]. Huainan borders it to the north, Wuhu and Ma’anshan to the south, Lu’an to the west, and Chuzhou to the east. Hefei’s topography is open and varied, with an overall landscape of hilly plains; its humid subtropical monsoon climate and ability to facilitate east–west and north–south traffic are its main advantages [34]. The climate is mild with moderate rainfall, and the four distinct seasons consist of fluctuating springtime temperatures and copious summertime precipitation.
Hefei, an inland coastal city with a distinct strategic economic position, is one of the Yangtze River Delta city cluster’s sub-centres. It offers tremendous potential for both economic and population expansion. Hefei’s population increased to 9.37 million by the end of 2020, the urbanisation rate reached 82.28%, and the city’s gross domestic product (GDP) was CNY 104.572 billion [35]. In recent years, Hefei has been in a state of rapid development, and the significant strength of science and technology innovation has become one of the representative advantages of Hefei, which is also known as the “capital of science and technology”. Hefei is the city with the strongest scientific and technological innovation strength in the province and has become the only city in China with five national innovation brands: the comprehensive national science centre, national independent innovation demonstration zone, national innovation pilot city, national systematic promotion of comprehensive innovation reform experiment, and pilot demonstration city of “Made in China 2025”. Hefei is now in the process of establishing a national innovation centre. At present, Hefei City is constantly developing towards the goal and direction of “Great Lake City, Innovation Highland” and is in a rapid development stage in various fields, but it has also produced some “urban disease” problems, such as the following: serious haze and imbalance in the distribution of social service resources. The city skyline is too homogeneous. Sustainable development for the environment and economy is required; it is crucial to develop a solution that maintains its identity while urbanising.

2.2. Methods

2.2.1. Semantic Segmentation

Assigning a meaning to each pixel in an image is the task of semantic segmentation, from a set of predefined categories to the corresponding class label. Compared to standard classification, which aims to forecast all of the image’s labels, it is a more complex process, even though it can be thought of as a pixel-level classification problem in image pixels [36]. Deep learning-based approaches to semantic segmentation have brought great success and hence improved their accuracy-related performance.

2.2.2. Entropy Weighting Method to Determine Weights

The entropy weighting technique is a goal weighting strategy that keeps subjective factors from influencing the result and clearly illustrates the importance of each indicator. Currently, this technique is broadly used in the lookup of indicator gadget contrast [37]. A well-known method for handling the problem of ranking alternatives from best to worst is TOPSIS. The entropy approach is utilised in TOPSIS computation to determine the weights of each criterion, thereby effectively preventing the impact of human subjective factors [38]. For this reason, this paper calculates indicator weights based totally on the entropy weight TOPSIS technique to check ecological environmental drivers as follows:
Step 1: Ecological environment indicators include a variety of inconsistent data types and unit types, and there may be positive and negative indicators between indicators. Therefore, after raw data collection is completed, the negative indicators need to be inverted, after which the data are normalised, and to normalise all the indicators to [0, 1], the chosen approach for data normalisation is the minimum–maximum value method.
X i j = X M a x X i j X M a x X M i n ,
r i j = x i j m i n i m a x i m i n i ,  
Following normalisation, X i j indicates the value of the indicator in the region; X i j is the i -th indicator’s initial value in the region j ; X M i n represents the indicator’s minimum value; and X M a x represents its maximum value.
Included among these is the standardised value for each indicator. ∈ [0, 1] is the assessment index for every city throughout several years.
Step 2: Calculate the entropy value.
p i j = r i j i = 1 N r i j     ( i = 1 , 2 , N ; j = 1 , 2 , T ) ,
e i = j = 1 T p i j × ln p i j ln T     ( i = 1 , 2 , N ; j = 1 , 2 , T ) ,
In the equation, e i stands for entropy, p i j for the weight of the indicator’s value in the city j over time; T is the total sample size, while N represents the total number of samples of evaluation indicators.
Step 3: Calculate indicator weights w i :
w i = ( 1 e i ) i = 1 N ( 1 e i )     i = 1 , 2 , N ,

2.2.3. Exploratory Factor Analysis (EFA)

The responses were entered into the SPSS AU spreadsheet program and subjected to descriptive statistical analysis. The Kolmogorov–Smirnov goodness-of-fit test was employed for each variable to evaluate its adherence to the Gaussian, EFA, and Cronbach alpha coefficients or to a normal distribution in relation to all structures [39,40].
To comprehend the relationship and grouping of Likert scale variables to create a structure [41], a preliminary factor analysis was carried out. In accordance with Maciel, E.D.S. et al. [42], the data were analysed for normality, covariance, and outlier distribution for this reason.
Bartlett’s sphericity test and Kaiser–Meyer–Olkin (KMO) measurements were utilised to ascertain the degree of confidence that may be anticipated when applying EFA on data [43].
Items with empirical studies, more than 60% of variance explained, and loadings above 0.4 were retained as they were considered to be of practical significance. If an item loaded more than 0.35 on several factors or less than 0.4 on a single factor, it was deleted. To be included in the analysis, each item must also have a commonality greater than 0.50.

2.2.4. Data Sources

The Hefei Archives and the Anhui Provincial Tourism Bureau provided the image data needed for semantic segmentation in this work, which covered the years 2006–2024. Based on the collected images of the change process of the city skyline of Hefei’s new political and cultural district, the images are recognised and analysed using semantic segmentation to extract the components of the skyline and create the corresponding indicator data.
The questionnaires were collected in February 2024, and the questionnaires were distributed both online and offline, with the online questionnaires mainly coming from the acquaintance groups and the offline questionnaires mainly targeting the local people in Hefei and the people around the Swan Lake in Hefei City. The indicator system constructed by the questionnaire involves a total of nine indicators, and the main sources of data and information used in this study are as follows: landmarks, social, visual, economic, recreation, healing, sky, green plants, and water bodies.
After the data were extracted by the above methods, all the data were organised through Excel tables and subsequently analysed and processed using SPSS AU, and all the spatial analyses and mapping were carried out by ArcMap 10.7 software. In addition, considering the timeliness, referability, and accuracy of the data, this study is based on the skyline pictures of Hefei Governmental and Cultural New Area at six time nodes (the nodes are 2006, 2016, 2018, 2020, 2022, and 2024, respectively), to study the regional evolution of the city skyline of Hefei Governmental and Cultural New Area.

2.2.5. Construction of Questionnaire Indicator System

The aim of this study was to obtain findings that could be used to assess the overall value of the city skyline. For this purpose, nine indicators were constructed, and to further enhance the comprehensiveness of the questionnaire, social, healing, and landmark factors were also utilised. Although not included in other previous studies, it was hypothesised that these were essential, particularly in the context of urban skylines. In addition, visuals were added to the review of the classic values’ literature. The ten different evaluation layer types that were developed using this procedure and given to the questionnaire respondents are displayed in Table 1. Like earlier research, these kinds are speculative and will have a survey conducted to determine their validity. The following are the general prerequisites for building the city skyline evaluation indicators:
Firstly, the development of the Hefei New Administrative and Cultural District (NACD) has so far had a certain level of landmark status, which has brought about significant social benefits, and secondly, the formation of the skyline of the NACD has brought about corresponding recreational and ornamental qualities for the surrounding residents as well as tourists. The vegetation and water planning of the new political affairs and culture area also affect the ornamental nature of the skyline of the new political affairs and culture area, so the landmark, social, visual, economic, recreation, healing, sky, greenery, and water factors act as the core to build a questionnaire indicator.

2.2.6. Questionnaire Design

A total of ten question items were chosen to gauge their assessment of the new political and cultural district’s skyline effect in Hefei based on the in-depth literature review on the city skyline and city image, as well as the development characteristics of the area. The 10 topics were evaluated through questionnaire surveys in the neighbourhood of the New Administrative and Cultural District and in Hefei locality.
The first method involved creating an open-ended questionnaire based on a star questionnaire. To complete it, subjects had to be locals or citizens who had visited the new political and cultural district and had some impression of it. They had to rate the surrounding area and skyline in relation to Table 2’s indicator descriptions. The survey took the shape of a scale, with each question having a set of statements, nine possible answers, and a score ranging from 1 to 9 depending on how much the effect was evaluated. The score indicated how the respondent felt about the set of statements (Table 2). A 9-point rating system was used to ask participants to order the significance of each attribute. The questionnaire covered demographics such as age, gender, income, and the degree of education, as well as an assessment of the skyline and its surroundings (e.g., how representative do you think the New Administrative and Cultural District is of the city of Hefei as an urban landmark, etc.) and an impression of the skyline and its surroundings. Members of the research team possessing specialised knowledge accurately distributed the questionnaires in nodal spaces that were representative of the New Administrative and Cultural District.

2.2.7. Process Relationship

In this paper, we take the Hefei Political Affairs and Culture New Area as an example and study the year-by-year changes in the skyline of the Political Affairs and Culture New Area from 2006 to 2024 and the evaluation level of the current skyline through the following four steps. Firstly, we collect year-by-year images of the skyline of the New Administrative and Cultural Area from the perspective of the south shore of Swan Lake. Second, we use artificial intelligence techniques to extract the components of the images for image recognition and derive the percentage between each component. We specifically use the semantic segmentation method recently introduced by Tao, Sapra, and Catanzaro, which has produced innovative results in two widely employed extensively public datasets as of August 2021. In terms of label diversity and segmentation accuracy, this approach is impressive when compared to earlier research. Third, the TOPSIS entropy weight approach was used to rank the component results based on their percentage share in order to determine the trend of the skyline. Fourth, indicators were created to become questionnaires based on the aforementioned studies together with local skyline features. Data were gathered, and indicator weights were analysed using exploratory factor analysis.

3. Results and Analysis

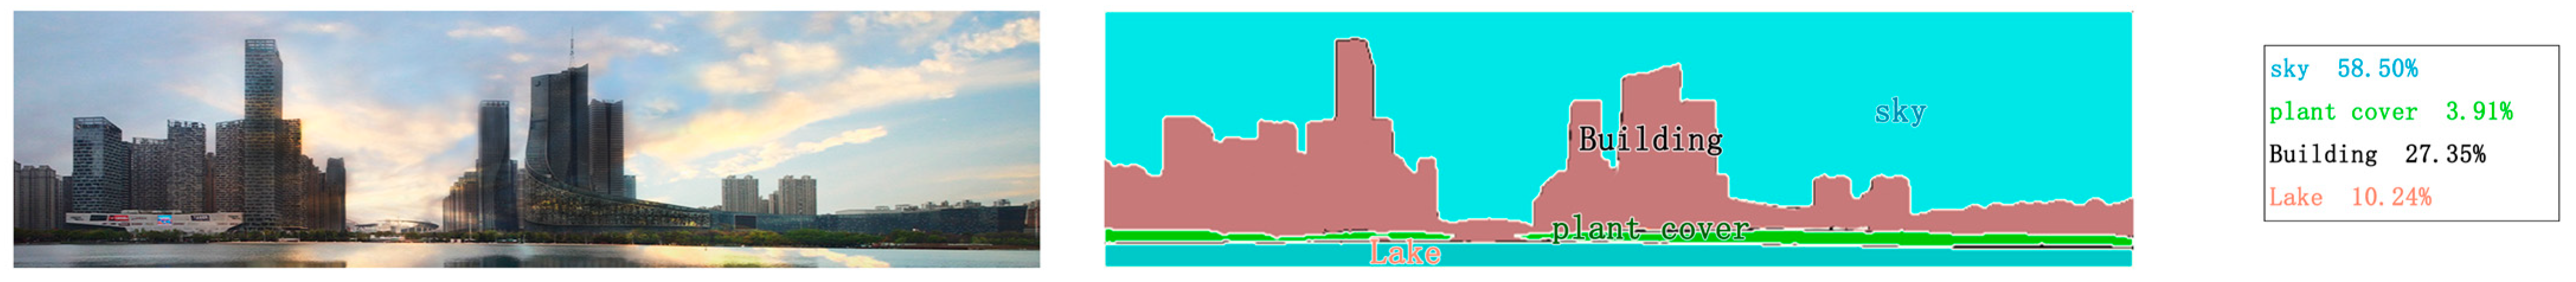
3.1. Semantic Segmentation Image Data Analysis

The skyline of the new political and cultural district is divided into two viewpoints: the Hefei Grand Theatre and the Radio and Television Centre. Firstly, the collected skyline picture data (nine pictures) were processed by applying the semantic segmentation method to the pictures, and each picture after semantic segmentation was divided into four subdivided categories: sky, building, vegetation, and lake. Given that some categories accounted for too small a percentage, they were ignored to obtain the data results on the right side of (Figure 2, Figure 3, Figure 4, Figure 5, Figure 6, Figure 7, Figure 8, Figure 9 and Figure 10). The percentage of picture data were sorted using an Excel table. The Excel table data were then analysed and processed in SPSS AU utilising the TOPSIS–entropy weight approach, yielding the results displayed in Table 3 and Table 4.
A comparison of the images shows that the proportion of buildings and vegetation is increasing year by year, and the corresponding sky and lake areas are decreasing. In the picture comparison results from the viewpoint of the Hefei Grand Theatre, the proportion of buildings has increased by 6.71% at most, and the proportion of vegetation has increased by 3.22% at most. In the picture comparison results from the viewpoint of the Radio and Television Centre, the percentage of buildings has increased by 3.65% at most, and the percentage of vegetation has increased by 1.27% at most. The percentage of buildings increased significantly between 2006 and 2018 and then levelled off, while the increase in the percentage of vegetation showed a steady trend.
The relative proximity ranking of the Hefei Political and Cultural New Area in each year (Hefei Grand Theatre) can be observed based on the results displayed in Table 3 and Table 4: ranked fourth in 2006, ranked third in 2016, ranked second in 2020, and ranked first in 2024. The relative proximity ranking of the Hefei Political and Cultural New District by year (Broadcasting Centre) is as follows: ranked third in 2006, fifth in 2018, fourth in 2020, second in 2022, and first in 2024. With the rise in the year’s ranking, it is evident that its ranking exhibits a notable upward trend, in which the overall effect of the skyline of the new political and cultural district in 2024 is relatively the best. Overall, due to the attention and construction of the government and related departments, the skyline of the new political and cultural district in 2024 has been improved to a certain extent in terms of architecture and vegetation compared with the previous one, making its overall picture effect the best. From the perspective of proportionate weight, vegetation has the highest proportion of weight and has the greatest impact on the overall picture effect. This stems from the fact that the construction of Hefei’s new political and cultural district has basically stabilised, while the quality of the environment and infrastructure in its surroundings is still being improved.

3.2. Analysis of Questionnaire Data

We responded to 15 question items, and we set up our target respondents more broadly; it was sufficient for respondents to have some impression of the new political and cultural district skyline—any level of impression was acceptable. On a Likert scale, 0 represents strongly disagree and 9 represents strongly agree; participants rated their answers. It was required that each respondent answer all of the questions in order to produce accurate data.
The questionnaire distribution mainly for the city of Hefei, open-ended questionnaire issued a total of 263 questionnaires, of which 210 valid questionnaires were recovered for the new political and cultural district skyline, after the deletion of questionnaires that were not understood, and the effectiveness rate was 79.85%. The male-to-female ratio was 46.19% and 53.81%, respectively, and the largest age-related percentage was 31–40 years followed by 21–30 years. The data from the 210 samples were then analysed for reliability in SPSS AU, and after the reliability was met, the data were then subjected to exploratory factor analysis.
  • Reliability analysis
Reliability studies are conducted to assess the importance and reasonableness of the study items; the questionnaire data were comprehensively analysed by Cronbach’s alpha coefficient and the KMO value and other indices and Bartlett’s sphericity test were used to confirm the degree of data validity. Cronbach’s alpha coefficient is utilised to evaluate the data’s reliability, Bartlett’s test of sphericity is used to examine the data’s acceptability for factor analysis, and the KMO value is applied to determine the appropriateness of the extracted data.
The validity and reliability of the City Skyline Evaluation Survey Scale were examined. With a Cronbach’s alpha coefficient of 0.905, as indicated in Table 5, the reliability is acceptable. As can be seen in Table 6, the scale’s KMO value is 0.850, indicating that the research data’s validity meets the required threshold [46], making it ideal for factor analysis. A chi-square value of 1275.778 and p-value of 0.000 with less than 0.05 as the significance threshold were obtained from Bartlett’s sphericity test. All also suggest that factor analysis can be performed on this data file.
2.
Exploratory factor analysis
Using an exploratory factorial approach, the structures and their groupings can be identified. The adjustment steps were as follows: principal component extraction, principal axis factor extraction, and alpha factor extraction were tested; the principal component extraction method gave the greatest outcomes. In order to find the adjustment point for the loading factors and explain the variance, the exclusion of variables was tested until the best fit point was reached. The results of the factor loading coefficients after the first exploratory factor analysis rotation using principal component analysis are displayed below in Table 7.
There are some items in Table 7 that span two factors, or the factor loading coefficients of the items are small. For example, the factor loading coefficient of Q1 (the representativeness of the new political and cultural district as a landmark landscape of Hefei City) under Factor 1 is 0.718 and under Factor 2 is 0.433, with a large difference in the loading coefficient; therefore, Q1 (the representativeness of the new political and cultural district as a landmark landscape of Hefei City) is retained under Factor 1 without deletion, and the question item with a load value of less than 0.4, Q3 (the representativeness of the new political and cultural district of Hefei to generate more economic benefits), is deleted [47]. The exploratory factor analysis findings are displayed in Table 8 and were finally obtained; the factor loading coefficients of Q1-Q7 in Factor 1 were all greater than 0.6, and the factor loading coefficients of Q8-Q10 in Factor 2 were all greater than 0.8, and the values higher than 0.60 were considered to be up to the standard, so the validity of the modified scale was good.
Two factors were extracted as follows:
Factor 1 “Skyline Value”, including E1 Landmarks, E2 Society, E4 Recreation, E5 Visual, and E6 Healing.
Factor 2 “Neighbourhood Ecological Quality”, including E7 Sky, E8 Greenery, and E9 Water.
After finding two factors with eigenroots larger than 1, the variance explained ratio was calculated to obtain the results displayed in Table 9. The combined cumulative explained variance of the two factors was 70.851%, indicating strong explanatory power, with the unrotated first factor explaining 57.480% of the variance, essentially meeting the 50% criterion.
The results of analysing the weights of the ten questions are displayed in Table 10, which indicates that there is a slight variation in the overall weight of the weight coefficients of the ten questions and that they are generally even. Among them, Q4 (the optimisation of the leisure space around the new political and cultural district) has the highest weight coefficient, 12.41%, and people’s satisfaction with this item is the highest, while Q2 (the population concentration in the new political and cultural district) has the smallest weight coefficient, 9.78%, and people’s satisfaction with this item is the worst. In the overall comparison, the weight coefficients of Q1 (the representativeness of the New Administrative and Cultural District as Hefei’s urban landmark landscape), Q4 (the degree of optimisation of the leisure space around the New Administrative and Cultural District), Q5 (the comfortability of the skyline curve changes in the New Administrative and Cultural District), and Q8 (the sky visibility of the skyline in the New Administrative and Cultural District) are relatively high, 11.94%, 12.41%, 11.79%, and 11.82%, respectively, and people have a relatively high level of satisfaction with these four options.

4. Discussion

4.1. The Construction of the New Political and Cultural District’s Skyline

According to the analysis of the semantic segmentation results, it is found that the overall quality of the skyline of the new political and cultural districts shows an upward trend, and the number of buildings increased significantly between 2006 and 2018, and then the changes levelled off. The reason for this is that close to the 20th century’s end, some cities across the country began to build new political affairs districts, and the motives were, firstly, to improve the conditions of government administrative offices; secondly, to expand the urban space and drive the shift of the city’s centre of gravity; and thirdly, to promote the construction of the new districts. In November 1995, more than 200 acres of land was reserved for the planning and siting scheme of the Municipal Governmental Affairs Centre as part of the office land for the municipal administrative organs. In March 2001, it was planned to relocate the administrative functions of the province and the city from the old urban area and to concentrate on the construction of the new district of governmental affairs. In April 2003, the governmental affairs district was launched for the purpose of demolition and resettlement. In June 2007, it put forward the sixteen-word guideline of adhering to two types, perfecting functions, legal action, and accelerating development, which caused the new district’s emphasis to change to accelerate the district’s overall development and construction. While the new district was being built, the government affairs building and the successive development and construction of the Hefei Grand Theatre, the provincial museum, and the provincial radio and television building that has become a new landmark of the city of Hefei, in about 2010, the construction of the new district of government affairs and culture was basically completed.
The overall changes in the new political and cultural district in the last decade or so are relatively small, and the building complex is basically fixed, but the proportion of vegetation continues to increase in a small and even manner, while the vegetation weighting coefficient is the largest among the various proportions. Comparing the relative proximity rankings between years, the skyline quality of the new political and cultural district in 2024 is the best. It demonstrates that in June 2020, Hefei was closely monitoring the environmental governance-related work. Together with the pertinent units involved in the plan’s preparation, the objectives and assignments for the scientific preservation of the ecological environment were established by the Hefei Municipal Bureau of Ecology and Environment. This shows that it pays attention to the comprehensive convergence with both the national “The 14th Five-Year Plan for Environmental and Ecological Protection” along with “The province of Anhui’s fourteenth five-year plan for protecting the ecology and surroundings” preservation of the natural world. After continuous development, the new political and cultural district has basically stabilised, as the Radio and Television Centre and the Hefei Grand Theatre have become some of the landmarks in Hefei, making the skyline of the new political and cultural district a business card of the city of Hefei.

4.2. The Status of the Skyline of the New Political and Cultural District

Because there are so many variables to consider, evaluating the city skyline is difficult. It must consider whether the area is representative and its skyline brings enhancement to the city’s image, while the surrounding environment also has an impact on the skyline.
The skyline may be neglected in the study of urban image; however, it is extremely important to correlate the city skyline with the city image, and this study uses a questionnaire to assess the level of the skyline of the Hefei New Administrative and Cultural District at the present time.
Firstly, it was found in the study’s findings that the interviewed population had the relatively best evaluation of the recreational nature of the new political and cultural district and a relatively poor evaluation of its population concentration, which shows that people are most satisfied with the infrastructure around the new political and cultural district. Secondly, the evaluation of its landmarks, the comfort of curve changes, and the visibility of the sky are relatively more satisfactory. Finally, comparing the overall satisfaction of all the questions, the performance is good, and there is no “cliff type” lower or higher than the other questions, which shows that people are more satisfied with the skyline of the Hefei New Administrative and Cultural District, and it has a good effect on the creation of Hefei’s city image.
In the exploratory factor analysis, Q3 (the new political and cultural district generates more economic benefits for Hefei) has the weakest linkage with the question items, and it indicates that the economy of the new political and cultural district of Hefei is not very relevant for its skyline at the present time. The results obtained after deleting this option show two factors, namely Factor 1 “Skyline Value” (including E1 Landmarks, E2 Social, E4 Entertainment, E5 Visual, and E6 Healing) and Factor 2 “Neighbourhood Ecological Quality” (including E7 Sky, E8 Greenery, and E9 Water).
Combined with the results of the semantic segmentation method, it can be seen that the skyline of Hefei’s new political and cultural district has been basically perfected through the continuous development in the early years and basically remained unchanged in recent years, and the subsequent optimisation and enhancement can be targeted at the “surrounding ecological quality”.
In order to optimise the skyline of the Hefei New Administrative and Cultural District, the following aspects can be considered:
While increasing the number of buildings, urban greening should be strengthened to provide more public green space and leisure space, and thorough treatment should be performed for Swan Lake’s water quality in order to enhance the city’s ecological quality. In the construction of the new district, the traditional cultural elements of Hefei should be integrated to reflect the local characteristics. During the construction process, attention should be paid to the energy-saving performance and sustainability of buildings, and green building materials and technologies should be promoted in order to lessen the impact on the environment.
Furthermore, the skyline of Lujiazui in Shanghai, China, is very representative of the city’s skyline. Scholars such as ZHAO M and others have used Shanghai’s Oriental Pearl Radio and Television Tower and the Shanghai Center Tower as the objects of their research to analyse the assessment of a high-rise building’s visual preference for the city’s landmarks and its surrounding architectural complexes, which suggests that a city’s highland and low-lying areas can win the visual attention and acceptance of sightseeing visitors [48]. Shanghai’s city skyline is not only famous for its high-rise buildings but also for its eye-catching lights at night to attract tourists. Similarly, the city skyline of Hong Kong, China, is also representative in terms of night effects and is one of the tourist attractions in Hong Kong. This study does not involve the night skyline picture, but the Hefei political and cultural new district of the Radio and Television Centre as a representative high-rise building can play a greater role in the political and cultural new district skyline of the night effect to become strengthened.

4.3. Comparison of Studies

Mehrdad Karimimoshaver et al. [19] focused on what type of skyline people prefer, using the form of observing skyline photographs of different divisions and then completing a questionnaire to obtain the results of the study. From the respondents’ point of view, it was learned that people can influence the level of preference for the type of skyline depending on where they live, their level of education, and their occupation.
Puspitasari A W et al. [20] used the spatial layout of tall structures as an entry point for the study and categorised the spatial layout of building groups in terms of circular, rectangular, and linear layouts to examine how high-rise structures affect the skyline of the city, and the map images of three representative areas were selected as the research object, which led to the conclusion that different spatial layouts of building groups are adopted in different urban street patterns and that the linear layout has the best visibility.
Caner Guney et al. [13] found that urban sprawl has dramatically changed the skyline, so they decided to use geographic modelling and GIS technology to help set reasonable limits on building heights while suggesting that cities should still develop vertically to avoid damaging the surrounding lakes and jungles.
This study distinguishes itself from previous studies of the skyline by using the semantic segmentation method to show the evolution of the skyline, which is a way to understand the level of development of Hefei in the last 20 years by comparing pictures and showing the process of change in a more intuitive way from the dimension of time. The method is then combined with a questionnaire to understand people’s evaluation level of the skyline of Hefei City’s new political and cultural district from the people’s point of view. The questionnaire was collected using exploratory factor analysis, which can obtain the degree of correlation between factors and exclude unwanted factors to give more accurate suggestions.
There are also limitations in this study; it is difficult to collect skyline photos from the same angle, so the selection of years cannot be evenly spaced out, making the study data inadequate. There are also differences in the clarity of the pictures, and the semantic segmentation method of processing the pictures will produce a certain degree of error, which then affects the data results to a small extent. In addition, this article mainly focuses on the changes in the skyline from the same angle, the skyline as a three-dimensional thing; there are still a lot of perspectives worthy of research and exploration, for example, later on, we can try to use three-dimensional technology for virtual reality to simulate the changes in the city skyline, in order to achieve better research results.

5. Conclusions

For the first time, the semantic segmentation method is applied to analyse the evolution of the city skyline, and the components of the skyline are extracted through image recognition technology, which visualises the trend of the skyline over time and provides a new perspective for the study of skyline evolution. Then, for the first time, the exploratory factor analysis method is combined to evaluate the city skyline, and key factors affecting the skyline evaluation, such as the value of the skyline and the ecological quality of the surrounding area, are found, which provide a theoretical basis for the evaluation of the skyline. A questionnaire survey reflects the public’s evaluation of the skyline of the new political and cultural district and finds that the landmark and entertainment aspects are well received, providing a reference for the image construction of the new district.
From this investigation, the following two conclusions were made:
(1)
In this study, pictures of the city skyline of the new political and cultural district at different times from the same angle are analysed by semantic segmentation for the proportion of the pictures, to visualise the process of changes in the skyline of the new political and cultural district. Among them, the proportion of buildings and vegetation increases, while the trend of their increase differs, with the increase in buildings levelling off after 2018 and vegetation reflecting a uniformly rising trend. The reason for this is that the new Hefei political and cultural district was demolished and reconstructed in 2003, and the prototype of the new Hefei political and cultural district was basically completed around 2010. The data are processed using entropy weight–TOPSIS to produce comparatively objective ranking results, which show that the skyline of the new political and cultural district in 2006 is the worst, and the effect in 2024 is the best, and in the weighting analysis, the vegetation has the highest weighting, which indicates that the new political and cultural district of Hefei and its environmental quality are constantly improving and upgrading.
(2)
The current status of the new government culture district was assessed through a scaled questionnaire, and exploratory factors were used to analyse and process the questionnaire data. The inter-relationships between the variables could be understood through the application of exploratory factor analysis techniques. After removing variables with low indicators, factor analysis allowed for adjustments to be made to the assessment tool. For example, “The new political and cultural district generates more economic benefits for Hefei”. Therefore, the structure of the skyline evaluation grouping based on the results of the rotation matrix was as follows: skyline subject and environment. “Skyline value” includes landmark, social, recreational, visual, and healing factors and “surrounding ecological quality” includes sky, greenery, and water factors.
This study’s findings demonstrate that a city’s skyline can improve people’s perceptions of it, and the trend of the skyline change in the Hefei Political and Cultural New Area is positive; the skyline of the Hefei Political and Cultural New Area in 2024 is relatively well developed compared to the previous one, and its optimisation at the present time can be targeted at recreational space, vegetation, environment, and water bodies.
All in all, the results of this study show that the city skyline has an enhancing effect on the image of a city. In an overall comparison, the trend of the skyline change in Hefei Political Affairs and Culture New District is positive, and the skyline of Hefei Political Affairs and Culture New District in 2024 has been developed relatively well compared to the previous one and has become one of the landmark landscapes in Hefei. However, compared with the skyline of other developed cities, it still needs to be optimised, and through the questionnaire analysis, it can be specifically optimised in terms of its recreational space, vegetation, environment, and water body.

Author Contributions

Conceptualisation, Y.G., M.Z. and M.Y.; methodology, Y.G. and L.Z.; software, M.Z. and M.Y.; validation, Y.G.; formal analysis, Y.G.; investigation, Y.G. and L.Z.; resources, Y.G.; information curation, M.Z. and M.Y.; writing—original draft preparation, M.Z. and M.Y.; writing—review and editing, Y.G. and L.Z.; visualisation, M.Z. and M.Y.; supervision, L.Z. and Y.G.; task administration, Y.G. All authors have read and agreed to the published version of the manuscript.

Funding

This research was supported by the Open Project (ACTK2022ZD02) (ACTZ2022ZD01), Digital Smart Rural Cultural Tourism Research Innovation Team (project No. 2022AH010022), 2023 Anhui Culture and Tourism Innovation and Development Research Institute Director’s Fund Key Projects (project No. ACTZ2023ZD01) and the Social Science Innovation Development Research Project of Anhui Province (2023CX137).

Data Availability Statement

The data presented in this study are available on request from the corresponding author.

Conflicts of Interest

The authors declare no conflicts of interest.

References

  1. Sun, J.; Zhou, T.; Wang, D. Effects of urbanisation on PM2.5 concentrations: A systematic review and meta-analysis. Sci. Total Environ. 2023, 900, 166493. [Google Scholar] [CrossRef] [PubMed]
  2. Zhao, X.; Mao, X.; Lu, Y. Skyscraper height and urban development in developing countries: Economy and trade. Kybernetes 2023. ahead-of-print. [Google Scholar] [CrossRef]
  3. Karimimoshaver, M.; Ahmadi, M.A.; Aram, F.; Mosavi, A. Urban Views and Their Impacts on Citizens: A Grounded Theory Study of Sanandaj City. Heliyon 2020, 6, e05157. [Google Scholar] [CrossRef]
  4. Karimimoshaver, M.; Hajivaliei, H.; Shokri, M.; Khalesro, S.; Aram, F.; Shamshirband, S. A Model for Locating Tall Buildings through a Visual Analysis Approach. Appl. Sci. 2020, 10, 6072. [Google Scholar] [CrossRef]
  5. Karimimoshaver, M.; Winkemann, P.A. Framework for Assessing Tall Buildings’ Impact on the City Skyline: Aesthetic, Visibility, and Meaning Dimensions. Environ. Impact Assess. Rev. 2018, 73, 164–176. [Google Scholar] [CrossRef]
  6. Tavernor, R.; Gssner, G. Visual consequences of the plan: Managing London’s changing skyline. City Cult. Soc. 2010, 1, 99–108. [Google Scholar] [CrossRef]
  7. Samavatekbatan, A.; Gholami, S.; Karimimoshaver, M. Assessing the visual impact of physical features of tall buildings: Height, top, color. Environ. Impact Assess. Rev. 2016, 57, 53–62. [Google Scholar] [CrossRef]
  8. United Nations. World Urbanization Prospects. 2018. Available online: https://population.un.org/wup/View (accessed on 1 February 2024).
  9. Santana, J.R.; Maggio, M.; Di Bernardo, R.; Sotres, P.; Sánchez, L.; Muñoz, L. On the Use of Information and Infrastructure Technologies for the Smart City Research in Europe: A Survey. IEICE Trans. Commun. 2018, E101.B, 2–15. [Google Scholar] [CrossRef]
  10. Xie, C.; Chen, Y.; Sun, Q. Communication Strategy of New Media Art to City Image under Smart City Information Technology. Math. Probl. Eng. 2022, 2022, 2700315. [Google Scholar] [CrossRef]
  11. Wei, X.; Duan, Q.; Zhou, L. A QoE-Driven Tactile Internet Architecture for Smart City. IEEE Netw. 2020, 34, 130–136. [Google Scholar] [CrossRef]
  12. Gholami, S.; Karimimoshaver, M.; Samavatekbatan, A. Assessing the impact of natural skylines on residents’ preferences for built skylines. J. Architect. Plann. Res. 2019, 36, 215–228. [Google Scholar]
  13. Guney, C.; Akdag Girginkaya, S.; Cagdas, G.; Yavuz, S. Tailoring a Geomodel for Analyzing an Urban Skyline. Landsc. Urban Plan. 2012, 105, 160–173. [Google Scholar] [CrossRef]
  14. Lim, B. Heath What Is a Skyline: A Quantitative Approach Architect. Sci. Rev. 1994, 37, 163–170. [Google Scholar]
  15. Kalude, D.R.R.; Kembuan, D.R.E.; Ratumbuisang, K.F. Aesthetics Skylines in Manado. Technium 2023, 16, 355–363. [Google Scholar] [CrossRef]
  16. Charney, I. The politics of design: Architecture, tall buildings and the skyline of central London. Area 2007, 39, 195–205. [Google Scholar] [CrossRef]
  17. Cobanli, F.T.; Ceylan, M.A. Skyscrapers as a Factor That Affects the Urban Skyline in Istanbul. East. Geogr. Rev. 2023. [Google Scholar] [CrossRef]
  18. Kevin, L. Urban Imagery; Huaxia Publishing House: Beijing, China, 2001. [Google Scholar]
  19. Karimimoshaver, M.; Parsamanesh, M.; Aram, F.; Mosavi, A. The Impact of the City Skyline on Pleasantness; State of the Art and a Case Study. Heliyon 2021, 7, e07009. [Google Scholar] [CrossRef] [PubMed]
  20. Puspitasari, A.W.; Kwon, J. Comparison of Spatial Layout of Tall Buildings Clustered in Circular, Rectangular, and Linear Geographical Areas and Impact on Skyline. Buildings 2020, 10, 64. [Google Scholar] [CrossRef]
  21. Thoma, M. A Survey of Semantic Segmentation. arXiv 2016, arXiv:1602.06541. [Google Scholar] [CrossRef]
  22. Lin, T.-Y.; Maire, M.; Belongie, S.; Bourdev, L.; Girshick, R.; Hays, J.; Perona, P.; Ramanan, D.; Zitnick, C.L.; Dollár, P. Microsoft COCO: Common Objects in Context. arXiv 2014, arXiv:1405.0312. [Google Scholar] [CrossRef]
  23. Li, Y.; Qi, H.; Dai, J.; Ji, X.; Wei, Y. Fully Convolutional Instance-Aware Semantic Segmentation. In Proceedings of the IEEE Conference on Computer Vision and Pattern Recognition (CVPR), Honolulu, HI, USA, 21–26 July 2017. [Google Scholar]
  24. Maldonado-Bascon, S.; Lafuente-Arroyo, S.; Gil-Jimenez, P.; Gomez-Moreno, H.; Lopez-Ferreras, F. Road-Sign Detection and Recognition Based on Support Vector Machines. IEEE Trans. Intell. Transp. Syst. 2007, 8, 264–278. [Google Scholar] [CrossRef]
  25. Cohen, A.; Rivlin, E.; Shimshoni, I.; Sabo, E. Memory Based Active Contour Algorithm Using Pixel-Level Classified Images for Colon Crypt Segmentation. Comput. Med. Imaging Graph. 2015, 43, 150–164. [Google Scholar] [CrossRef]
  26. Huang, C.; Davis, L.S.; Townshend, J.R.G. An Assessment of Support Vector Machines for Land Cover Classification. Int. J. Remote Sens. 2002, 23, 725–749. [Google Scholar] [CrossRef]
  27. Suzuki, M.; Mori, J.; Maeda, T.N.; Ikeda, J. The Economic Value of Urban Landscapes in a Suburban City of Tokyo, Japan: A Semantic Segmentation Approach Using Google Street View Images. J. Asian Archit. Build. Eng. 2023, 22, 1110–1125. [Google Scholar] [CrossRef]
  28. Martinez-Sanchez, L.; Borio, D.; d’Andrimont, R.; van der Velde, M. Skyline Variations Allow Estimating Distance to Trees on Landscape Photos Using Semantic Segmentation. Ecol. Inform. 2022, 70, 101757. [Google Scholar] [CrossRef]
  29. Almujibah, H. Factors Influencing Adoption of Digital Twin Advanced Technologies for Smart City Development: Evidence from Malaysia. Buildings 2023, 13, 775. [Google Scholar] [CrossRef]
  30. Sapsağlam, Ö.; Eryılmaz, A. Building Child-Friendly Cities for Sustainable Child Development: Child-Friendly City Scale-Child Form. Sustainability 2024, 16, 1228. [Google Scholar] [CrossRef]
  31. Zhang, F.; Shi, L.; Liu, S.; Cheng, M.; Zeng, F.; Li, J. Satisfaction among the Elderly Living in the Ancient Town of Xiangxi. Buildings 2023, 13, 1334. [Google Scholar] [CrossRef]
  32. Zhou, Q.; Gui, J.; Jiang, L. Analysis of the Effectiveness of Urban Construction in Hefei City’s Political and Cultural New District. Urban Constr. Theory Res. 2018, 25, 23–25. [Google Scholar]
  33. Yang, X.; Wei, G.; Liang, C. Construction of Ecological Security Pattern Based on Ecosystem Service Evaluation and Minimal Cumulative Resistance Model: A Case Study of Hefei City, China. Environ. Dev. Sustain. 2024, 26, 10681–10700. [Google Scholar] [CrossRef]
  34. Yao, X.; Chen, Y.; Zhang, Q.; Mou, Z.; Yao, X.; Ou, C. Assessment of the Urban Expansion and Its Impact on the Eco-Environment—A Case Study of Hefei Municipal Area. Sustainability 2022, 14, 10613. [Google Scholar] [CrossRef]
  35. Hefei Bureau of Statistics. Hefei Statistical Yearbook; Anhui People’s Statistics Press: Hefei, China, 2020. [Google Scholar]
  36. Papadeas, I.; Tsochatzidis, L.; Amanatiadis, A.; Pratikakis, I. Real-Time Semantic Image Segmentation with Deep Learning for Autonomous Driving: A Survey. Appl. Sci. 2021, 11, 8802. [Google Scholar] [CrossRef]
  37. Ding, L.; Shao, Z.; Zhang, H.; Xu, C.; Wu, D. A Comprehensive Evaluation of Urban Sustainable Development in China Based on the TOPSIS-Entropy Method. Sustainability 2016, 8, 746. [Google Scholar] [CrossRef]
  38. Chen, P. Effects of the Entropy Weight on TOPSIS. Expert Syst. Appl. 2021, 168, 114186. [Google Scholar] [CrossRef]
  39. Sarmento, R.P.; Costa, V. Confirmatory factor analysis-a case study. arXiv 2019, arXiv:1905.05598. [Google Scholar]
  40. Sharka, R.; San Diego, J.; Nasseripour, M.; Banerjee, A. Factor Analysis of Risk Perceptions of Using Digital and Social Media in Dental Education and Profession. J. Dent. Educ. 2023, 87, 118–129. [Google Scholar] [CrossRef]
  41. Kandasamy, I.; Kandasamy, W.B.V.; Obbineni, J.M.; Smarandache, F. Indeterminate Likert Scale: Feedback Based on Neutrosophy, Its Distance Measures and Clustering Algorithm. Soft Comput. 2020, 24, 7459–7468. [Google Scholar] [CrossRef]
  42. Maciel, E.D.S.; Savay-da-Silva, L.K.; Vasconcelos, J.S.; Galvão, J.A.; Sonati, J.G.; Silva, D.D.; Oetterer, M. Application of Exploratory Factor Analysis to Assess Fish Consumption in a University Community. Food Sci. Technol. 2013, 33, 99–106. [Google Scholar] [CrossRef]
  43. Watkins, M.W. Exploratory Factor Analysis: A Guide to Best Practice. J. Black Psychol. 2018, 44, 219–246. [Google Scholar] [CrossRef]
  44. Duan, J.; Liao, J.; Liu, J. Evaluating the Spatial Quality of Urban Living Streets: A Case Study of Hengyang City in Central South China. Sustainability 2023, 15, 10623. [Google Scholar] [CrossRef]
  45. Inoue, T.; Manabe, R.; Murayama, A.; Koizumi, H. Landscape Value in Urban Neighborhoods: A Pilot Analysis Using Street-Level Images. Landsc. Urban Plan. 2022, 221, 104357. [Google Scholar] [CrossRef]
  46. Barnes, C.; Passmore, H.A. Development and Testing of the Night Sky Connectedness Index (NSCI). J. Environ. Psychol. 2024, 93, 102198. [Google Scholar] [CrossRef]
  47. Shrestha, N. Factor Analysis as a Tool for Survey Analysis. Am. J. Appl. Math. Stat. 2021, 9, 4–11. [Google Scholar] [CrossRef]
  48. Zhao, M.; Zhang, J.; Cai, J. Influences of New High-Rise Buildings on Visual Preference Evaluation of Original Urban Landmarks: A Case Study in Shanghai, China. J. Asian Archit. Build. Eng. 2020, 19, 273–284. [Google Scholar] [CrossRef]
Figure 1. The study area of the new Hefei political and cultural district.
Buildings 14 01238 g001
Figure 2. Percentage of skyline by zone in 2006 (Hefei Grand Theatre).
Buildings 14 01238 g002
Figure 3. Skyline’s share of each zone in 2016 (Hefei Grand Theatre).
Buildings 14 01238 g003
Figure 4. Share of skyline zones in 2020 (Hefei Grand Theatre).
Buildings 14 01238 g004
Figure 5. Share of skyline zones in 2024 (Hefei Grand Theatre).
Buildings 14 01238 g005
Figure 6. Skyline’s share of zones in 2006 (KWTC).
Buildings 14 01238 g006
Figure 7. Skyline’s share of each zone in 2018 (KWCC).
Buildings 14 01238 g007
Figure 8. Share of skyline zones in 2020 (KWRC).
Buildings 14 01238 g008
Figure 9. Share of skyline zones in 2022 (KWRC).
Buildings 14 01238 g009
Figure 10. Share of skyline zones in 2024 (KWRC).
Buildings 14 01238 g010
Table 1. The indicator system of the questionnaire.
Target LevelStandardised LayerProgram LayerBibliography
An Evaluation Indicator System of Residents and Tourists on the City Skyline of the Hefei Political and Cultural New AreaE1 LandmarksF1 The representativeness of the New Administrative and Cultural District as a landmark landscape of Hefei City.[44,45]
E2 SocietyF2 The concentration of the population in the New Administrative and Cultural District.
E3 EconomyF3 The new government affairs and culture area generates more economic benefits for Hefei.
E4 EntertainmentF4 The degree of optimisation of the leisure space around the new government affairs and culture district.
E5 VisualF5 The comfort of the skyline curve change in the new government affairs and culture district.
F6 The colour harmony of the skyline of the new political and cultural district.
E6 HealingF7 Spiritual healing provided by the skyline of the new governmental and cultural district.
E7 SkyF8 The sky visibility of the skyline of the new governmental and cultural district.
E8 GreeneryF9 The degree of vegetation cover of the Swan Lake in the new governmental and cultural district.
E9 WaterF10 The extent of Swan Lake’s water quality change in the new cultural and governmental district.
Table 2. Indicator transformation.
Program LayerDescription
F1 The representativeness of the New Administrative and Cultural District as a landmark landscape of Hefei City.Q1 What do you think about the representativeness of the New Administrative and Cultural District as a landmark of Hefei City?
F2 The concentration of the population in the New Administrative and Cultural District.Q2 What do you think about the flow of people in the New Administrative and Cultural District?
F3 The new government affairs and culture area generates more economic benefits for Hefei.Q3 What do you think of the economic benefits that the New Administrative and Cultural District has brought to Hefei?
F4 The degree of optimisation of the leisure space around the new government affairs and culture district.Q4 What do you think about the optimisation of the leisure space around the New Administrative and Cultural District?
F5 The comfort of the skyline curve change in the new government affairs and culture district.Q5 What do you think about the comfort level of the skyline curve change in the New Administrative and Cultural District?
F6 The colour harmony of the skyline of the new political and cultural district.Q6 What do you think about the harmony of the building colours of the skyline of the New Administrative and Cultural District?
F7 Spiritual healing provided by the skyline of the new governmental and cultural district.Q7 How much do you think the skyline of the New Administrative and Cultural District provides spiritual healing?
F8 The sky visibility of the skyline of the new governmental and cultural district.Q8 What do you think about the visibility of the sky in the skyline of the New Administrative and Cultural District?
F9 The degree of vegetation cover of the Swan Lake in the new governmental and cultural district.Q9 What do you think of the degree of vegetation cover of the Swan Lake in the New Administrative and Cultural District?
F10 The extent of Swan Lake’s water quality change in the new cultural and governmental district.Q10 What do you think about the level of water quality improvement in the Swan Lake in the New Administrative and Cultural District?
Table 3. Ranking of relative proximity by year in Hefei Political and Cultural New Area, 2006–2024 (Hefei Grand Theatre).
The Results of the TOPSIS Evaluation Calculation
AnnumPositive Ideal Solution Distance D+Negative Ideal Solution Distance D-Relative Proximity COrdering Results
20060.4220.2890.4074
20160.3420.2720.4433
20200.2890.2700.4832
20240.3240.3670.5311
Table 4. Ranking of relative proximity by year in the new Hefei political and cultural district, 2006–2024 (KWTC).
The Results of the TOPSIS Evaluation Calculation
AnnumPositive Ideal Solution Distance D+Negative Ideal Solution Distance D-Relative Proximity COrdering Results
20060.4220.3060.4213
20180.4670.2090.3095
20200.3630.2270.3844
20220.2550.3010.5422
20240.2350.4400.6511
Table 5. Cronbach’s dependability assessment.
Number of ItemsSample SizeCronbach α Ratio
102100.905
Table 6. Cronbach’s dependability assessment.
KMO Value0.850
Bartlett Inspection of SphericitySample size1275.778
df36
p value0.000
Table 7. Factor loading coefficients for the initial exploratory factor analysis following rotation.
Name (Of a Thing)Factor Loading FactorCommonality (Common Factor Variance)
Factor 1Factor 2
Q10.7180.4330.704
Q20.6590.2600.503
Q30.5310.3430.399
Q40.8960.2250.854
Q50.7810.2950.697
Q60.7200.2080.562
Q70.7960.1530.656
Q80.3140.8750.864
Q90.2590.8070.718
Q100.2430.8440.771
Note: If the numbers in the table have colours, the loading coefficient’s absolute value is greater than 0.4 when the numbers are blue and less than 0.4 when the commonality (the variance of the common factor) is red. Rotation method: maximum variance method Varimax.
Table 8. Factor loading coefficients after exploratory factor analysis rotation.
Name (Of a Thing)Factor Loading FactorCommonality (Common Factor Variance)
Factor 1Factor 2
Q10.6930.4360.671
Q20.6430.2670.485
Q40.9050.2330.873
Q50.7910.3030.718
Q60.7390.2160.593
Q70.8020.1600.669
Q80.3120.8790.870
Q90.2580.8080.719
Q100.2460.8480.779
Note: If the numbers in the table have a colour, it indicates that the load factor’s absolute value is higher than 0.4. In this case, the number is blue. Rotation method: maximum variance method Varimax.
Table 9. Explanation of variance.
Factor NumberCharacteristic RootExplanation of Post-Rotation Variance
Characteristic RootVariance
Explained %
Cumulative %Characteristic RootVariance
Explained %
Cumulative %
15.17357.48057.4803.75241.69341.693
21.20313.37170.8512.62429.15870.851
Table 10. Linear combination coefficients and weighting results.
NameFactor 1Factor 2Composite Score FactorWeights
Q10.35800.26890.321311.94%
Q20.33190.16490.26329.78%
Q40.46700.14380.334012.41%
Q50.40840.18700.317311.79%
Q60.38160.13360.279610.39%
Q70.41420.09890.284510.57%
Q80.16080.54280.318011.82%
Q90.13290.49860.283410.53%
Q100.12680.52350.290010.78%
Disclaimer/Publisher’s Note: The statements, opinions and data contained in all publications are solely those of the individual author(s) and contributor(s) and not of MDPI and/or the editor(s). MDPI and/or the editor(s) disclaim responsibility for any injury to people or property resulting from any ideas, methods, instructions or products referred to in the content.

