
Development of Seismic Fragility Function for Underground Railway Station Structures in Korea

1
Environmental Assessment Group, Korea Environment Institute, 370 Sicheong-daero, Sejong-si 30147, Republic of Korea
2
Department of Geotechnical Engineering Research, Korea Institute of Civil Engineering and Building Technology, 283 Goyang-dearo, Ilsan-seogu, Goyang-si 10223, Republic of Korea
3
Department of Civil & Environmental Engineering, Hanyang University, 55 Hanyangdaehak-ro, Sangnok-gu, Ansan 15588, Republic of Korea
4
Department of Civil & Environmental Engineering, Gachon University, 1342 Seongnam-daero, Sujeong-gu, Seongnam-si 13120, Republic of Korea
*
Authors to whom correspondence should be addressed.
Buildings 2024, 14(5), 1200; https://0-doi-org.brum.beds.ac.uk/10.3390/buildings14051200
Submission received: 13 March 2024
/
Revised: 12 April 2024
/
Accepted: 18 April 2024
/
Published: 24 April 2024
(This article belongs to the Collection Assessment, Reconstruction and Decision Procedures for the Preservation of Existing Structures after Earthquakes)
Abstract
:This study describes the methodology employed to construct a seismic fragility function based on a pre-existing numerical model tailored for underground stations. Employing a dynamic numerical model, a comprehensive analysis encompassing 110 distinct cases was conducted, each varying in soil depth and classification. Seismic waves, conforming to the standard design spectrum, were utilized within these numerical analyses. The formulation of the fragility function within the constructed model follows a structured approach, segmented by damage indices and severity levels. This systematic breakdown serves to outline the fundamental framework for establishing the fragility function, providing insights into its development process. Subsequently, the derived fragility function underwent a rigorous comparative analysis against established seismic fragility functions from prior studies. This comparative assessment serves as a critical evaluation tool, allowing for an appraisal of the suitability and robustness of the newly developed fragility function in relation to existing benchmarks.
1. Introduction
The ongoing urban expansion and infrastructural evolution necessitate a comprehensive evaluation of seismic fragility, particularly for underground stations characterized by their intricate design and significant daily patronage. The menace posed by seismic activities to these subterranean constructs underscores the imperative for precise and effective risk assessment methodologies [1]. This manuscript delineates a refined methodology for the development of a seismic fragility function tailored to underground stations, with the objective of augmenting their resilience to earthquakes. In South Korea, the seismic events of 2016 and 2017, notably the Gyeongju earthquake with a magnitude of 5.8 and the Pohang earthquake with a magnitude of 5.4, have catalyzed a heightened societal consciousness regarding earthquake preparedness. Subsequently, it fostered a spectrum of research endeavors concentrating on seismic risk assessment and the structural response to seismic disturbances.
Seismic fragility functions, pivotal in earthquake engineering, facilitate a probabilistic analysis of a structure’s susceptibility to damage under varying seismic intensities. Such functions are integral to informed risk management and mitigation strategies. Nonetheless, the distinctive subterranean features of underground stations, including their interaction with the surrounding geotechnical environment and the dynamic nature of seismic waves, necessitate a customized assessment approach [2,3].
During an earthquake, the magnitude of seismic waves is relatively weaker than that of structures located above the ground surface. However, cut-and-cover tunnels, being installed in the soil layers of the ground’s upper surface, experience larger seismic magnitudes compared to bored tunnels, and the ground is relatively soft, increasing the likelihood of damage [4]. Demir et al. [5] explore the impact of selecting spectrally matched ground motion records on seismic performance assessment, using diverse structural models for comprehensive analysis. Nonlinear dynamic analysis demonstrates that additional spectral matching constraints can effectively control seismic displacement demands. The research emphasizes the crucial role of strategic ground motion selection in enhancing the accuracy of seismic performance predictions for buildings. Demir et al. [6] analyzed the impact of various ground motion (GM) selection strategies, which include different levels of constraints, on the seismic responses of buildings. Six three-dimensional buildings and three soil classes were used to conduct bi-directional nonlinear dynamic analyses, measuring maximum global and inter-story drift ratios. The effectiveness of these strategies was assessed by examining the mean and dispersion of these seismic demands, utilizing analysis of variance for differences among them.
Previous investigations, including those by Ji et al. [7], Yun and Han [8], and Nguyen et al. [9], have explored potential liquefaction risks and the dynamic responses of infrastructure under seismic influence. Therefore, a discernible void persists in the seismic risk assessment of railway facilities, which are crucial components of public infrastructure. International research on the seismic fragility of critical railway infrastructure, such as earthworks, tunnels, and bridges, underscores the significance of such studies in determining damage extents and enhancing infrastructural safety during seismic events.
Despite their integral role in urban transport systems, studies on the seismic fragility of underground stations are notably scant in comparison to other railway infrastructures. Underground stations, with their unique structural characteristics, necessitate dedicated research efforts for the accurate prediction of seismic impacts on station interiors and adjacent constructions. This necessitates comprehensive analyses incorporating integrated soil dynamics and structural modeling across varied scenarios [10].
Historically, research has delved into the seismic fragility of subterranean structures, with functions developed based on the depth of burial and the utilization of seismic wave data from near and far-field earthquakes [11]. However, a glaring gap remains in the provision of a fragility function that accounts for the seismic load characteristics pertinent to Korea, particularly utilizing cross-sections representative of Korean underground stations [12,13].
This study endeavors to bridge this gap by constructing a seismic fragility function for cut-and-cover underground station structures derived from the dynamic numerical analysis of cross-sections of Korean underground stations. The analyses encompass seismic loads ranging from 0.05 g to 0.4 g, aiming to produce a fragility function reflective of various damage levels. Furthermore, the study proposes seismic fragility functions for diverse variables, presents representative models suitable for each classification, and assesses their applicability through comparison with extant seismic fragility benchmarks. This contribution is anticipated to enhance the seismic preparedness of underground stations within the Korean Peninsula, thereby safeguarding public infrastructure against the inevitable challenges posed by earthquakes.
2. Development of Seismic Fragility Function
2.1. Numerical Analysis Method and Results
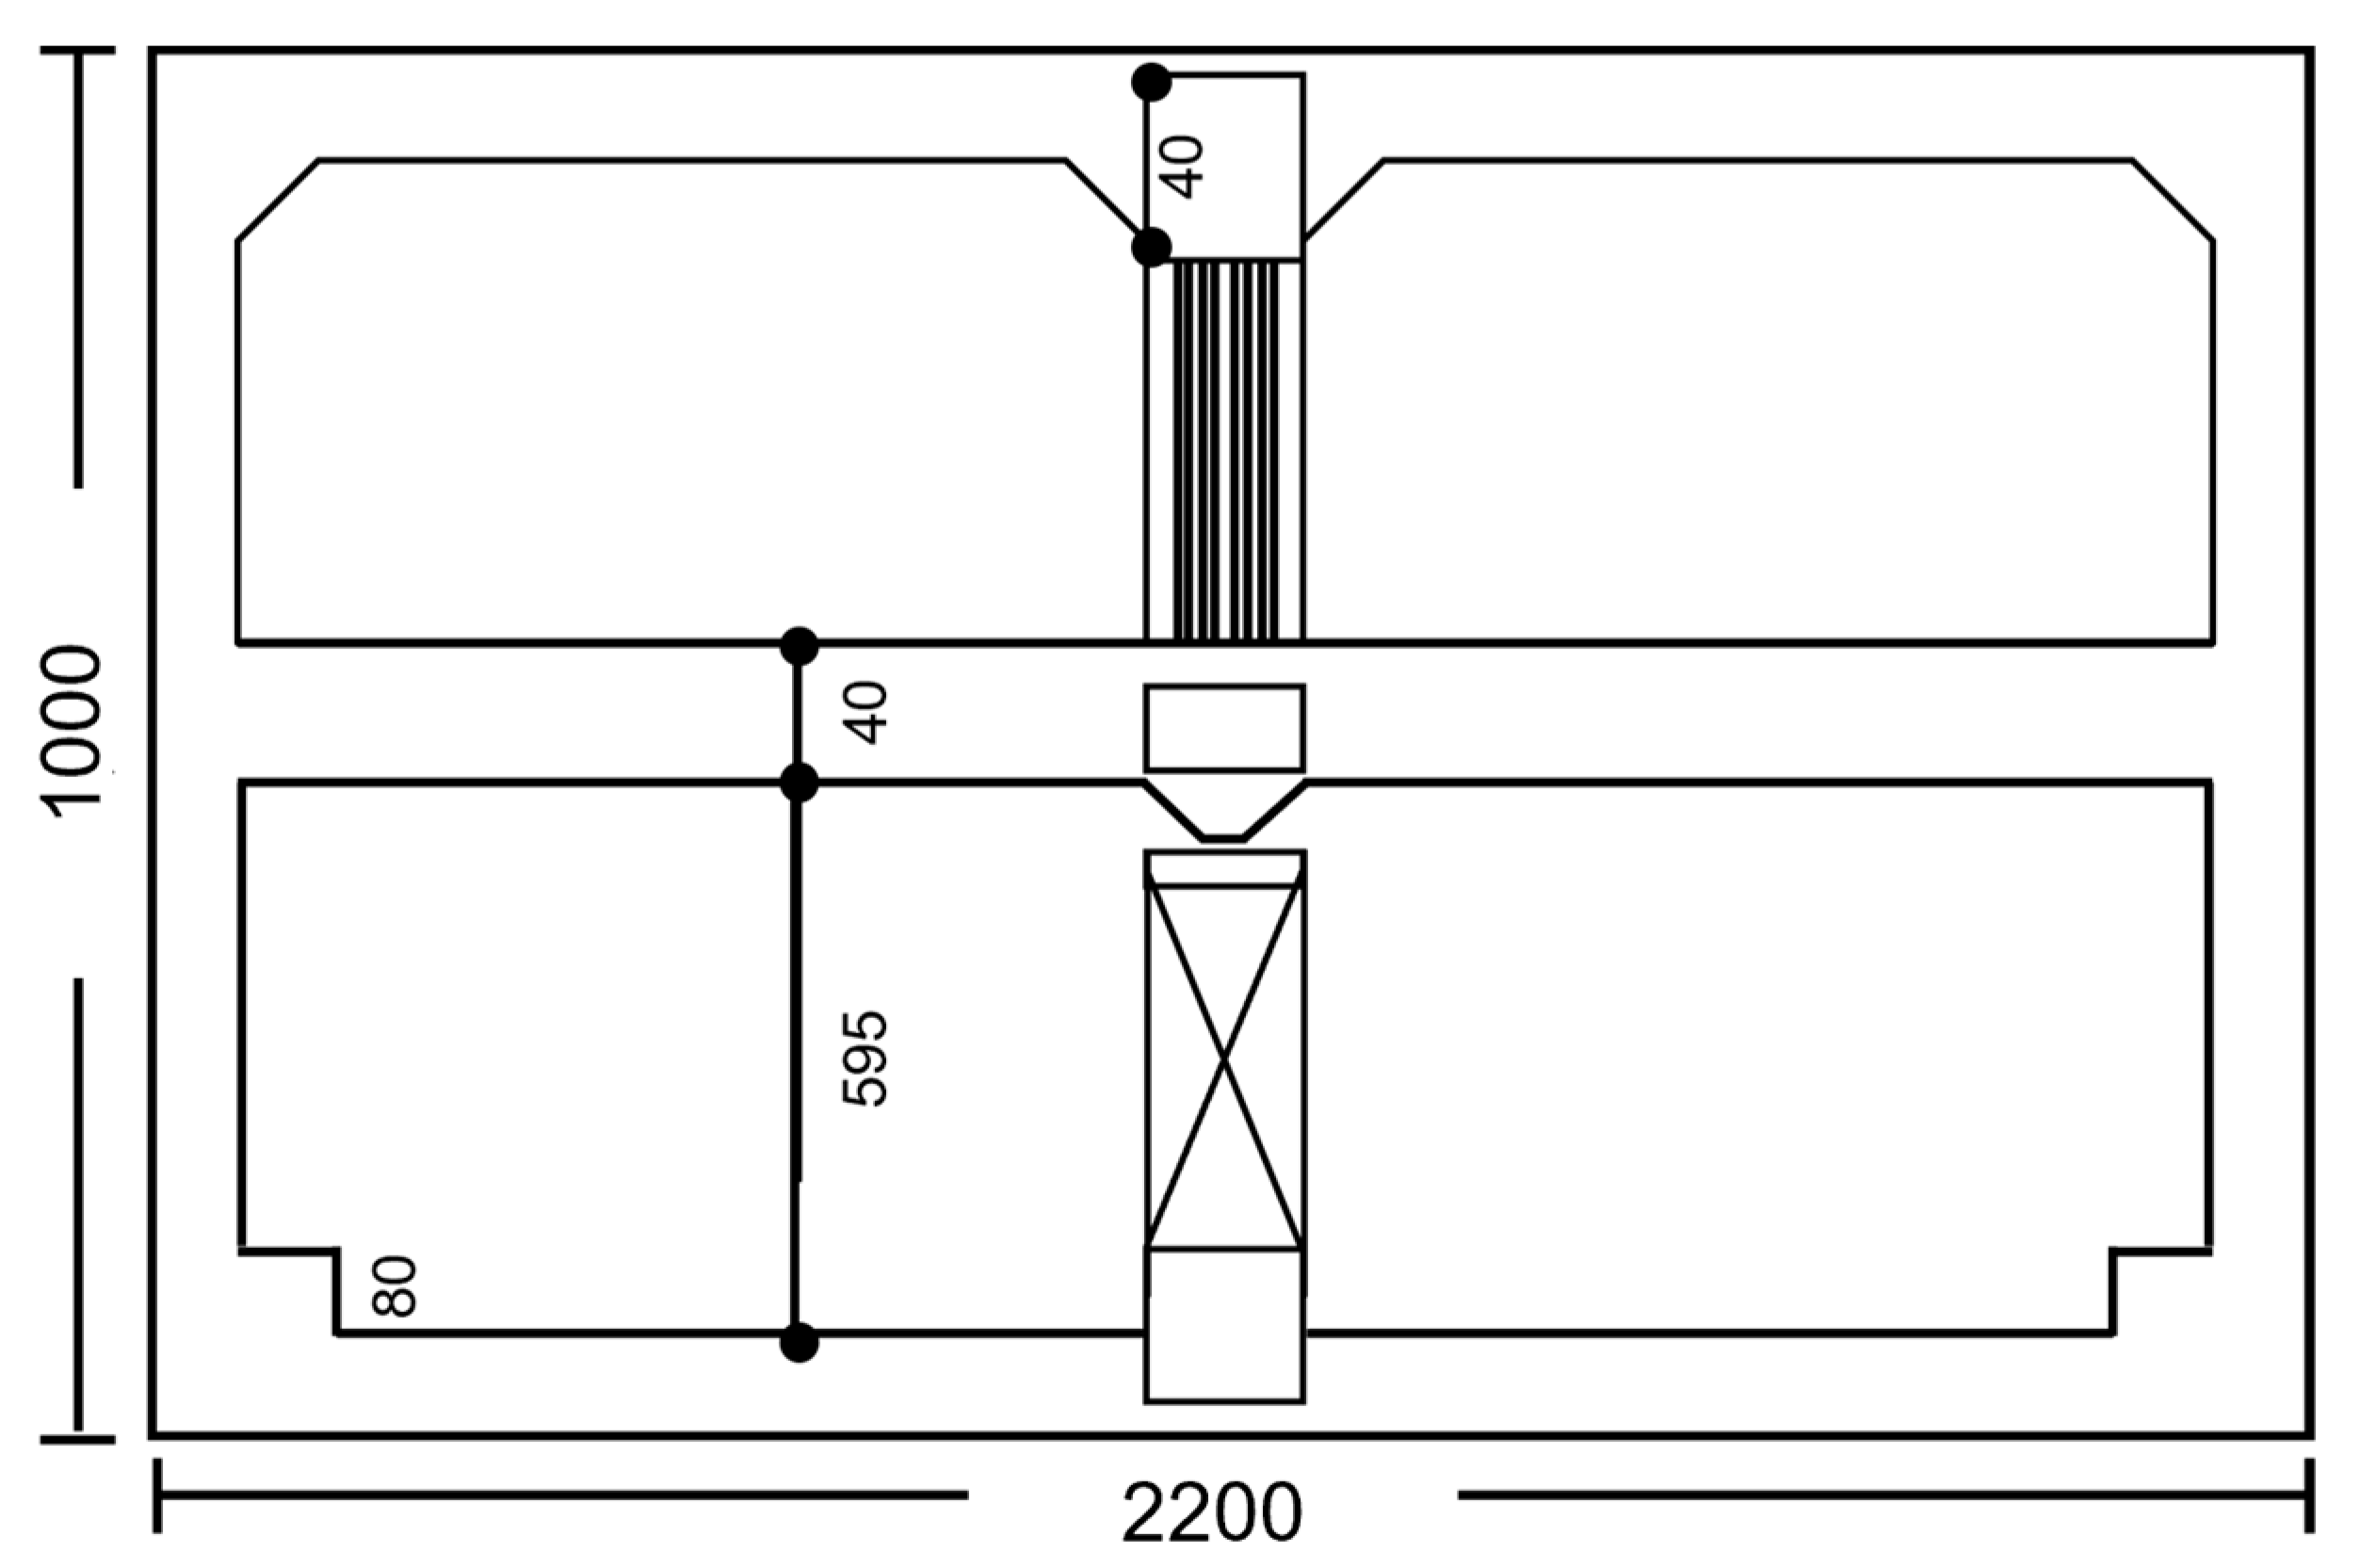
In this study, dynamic numerical analyses were conducted on cut-and-cover station structures, forming the basis for the development of the seismic fragility function using PLAXIS 2D, which is a commercial finite element analysis program. This study focused on an underground station in a particular region of Korea, using a two-dimensional numerical simulation to obtain the seismic response of the station. The target system was an underground station, which is a reinforced concrete structure consisting of two floors with a width of 22 m and a height of 10 m, as shown in Figure 1. After modeling the target system, parametric studies were designed and conducted with model parameters that can significantly influence the seismic behavior of the structure, such as soil conditions, depth of bedrock, depth to the top of the station, and earthquake intensity, resulting in a total of 110 analysis cases. Each model parameter has a significant role in the seismic behavior of underground station structures and can simulate almost all types of site conditions that may exist when the target structure is installed. Additionally, a large number of parametric studies can add reliability to later defining the fragility function of the target structure.
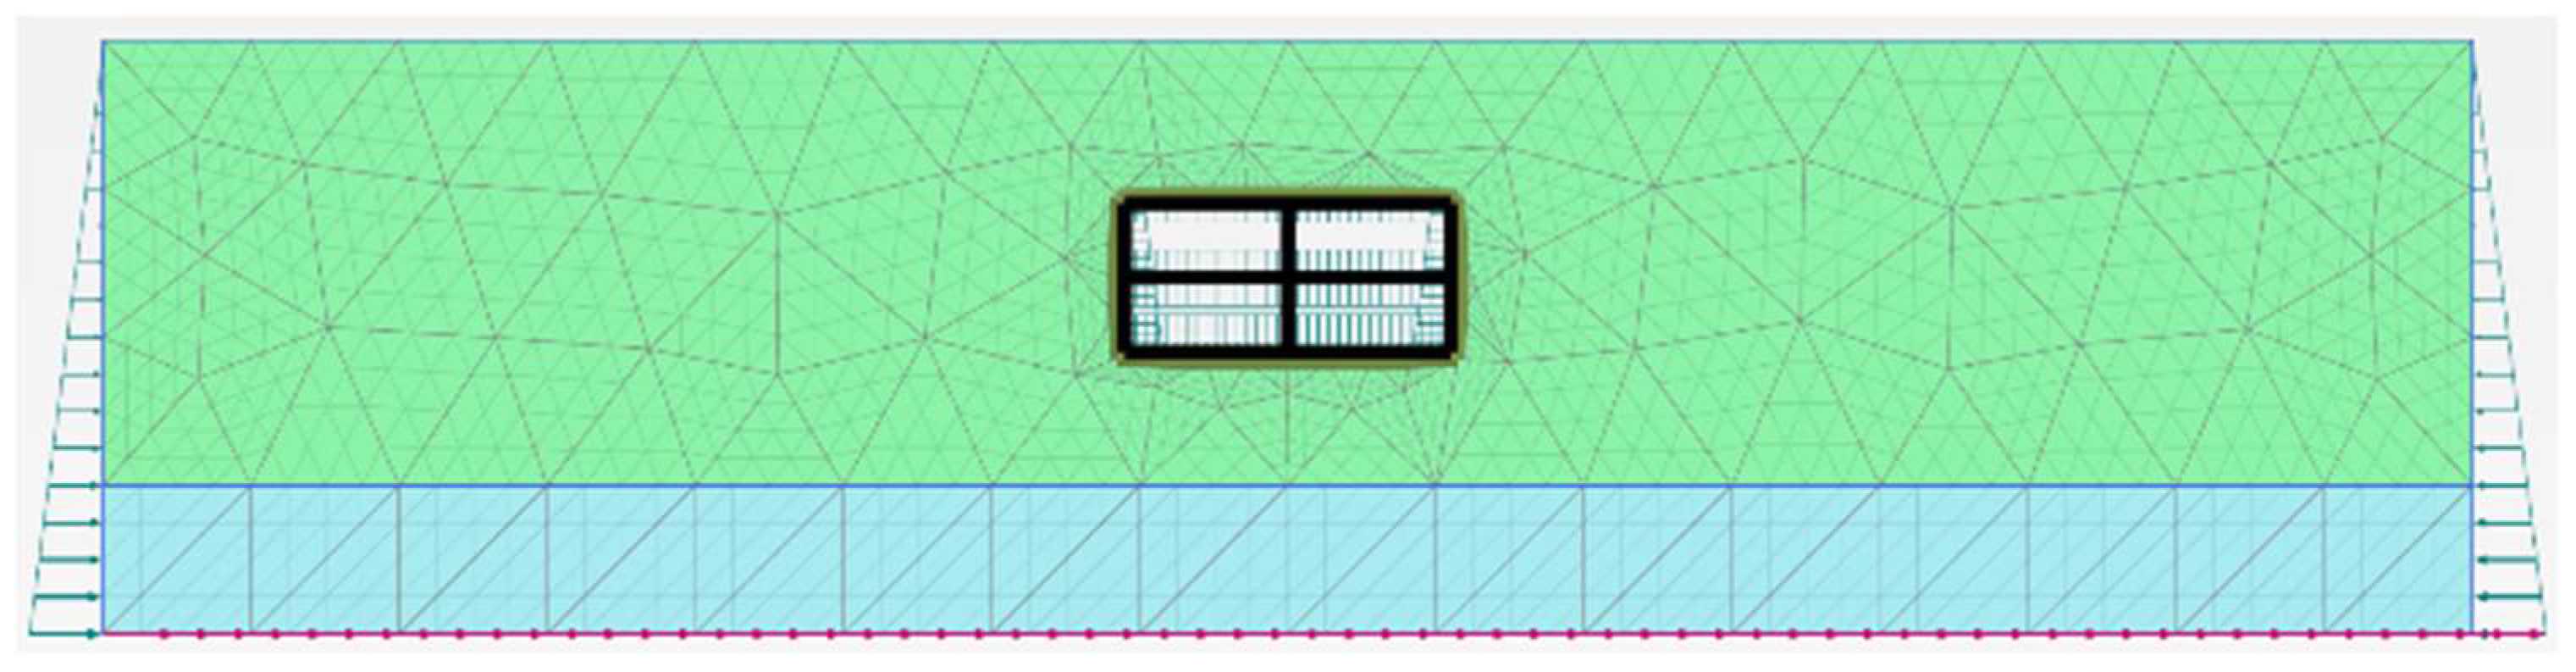
Table 1 presents the parameters for the analyzed cases, and the model cross-section of each analysis case is shown in Figure 2. Soil classification in Table 1 follows the Korean seismic design standards [14], categorizing soils as rock (S1), shallow and hard soil (S2), shallow and soft soil (S3), deep and hard soil (S4), and deep and soft soil (S5). The numerical approach in this study was based on two-dimensional plane conditions. For the soil constitutive model, the hardening soil model with small strain stiffness (HSSMALL), which is a built-in model of PLAXIS 2D, was utilized. This model allows for the simulation of the nonlinearity of shear modulus and damping ratio with increasing shear strain, considering the stress dependency of soil shear modulus and hysteretic damping [14]. The groundwater level is located 1 m below the ground surface, and detailed material properties for model soil and rock were summarized in Table 2 and Table 3. Figure 3 shows the representative modeling mesh of the target system (Case 6) used in this study to calculate the seismic response of the target underground station. The walls and slabs of the station structure were modeled using elastic plate elements, while the central columns were modeled as node-to-node anchor elements at 5 m intervals. To simulate dynamic interaction effects like stiffness degradation at the soil–structure interface during an earthquake, interface elements were adopted between the plate and soil elements. Representative material properties for station structures are shown in Table 4.
The dynamic analysis was then performed based on two-dimensional general strain conditions, progressing through the following stages according to construction and loading phases: (1) static equilibrium of the soil medium, (2) construction of the underground station, and achieving static equilibrium of the entire system, and (3) conducting dynamic analysis.
The input seismic waves used for analysis were adjusted to match the design response spectrum from the NS direction recorded at the PHA2 station during the 2017 Pohang earthquake, considering the seismic characteristics of the Korean Peninsula. Additionally, the Hachinohe seismic wave, which has long-period characteristics, was used to analyze the impact of the input period of the seismic waves. Seismic accelerations ranging from 0.05 g to 0.4 g were used as input seismic waves and applied to the base of each analysis model. The acceleration time histories of each seismic motion used in this study are shown in Figure 4.
2.2. Analysis Results
The damage index for the station facilities was calculated by comparing the moments obtained from dynamic numerical analysis with the permissible bending moments of the structure. The damage states of the underground station structure can be classified into three categories: minor state, moderate state, and extensive state, with corresponding damage index values, as shown in Table 4. Based on the numerical analysis results [16], the damage states corresponding to each damage index for the various cases were derived and are presented in Table 5. The analysis of the damage states in this study revealed that deeper structures and softer soils are more likely to experience severe damage. Additionally, it was found that the Hachinohe earthquake, being a long-period seismic wave, has a higher likelihood of causing moderate or extensive damage compared to the Pohang earthquake.
2.3. Development Procedure of Seismic Fragility Function
A seismic fragility function is a function that represents the likelihood of damage or destruction of structures during an earthquake in probabilistic terms. Seismic fragility functions are developed by considering factors such as earthquake intensity, structural characteristics, and soil conditions and are mainly used in fields like seismic risk assessment and structural safety evaluation. Methods for calculating damage probability include a numerical method, which calculates the probability of damage with increasing intensity of input seismic waves through analytical modeling [17], and a method that calculates the degree of structural damage based on past earthquake damage cases and recorded intensities [18]. In this study, a seismic fragility function was developed using a numerical method based on prior research, and the procedure for developing a fragility function using this method is as follows:
- (1)
- Determining the peak ground acceleration for the input seismic waves;
- (2)
- Conducting numerical modeling and dynamic time history analysis;
- (3)
- Defining damage states and damage index;
- (4)
- Calculating the required moment acting on the tunnel;
- (5)
- Calculating the mean and standard deviation based on analysis results;
- (6)
- Deriving the fragility curve.
This procedure is used in the model developed through numerical analysis. Figure 5 outlines the development procedure of the fragility model developed through numerical analysis. The seismic fragility function used in this study is defined as a log-normal distribution function of peak ground acceleration-probability of exceedance, as shown in Equation (1).
Where P[DS│IM = X] is the probability of exceeding a damaged state (DS > ds) at a given intensity measure (IM), Φ(∙) is the cumulative distribution function, X is the ground motion intensity, μ is the mean of lnX, and β is the standard deviation of lnX. The standard deviation, as shown in Equation (2), was calculated considering the uncertainty of both the tunnel’s damage index according to the buried depth of structure and ground condition (βD) and the ground motion amplification (βM).
P[DS│IM = X] = Φ((lnX − μ)/β)
2.4. Suggested Seismic Fragility Function
Previous research [15] has presented seismic fragility values for representative cross-sections of domestic underground stations and seismic according to domestic seismic design standards based on dynamic numerical analysis results [19]. This study proposes a seismic fragility function for the representative cross-sections of domestic underground stations, grounded on the seismic fragility values derived from the results of prior research. The seismic fragility function is expressed as a function of the probability of exceeding each damage state relative to the peak ground acceleration (PGA). To this end, the maximum ground acceleration values were first calculated based on each soil condition and input earthquake load condition. Typically, dynamic analysis involves calculating the acceleration-time history of the surface seismic response and using the maximum value of this acceleration-time history to determine the maximum ground acceleration. However, this study utilized results from the existing literature, which poses a limitation in verifying the maximum ground acceleration time history values derived from actual numerical analysis. Additionally, the existing analysis aimed to evaluate the dynamic behavior of structures according to domestic ground classification, featuring analysis sections typically configured in accordance with the domestic seismic design standard ground classification. By utilizing the magnitude of input bedrock acceleration for each recurrence period and the short-period amplification factor according to ground classification, the maximum ground acceleration was derived, where the short-period amplification factor values were taken from the domestic seismic design standards. After calculating the maximum ground acceleration values for each analysis condition, the values associated with minor damage, moderate damage, and extensive damage were grouped, and the mean and standard deviation of the cumulative distribution function for each damage state were calculated as per the method outlined in Section 2.2.
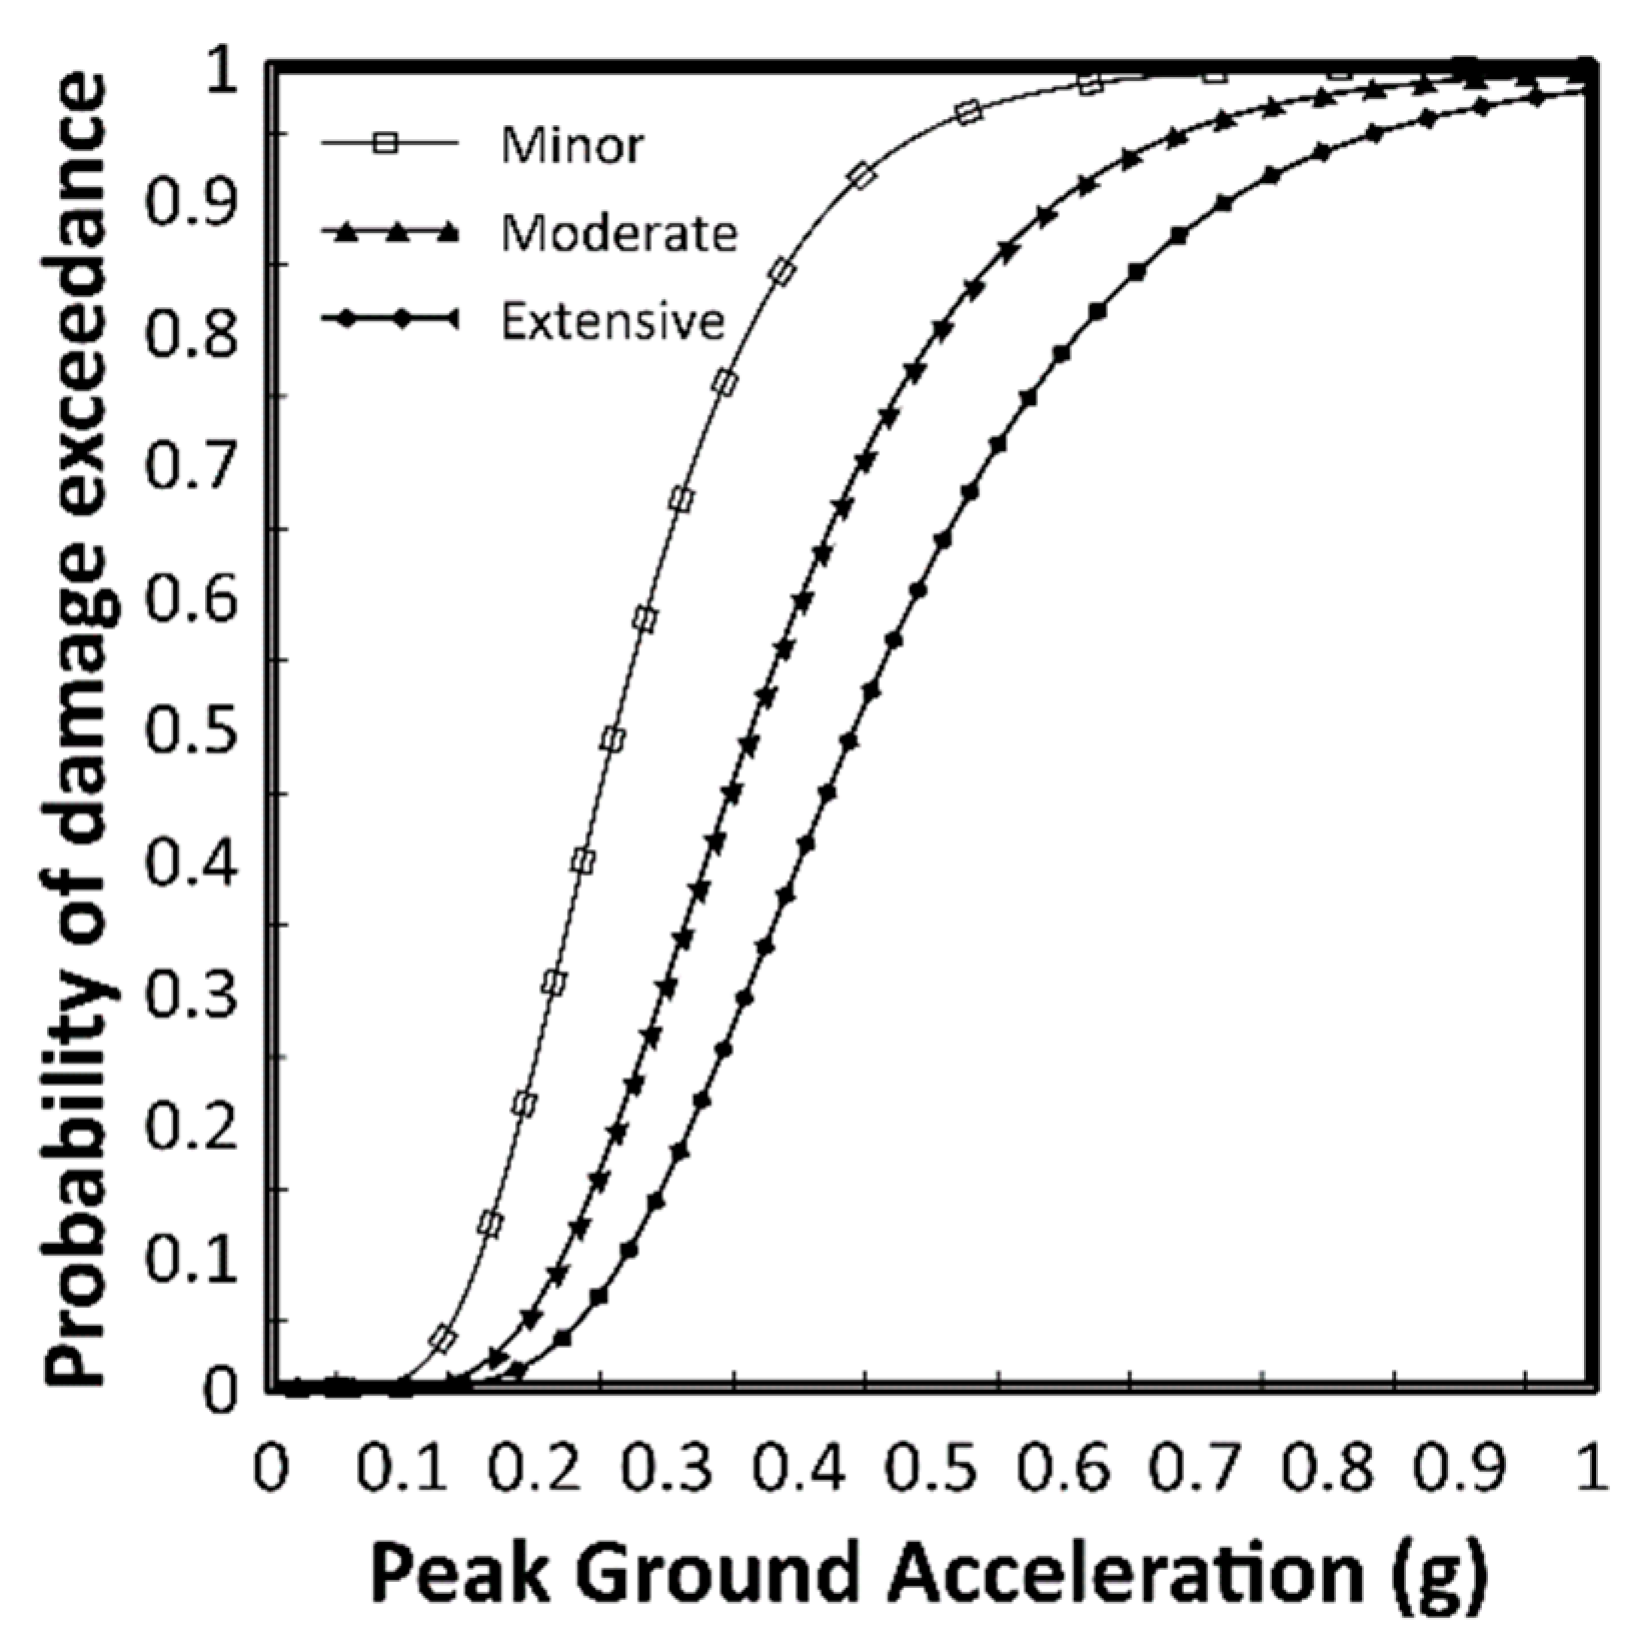
The derivation of the seismic fragility function was conducted by utilizing the entire data set and classifying the data according to ground condition and depth. First, the seismic fragility function derived using the entire data set is displayed in Table 6. In this case, as shown in Figure 6, the probability of exceeding 50% was surpassed at around 0.261 g for minor damage and at 0.364 g and 0.442 g for moderate and extensive damage, respectively.
For underground facilities, the seismic fragility significantly depends on the ground classification in which the facility is embedded. Therefore, seismic fragility functions according to ground classification were derived and shown in Table 7 and Figure 7. However, only minor and moderate damages occurred in the S2, S3, and S4 ground types, and no minor damage occurred in the S5 ground. Analysis results regarding ground depth indicated that as the ground condition becomes deeper and softer, the probability of the same damage state occurring increases with an earthquake. Nonetheless, for S2 and S3 ground types, it is anticipated that minor damage could occur for underground facilities embedded under these conditions even if an earthquake of more than 0.22 g occurs, suggesting that the mean value for minor damage might be lower than actual due to the absence of analysis conditions.
Furthermore, research indicates that the seismic fragility function varies with the depth at which the underground structure is buried, leading to the derivation of seismic fragility functions according to the depth of burial, which are displayed in Table 8 and Figure 8. The criterion for the structure’s depth was based on the domestic seismic design standard for deep and shallow grounds, which is 20 m. For structures with a depth of less than 20 m, the probability of exceeding 50% for moderate damage occurred at around 0.327 g, but for structures with a depth of more than 20 m, it occurred at around 0.293 g. This suggests that as the depth of the structure’s burial increases, the seismic acceleration value at which the same level of damage probability exceeds 50% decreases, implying an increase in seismic fragility. The fragility function proposed in this study is limited by its reliance on only two seismic wave types: long and short-period waves. His approach is based on the convention of utilizing long/short-period waves within Korean seismic design standards. Additionally, the magnitudes of earthquakes considered are those specified by these standards for various recurrence intervals, including magnitudes slightly exceeding these reference points. The objective of this research is to develop a fragility function tailored to the conditions prevalent in Korea, which guided the methodology adopted in this study.
3. Evaluation of the Appropriateness of the Proposed Seismic Fragility Function
3.1. Existing Seismic Fragility Functions
To evaluate the appropriateness of the fragility function developed in this study, functions were proposed based on the soil classification and burial depth of the tunnel. The burial depth suggests that the greater the confining pressure acting on underground structures under the same seismic load, the less damage is expected to the structure [20,21]. To compare with the developed fragility function, existing models were analyzed according to each classification, and the development methods and fragility functions of the four considered seismic fragility models are as follows:
- -
- Model 1 [20]: The U.S. Federal Emergency Management Agency [20] provides earthquake damage loss estimation methodologies and seismic fragility functions for various structures. It was developed to estimate overall potential losses due to earthquakes, including methodologies for post-earthquake recovery and planning. Based on technical judgment and empirical data, it presents PGA-based fragility curves for cut-and-cover tunnels. The damage states used were minor damage, moderate damage, severe damage, and collapse, a total of four stages, focusing on the tunnel lining and entrances/exits.
- -
- Model 2 [21]: Yang and Kwak [21] presented a model that is a weighted combination of existing seismic fragility models for cut-and-cover railway tunnels and assessed its appropriateness. To develop the seismic fragility function empirically, the model was represented in a log-normal distribution based on peak ground acceleration. By linearly weighting and combining each independently developed model, the uncertainty of the model could be reduced. Equal linear weighting was assigned to all four models, and a new seismic fragility function was developed by determining the mean and standard deviation of the damage probability in relation to peak ground acceleration.
- -
- Model 3 [9]: Nguyen et al. [9] developed a seismic fragility function for cut-and-cover tunnels through nonlinear numerical analysis. This study focused on single, double, and triple box tunnels within underground systems. Following EC8, the study considered variations in average shear wave velocity and soil depth classified into soil types B, C, and D and selected 20 input accelerations to account for the uncertainty of ground motion. The burial depth of the tunnel was fixed at 7 m, and the index was defined as the ratio of the required moment to the bending moment in the tunnel lining. The fragility function analyzed is based on the peak ground acceleration at the surface. Damage states were classified into three stages: minor damage, moderate damage, and severe damage.
- -
- Model 4 [11]: Argyroudis and Pitilakis [11] developed a seismic fragility function through numerical analysis to construct fragility curves for shallow metro tunnels located in alluvial deposits, considering soil conditions and input ground motion characteristics. The form of the tunnels was divided into bored tunnels and cut-and-cover tunnels, and seismic fragility curves were developed according to soil conditions.
- -
- Model 5 [22]: Hu et al. [22] performed a two-dimensional dynamic numerical analysis using actual operational underground tunnels in Shanghai as a model. The study presented a seismic fragility model for circular tunnels at various burial depths, with modeled depths ranging from 10 m to 35 m. The damage index used in the research was defined as the ratio of the required moment to the bending moment, similar to Model 1, and the damage stages were also divided into three levels.
- -
- Model 6 [23]: Huang et al. [23] conducted numerical analyses on Shanghai metro tunnels, similar to Model 1, and then presented a seismic fragility model based on burial depth. While Model 5 analyzed twin circular tunnels, Model 6 conducted analyses on a single circular tunnel. The main assumptions regarding the tunnel specifications and soil properties were set similarly to Model 5, with the tunnel burial depth set between 9 m and 30 m. Although Model 5 and Model 6 analyze the same structures, there are differences in the selected tunnel length, chosen input seismic waves, selected soil profiles, and the criteria used for selecting damage indices. Based on the results of the numerical analysis, Model 6 also derived fragility curves based on peak ground acceleration (PGA) and peak ground velocity (PGV). Damage states were categorized into three levels: minor damage, moderate damage, and severe damage.
3.2. Weighted Combined Model of Representative Seismic Fragility Function
If the correlation among models is low, a weighted combination of models can be used to derive an optimized model with reduced uncertainty [24]. The six models considered in this study differ in their development methods, burial depths, and ground types. These models were classified into three groups: (1) all conditions, (2) buried depth, and (3) soil type. Additionally, the existing literature has the characteristic of using relatively diverse input seismic waves compared to this study. In the study, the fragility function proposed using seismic waves that correspond to the Korean seismic design code was used, which may result in differences from the existing fragility function. For the first group, all conditions, each of Models 1 through 6, were assigned a weight of 16.66%. For models distinguished by burial depth (Model 1, Model 2, Model 3, and Model 4), the allocated 16.66% was further divided according to the number of sub-models. For instance, since Model 1 has four sub-models, each sub-model was given a weight of 4.165%. In the second group, classified by depth, the sub-models of Model 5 and Model 6 were divided into shallow (0–20 m) and deep (over 20 m), with Model 5 and Model 6 each receiving a weight of 50%. The third group, classified by soil type, assigned 50% each to Model 3 and Model 4, with equal weight given to each sub-model within the models’ weights. The conditions for each group, the composite models, the weight of each model, and the parameters of the composite models are summarized in Table 9.
The seismic fragility of underground facilities is greatly influenced by the type of soil in which the facility is buried. However, for soil, only minor damage was observed in one condition, so it was categorized together with S1 soil for presenting the seismic fragility function. It is assessed that as the soil conditions become deeper and softer, the probability of experiencing the same damage state with an earthquake increases. However, for S2 and S3 soil types, it is expected that even with earthquakes exceeding 0.22 g, only minor damage would occur to the buried underground facilities, suggesting that the absence of analysis conditions may have led to an underestimation of the mean value for minor damage.
Furthermore, research indicates that the seismic fragility function varies with the depth at which underground structures are buried. The criterion for structure depth followed the Korean seismic design standard’s differentiation between deep and shallow soil, set at 20 m. For structures less than 20 m deep, the probability of exceeding moderate damage was over 50% at approximately 0.609 g, while for structures deeper than 20 m, this probability exceeded 50% at around 0.768 g. This indicates that as the burial depth of the structure increases, the ground acceleration value at which there is a 50% probability of experiencing the same level of damage decreases, implying an increase in seismic fragility.
3.3. Evaluation of Applicability to Suggested Seismic Fragility Function
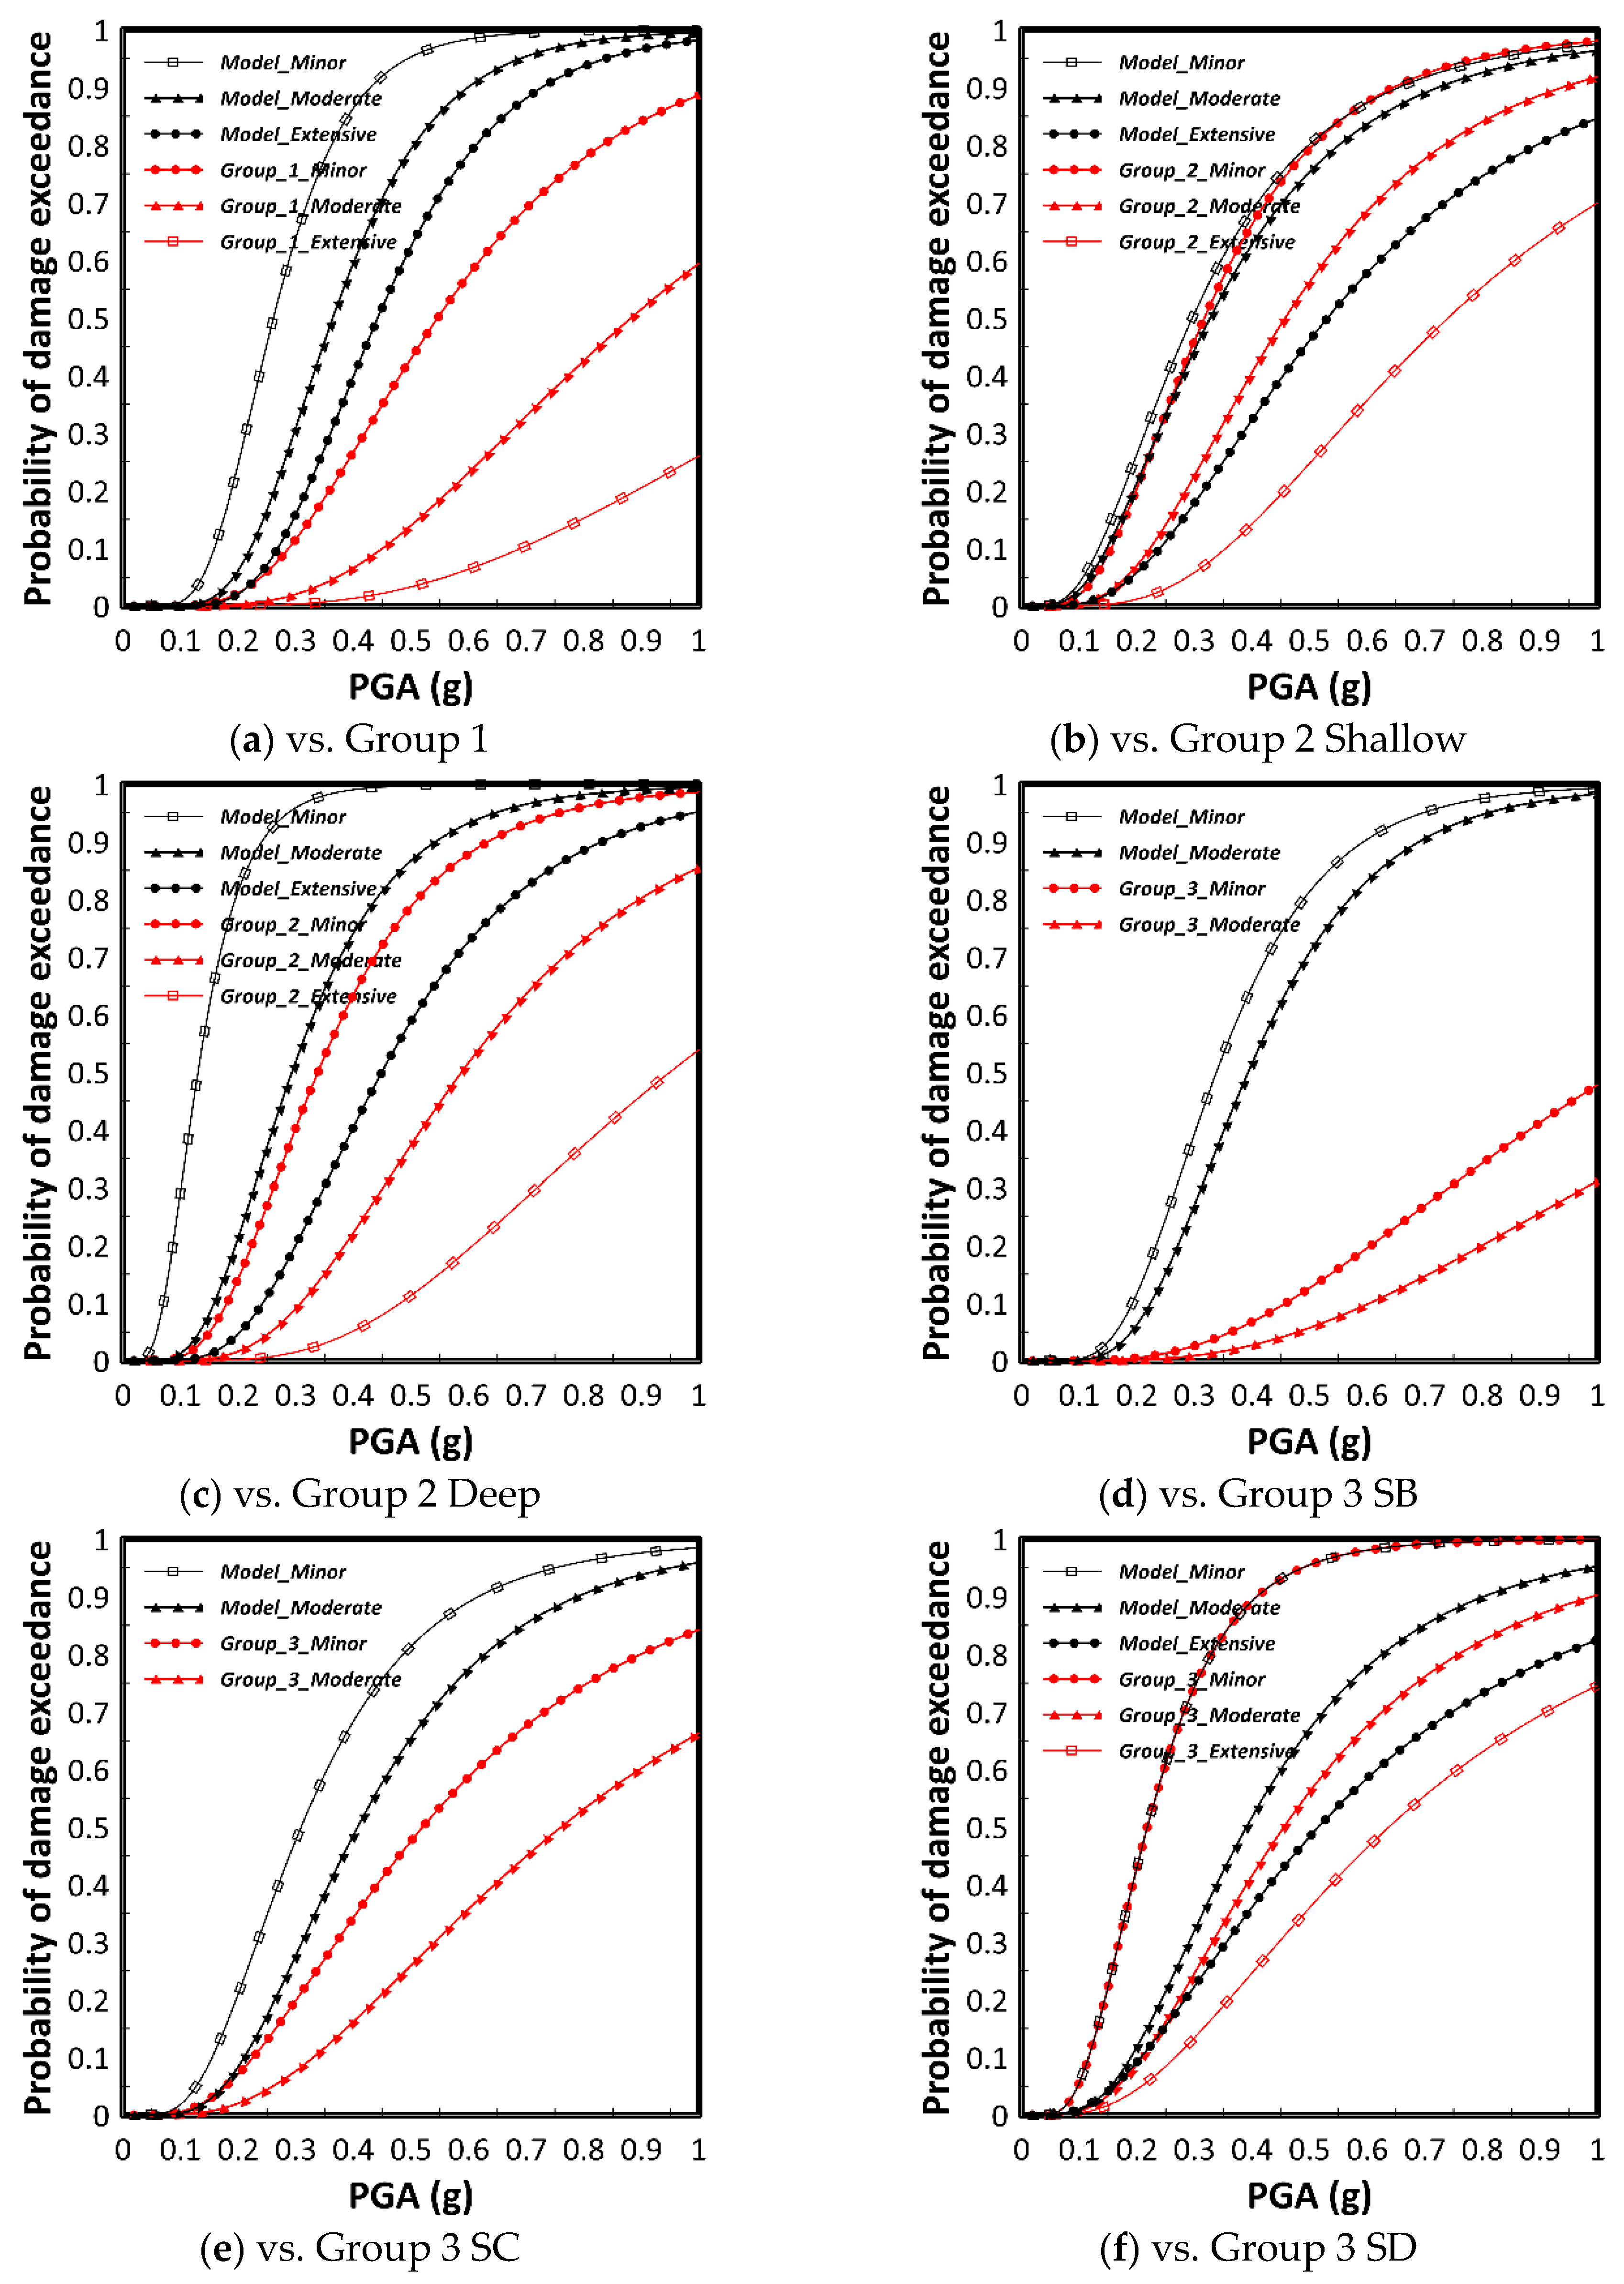
In order to evaluate applicability of suggested seismic fragility curve, suggested fragility function have been compared with weighted combined model by existing model.
In the case of Group 1, weighted combined was applied to Model 1 and Model 2, where Models 1 and 2 are fragility functions based on actual damage cases constructed before 2001, thus differing from numerical analysis-based fragility functions. As shown in Figure 9a, the fragility functions developed based on actual damage cases generally show more conservative results compared to those based on numerical analysis. For Group 2, for shallow depths (above 20 m), the existing literature’s weighted combined model and the proposed fragility model show similar trends (Figure 9b). However, at deep depths, the weighted combined model assesses fragility lower than the proposed fragility curve (Figure 9c). This is determined to be because the peak ground acceleration used in the development of the seismic fragility function in this study was limited, not fully reflecting the probability of exceedance for different damage states due to high levels of seismic acceleration. Group 3 proposed a seismic fragility function based on soil classification, which was compared with the function proposed in this study and illustrated in Figure 7. The results for the Korean soil classification of S2 of the modeled cross-section were classified as type S3 soil in international standards (Table 4). In the case of the Korean classification, VS30 soil was classified as type SC soil by international standards. The comparison with Model 3’s seismic fragility function showed that the proposed function for SD soil predicted higher seismic fragility than previous studies. This is attributed to differences in the design input earthquakes applied in the analysis. In this study, the size of the input seismic load was aligned with the Korean seismic design standard, and input earthquakes above 0.4 g were not used. However, in international cases, various earthquakes above 0.4 g were used as input for analysis, and it is expected that underground structures built on this classified soil would mostly sustain only minor damage even above 0.4 g, leading to the differences as shown in Figure 9d. For soil classification SD, up to approximately 0.3 g, the damage functions for minor and moderate damage appeared similar, but beyond that, the proposed seismic fragility function showed more risk-prone results (Figure 9f). This is attributed to the same reasons as with SC soil, where similar results occur up to the 0.3 g level where similar magnitudes of input seismic load were used, but differences arise beyond that due to a lack of data (Figure 9e). Additionally, one of the input seismic loads applied in this study was the Pohang seismic wave, which reflects the characteristics of Korean earthquakes. This wave has a higher short-period component compared to the seismic waves used in international analyses, potentially leading to a lower assessment of fragility. This study aimed to analyze the seismic fragility at the design input earthquake levels for Korean underground station cross-sections, which likely contributed to these differences. For further refinement of the results of this study, follow-up research should consider analyzing larger input earthquakes exceeding 0.4 g and long-period seismic waves to improve the fragility function.
4. Conclusions
This study focused on the critical gap in seismic risk assessment for railway facilities, including underground stations, which are integral to urban transport networks but have received less attention in seismic fragility research compared to other structures. Significant efforts have been made to assess and improve the seismic resilience of infrastructure, focusing on the dynamic behavior of structures like wharves and buildings under seismic loads. However, the unique characteristics and importance of underground stations demand specialized research to develop accurate seismic fragility functions that consider the specific conditions of the Korean Peninsula. Through dynamic numerical analysis of cut-and-cover underground station structures in Korea, this study has developed a seismic fragility function that accounts for varying seismic loads and soil conditions. The analysis covered a wide range of parameters, including soil type, depth of bedrock, and earthquake intensity, to ensure a comprehensive understanding of the seismic response of underground stations.
The developed seismic fragility function provides a probabilistic assessment of damage likelihood under different earthquake intensities. The study emphasizes the importance of considering local seismic activity and soil characteristics in the development of seismic fragility functions, as demonstrated by the specific focus on Korean underground station cross-sections. Comparisons with existing seismic fragility models reveal that the proposed function aligns with the observed trends but also suggests areas for further refinement, especially concerning the impact of soil conditions and depth of structure on seismic fragility. The study advocates for ongoing research to refine these models, considering a broader range of seismic intensities and the specific characteristics of Korean earthquakes.
In Korea, the design seismic load is determined based on the return period of earthquakes, with a range from 0.05 g to 0.3 g. This study focuses on the earthquake acceleration specified in the Korean seismic design code and slightly above it. The fragility function proposed in this study is limited by its use of only two seismic wave periods, long and short. This limitation stems from the application of long/short periods in Korean seismic design standards.
The primary aim of this research is to propose a fragility function that is apt for conditions in Korea, contributing to the broader field of seismic risk assessment by offering a tailored approach to evaluating the seismic fragility of underground stations in the country. It highlights the importance of incorporating advanced numerical analysis and localized research to improve the resilience of critical urban infrastructure against seismic threats, thereby ensuring the safety and reliability of public transportation systems in earthquake-prone areas. Future studies include conducting further seismic analyses to derive a more global fragility function, with the intention of using more seismic waves in subsequent studies.
Author Contributions
Conceptualization, M.Y. and D.K.; Methodology, S.Y.K. and S.Y.; Software, S.Y.K. and S.Y.; Visualization, J.K. and S.Y.; Writing—original draft preparation, S.Y.K., S.Y. and J.K.; Writing—review and editing, M.Y and D.K.; Supervision, M.Y. and D.K.; Revision, J.K. and S.Y. All authors have read and agreed to the published version of the manuscript.
Funding
This research was supported by the research work “Review of Environmental Impact Assessment”(RE2024-16) funded by Korea Environment Institute (KEI) and the Korea Agency for Infrastructure Technology Advancement (KAIA) grant funded by the Ministry of Land, Infrastructure and Transport (Grant No. RS-2023-00238458) and KICT Research Program (project no. 20240104-001, Database construction for ground liquefaction assessment based on AI technology) funded by the Ministry of Science and ICT.
Data Availability Statement
Data are contained within the article.
Conflicts of Interest
The authors declare no conflicts of interest.
References
- Ma, C.; Li, K.; Lu, D.; Li, X.; Liu, Z.; Du, X. Seismic fragility analysis of underground structures subjected to bi-directional ground motions based on the damage weight coefficients of components. Soil Dyn. Earthq. Eng. 2024, 178, 108437. [Google Scholar] [CrossRef]
- Andreotti, G.; Lai, C.G. Use of fragility curves to assess the seismic vulnerability in the risk analysis of mountain tunnels. Tunn. Undergr. Space Technol. 2019, 91, 103008. [Google Scholar] [CrossRef]
- Nielson, B.G.; DesRoches, R. Seismic fragility methodology for highway bridges using a component level approach. Earthq. Eng. Struct. Dyn. 2007, 36, 823–839. [Google Scholar] [CrossRef]
- Yang, S.; Kwak, D. Evaluation of seismic fragility models for cut-and-cover railway tunnels. J. Korean Tunn. Undergr. Space Assoc. 2022, 24, 1–13. [Google Scholar]
- Demir, A.; Palanci, M.; Kayhan, A.H. Probabilistic assessment for spectrally matched real ground motion records on distinct soil profiles by simulation of SDOF systems. Earthq. Struct. 2021, 21, 395–411. [Google Scholar]
- Demir, A.; Kayhan, A.H.; Palanci, M. Response- and probability-based evaluation of spectrally matched ground motion selection strategies for bi-directional dynamic analysis of low- to mid-rise RC buildings. Structures 2023, 58, 105533. [Google Scholar] [CrossRef]
- Ji, Y.; Kim, B.; Kim, K. Evaluation of liquefaction potentials based on shear wave velocities in Pohang City, South Korea. Int. J. Geo-Eng. 2021, 12, 1–10. [Google Scholar] [CrossRef]
- Yun, J.W.; Han, J.T. Dynamic behavior of pile-supported wharves by slope failure during earthquake via centrifuge tests. Int. J. Geo-Eng. 2021, 12, 33. [Google Scholar] [CrossRef]
- Nguyen, D.D.; Park, D.; Shamsher, S.; Nguyen, V.Q.; Lee, T.H. Seismic vulnerability assessment of rectangular cut-and-cover subway tunnels. Tunn. Undergr. Space Technol. 2019, 86, 247–261. [Google Scholar] [CrossRef]
- Choi, E.; DesRoches, R.; Nielson, B. Seismic fragility of typical bridges in moderate seismic zones. Eng. Struct. 2004, 26, 187–199. [Google Scholar] [CrossRef]
- Argyroudis, S.A.; Pitilakis, K.D. Seismic fragility curves of shallow tunnels in alluvial deposits. Soil Dyn. Earthq. Eng. 2012, 35, 1–12. [Google Scholar] [CrossRef]
- Xiao, Y.; Yue, F.; Zhang, X.A. Seismic fragility analysis of structures based on adaptive gaussian process regression metamodel. Shock Vib. 2021, 2021, 7622130. [Google Scholar] [CrossRef]
- Tran, D.T.; Cho, Y.; Seo, H.; Kim, B. Seismic fragility assessments of fill slopes in South Korea using finite element simulations. Geomech. Eng. 2023, 34, 341–380. [Google Scholar]
- Ministry of Land, Infrastructure and Transport (MOLIT). General Seismic Design (KDS 17 10 00); Ministry of Land Infrastructure and Transport: Seul, Republic of Korea, 2018. (In Korean)
- Kwon, S.; Yoo, M.; Hong, S. Earthquake risk assessment of underground railway station by fragility analysis based on numerical simulation. Geomech. Eng. 2020, 21, 143–152. [Google Scholar]
- Lee, T.-H.; Park, D.; Nguyen, D.D. Damage analysis of cut-and-cover tunnel structures under seismic loading. Bull. Earthq. Eng. 2016, 14, 413–431. [Google Scholar] [CrossRef]
- Ghosh, S.; Ghosh, S.; Chakraborty, S. Seismic fragility analysis in the probabilistic performance-based earthquake engineering framework: An overview. Int. J. Adv. Eng. Sci. Appl. Math. 2021, 13, 122–135. [Google Scholar] [CrossRef]
- Straub, D.; Der Kiureghian, A. Improved seismic fragility modeling from empirical data. Struct. Saf. 2008, 30, 320–336. [Google Scholar] [CrossRef]
- Yang, S.; Kwak, D.; Kim, S.; Yoo, B.; Yoo, M. Evaluation and Development of Seismic Fragility Models for Cut-and-cover Underground Station. J. Korean Railw. Soc. 2024, 27, 202–212. [Google Scholar] [CrossRef]
- Federal Emergency Management Agency. HAZUS-MH Technical Manual, 7-1-24; Federal Emergency Management Agency: Washington, DC, USA, 2004.
- Yang, S.; Kwak, D. Evaluation of pre-developed seismic fragility models of bored tunnels. J. Korean Tunn. Undergr. Space Assoc. 2023, 25, 187–200. [Google Scholar]
- Hu, X.; Zhou, Z.; Chen, H.; Ren, Y. Seismic fragility analysis of tunnels with different buried depths in a soft soil. Sustainability 2020, 12, 892. [Google Scholar] [CrossRef]
- Huang, Z.K.; Pitilakis, K.; Tsinidis, G.; Argyroudis, S.; Zhang, D.M. Seismic vulnerability of circular tunnels in soft soil deposits: The case of Shanghai metropolitan system. Tunn. Undergr. Space Technol. 2020, 98, 10334. [Google Scholar] [CrossRef]
- Kwak, D.Y.; Seyhan, E.; Kishida, T. A method of linear combination of multiple models for epistemic uncertainty minimization. In Proceedings of the Eleventh US National Conference on Earthquake Engineering, Los Angeles, CA, USA, 25–29 June 2018; pp. 1–10. [Google Scholar]
Figure 1.
Cross-section of the underground railway station.

Figure 2.
Schematic view of the analysis cases [15].
Figure 2.
Schematic view of the analysis cases [15].

Figure 3.
Modeling mesh of target system (Case 6, Blue: Rock, Green: Soil).

Figure 4.
Time histories of input earthquake motion.

Figure 5.
Flowchart of the seismic fragility analysis procedure using numerical simulation.

Figure 6.
Seismic fragility curve for all conditions.

Figure 7.
Seismic fragility curve for soil type.

Figure 8.
Seismic fragility curve for buried depth.

Figure 9.
Fragility curve for comparison with model.


Table 1.
Summary of analysis case.
| Case Number | Soil Class (Korea) | Soil Class (USA) | Depth of Base Rock (m) | Depth of Railway Station (m) | VS of Soil (m/s) | VS30 (m/s) |
|---|---|---|---|---|---|---|
| 1 | S1 | SB | 0.8 | 1 | 360 | 983 |
| 2 | S2 | SC | 16 | 1 | 360 | 659 |
| 3 | S2 | SC | 16 | 6 | 360 | 659 |
| 4 | S3 | SC | 16 | 1 | 150 | 547 |
| 5 | S3 | SC | 16 | 6 | 150 | 547 |
| 6 | S4 | SD | 30 | 11 | 360 | 360 |
| 7 | S4 | SD | 30 | 15 | 360 | 360 |
| 8 | S4 | SD | 30 | 21 | 360 | 360 |
| 9 | S5 | SE | 30 | 11 | 150 | 150 |
| 10 | S5 | SE | 30 | 15 | 150 | 150 |
| 11 | S5 | SE | 30 | 21 | 150 | 150 |
Table 2.
Material properties of the soil layer.
| Parameters | Soil (Vs = 150 m/s) | Soil (Vs = 360 m/s) |
|---|---|---|
| Void ratio | 0.95 | 0.25 |
| Poisson’s ratio | 0.2 | 0.3 |
| Dry density () | 19 | 22 |
| Friction angle (°) | 24 | 40 |
| Cohesion () | 10 | 10 |
Table 3.
Material properties of base rock.
| Unit | Value |
|---|---|
| Unit weight () | 23 |
| Elastic modulus () | 3,600,000 |
| Friction angle (°) | 42 |
| Cohesion () | 300 |
Table 4.
Material properties of station structure.
| Case 1 | Case 2 | Case 3 | Case 4 | Case 5 | Case 6 | Case 7 | Case 8 | Case 9 | Case 10 | Case 11 | ||
|---|---|---|---|---|---|---|---|---|---|---|---|---|
| Pohang | 0.05 g | None | None | None | None | Minor | None | Minor | Minor | Minor | Moderate | Moderate |
| 0.1 g | None | None | None | None | Minor | None | Minor | Minor | Moderate | Moderate | Moderate | |
| 0.2 g | None | None | None | Minor | Minor | Minor | Minor | Moderate | Moderate | Moderate | Extensive | |
| 0.3 g | None | None | Minor | Minor | Moderate | Minor | Moderate | Moderate | Moderate | Extensive | Extensive | |
| 0.4 g | None | None | Minor | Moderate | Moderate | Minor | Moderate | Moderate | Extensive | Extensive | Extensive | |
| Hachinohe | 0.05 g | None | None | None | None | Minor | None | Minor | Minor | Moderate | Moderate | Moderate |
| 0.1 g | None | None | None | None | Minor | Minor | Minor | Moderate | Moderate | Moderate | Extensive | |
| 0.2 g | None | None | Minor | Minor | Moderate | Minor | Moderate | Moderate | Moderate | Extensive | Extensive | |
| 0.3 g | None | None | Moderate | Minor | Moderate | Moderate | Moderate | Moderate | Extensive | Extensive | Extensive | |
| 0.4 g | Minor | Minor | Moderate | Minor | Moderate | Moderate | Extensive | Extensive | Extensive | Extensive | Extensive | |
Table 5.
Definition of damage states and corresponding damage index [15].
Table 5.
Definition of damage states and corresponding damage index [15].
| Damage State | Damage Index |
|---|---|
| Minor | 1.0 ≤ DI < 1.2 |
| Moderate | 1.2 ≤ DI < 2.0 |
| Extensive | 2.0 ≤ DI |
Table 6.
Fragility function parameters from the model.
| Damage State | Median (μ) | Standard Deviation (β) |
|---|---|---|
| Minor | 0.261 | 0.388 |
| Moderate | 0.364 | |
| Extensive | 0.442 |
Table 7.
Fragility function according to soil type.
| Soil Type | Damage State | Median (μ) | Standard Deviation (β) |
|---|---|---|---|
| Soil Type 2 | Minor | 0.367 | 0.389 |
| Moderate | 0.379 | ||
| Soil Type 3 | Minor | 0.309 | 0.527 |
| Moderate | 0.407 | ||
| Soil Type 4 | Minor | 0.208 | 0.467 |
| Moderate | 0.415 | ||
| Soil Type 5 | Moderate | 0.198 | 0.585 |
| Extensive | 0.461 |
Table 8.
Fragility functions according to depth.
| Depth | Damage State | Median (μ) | Standard Deviation (β) |
|---|---|---|---|
| Shallow (0–20 m) | Minor | 0.296 | 0.619 |
| Moderate | 0.327 | ||
| Extensive | 0.531 | ||
| Deep (over 20 m) | Minor | 0.13 | 0.485 |
| Moderate | 0.293 | ||
| Extensive | 0.449 |
Table 9.
Description of model groups and weights assigned per model for each group.
| Group | Description | Damage State | Median | Standard Deviation | Weights | |||
|---|---|---|---|---|---|---|---|---|
| 1 | Combination of all models | Minor | 0.546 | 0.5 | Model 1 | 16.66% (4.165% per sub-model) | ||
| Moderate | 0.882 | 0.524 | Model 2 | 16.66% (5.5% per sub-model) | ||||
| Model 3 | 16.66% (4.165% per sub-model) | |||||||
| Model 4 | 16.66% | |||||||
| Model 5 | 16.66% | |||||||
| Extensive | 1.449 | 0.578 | Model 6 | 16.66% | ||||
| 2 | Different Buried Depth | Minor | 0.336 | 0.552 | 0–20 m | Model 5 | 50% | |
| Moderate | 0.609 | 0.552 | Model 6 | 50% | ||||
| Extensive | 1.061 | 0.552 | ||||||
| Minor | 0.419 | 0.579 | 20 m over | Model 5 | 50% | |||
| Moderate | 0.768 | 0.579 | Model 6 | 50% | ||||
| Extensive | 1.35 | 0.579 | ||||||
| 3 | Different Soil Type | SB | Minor | 1.035 | 0.635 | Model 3 | 50% (12.5% per sub-model) | |
| Moderate | 1.365 | 0.635 | Model 4 | 50% (16.7% per sub-model) | ||||
| SC | Minor | 0.52 | 0.65 | Model 3 | 50% (12.5% per sub-model) | |||
| Moderate | 0.76 | 0.65 | Model 4 | 50% (16.7% per sub-model) | ||||
| SD | Minor | 0.36 | 0.655 | Model 3 | 50% (12.5% per sub-model) | |||
| Moderate | 0.59 | 0.655 | ||||||
| Extensive | 0.82 | 0.655 | Model 4 | 50% (12.5% per sub-model) | ||||
Disclaimer/Publisher’s Note: The statements, opinions and data contained in all publications are solely those of the individual author(s) and contributor(s) and not of MDPI and/or the editor(s). MDPI and/or the editor(s) disclaim responsibility for any injury to people or property resulting from any ideas, methods, instructions or products referred to in the content. |
© 2024 by the authors. Licensee MDPI, Basel, Switzerland. This article is an open access article distributed under the terms and conditions of the Creative Commons Attribution (CC BY) license (https://creativecommons.org/licenses/by/4.0/).
Share and Cite
MDPI and ACS Style
Kwon, S.Y.; Kim, J.; Kwak, D.; Yang, S.; Yoo, M. Development of Seismic Fragility Function for Underground Railway Station Structures in Korea. Buildings 2024, 14, 1200. https://0-doi-org.brum.beds.ac.uk/10.3390/buildings14051200
AMA Style
Kwon SY, Kim J, Kwak D, Yang S, Yoo M. Development of Seismic Fragility Function for Underground Railway Station Structures in Korea. Buildings. 2024; 14(5):1200. https://0-doi-org.brum.beds.ac.uk/10.3390/buildings14051200
Chicago/Turabian StyleKwon, Sun Yong, Jongkwan Kim, Dongyoup Kwak, Seunghoon Yang, and Mintaek Yoo. 2024. "Development of Seismic Fragility Function for Underground Railway Station Structures in Korea" Buildings 14, no. 5: 1200. https://0-doi-org.brum.beds.ac.uk/10.3390/buildings14051200
Note that from the first issue of 2016, this journal uses article numbers instead of page numbers. See further details here.