
New Model and Finite Element Analysis of the Anti-Extrusion Strength of Backfill Drilling Pipelines

College of Civil and Resource Engineering, University of Science and Technology Beijing, Beijing 100083, China
*
Author to whom correspondence should be addressed.
Minerals 2024, 14(4), 365; https://0-doi-org.brum.beds.ac.uk/10.3390/min14040365
Submission received: 6 March 2024
/
Revised: 27 March 2024
/
Accepted: 27 March 2024
/
Published: 29 March 2024
(This article belongs to the Topic Mathematical Modeling and Numerical Simulation in Rock Mechanics and Mining Engineering)
Abstract
:Currently, in some domestic and foreign mines, the backfill drilling pipeline experiences a rupture phenomenon even when the wear degree is low. This results in a delay in production due to the filling becoming ‘sick’. This paper presents, for the first time, the damage mechanism from a mechanical perspective and re-derives the anti-extrusion strength model of the backfill drilling pipeline. We investigate the influence of the law on the anti-extrusion strength of pipelines from the perspective of strata and cement rings. We then verify the theoretical and simulation results through engineering examples. The results demonstrate that the Mises stress criterion is a suitable modification principle for the anti-extrusion strength model of the backfill drilling pipeline. The anti-extrusion strength of the pipeline is related to the elastic modulus and Poisson’s ratio of the stratum, and the thickness of the cement ring. It is negatively affected by the depth of the stratum. For hard strata, a cement ring with a smaller elastic modulus is suitable, while for soft stratum, a cement ring with a larger elastic modulus is recommended. When the missing angle of the cement ring is less than 60°, the stress concentration factor increases up to 2.2. The stress unloading capacity of the cement ring ranges from 32.7% to 37.8%, and optimal performance of the cement ring is achieved when it has high strength and low rigidity. The backfill filling pipeline of a copper mine abroad was destroyed due to external extrusion force exceeding its anti-extrusion strength value. The modified pipeline anti-extrusion strength model is 18.2% higher than the pipeline API strength value. This finding can inform the design of the backfill filling pipeline for China’s kilometer-deep wells in the future.
1. Introduction
Due to the gradual depletion of shallow mineral resources, deep mining has become an inevitable trend in the development of mineral resources in China [1,2]. Deep mining faces a unique mining environment characterized by high stress, high well temperature, and high well depth. The backfill mining method can effectively maintain the surrounding rock, reduce rock movement, and better control regional ground pressure. Therefore, it is an effective method for safely and efficiently mining deep mineral deposits [3,4,5]; the usual backfilling modes include dry backfill, cemented backfill, paste backfill, hydraulic backfill, and tailings backfill [6]. The backfill drilling pipeline is a critical component of the entire backfill system (as shown in Figure 1), acting as the ‘throat’ of the operation. Its safety is paramount as it directly impacts the smoothness of the filling process [7,8].
Current research on the damage caused by backfill drilling pipelines primarily focuses on pipeline wear [9,10,11,12]. Levy [13] conducted experimental research demonstrating that the shape and size of filler slurry particles have a significant impact on pipeline wear. Sharp and irregular particles cause four times more wear on pipelines than spherical particles. Creber et al. [14] found that the erosion rate increases with particle size. Qiao et al. [15] used Fluent software (version 2.1) to investigate the effect of roughness on pipeline erosion rate under mortar action. They found that pipeline structures had the highest erosion rate at a roughness of 0.3% under the same sand content and water flow conditions. Wang et al. [16] used a discrete phase model to simulate the flow of slurry in variable diameter bends. They found that the inlet and outlet pipe diameter ratio had the most severe impact on pipeline erosion. The wear condition of the variable diameter pipe fluctuated greatly with changes in pipeline factors when its length was below 80 mm.
Research on pipeline damage mostly exists in oil pipelines. According to Rodriguez et al. [17], the inner wall of the pipeline bears the greatest pressure, and its stress value is highly correlated with the Poisson’s ratio of the formation. The stress value of the pipeline increased by 66% when the Poisson’s ratio changed from 0.1 to 0.5. Medjo et al. [18] conducted experiments that demonstrate how cracks are caused by environmental factors. They found that the stress intensity factor at the crack tip increases with internal pressure, leading to crack propagation when it reaches a critical value. This confirms the effectiveness of fracture mechanics theory in predicting pipeline failure resistance. Liu [19] analyzed the damage to oil pipelines caused by formation creep pressure.
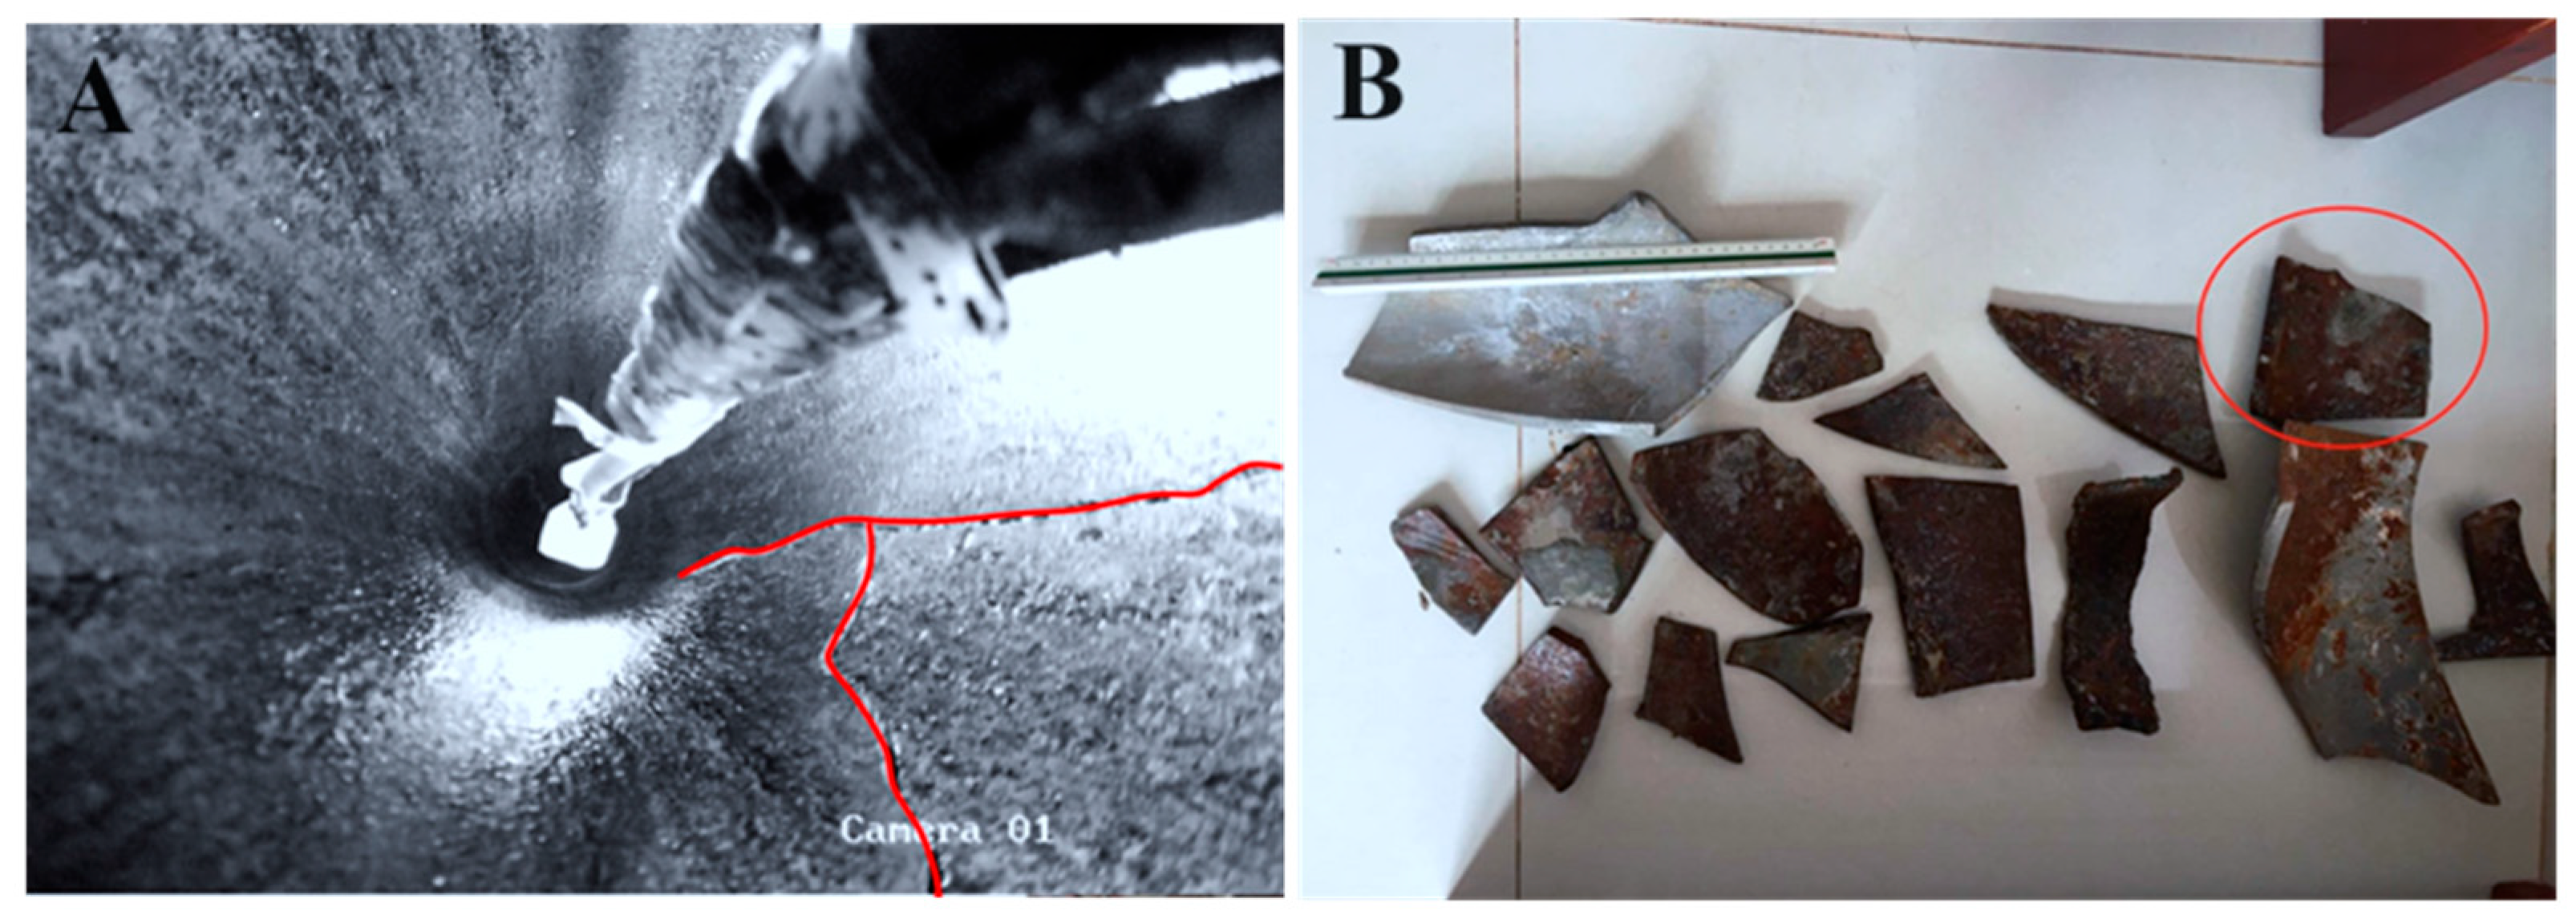
The research presented above suggests that there is limited information available on the damage caused by mining filling pipelines, and wear does indeed pose a threat to the safety of backfill drilling pipelines. Notably, fractures have been observed in the backfill drilling bimetallic composite pipes of a foreign copper mine within less than a year of production, as shown in Figure 2. It is worth noting that the drilling depth of the mine did not exceed 1000 m, and the degree of pipeline wear was very low. Although wear can reduce the wall thickness of a pipeline and accelerate the process of pipeline rupture, it is not the main factor that induces pipeline rupture. The stress state of the pipeline should also be considered, as even a pipeline with low wear can still rupture under a large load.
This article draws on research results from petroleum pipelines [20], tunnels, and other engineering projects [21,22,23,24]. It combines the basic principles of elastic mechanics and material mechanics to reveal their failure mechanisms from a mechanical perspective. This article derives the anti-extrusion strength model of the backfill drilling pipeline. This article also explores the influence of stratum and cement ring parameters on the anti-extrusion strength of backfill drilling pipelines through finite element analysis. The rationality of the theoretical model and finite element analysis is verified through engineering cases of backfill drilling pipeline damage in foreign mines. This finding can inform the design of the backfill filling pipeline for China’s kilometer-deep wells in the future.
2. Modification of the Mechanical Model for the Anti-Extrusion Strength of Backfill Drilling Pipelines
Steel pipes can fail in two ways: elastic instability failure and plastic yield failure. Elastic instability failure is more likely to occur when the diameter-to-thickness ratio is greater than 32, which is not typically the case for mine backfill drilling pipelines. This article focuses on correcting the anti-extrusion strength of backfill filling pipeline with regards to plastic yield failure.
2.1. API Yield Strength Model
The backfill drilling system is geometrically similar to engineering projects such as tunnel excavation and vertical shaft development [25]. However, tunnel excavation is mostly in the horizontal direction, and the size of the tunnel and vertical shaft is much larger than that of the backfill drilling. Generally speaking, the smaller the size, the more obvious the stress concentration at the excavation site. Therefore, there is a significant difference in the stress state between the backfill drilling system and the tunnel and vertical shaft.
Assuming that the pipeline conforms to the basic assumptions of elasticity, namely an ideal pipeline with uniform wall thickness, infinite length, and small deformation [26]. When the external extrusion force causes the stress generated on the pipeline to reach or exceed the yield strength limit of the pipeline, it is considered that the pipeline has begun to undergo plastic deformation, and the safety factor is relatively low. When the pipeline undergoes plastic deformation, the stress can be solved according to the Lame formula under uniform external load [27], that is:
When the circumferential stress on the inner wall of the pipeline is equal to or exceeds the minimum yield strength of the pipeline itself, it indicates that the pipeline has begun to yield and collapse. Using σ to denote the minimum yield strength value of the pipeline, (i.e., σ instead of σθ), the pipe yield strength model (i.e., the API model) can be expressed as follows when the pipe undergoes yield crushing:
In Equations (1) to (3) above, is the radial stress, is the circumferential stress, P is the anti-extrusion strength of the pipeline, r2 is the outer radius of the pipeline, r1 is the inner radius of the pipeline, r is the distance from any point on the pipeline wall to the pipeline axis, σ is yield strength of the pipeline, D is the outer diameter of the pipeline, and t is the wall thickness of the pipeline.
2.2. Modification of the Anti-Extrusion Strength of Backfill Drilling Pipelines
The backfill drilling system consists of the stratum, pipeline, and cementing ring between the stratum and pipeline, as shown in Figure 3.
In actual working conditions, the system is subjected to significant formation pressure σ, as shown in Figure 3. The shape of the tube in space also belongs to axisymmetric problems, so stress can be solved according to Formulas (1) and (2). Formula (3) represents the yield strength model of pipelines under ideal conditions. This model has been widely used for designing pipelines in various fields. However, only the circumferential stress of the pipeline , is utilized in this formula. The strength theory includes the first strength theory (maximum tensile stress criterion), the second strength theory (maximum elongation line strain criterion), the third strength theory (Tressa strength criterion), and the fourth strength theory (Mises’s strength criterion). To make a more reasonable judgment, the most commonly used failure criterion for metallic materials is the application of the fourth strength theory of material mechanics [28] (Mises’s stress criterion), as shown in Formula (4). If the equivalent Mises stress inside the pipeline exceeds the pipeline’s yield strength after being subjected to stratum pressure, it is considered a failure. The pipeline can ensure safety when ≤ .
In the Formula (4), is the equivalent Mises stress value, MPa; is the radial stress value, MPa; is the radial stress value, MPa; is the axial stress value, where , MPa; μ Poisson’s ratio for pipelines; and is the yield strength value of the pipeline, MPa.
Formula (2) shows that the maximum value of is on the inner wall of the pipeline, while the maximum value of is on the outer wall of the pipeline and is numerically significant. is greater than . Thus, the maximum effective stress occurs on the inner wall of the pipeline, causing it to reach the yield condition first with = 0. To obtain the revised yield extrusion strength model for the pipeline, substitute and into Formula (4) and organize accordingly:
In the Formula (5), is the anti-extrusion strength of the pipeline, MPa; r1 is the inner radius of the pipeline, mm; r2 is the outer radius of the pipeline, mm, μ Poisson’s ratio for pipelines; and is the yield strength value of the pipeline, MPa.
After production and processing, the backfill drilling pipeline is not an ideal round pipe. Factors such as pipeline non-roundness, uneven pipeline wall thickness, and residual stress must be considered in calculations to ensure pipeline safety. Scholars [29] have conducted extensive research on non-circularity, unevenness in wall thickness, and residual stress. The pipeline’s anti-extrusion strength test obtained a calculation model for the influence of out-of-roundness defects, uneven wall thickness defects, and residual stress on the pipeline’s anti-extrusion strength.
In the Formulas (6)–(8), is the anti-extrusion strength value considering the non-circularity of the pipeline, MPa; is the anti-extrusion strength value considering the non-uniformity of pipeline wall thickness, MPa; is the anti-extrusion strength value considering residual stress in the pipeline, MPa; e is the out of roundness of the pipeline, %; ε is the unevenness of pipeline wall thickness, %; and is the residual stress of the pipeline, MPa.
Taking into account the Mises stress intensity criterion and the out of roundness e and wall thickness unevenness of the pipeline ε, and the residual stress , the final revised anti-extrusion strength model of the backfill drilling pipeline is:
3. Finite Element Analysis of Backfill Drilling Pipelines
To investigate the influence of the actual environment on the strength of the mine backfill drilling pipelines, finite element analysis was carried out for the parameters of the stratum and the cement ring, and the damage state of the pipe can be judged by comparing the value of the Mises stress of the pipe and the yield strength, or by comparing the value of the external extrusion force of the pipe and the value of the pipe’s resistance to anti-extrusion strength.
3.1. Modeling Process
This study analyzes the idea through the establishment of a finite element model, the establishment of the contact surface between the pipe and the cement ring; through the extraction of the contact stress as the actual external extrusion force suffered by the pipeline; and through the comparison of the external extrusion force with the anti-extrusion strength of the pipeline and the pipeline’s mises stress value with the pipeline’s yield strength value, as a way to analyze the effect of the parameters of the cement ring and the stratum on the value of the pipeline’s resistance to anti-extrusion strength of the regularity.
The finite element analysis software adopted is ABAQUS (version 6.14-4). According to the Saint-Venant principle, the formation model size was selected to be about 10 times the diameter of the backfill drilling. Since it is a two-dimensional plane, this modeling adds uniform stress σ in both horizontal and vertical directions. The interaction properties of cement ring with the pipeline and stratum are established by “surface-surface contact” in the software. By using the neutral axis algorithm and according to the principle that the grid density increases gradually from outside to inside, the model is divided into grids. The pipeline is a bimetal composite pipe with Q235 on the outer layer and high chromium wear-resistant alloy steel on the inner layer. The material properties of the model are shown in Table 1.
Based on the analysis above, the force problem of the backfill system can be simplified as a plane strain problem. A contact surface is established between the pipeline, cement ring, and stratum. The external extrusion force of the pipeline is P1, and the external extrusion force of the cement ring is P2. Analysis of Mises stress () inside the pipelines was performed by changing formation and cement ring parameters. This study investigated the variation of the external squeezing force.
3.2. The Influence of Stratum Parameters on the Anti-Extrusion Strength of Pipelines
The selection of Stratum parameters includes the elastic modulus (Ed), Poisson’s ratio (μd), and ground stress () as variables. Due to the large number of factor level designs, it is not possible to comprehensively display stress nephograms at each level. However, upon comparison, it was found that the nephogram patterns at each level are similar. Therefore, only one stress nephogram is displayed for each factor as a reference. Among them, the stress distribution map obtained using the finite element analysis software ABAQUS becomes the stress nephogram. Polar coordinates are used to compare the stress distribution of each factor at each level.
3.2.1. Finite Element Analysis of Elastic Modulus of Strata
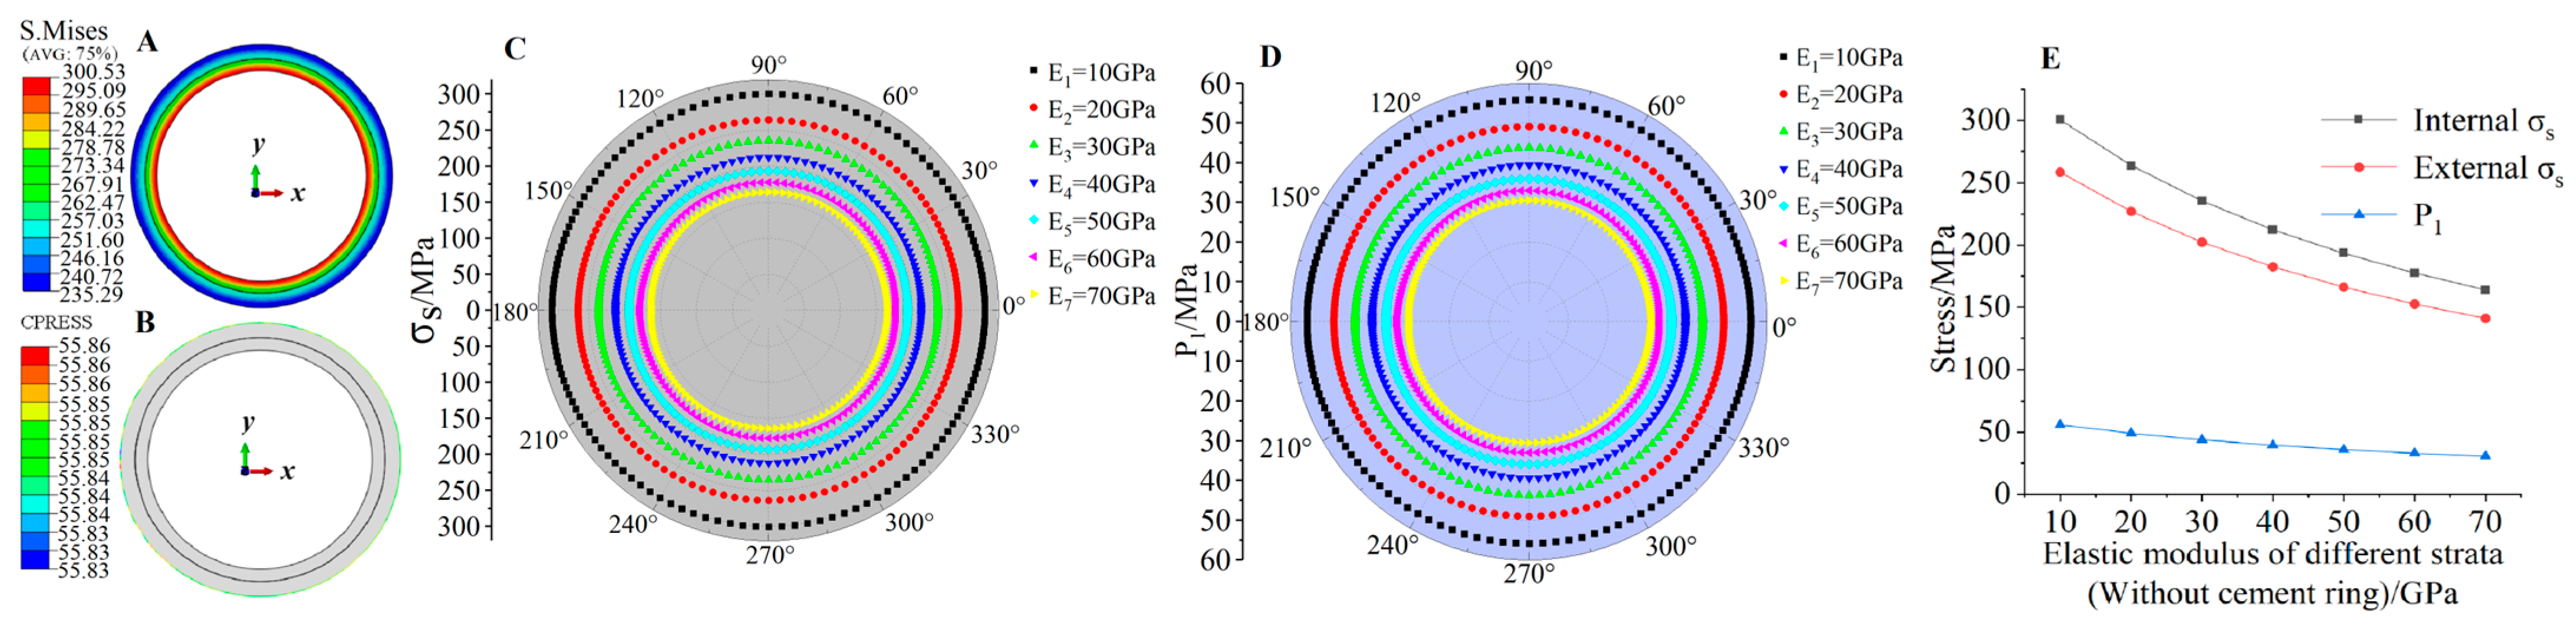
The Ed is set at a level of 10 GPa to 70 GPa. Figure 4 and Figure 5 display the results of the finite element analysis. As shown in the figure, the , P1, P2 of the pipeline are equal in the circumferential direction, and decreases from the inside out and reaches its maximum value at the inner wall of the pipeline. This result is consistent with the analytical solution of the Lame formula, which predicts that the pipeline will first experience yield failure in the inner layer. The , P1, P2 of pipeline gradually decrease as the strata’s Ed increases, with a maximum reduction amplitude of about 45.3% (without a cement ring) and 69.7% (with a cement ring). However, the reduction amplitude gradually slows down. This indicates that the Ed elastic modulus and stiffness are directly proportional to its ability to resist distant ground stresses and provide an ‘iron tube’ protective effect. The protective effect on the pipeline is stronger when the strata have a larger elastic modulus.
Upon comparison of the data, it was discovered that while the presence or absence of a cement ring cannot entirely eliminate stress on the pipeline, the presence of a cement ring results in an average decrease of 32.7% in , P1, P2. This can be attributed to the fact that, in general, the elastic modulus and stiffness of the cement ring are smaller than that of the strata, but its deformation ability is stronger. When distant stress is transmitted to the cement ring through the formation, the cement ring absorbs a portion of the force through deformation, resulting in a decrease in the force transmitted to the pipeline. This suggests that the cement ring has a stress-relieving effect and provides some protection to the pipeline.
3.2.2. Finite Element Analysis of Poisson’s Ratio of Strata
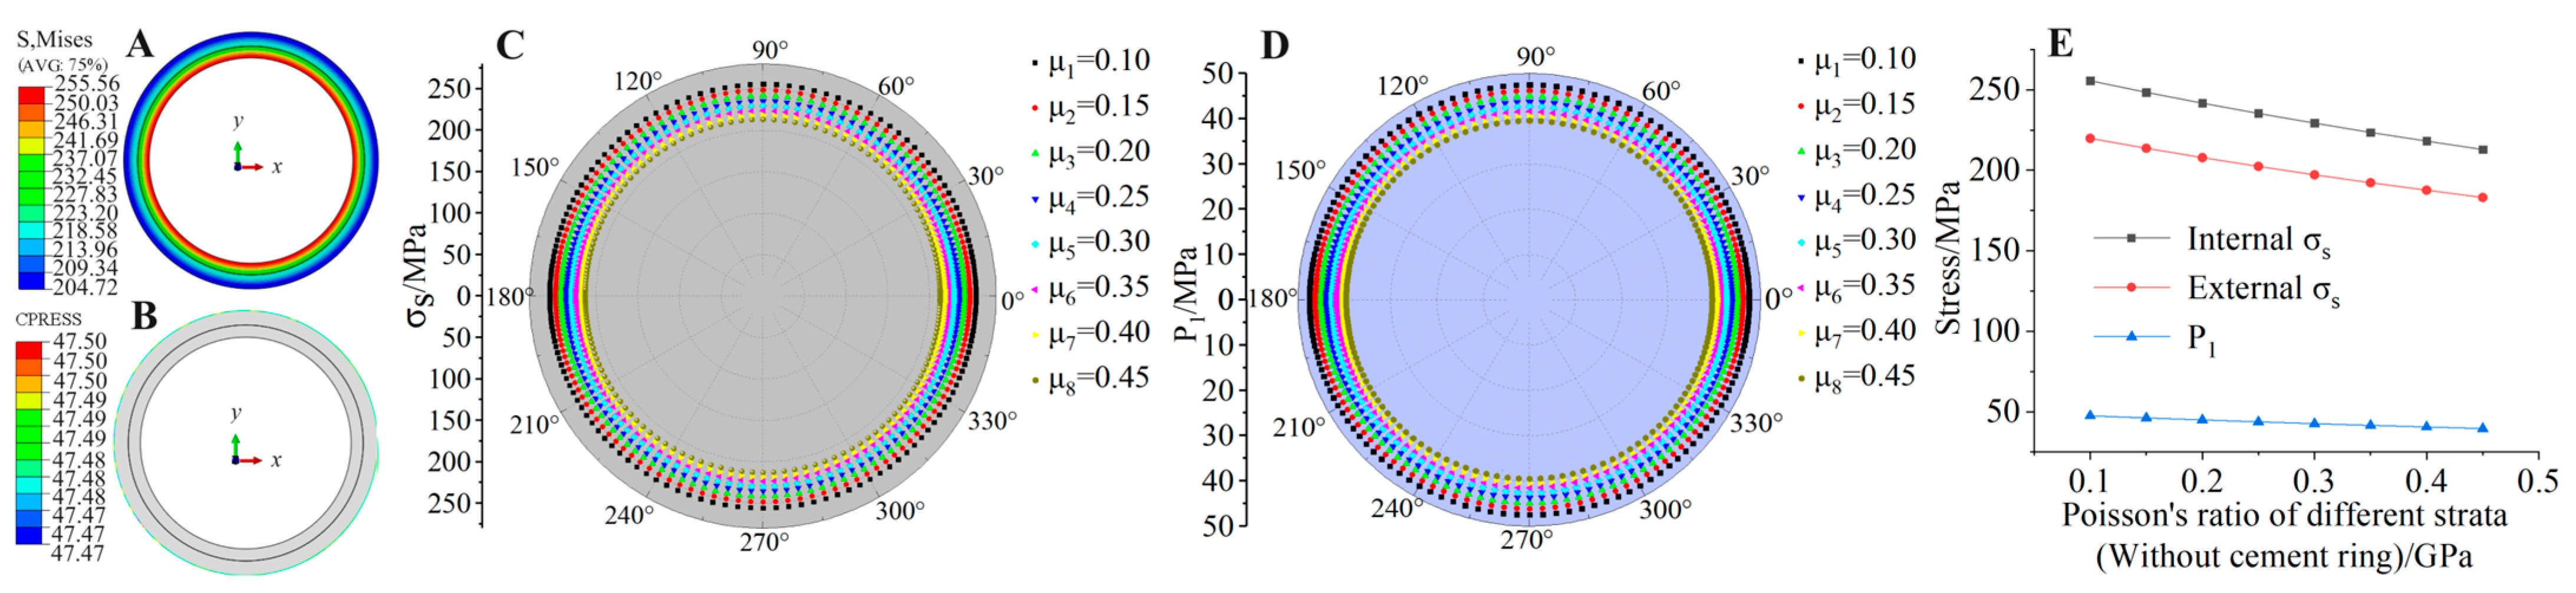
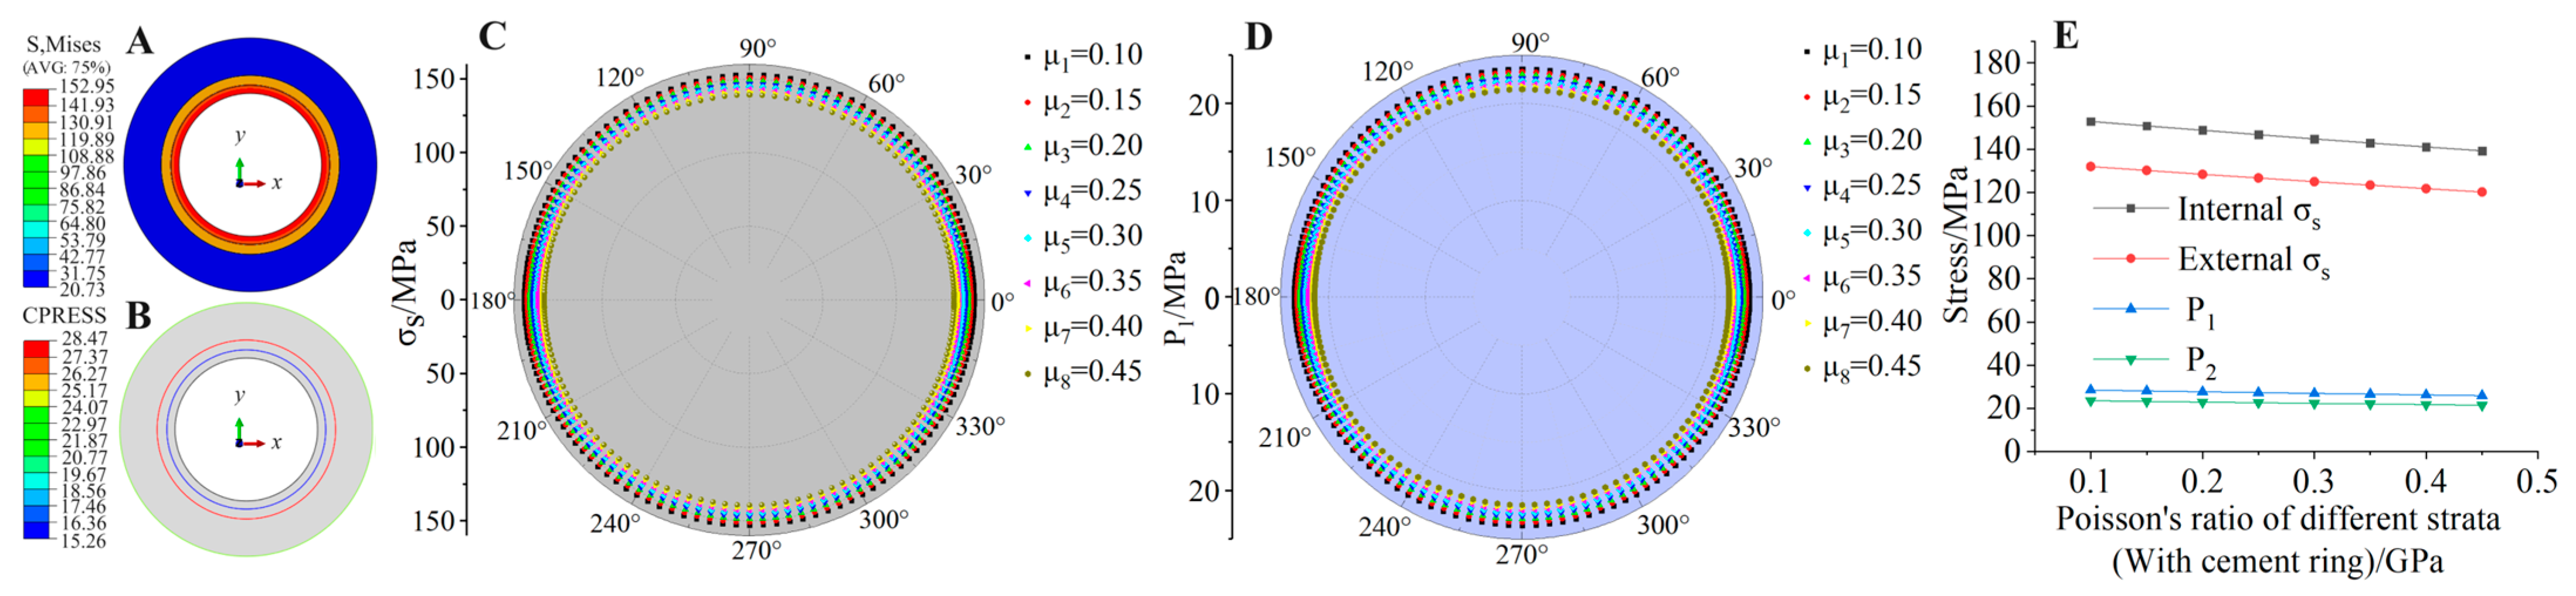
The μd is set at a level of 0.1–0.45, and the results of the finite element model are shown in Figure 6 and Figure 7.
As shown in the figure, the , P1, P2 of the pipeline are equal in the circumferential direction, and gradually decreases radially from the inside out and reaches its maximum value at the inner wall of the pipeline, which is consistent with the elastic modulus law of the strata. The , P1, P2 of the pipeline all decrease gradually with the increase of μd, and the maximum decrease is about 16.7% (without cemented ring) and 8.9% (with cemented ring), which are small decreases. This indicates that the larger μd is, the stronger the protection of the pipeline, but from the polar plot, it can be found that the difference in the value of annular stress at each level is small, indicating that this protection is not significant. Both and P1 of the pipeline are reduced by 37.8% on average when there is a cement ring present. This indicates that the cement ring has a stress unloading effect and provides some protection to the pipeline.
3.2.3. Finite Element Analysis of Geological Stress of Strata
The is set at a level of 18 MPa–61 MPa, and the finite element modeling results are shown in Figure 8 and Figure 9.
From the figure, it can be seen that the P1, P2 of the pipeline are equal in the circumferential direction, and gradually decreases radially from the inside out and reaches its maximum value at the inner wall of the pipeline, which is consistent with the elastic modulus law of the strata. The P1, P2 of the pipeline all increase with the increase of , and the maximum increase is about 239.8% (without cemented ring) and 238.8% (with cemented ring). This result is also consistent with the general rule that the value of strata stress is proportional to the depth of the strata, i.e., the deeper the depth of the strata, the greater the ground stress. However, it should be noted that the pipeline stress value increases exponentially according to the strata depth, even though the stress value decreases by 37.3% in the case of cemented ring, the final pipeline stress value still increases exponentially. This indicates that when mining deep wells, it is important to focus on the value of ground stress due to the depth of the strata to determine the mechanical parameters of the pipeline in order to ensure the safety of the pipeline.
3.3. The Influence of Cement Ring Parameters on the Anti-Extrusion Strength of Pipelines
The selection of cement ring parameters includes the elastic modulus (Ec), Poisson’s ratio (μc), cement ring thickness (d), and cement ring missing (α) angle as variables. Because of the large number of factor level designs, it is not possible to comprehensively display stress nephogram at each level. However, upon comparison, it was found that the nephogram patterns at each level are similar. Therefore, only one stress nephogram is displayed for each factor as a reference. Polar coordinates are used to compare the stress distribution of each factor at each level.
3.3.1. Finite Element Analysis of Elastic Modulus of Cement Ring
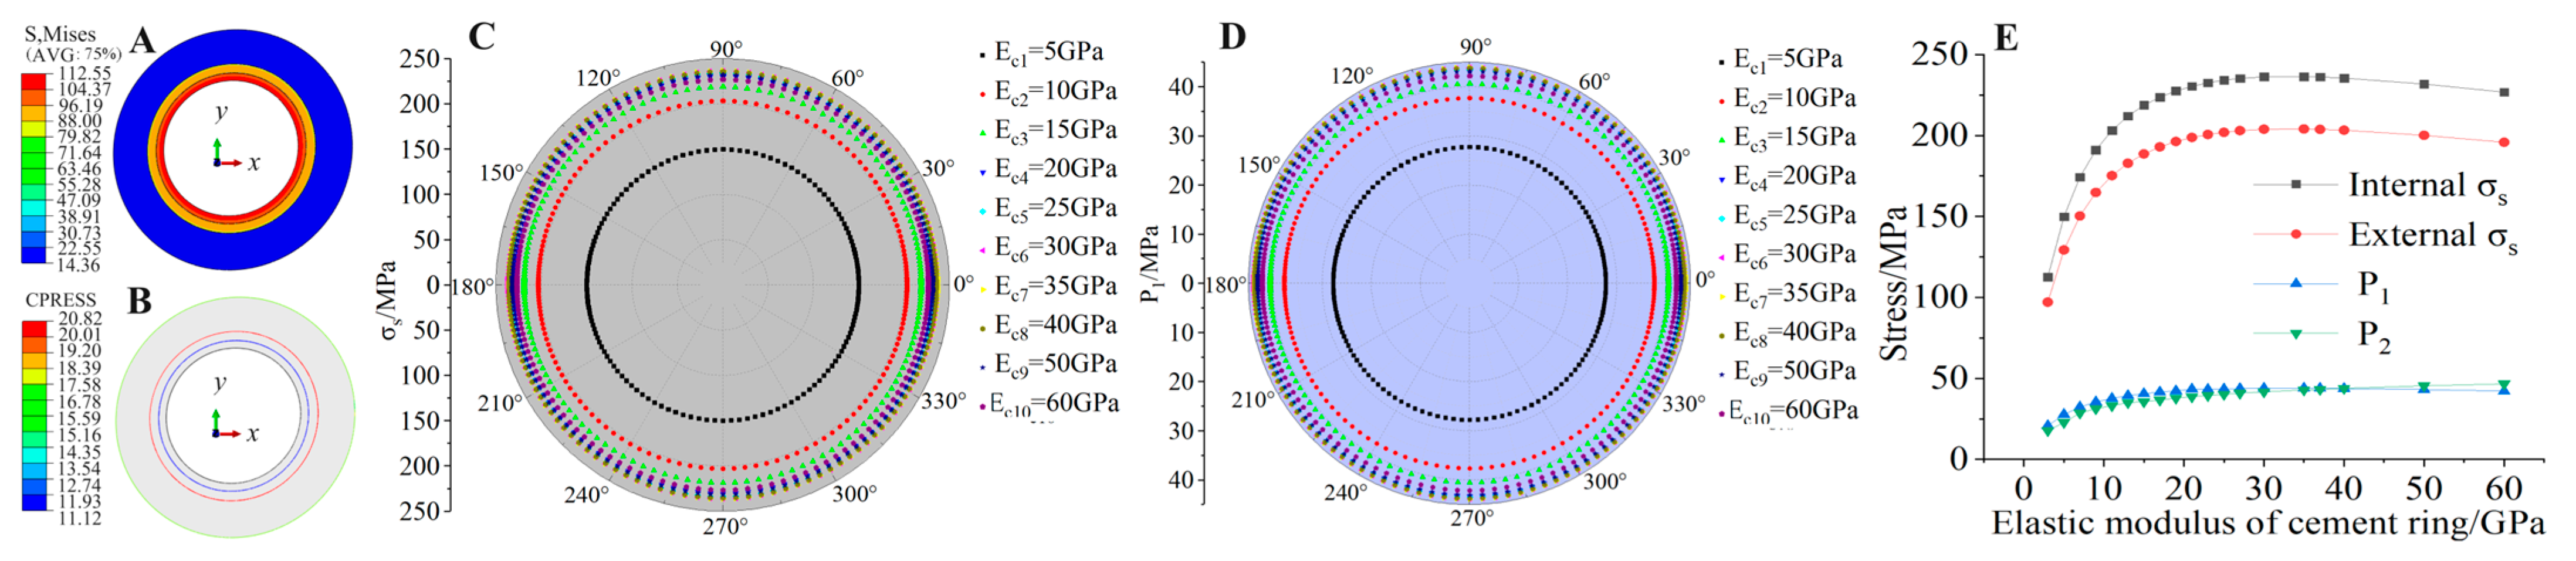
The Ec is set at a level of 5 MPa–60 MPa, and the finite element modeling results are shown in Figure 10.
From the figure, it can be seen that the , P1, P2 of the pipeline are equal in the circumferential direction, and gradually decreases radially from the inside out and reaches its maximum value at the inner wall of the pipeline, which is consistent with the previous law. In this study, the stratum Ed is set to 30 GPa, and it is obvious from Figure 9B–D that when Ec < Ed, the , P1, P2 of the pipeline all increase with the increase of Ec, and when Ec > Ed, the pipeline’s , P1, P2 all gradually decrease with the increase of Ec.
It is commonly believed that a lager Ec provides a stronger protective effect on the pipeline. However, our findings differ from this view. From an energy perspective, when Ec < Ed, the stress in the distance generates energy by transmitting force and doing work on the cement ring. However, the cement ring’s smaller elastic modulus allows it to absorb some energy through its own deformation, while the remaining energy is transmitted to the pipeline. This results in a reduction of both the energy transmitted to the pipeline and the force exerted on it. Conversely, when Ec > Ed, the cement ring cannot absorb as much energy transmitted from the formation due to its larger Ec. As a result, the energy received by the pipeline increases. Based on the analysis above, it can be concluded that to enhance the anti-extrusion strength of the pipeline, the elastic modulus of the cement ring should be appropriately reduced when the local layer is relatively hard (Ec < Ed) and increased when the local layer is relatively soft (Ec > Ed). In general, materials with high strength can better withstand damage, while those with low stiffness can more easily deform. Therefore, if the cement ring possesses both high strength and low stiffness, it can significantly enhance the pipeline’s resistance to extrusion. However, such materials are uncommon and require further research and development.
3.3.2. Finite Element Analysis of Poisson’s Ratios of Cement Ring
The μc is set at a level of 0.1–0.4, and the results of the finite element model are shown in Figure 11. From the figure, it can be seen that the , P1, P2 of the pipeline are equal in the circumferential direction, and gradually decreases radially from the inside out and reaches its maximum value at the inner wall of the pipeline, which is consistent with the previous law. It can be found through the polar plot that the difference between and P1 of the pipeline at each level is small. Combined with the line graphs, it can be seen that the , P1, P2 of the pipeline all increase slightly with the increase of μc, with a maximum increase of 5.9%. This indicates that the change of μc has a small degree of influence on the stress of the pipeline, and its protective effect on the pipeline is basically negligible.
3.3.3. Finite Element Analysis of Thicknesses of Cement Ring
The cement ring and the lining ring in the tunnel have a similar shape and both serve as fixed support. But the lining ring in the tunnel needs to be constructed immediately after excavation to support the surrounding rock pressure. The cement sheath used to backfill drilling only starts grouting after the pipeline is inserted, with a focus on stabilizing the pipeline.
The d is set at a level of 10–70 mm, and the finite element model results are shown in Figure 12. As shown in the figure, it can be seen that the , P1, P2 of the pipeline are equal in the circumferential direction, and gradually decreases radially from the inside out and reaches its maximum value at the inner wall of the pipeline, which is consistent with the previous law. The , P1, P2 of the pipeline all decrease with increasing d, with a maximum decrease of 30.9%. This can be explained as follows: the increase in cement ring d causes the deformation degree of the cement ring in the thickness direction to increase after receiving the force transmitted by the strata, that is, the “consumption and absorption” force increases, and the force transmitted to the pipeline decreases. This indicates that increasing the thickness of the cement ring has a certain protective effect on the pipeline.
3.3.4. Finite Element Analysis of Missing Angle of Cement Ring
In cementing, it is usually difficult to quantify the quality of cementing. This study characterizes the quality of cementing by setting the angle of missing cement rings. The α is set at a level of 15°–180°, and the finite element model results are shown in Figure 13. From the nephogram, it can be seen that the , P1, P2 of the pipeline vary in the circumferential direction, with the maximum stress occurring at the center of the missing angle of the cement ring, and gradually decreases radially from the inside out and reaches its maximum value at the inner wall of the pipeline. According to the polar coordinate diagram, the stress value gradually increases in the 0°–90° and 180°–270° directions of the pipeline, but reaches its maximum at 90°. Due to its symmetrical structure, the other half exhibits the same pattern. When the cement ring is missing, it can lead to stress concentration at the missing location. Comparing the values at 270° and 90°, it can be seen that increases from 118 MPa to a value of 257 MPa, and the stress concentration factor is 2.2, which is enough to show that there is a significant effect on the stress of the pipe when the cement ring is missing.
The line graph shows that when 15° < α < 60°, the , P1, P2 of the pipeline all increase with α, with a maximum increase of 64.9%. When 60° < α < 180°, the , P1, P2 of the pipeline all decrease with increasing α, with a maximum decrease of 74.1%. This is different from our usual understanding, which usually assumes that the larger α is, the larger the stress value is. This can be explained by the fact that when the missing angle is small, the stress inside the pipe increases sharply, and as the angle increases, this stress concentration will reach its maximum value and not increase after that. This suggests that when cementing, there is a need to strictly ensure that the cement ring is defective, with the most unfavorable case being that smaller defects (less than 60°) are not allowed in the cement ring.
3.4. The Sensitivity Analysis
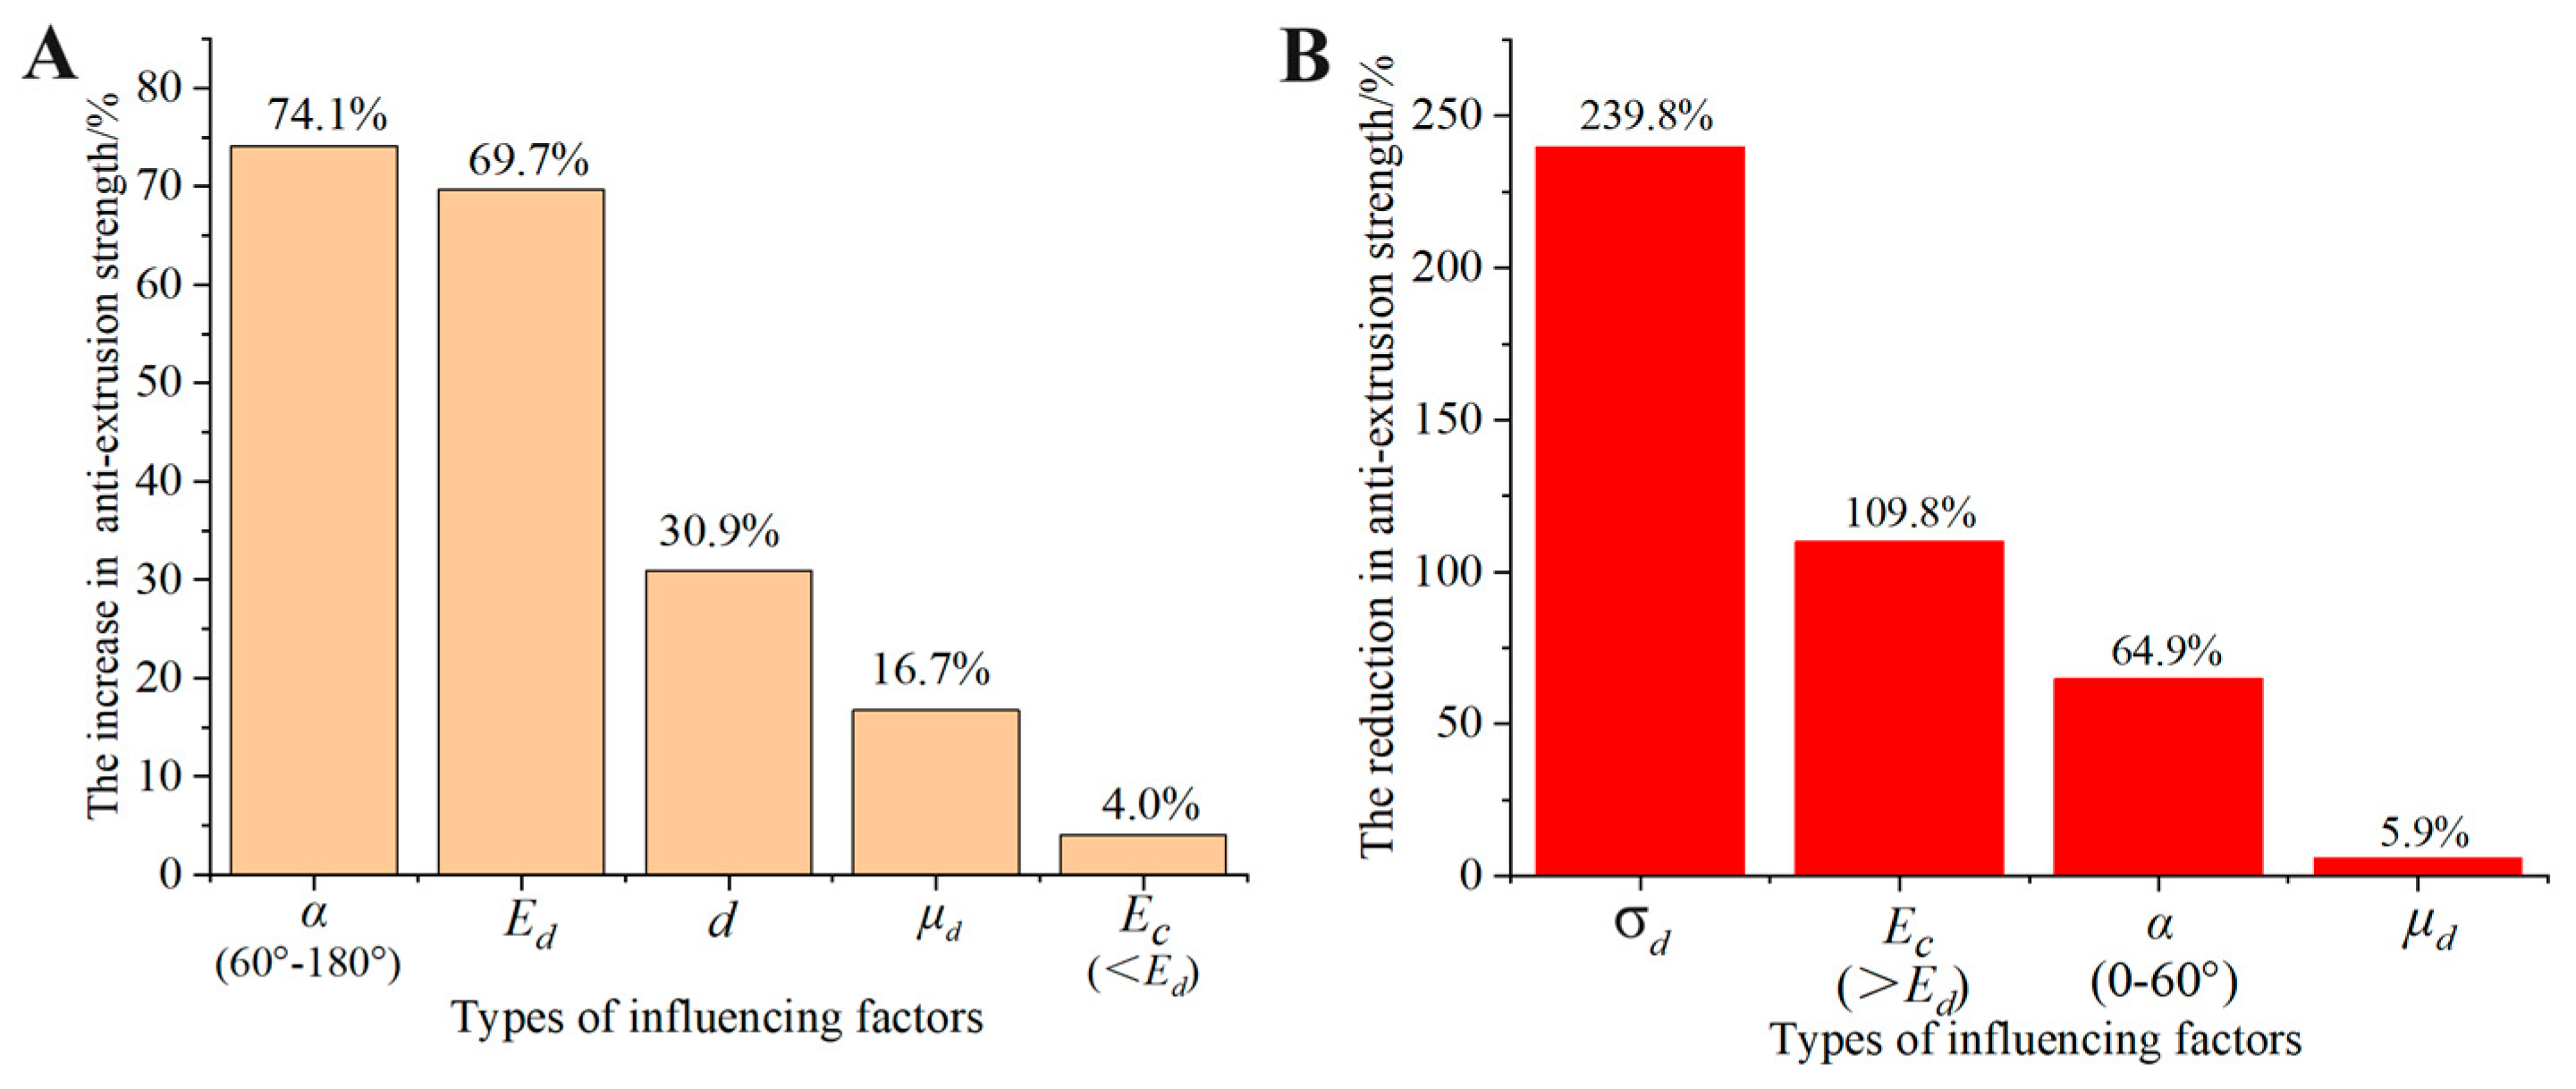
To ensure pipeline safety, when , P1, P2 increase, the pipeline anti-extrusion Strength should increase; otherwise, when , P1, P2 decrease, the pipeline anti-extrusion Strength can be appropriately reduced. According to the above analysis, it can be seen that the influence of each factor on pipeline , P1, P2 increases and decreases. In order to judge the sensitivity of each factor to pipeline anti-extrusion Strength, the maximum increase or decrease in pipeline anti-extrusion Strength is used to determine the level range designed for each factor in this study. The factors that increase and decrease the pipeline anti-extrusion strength are plotted separately, as shown in Figure 14.
According to Figure 14A, the increase of α (60°–180°), Ed, d, μd, Ec (Ec < Ed) can improve the pipeline anti-extrusion strength, and the sensitivity of these five factors to pipeline anti-extrusion strength is ranked as α (60°–180°) > Ed > d > μd > Ec (Ec < Ed). Because α is a cement ring defect, it should be avoided in engineering. Ed and μd are inherent properties of the formation and cannot be changed. Therefore, the crush strength of the pipeline can be improved by increasing d and Ec (Ec < Ed).
According to Figure 14B, it can be seen that the increase of σ, Ec (Ec > Ed), α and μd will reduce the pipeline anti-extrusion strength, and the sensitivity of these four factors to the pipeline anti-extrusion strength is ordered as σ > Ec (Ec > Ed) > α > μd. σ is affected by the depth of the formation, and the pipeline should be selected according to the geological conditions of the specific mine. Generally, Ed > Ec, when Ec > Ed, it should be noted that increasing Ec will reduce the pipeline anti-extrusion strength. Therefore, in the pipeline design, the main ground stress factors are especially needed, which have a significant impact on the pipeline anti-extrusion strength.
4. Engineering Case Verification
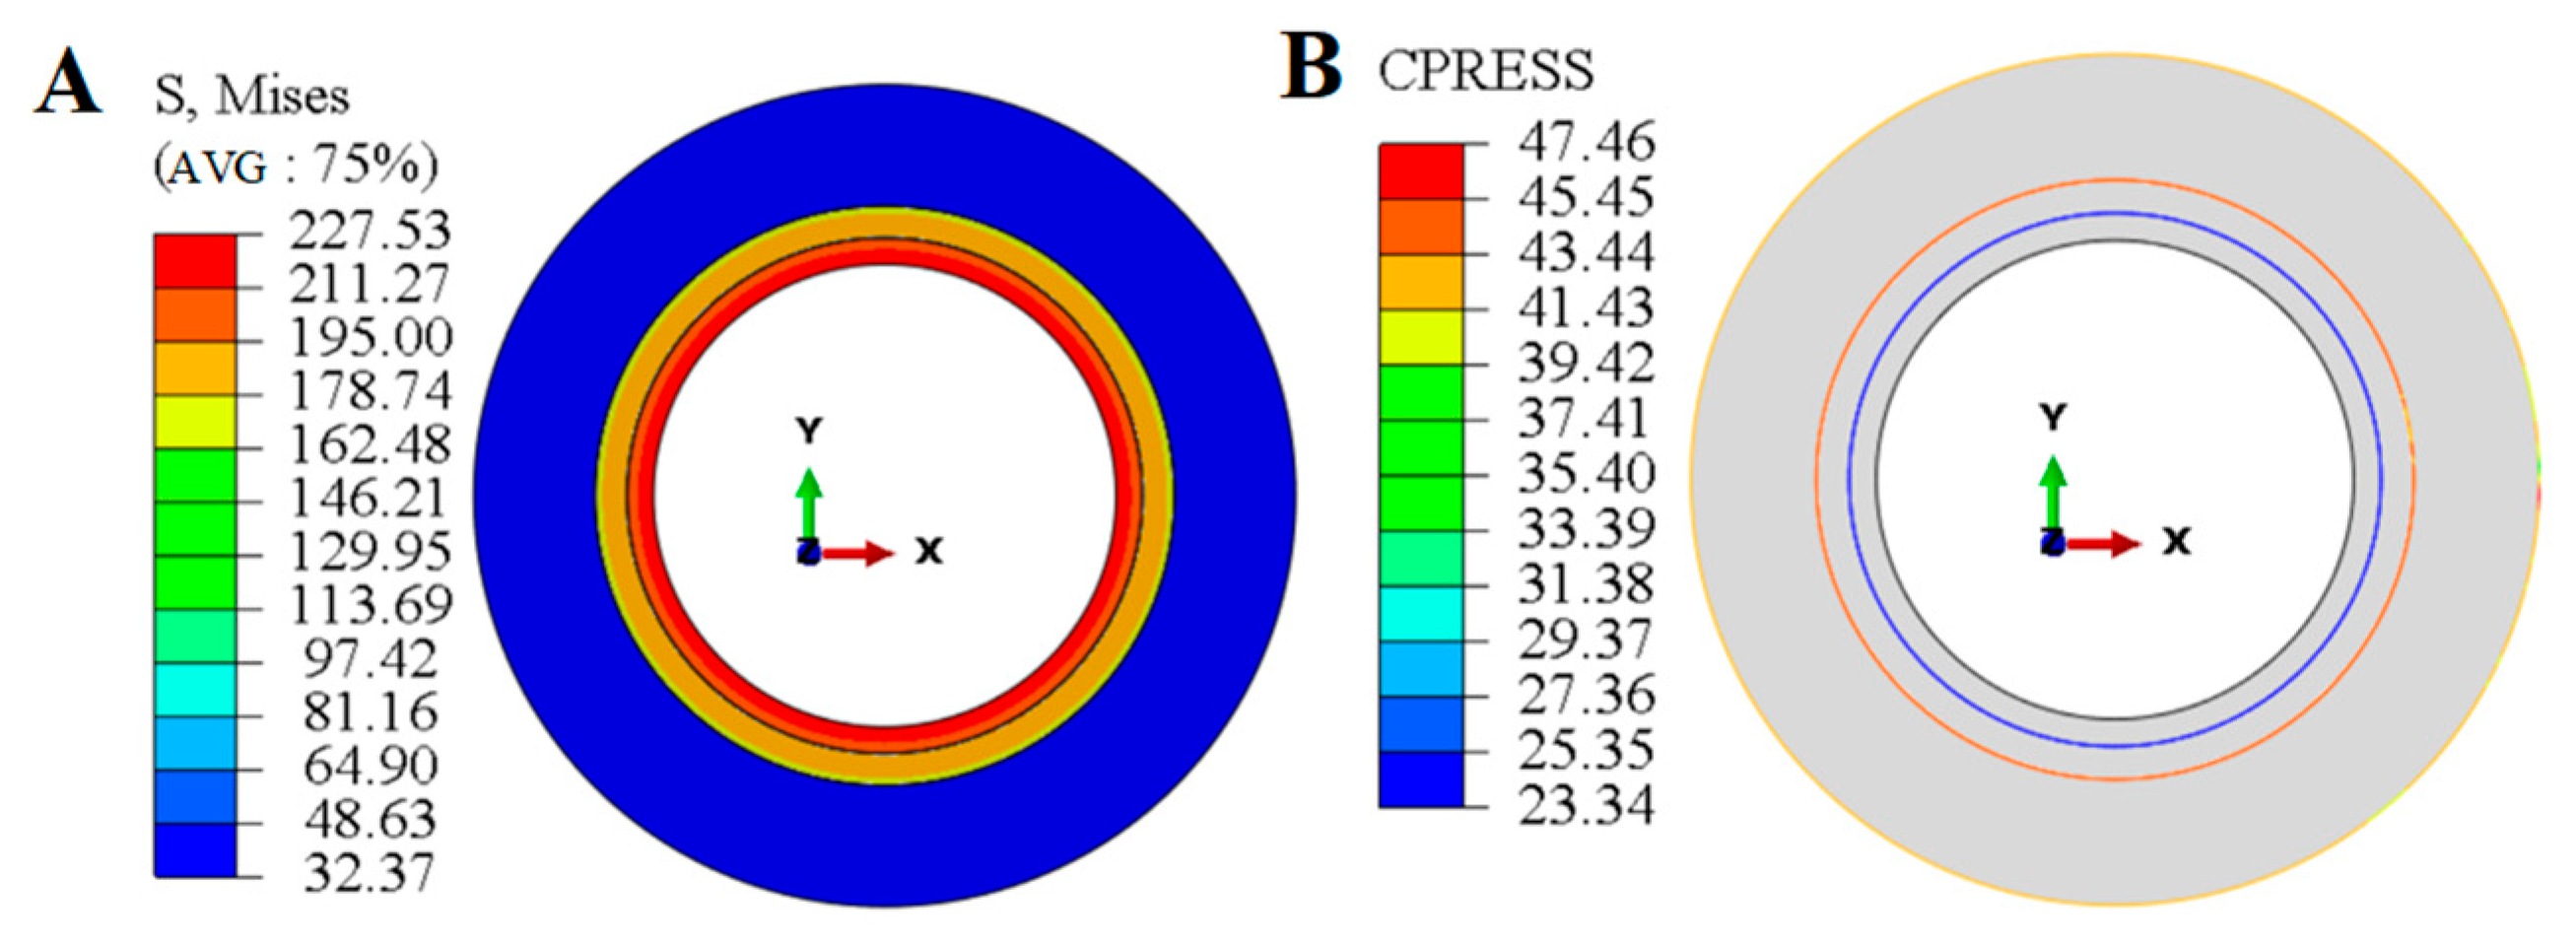
Taking a foreign copper mine as an engineering case, bimetallic composite pipes were used for backfill drilling pipelines. The damage location of the borehole in the mine is 680 m, and the uniform stress value at this location is calculated to be 41 MPa, indicating damage to the inner layer of the pipeline. Based on this, numerical simulation analysis was conducted, and the results are shown in Figure 15. The parameters of the model are shown in Table 1.
According to Figure 15, it can be seen that the results of this nephogram have a similar pattern with the previous numerical simulation results, i.e., , P1, P2 are equal in the annulus upward, and the value of in the radial direction becomes smaller from the inside outward, and there is a maximum value at the inner wall. In Figure 15A, the value of at the inner wall of the pipe is 227.53 MPa, which has exceeded the yield strength value of the inner layer of the pipe of 205 MPa, while the maximum value of at the outer layer of the pipe is 211.27 MPa, which has not exceeded the yield strength value of the outer layer of the pipe of 235 MPa, and therefore the pipe has already been damaged by yielding at the inner wall.
According to Figure 15B, it can be seen that the external squeezing force P1 of the pipe is 47.46 MPa, and according to the literature, is generally between 0.15–0.2, and 0.2 is taken in this case, and the out-of-roundness e of the pipe is taken as 0.5%, the unevenness of the wall thickness ε is taken as 10%, and the Poisson’s ratio of the inner pipeline is taken as 0.27, which is substituting into the API strength (2) and the modified anti-extrusion strength model (9), respectively. These are obtained and compared with the numerical simulation results. The results are shown in the following table.
According to Table 2, it can be seen that the value of API strength of the pipeline is 18.2% higher than the value of modified anti-extrusion strength, which indicates that the API value is too large, and when the strength of the pipeline is designed, the pipeline will be ruptured as the design value is too low. According to the numerical simulation results, the actual external extrusion force of the pipeline in this mine is 27.9% higher than the API strength value and 51.1% higher than the modified anti-extrusion strength, which indicates that the pipeline sizing parameters in this mine cannot be applied to the geostress environment in which it is located. The modified anti-extrusion strength model in this study can provide theoretical guidance for the design of pipeline parameters.
5. Discussion
This study focuses on the use and rupture of backfill drilling bimetallic composite pipes in foreign mines. By deriving mechanical formulas, the mechanical failure mechanism of pipes is preliminarily explored and analyzed. Due to the limited mechanical analysis of deep well filling pipelines both domestically and internationally, there are certain limitations in the analysis, as follows:
(1) The formula derivation in this article is under ideal conditions, where the pressure at which the pipeline is located is uniform, while in reality, the pressure in most strata is non-uniform, resulting in certain errors in the calculation results.
(2) Theoretical analysis lacks support from indoor experiments. The pipeline should be subjected to triaxial compression tests indoors to simulate the actual compression environment of the pipeline in the formation and verify the rationality of the theoretical analysis.
(3) In actual production, the quality of pipelines may be poor due to construction, technical issues, etc. Therefore, the anti-extrusion performance of pipelines should be verified through triaxial compression tests before leaving the factory to ensure their safety.
Despite the limitations mentioned above, the mechanical analysis and exploration conducted in this study based on engineering cases have preliminarily and for the first time revealed the mechanical extrusion mechanism of deep backfill drilling pipelines under non-wear damage. The model of this study provides a theoretical basis for future non-uniform-stress-condition pipeline strength modeling and design, as well as mechanical loading conditions for indoor experiments. This is beneficial for the design of filling boreholes or other fluidized mining borehole pipelines to provide safety assurance.
6. Conclusions
Based on the knowledge of elastic mechanics and material mechanics, combined with numerical simulation, theoretical analysis, and engineering examples, the mechanical damage of mine backfill drilling pipeline was analyzed, and the conclusions obtained are as follows.
(1) Based on the API yield strength model, the pipe anti-extrusion strength model was modified by considering the pipe’s out-of-roundness defects, defects in the evenness of wall thickness, and residual stress factors, and combining these with the fourth strength criterion.
(2) Through the finite element analysis results, an increase in the stratum elastic modulus and Poisson’s ratio of the pipeline has a protective effect, and the role of the stratum elastic modulus is much larger than the stratum Poisson’s ratio. In the deeper stratum depth, the existence of larger ground stress makes the pipeline stress value increase exponentially, which has unfavorable effects on the pipeline.
(3) Cement rings have a certain stress unloading effect; the average stress unloading degree is 32.7%–37.8%. Increasing the thickness of the cement ring will have a protective effect on both pipes, and the Poisson’s ratio of the cement ring has a basically negligible protective effect on the pipes. In hard strata, reducing the elastic modulus of cement rings appropriately, and in soft strata, increasing the elastic modulus of cement rings appropriately, both have protective effect on the pipeline. The selection of high-strength and low-stiffness cement ring materials can improve the crush strength of the pipe. When the missing angle of a cement ring is <60°, the stress concentration factor is as high as 2.2, and the stress concentration effect is reduced when it exceeds 60°.
(4) Through the API strength model, modified anti-extrusion strength model and finite element analysis results, the API crush strength value of the pipeline is 18.2% higher than the modified anti-extrusion strength value, and at the same time, it is verified that the inner layer of the pipeline rupture in a foreign mine filling borehole is due to its own low design of the anti-extrusion strength value. The modified anti-extrusion strength model in this study can provide guidance for pipeline parameter design, and also provide a theoretical basis for future research on Inclined or curved pipelines.
Author Contributions
Data curation, C.L.; Writing—original draft, H.L.; Writing—review & editing, H.W. All authors have read and agreed to the published version of the manuscript.
Funding
This work was supported by the Key Program of National Natural Science Foundation of China (Grant No. 52130404).
Data Availability Statement
The data presented in this study are available on request from the corresponding author. The data are not publicly available due to patent application issues.
Conflicts of Interest
The authors declare no conflict of interest.
References
- Xie, H.P.; Gao, F.; Ju, Y. Research and exploration of deep rock mass mechanics. J. Rock Mech. Eng. 2015, 34, 2161–2178. [Google Scholar]
- Wang, L.M.; Luo, Y.K.; Yin, S.H.; Zhou, G.M.; Liao, W.S.; Li, Z.K. Exploration of Strengthening Fluidized Leaching Process of Deep Ground Metal Mines and Geothermal Collaborative Mining. J. Eng. Sci. 2022, 44, 1694–1708. [Google Scholar]
- Cai, M.F.; Tan, W.H.; Wu, X.H.; Zhang, L.P. The Current Situation and Development Strategy of Deep Intelligent Mining in Metal Mines. Chin. J. Nonferrous Met. 2021, 31, 3409–3421. [Google Scholar]
- Cheng, H.Y.; Wu, A.X.; Wu, S.C.; Zhu, J.Q.; Li, H.; Liu, J.; Niu, Y.H. Research Status and Development Trends of Solid Waste Filling in Metal Mines. J. Eng. Sci. 2022, 44, 11–25. [Google Scholar]
- Wu, A.X.; Wang, Y.; Wang, H.J. The current situation and trend of paste filling technology. Met. Mines 2016, 7, 1–9. [Google Scholar]
- Sheshpari, M. A review of underground mine backfilling methods with emphasis on cemented paste backfill. Electron. J. Geotech. Eng. 2015, 20, 5183–5208. [Google Scholar]
- Zheng, B.K.; Zhang, P.Q.; Yin, X.Y.; Wang, Y.S. Research on Pressure Regulating Technology of Deep Well Low Power Line Filling Pipeline. Min. Technol. 2019, 1, 31–33. [Google Scholar]
- Zhang, J.F.; Dong, K.F.; Chen, Y.; Wang, S.M. Application of Multi process Drilling Technology in Vertical Filling Drilling. Well Constr. Technol. 2023, 44, 8–14. [Google Scholar]
- Qi, W.; Guo, M.C.; Tan, Y.Y.; Zhang, C.Y. Analysis of Gravity Transportation Parameters and Study on Wear Law of Filling Pipeline in Daye Iron Mine. Min. Res. Dev. 2021, 41, 164–169. [Google Scholar]
- Jose, W.; Calderon, H.; Amilton, S. Hydraulic convey of iron ore slurry pipeline wear and ore particle degradation in function of pumping time. Wear 2020, 450, 203272. [Google Scholar]
- Jones, M.; Llewellyn, R.J. Erosion–corrosion assessment of materials for use in the resources industry. Wear 2009, 267, 2003–2009. [Google Scholar] [CrossRef]
- Buchan, A.J.; Spearing, A.J.S. The effect of corrosion on the wear rate of steel pipelines conveying backfill slurry. J. South. Afr. Inst. Min. Metall. 1994, 94, 37–45. [Google Scholar]
- Levy, A.V.; Pauline, C. The effects of erodent composition and shape on the erosion of steel. Wear 1983, 89, 151–162. [Google Scholar] [CrossRef]
- Creber, K.J. Experimental and In-Situ Investigation into Pipeline Wear in Mine Backfill Distribution Systems; McGill University: Montreal, AB, Canada, 2016. [Google Scholar]
- Qiao, Z.W.; Liu, Z.; Zhang, X.T.; Zhang, H.X.; Li, Z.J.; Li, D. The influence of roughness on the mechanical characteristics and erosion of cylindrical structures under the action of water and sand flow. J. Shandong Univ. Sci. Technol. (Nat. Sci. Ed.) 2021, 40, 44–49. [Google Scholar]
- Wang, Z.C.; Chen, Y.; Sun, J.; Xia, H.C. Analysis of erosion and wear of variable diameter pipes by filling slurry. J. Shandong Univ. Sci. Technol. (Nat. Sci. Ed.) 2022, 41, 39–46. [Google Scholar]
- Rodriguez, W.J.; Fleckenstein, W.W.; Eustes, A.W. Simulation of Collapse Loads on Cemented Pipeline, Using Finite Element Analysis. J. Pet. Technol. 2003, 56, 59–61. [Google Scholar]
- Medjo, B.; Rakin, M.; Gubeljak, B. Failure resistance of drilling rig pipeline pipes with an axial crack. Eng. Fail. Anal. 2015, 58, 429–435. [Google Scholar] [CrossRef]
- Liu, Q.J. Analysis of pipeline damage mechanism and research on treatment measures. Petrochem. Technol. 2021, 28, 35–39. [Google Scholar]
- Han, H.; Yin, S.; Hen, Z.C. Estimate of in-situ stress and geomechanically parameters for Duvernay Formation based on borehole deformation data. J. Pet. Sci. Eng. 2021, 196, 107994. [Google Scholar] [CrossRef]
- Gao, F. Peak Study on the Distribution Law of Ground Stress and Its Influence on the Stability of Surrounding Rock of Roadway; China University of Mining and Technology: Beijing, China, 2009. [Google Scholar]
- Mo, P.; Marshall, A.M.; Yu, H. Elastic-plastic solutions for expanding cavities embedded in two different cohesive-frictional materials. Int. J. Numer. Anal. Methods Geomech. 2014, 38, 961–970. [Google Scholar] [CrossRef]
- Guo, K.Y.; Wang, J.E. The failure mechanism and anti-deformation design of vertical shafts affected by mining. Coal Sci. Technol. 2020, 48, 179–184. [Google Scholar]
- Li, C.; Hou, S.; Liu, Y. Analysis on the crown convergence deformation of surrounding rock for double-shield TBM tunnel based on advance borehole monitoring and inversion analysis. Tunn. Undergr. Space Technol. 2020, 103, 103513. [Google Scholar] [CrossRef]
- Oggeri, C.; Oreste, P.; Spagnoli, G.; Giovanni, S. The influence of the two-component grout on the behaviour of a segmental lining in tunnelling. Tunn. Undergr. Space Technol. 2021, 109, 103750. [Google Scholar] [CrossRef]
- Xu, Z.L. Linear Elasticity; Higher Education Press: Beijing, China, 2016. [Google Scholar]
- Hu, H.X.; Yao, Y.P.; Luo, T.; Jin, X.F. The plane strain strength formula based on the Lade Duncan criterion. Rock Soil Mech. 2022, 43, 389–396. [Google Scholar]
- Yang, Y.; Zhang, Y. Research on residual stress of domestically produced high anti extrusion pipeline. Petroleum Special Pipe 1998, 2, 46–49. [Google Scholar]
- Huang, Y.; Lin, H.Z.; Du, C.C. Relative Error Analysis of Strength Calculation for Thin walled Cylinders. J. Chang. Univ. 2019, 29, 10–13+45. [Google Scholar]
Figure 1.
Schematic diagram of backfill system.

Figure 2.
Schematic diagram of backfill drilling pipeline rupture: (A) crack on the inner wall of the pipeline, (B) cleaning of pipeline fragments inside the drilling.
Figure 2.
Schematic diagram of backfill drilling pipeline rupture: (A) crack on the inner wall of the pipeline, (B) cleaning of pipeline fragments inside the drilling.

Figure 3.
Schematic diagram of backfill drilling system.

Figure 4.
Numerical simulation results under different elastic moduli of strata (without cement ring): (A,B) and P1 nephogram (Ed = 10 GPa), (C) comparison analysis results, (D) P1 comparison analysis results, and (E) Ed and , P1 relationship diagram.
Figure 4.
Numerical simulation results under different elastic moduli of strata (without cement ring): (A,B) and P1 nephogram (Ed = 10 GPa), (C) comparison analysis results, (D) P1 comparison analysis results, and (E) Ed and , P1 relationship diagram.

Figure 5.
Numerical simulation results under different elastic moduli of strata (with cement ring): (A,B) and P1 nephogram (Ed = 10 GPa), (C) comparison analysis results, (D) P1 comparison analysis results, and (E) Ed and , P1, P2 relationship diagram.
Figure 5.
Numerical simulation results under different elastic moduli of strata (with cement ring): (A,B) and P1 nephogram (Ed = 10 GPa), (C) comparison analysis results, (D) P1 comparison analysis results, and (E) Ed and , P1, P2 relationship diagram.

Figure 6.
Numerical simulation results under different Poisson’s ratios of strata (without cement ring): (A,B) and P1 nephogram (μd = 0.1), (C) comparison analysis results, (D) P1 comparison analysis results, and (E) μd and , P1 relationship diagram.
Figure 6.
Numerical simulation results under different Poisson’s ratios of strata (without cement ring): (A,B) and P1 nephogram (μd = 0.1), (C) comparison analysis results, (D) P1 comparison analysis results, and (E) μd and , P1 relationship diagram.

Figure 7.
Numerical simulation results under different Poisson’s ratios of strata (with cement ring): (A,B) and P1 nephogram (μd = 0.1), (C) comparison analysis results, (D) P1 comparison analysis results, and (E) μd and , P1, P2 relationship diagram.
Figure 7.
Numerical simulation results under different Poisson’s ratios of strata (with cement ring): (A,B) and P1 nephogram (μd = 0.1), (C) comparison analysis results, (D) P1 comparison analysis results, and (E) μd and , P1, P2 relationship diagram.

Figure 8.
Numerical simulation results under different geological stresses of strata (without cement ring): (A,B) and P1 nephogram ( = 18 MPa), (C) comparison analysis results, (D) P1 comparison analysis results, and (E) and , P1 relationship diagram.
Figure 8.
Numerical simulation results under different geological stresses of strata (without cement ring): (A,B) and P1 nephogram ( = 18 MPa), (C) comparison analysis results, (D) P1 comparison analysis results, and (E) and , P1 relationship diagram.

Figure 9.
Numerical simulation results under different ground stresses of strata (with cement ring): (A,B) and P1 nephogram ( = 18 MPa), (C) comparison analysis results, (D) P1 comparison analysis results, and (E) and , P1, P2 relationship diagram.
Figure 9.
Numerical simulation results under different ground stresses of strata (with cement ring): (A,B) and P1 nephogram ( = 18 MPa), (C) comparison analysis results, (D) P1 comparison analysis results, and (E) and , P1, P2 relationship diagram.

Figure 10.
Numerical simulation results under different elastic moduli of cement rings: (A,B) and P1 nephogram (Ec = 5 GPa), (C) comparison analysis results, (D) P1 comparison analysis results, and (E) Ec and , P1, P2 relationship diagram.
Figure 10.
Numerical simulation results under different elastic moduli of cement rings: (A,B) and P1 nephogram (Ec = 5 GPa), (C) comparison analysis results, (D) P1 comparison analysis results, and (E) Ec and , P1, P2 relationship diagram.

Figure 11.
Numerical simulation results under different Poisson’s ratios of cement rings: (A,B) and P1 nephogram (μc = 0.1), (C) comparison analysis results, (D) P1 comparison analysis results, and (E) μc and , P1, P2 relationship diagram.
Figure 11.
Numerical simulation results under different Poisson’s ratios of cement rings: (A,B) and P1 nephogram (μc = 0.1), (C) comparison analysis results, (D) P1 comparison analysis results, and (E) μc and , P1, P2 relationship diagram.

Figure 12.
Numerical simulation results under different thicknesses of cement rings: (A,B) and P1 nephogram (d = 10 mm), (C) comparison analysis results, (D) P1 comparison analysis results, and (E) d and , P1, P2 relationship diagram.
Figure 12.
Numerical simulation results under different thicknesses of cement rings: (A,B) and P1 nephogram (d = 10 mm), (C) comparison analysis results, (D) P1 comparison analysis results, and (E) d and , P1, P2 relationship diagram.

Figure 13.
Numerical simulation results under different angles of missing of cement rings: (A,B) and P1 nephogram (α = 15°), (C) comparison analysis results, (D) P1 comparison analysis results, and (E) α and , P1, P2 relationship diagram.
Figure 13.
Numerical simulation results under different angles of missing of cement rings: (A,B) and P1 nephogram (α = 15°), (C) comparison analysis results, (D) P1 comparison analysis results, and (E) α and , P1, P2 relationship diagram.

Figure 14.
Sensitivity analysis results of pipeline anti-extrusion strength: (A) the increase in anti-extrusion strength, and (B) the reduction in anti-extrusion strength.
Figure 14.
Sensitivity analysis results of pipeline anti-extrusion strength: (A) the increase in anti-extrusion strength, and (B) the reduction in anti-extrusion strength.

Figure 15.
Numerical simulation results of a copper mine pipeline abroad: (A) nephogram and (B) P1 nephogram.
Figure 15.
Numerical simulation results of a copper mine pipeline abroad: (A) nephogram and (B) P1 nephogram.


Table 1.
Material parameters of strata, cement rings, and pipelines.
| Medium | Size/mm | Density/ g/cm−3 | Elastic Modulus/GPa | Poisson’s Ratio | Yield Strength/MPa | Friction Angle/° |
|---|---|---|---|---|---|---|
| Strata | 2000 × 2000 | 2.7 | 30 | 0.25 | - | 40 |
| Cement rings | φ310 × t46 | 1.7 | 15 | 0.2 | - | 25 |
| External pipeline | φ219 × t12 | 7.85 | 206 | 0.30 | 235 | - |
| Internal pipeline | φ195 × t10 | 7.85 | 210 | 0.27 | 205 | - |
Table 2.
Comparison results of pipeline anti-extrusion strength.
| Typology | API Strength | Modified Anti-Extrusion Strength | External Squeezing Force P1 |
|---|---|---|---|
| Strength value/MPa | 37.1 | 31.4 | 47.5 |
Disclaimer/Publisher’s Note: The statements, opinions and data contained in all publications are solely those of the individual author(s) and contributor(s) and not of MDPI and/or the editor(s). MDPI and/or the editor(s) disclaim responsibility for any injury to people or property resulting from any ideas, methods, instructions or products referred to in the content. |
© 2024 by the authors. Licensee MDPI, Basel, Switzerland. This article is an open access article distributed under the terms and conditions of the Creative Commons Attribution (CC BY) license (https://creativecommons.org/licenses/by/4.0/).
Share and Cite
MDPI and ACS Style
Li, H.; Wang, H.; Liu, C. New Model and Finite Element Analysis of the Anti-Extrusion Strength of Backfill Drilling Pipelines. Minerals 2024, 14, 365. https://0-doi-org.brum.beds.ac.uk/10.3390/min14040365
AMA Style
Li H, Wang H, Liu C. New Model and Finite Element Analysis of the Anti-Extrusion Strength of Backfill Drilling Pipelines. Minerals. 2024; 14(4):365. https://0-doi-org.brum.beds.ac.uk/10.3390/min14040365
Chicago/Turabian StyleLi, Hao, Hongjiang Wang, and Chunkang Liu. 2024. "New Model and Finite Element Analysis of the Anti-Extrusion Strength of Backfill Drilling Pipelines" Minerals 14, no. 4: 365. https://0-doi-org.brum.beds.ac.uk/10.3390/min14040365
Note that from the first issue of 2016, this journal uses article numbers instead of page numbers. See further details here.