1. Introduction
The biological control of mineralization in the two-layered shells of Pteriomorphia Pelecypod mollusks is particularly evident in the shells of the Polynesian pearl oyster, Pinctada margaritifera. The contrast between the outer layer, built of large and densely packed polygonal calcite prisms (50 µm in cross-section), and the inner layer, made of smaller nacreous aragonite tablets (0.5–0.9 µm thick and 5–10 µm laterally) oriented parallel to the shell surface is spectacular.
This calcite/aragonite shell structure known since the mid-19th century [
1,
2] has been so frequently described that it is considered a common model among Pelecypod shell structures. However, this calcite/aragonite association is far from frequent, and exploration of sedimentary rocks has progressively revealed how unusual such a direct contact between the two main species of calcium carbonate minerals can be. From a chemical point of view, the precipitation of calcite and aragonite in natural seawater is mutually exclusive. Field observations and thermodynamic considerations converge on the conclusion that the occurrence of calcite and aragonite requires different chemical conditions, with the latter being quite unusual in seawater. Aragonite and calcite differ in their stability. Aragonite is less stable than calcite and may recrystallize into calcite through a process called “diagenesis” under normal conditions. However, the reverse process, where calcite transforms into aragonite can only occur under high pressures [
3,
4,
5]. Therefore, the simultaneous precipitation of these two mutually exclusive calcium carbonates in a single shell valve and their contact as external and internal shell layers certainly requires particular control. The presence of unique biochemical assemblages, specifically associated with the calcite and aragonite layers, was regarded as a resolution to the simultaneous crystallization phenomenon and underwent thorough investigation [
6,
7,
8,
9,
10,
11]. The “extra-pallial model” e.g., Refs. [
12,
13,
14] hypothesized that some mechanism in dedicated spaces below the mineralizing mantle layer enables the calcium carbonate concentration to increase up to precipitation, whereas the mineralizing mantle cells could secrete appropriate molecular assemblages to produce the specific morphologies of the mineral unit. From this standpoint,
Pinctada margaritifera supported the biochemical specificity of the calcite and aragonite areas [
15], but their hypothesized occurrence in separate extra-pallial compartments was inappropriate: no anatomical separation exists between the calcite and aragonite producing sectors in the Pteriomorphian Pelecypods.
This conception has become progressively obsolete due to three independent results. Crenshaw [
16,
17] presented a generalized counterargument to the “extra-pallial compartment” theory, concluding that mineralization occurs through “direct contact” with the mineralizing cell layer (i.e., the outer cell layer of the mantle in mollusks). In the same period, Mutvei [
18] introduced the concept of “layered growth” of calcareous units, showing that the growth mode of nacreous tablets is a pulsed process that repeatedly produces micrometer-thick layers.
About twenty years later, Beniash et al. [
19] presented the hypothesis of intracellular concentration of amorphous calcium carbonate within cells of the mineralizing layer. This is a basic change with respect to common interpretation. Calcium carbonate concentration does not occur in extra-pallial compartments. Crystallization occurs only outside the cell membrane after exocytosis (transit through the cell membrane) of the amorphous carbonate, which associates with appropriate organic assemblage, driving the determination of mineralogy (calcite or aragonite) as well as size and shape of the mineral. This mineralization mechanism was later extended to most of the calcareous producing phyla [
20].
Importance of this new concept cannot be overstated. Not only can the two previous observations be integrated into this new mineralization scheme, it also allows for a new interpretation of shell structures. Instead of compartments producing calcareous units with homogeneous organization and composition throughout the dedicated “extra-pallial spaces”, the sequence of structural changes that occur during shell growth can be investigated.
Sequential Evolution of the Calcite Units Produced during Layered Shell Growth
After metamorphosis, the production of calcite by the mineralizing cells of the mantle becomes active. However, recent advancements in our understanding of biomineralization have led to a paradigm shift, replacing the traditional view of structural units as static entities with dynamic products of an ongoing metabolic process.
A previous study dealing with the prismatic layer in the shell of
Pinctada margaritifera exemplifies substantial changes brought to the common view regarding shell structure. In agreement with ancient anatomical schemes (Figure 2 in ref. [
21]), each micrometer-thick growth layer comprises a regular series of distinct calcite structures that are revealed in the mineralizing mantle of the outer mantle grove preceding the polygonal units of the prisms and their own evolution.
The prismatic layer of the Pinctada margaritifera appears as a diachronic structure built by superposition of regularly evolving biochemically driven structures.
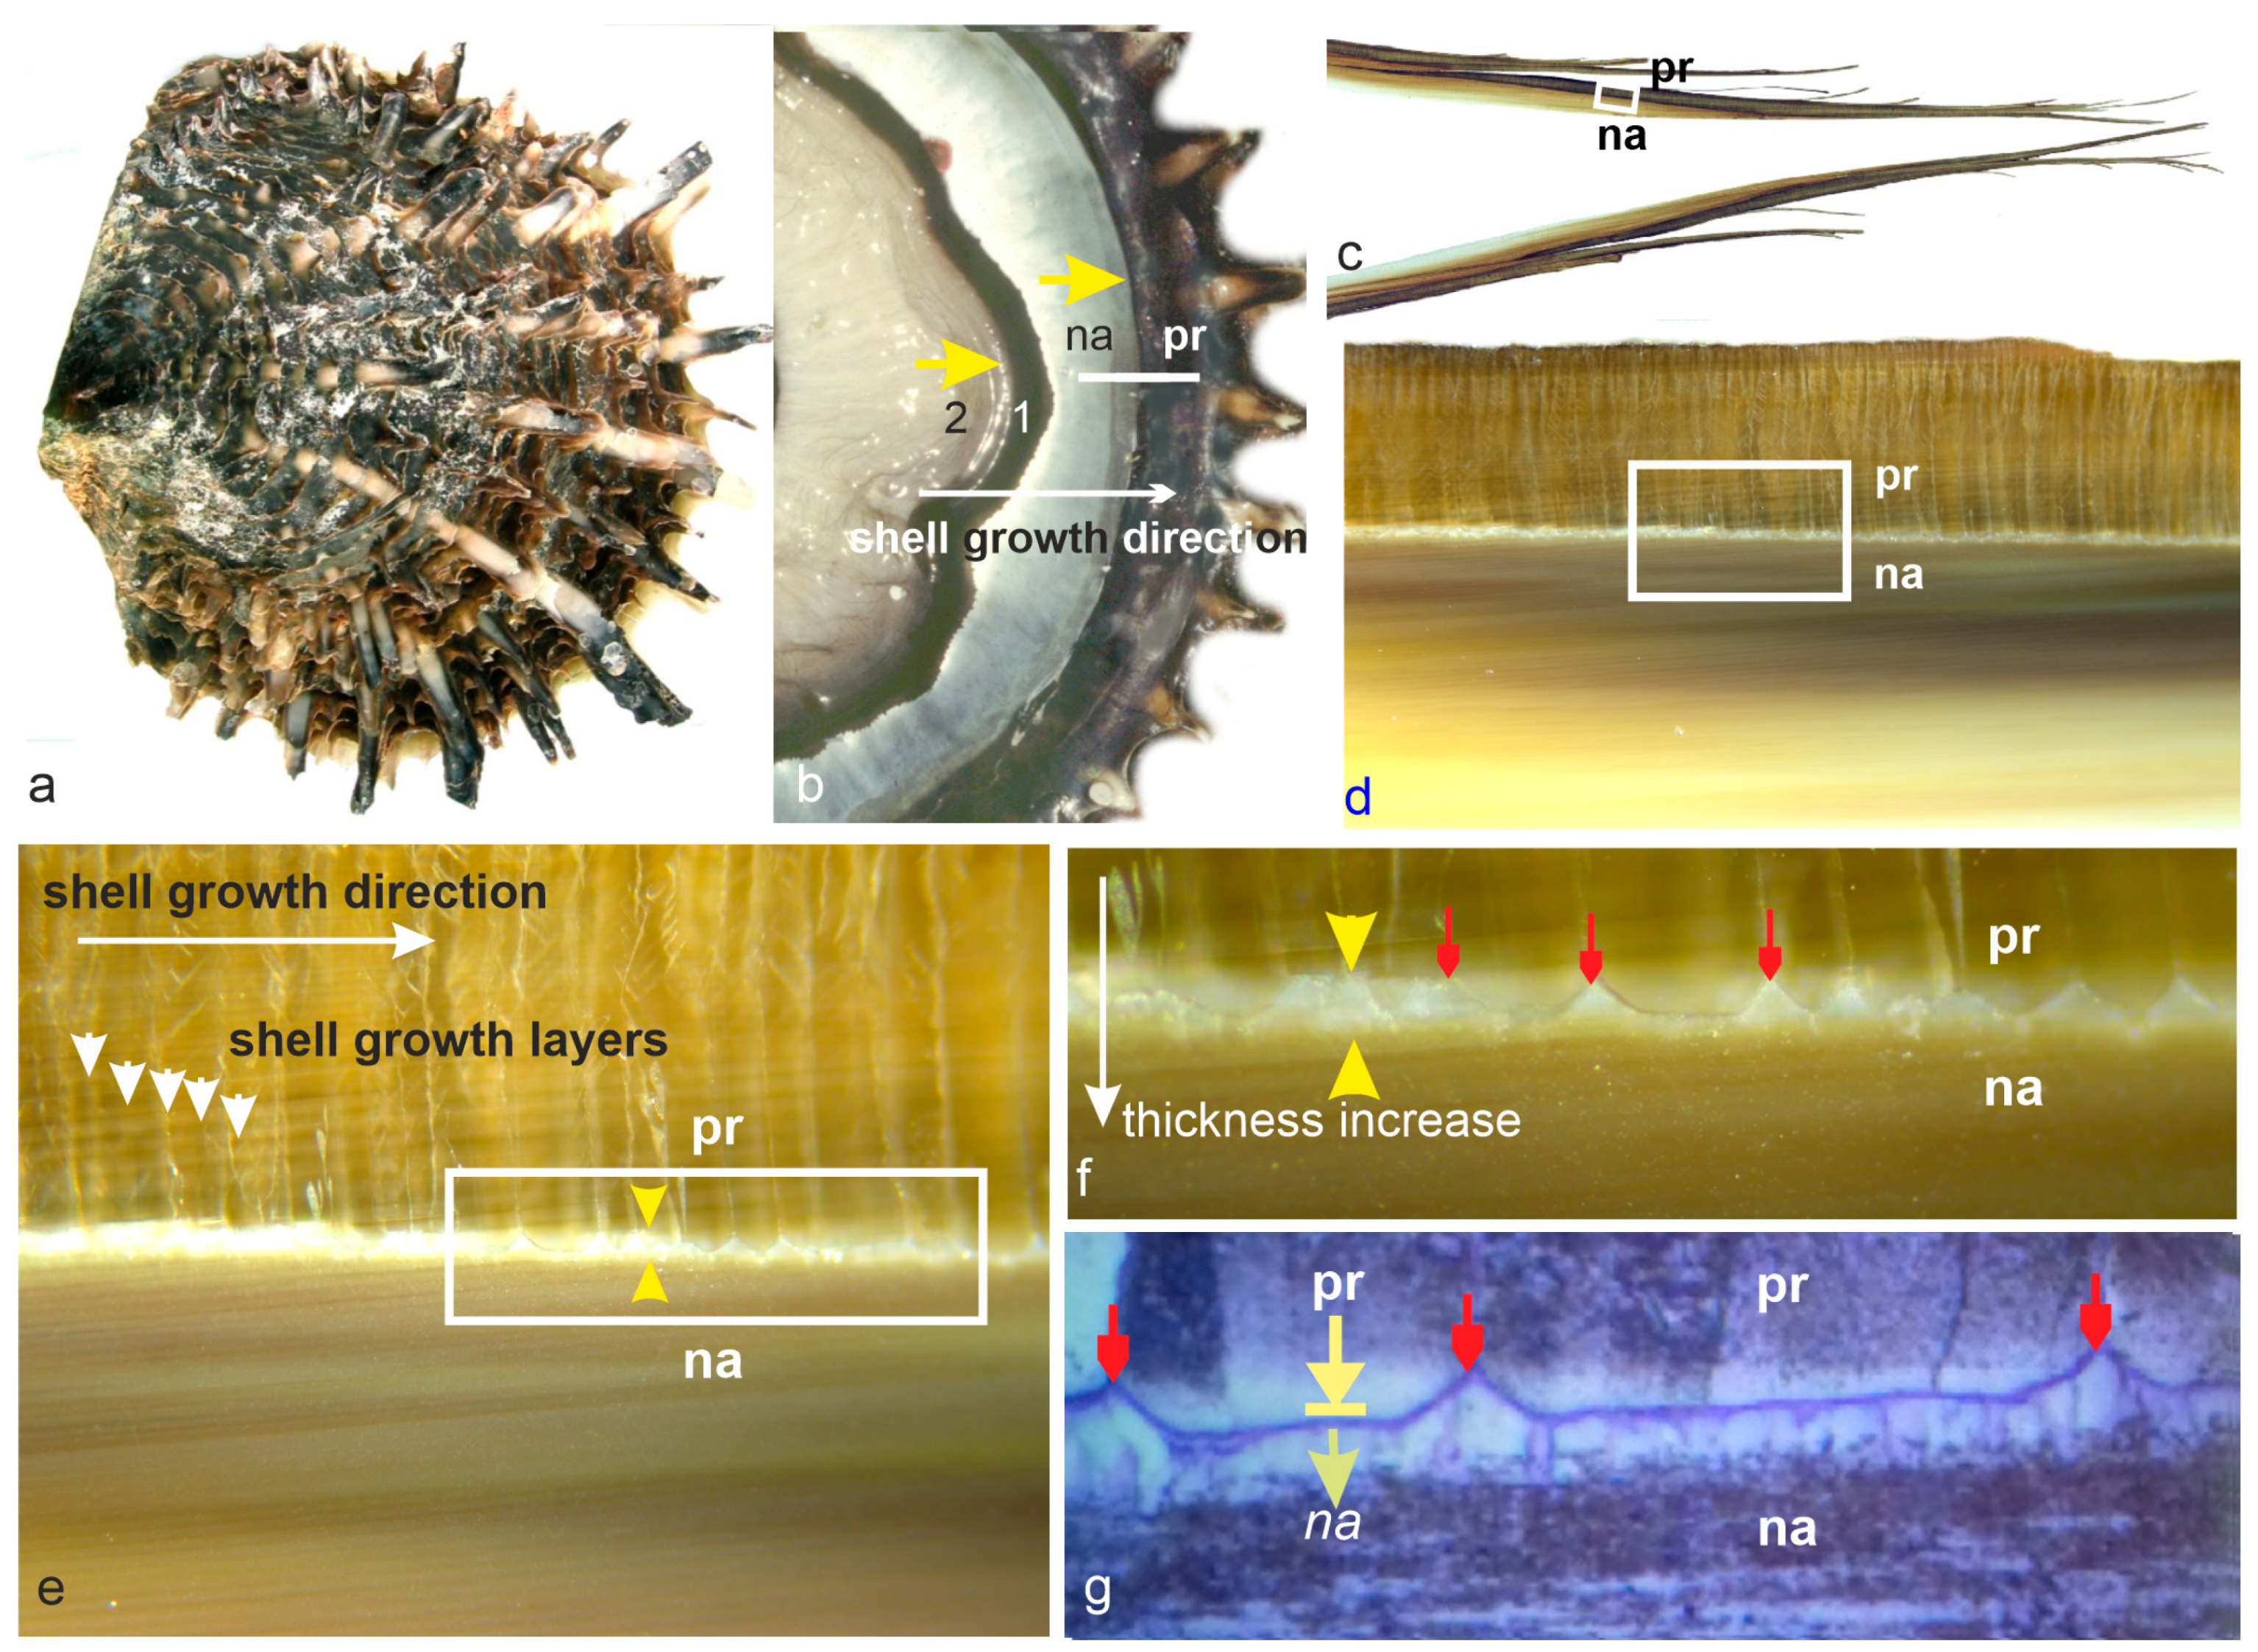
This evidence obviously raises questions about the final stage of the prismatic layer and how the aragonite materials appear onto the last growing calcite layers. At a macroscopic scale (
Figure 1), progression of the aragonite layer onto the internal side of the calcite layer appears to be a simple process. The common view is that elongation of the prisms (i.e., the thickness increase of the prismatic layer) is simply interrupted by this outward extension of the nacreous layer.
A recent study has provided detailed crystallographical characterization of the earliest aragonite units in
Pinctada fucata at the calcite/aragonite interface [
22]. The focus of this study was solely on the development of the aragonite material, and no changes to the classical understanding of the underlying calcite compartment were found.
In the present paper, observations deal with an equivalent interface in
P. margaritifera but involve both sides of the separating membrane (
Figure 1g). In contrast to the common view, we found evidence that prism growth is not interrupted by occurrence of aragonite. In fact, prismatic mineralization is reduced and finally interrupted before the beginning of nacreous deposition. This suggests that end of the calcite mineralization area is included as a biological term in the series of structures successively produced since the post-metamorphic occurrence of calcite (see Discussion 4.1).
2. Materials and Methods
2.1. Materials
The specimens used were produced and grown in the IFREMER/DRM hatchery of the Vairao biological station, Tahiti, French Polynesia. In this station continuous cultivation provides samples grown under controlled conditions.
Utilizing hatchery facilities, we could track the evolving structures generated during the individual development of this prominent pearl-producing species. The calcite outer layers were shown to be produced by a stepping growth process during which a sequence of biologically controlled mineralization phases were progressively produced [
21]. Here, we focus on the unique characteristics of the distal portions of the calcite prisms.
2.2. Methods
Optical microscope data were obtained at the Museum National d’Histoire Naturelle (CRC laboratory) using a Zeiss Standard Universal in white light or epifluorescence mode (365 nm) and an AXIO-zoom system (Zeiss, Oberkochen, Germany).
Scanning electron microscope (SEM) observations were conducted using a Philips 505 and a Philips XL30 instrument in secondary electron mode after Au-Pd coating (Philips, Amsterdam, Netherlands). Uncoated preparations were observed using an FEI QUANTA FEG 600 ‘Philips, Amsterdam, Netherlands) in low vacuum and back-scattered electron (BSE) and secondary electron (SE) modes (Max Planck Institute of Colloids and Interfaces, Potsdam, Germany) and a Phenom ProX (Thermo Fisher Scientific, Waltham, Massachusetts, USA) in back-scattered electron mode (BSE). Etching of polished surfaces was carried out using the Mutvei solution [
23] allowing precise description of the growth patterns in skeletal units.
X-ray Absorption near Edge Spectrometry (XANES) were obtained at the ID21 X-ray micro-spectroscopy beamline of the European Synchrotron Radiation Facility (ESRF, Grenoble, France) using the scanning X-ray microscope. The X-ray beam was focused to a submicron X-ray size using a Kirkpatrick-Baez mirrors system. A germanium detector (Gamma-Tech, Princeton, NJ, USA) was mounted perpendicular to the beam to collect the fluorescence emission photons. XANES energy scan at the S K-edge (2.472 keV) was achieved using a fixed-exit double-crystal Si(111) monochromator. XANES spectra were acquired between 2.13 keV and 2.2 keV with 0.2 eV steps. The X-ray microscope was operated under vacuum to avoid the strong absorption of S emission lines by air. Reference spectra of standard compounds were acquired for energy calibration in unfocused mode, and the Hp/Ge detector was replaced by a Si photodiode to measure the high-intensity fluorescence signal.
TOF-SIMS (Time-of-Flight Secondary Ion Mass Spectrometry) images were obtained with a standard commercial TOF-SIMS IV reflectron-type mass spectrometer using Bi3+ cluster ions (25 keV) from a bismuth liquid metal ion gun (SIMS IV (Ion-Tof GmbH, Munster, Germany). In the first mode, a 500 µm × 500 µm area was scanned with a spatial resolution of 2 µm and high mass resolution (M/∆M > 5000 at m/z > 500) at a primary ion dose of 3.4 × 10¹¹ ions·cm−2. In the second mode, a 100 µm × 100 µm area was imaged with a spatial resolution of 400 nm but without high mass resolution, and a higher primary ion dose of 1.0 × 10¹² ions·cm−2. A more recent method achieves a similar 400 nm spatial resolution while maintaining a higher mass resolution. A low-energy electron flood gun (20 eV) was used to neutralize surface charges in all cases. Mass calibration used internal ion peaks (H+, C+, CH+, CH2+, CH3+, and C3H2+) in positive ion mode, resulting in mass accuracies within a few tens of ppm.
3. Results
Unlike previous studies that relied on planar observation surfaces, the transitional process between calcite and aragonite domains is inherently three-dimensional. The calcite compartment, the separating membrane, and the earliest aragonite units can be individually characterized, yet their spatial intermingling allows for repeated observations.
3.1. Structural and Compositional Data about the End of Prism Growth
The most interpretable data concerning the changes in metabolism at the conclusion of prism growth are the diminishing thicknesses of the growth layers, as illustrated in
Figure 2a,b. During prism growth, the thickness of the growth layers remains regular (
Figure 2a: pr. elong. yellow arrow) in spite of minute variations likely due to environmental conditions (trophic resources, thermal conditions, etc.). Note that these temporal variations are recorded simultaneously by the neighboring prisms in the calcite mineralizing area, resulting in flat growth of the calcite surface. Parallel lines made visible by etching solution [
23] reveal the successive positions of the mineralizing mantle, with each growth layer corresponding to a stepping expansion unit in the lateral expansion process of the shell (sh. exp. white arrows).
Aging of the cells forming the calcite layer areas is first visible though the decreasing thickness of the growth layers, as marked by the series of yellow arrows focusing on a reference layer (
Figure 2a). An enlarged view of this prism (
Figure 2b) shows that this growth layer is the last one with equal thickness and diameter to the previous ones. The next few growth layers are thinner, as marked by shorter white lines. These growth layers are also narrower, marking a regression process that ends about eight growth layers later. The prism has not finished growing. Owing to the directional stepping displacement of the calcite producing group of cells, note that in the previous prism the number of additional growth layers is lower (green arrows). It is important to note that regression of the thickness of the growth layers is correlated with a decrease in their diameters, resulting in the formation of a curved-end surface.
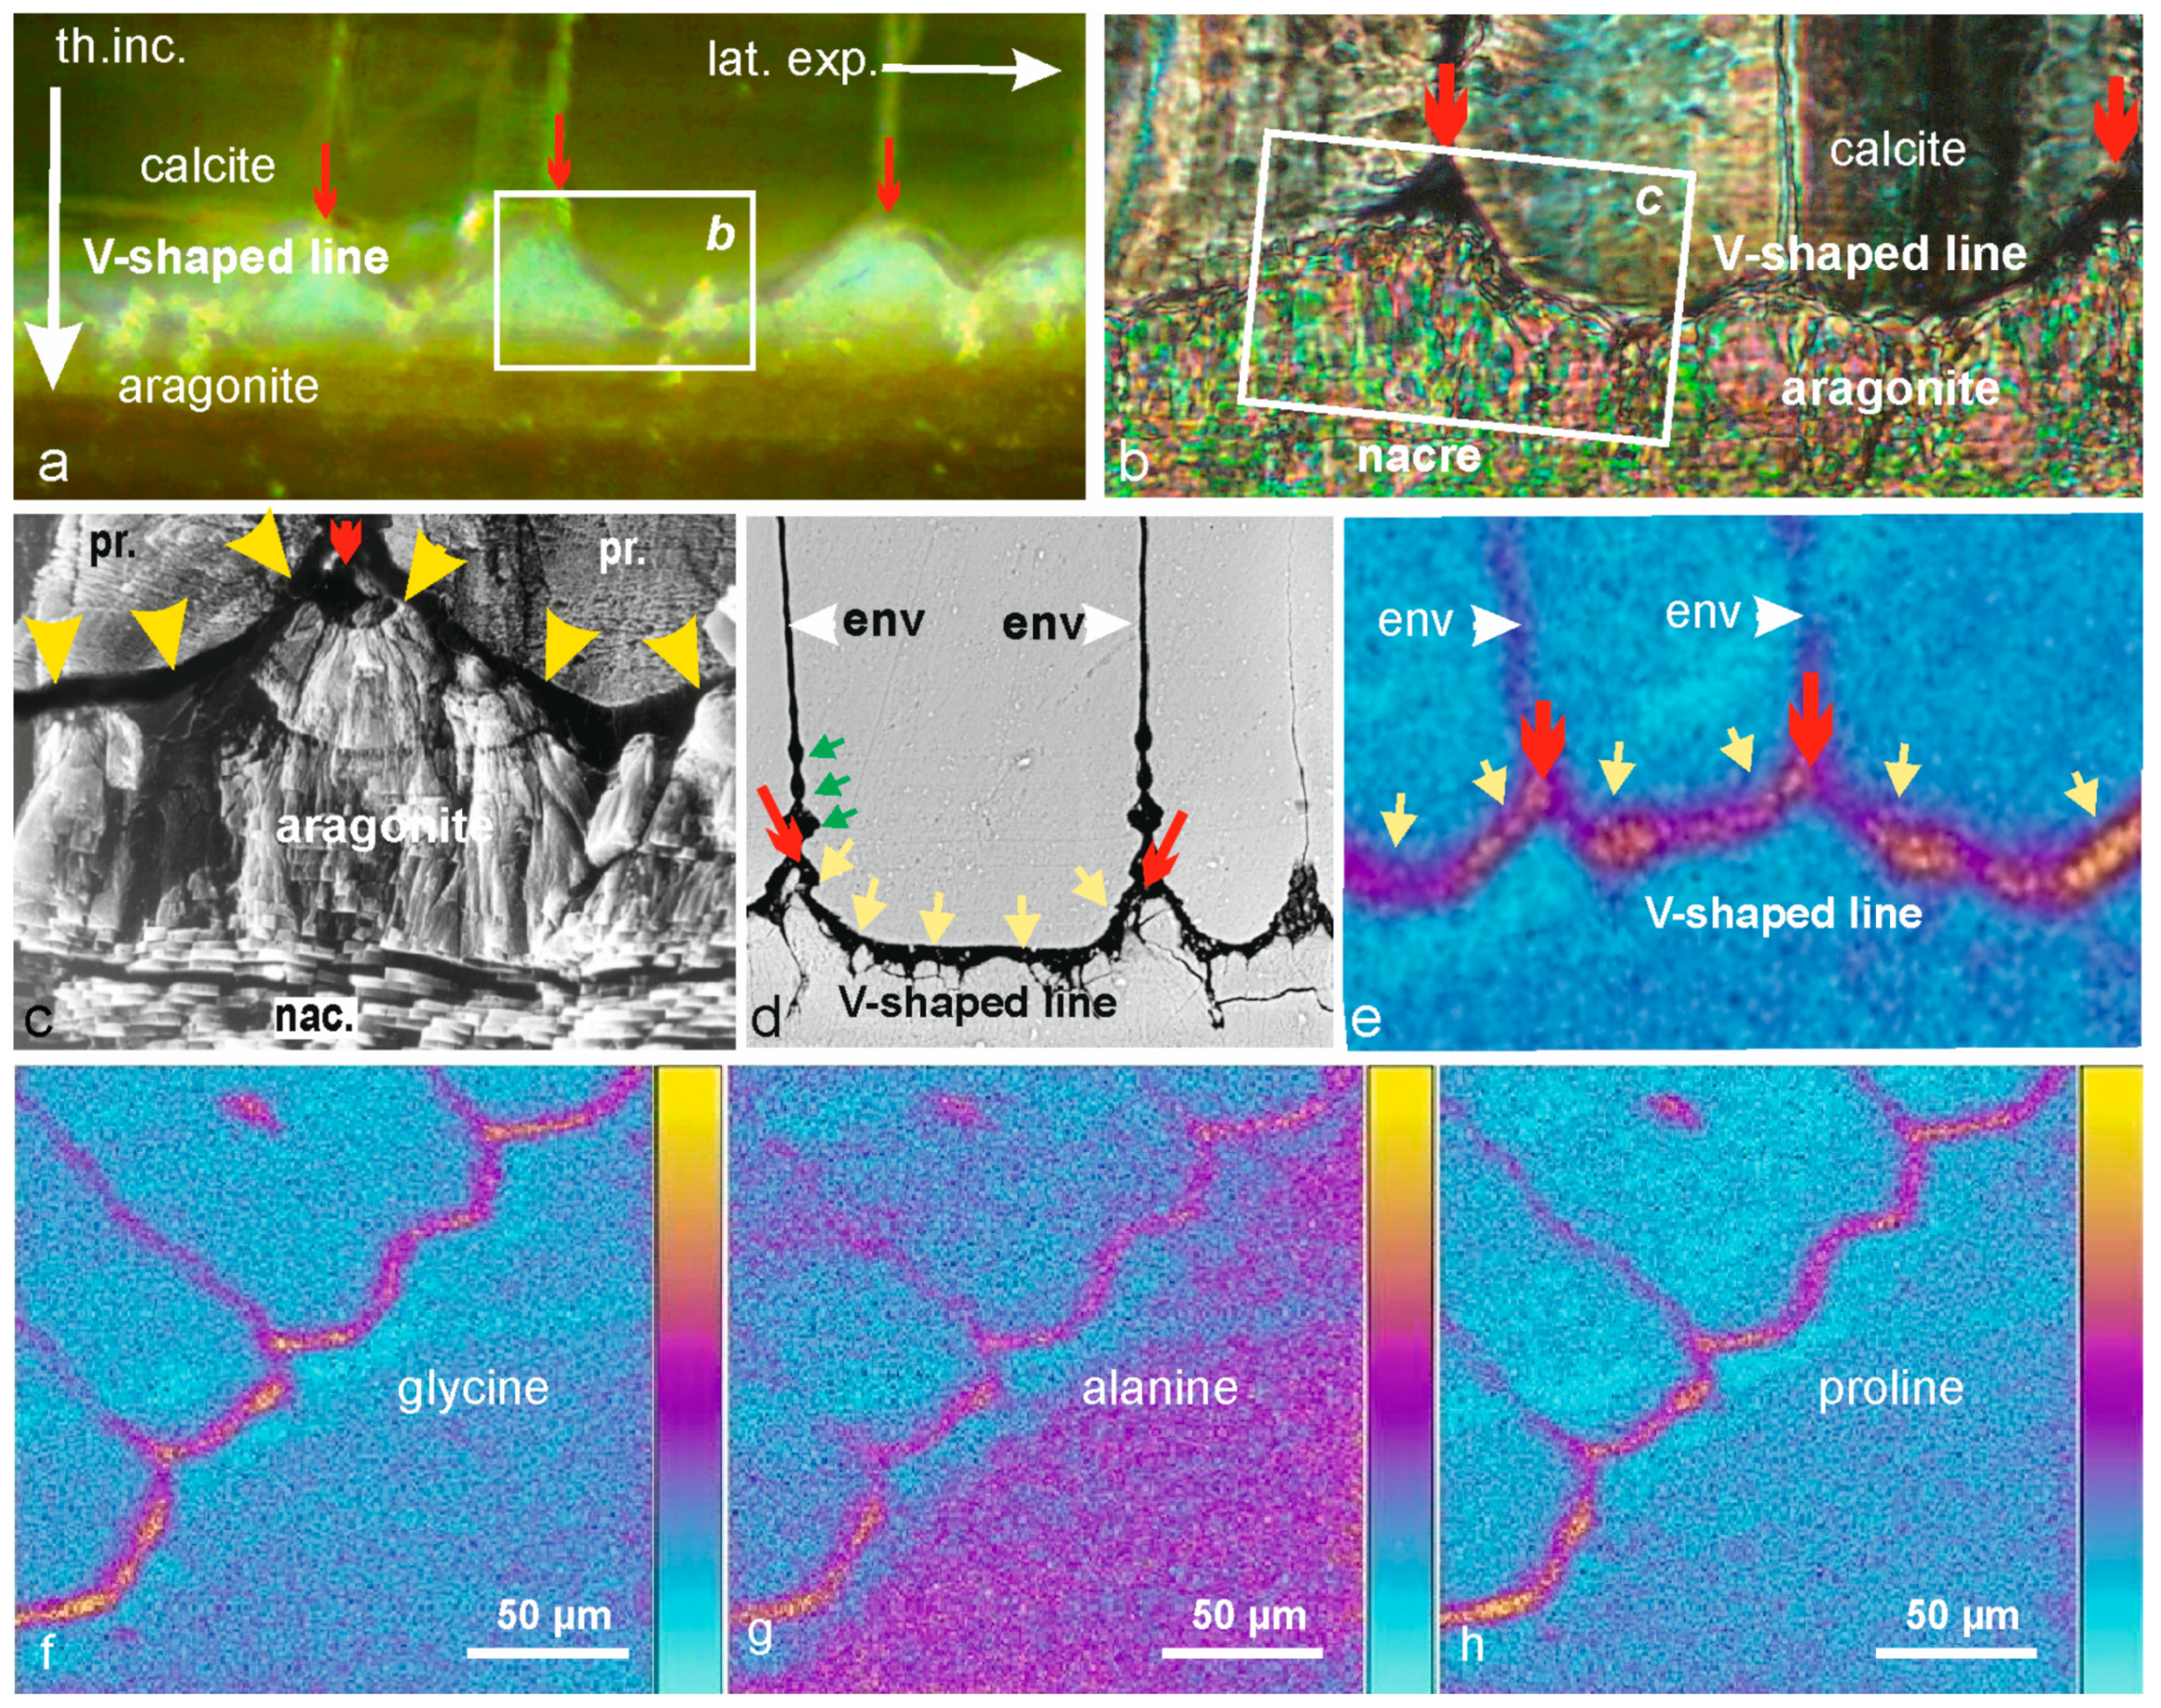
The aging of the mineralizing cells during the stepping movement of the mineralizing mantle is also visible through multiple changes in their secretion activity. Not only is the quantity of the mineralizing compounds reduced, but biochemical maps have revealed that the composition of this organic phase is also modified in this final period of prism growth.
Figure 2c,d obtained using synchrotron-based XANES, showcase a change in the relative concentrations of organic sulfates. During the growth phase, the organic sulfates remain nearly constant (
Figure 2c: white arrow). However, during the terminal phase, their relative concentration significantly increased (
Figure 2d). The increase in organic sulfates corresponds to the onset of calcification, suggesting that organic sulfates may play a role in the calcification process.
A further metabolic alteration in prism production is evident in longitudinal sections of the prisms. The prism envelopes, which consistently maintain uniform thickness throughout the growth process, start to lose their structural integrity early in the process of prism regression (
Figure 2b,e–g). This change in envelope structure was already discernible in the morphology and chemical composition of the envelopes (
Figure 2d: env. reg.). The emergence of spherical nodules is directly linked to the appearance of circular holes in the membranes (
Figure 2f).
It is important to note that this ending process is linked to the aging of the mineralizing cells, as observed at a very local scale. For example, in
Figure 2b, two neighboring prisms exhibit a significant difference (green arrows) in the number of growth layers, correlated with the direction of the shell expansion. These synchronous changes in prism properties indicate coordinated regression of calcite mineralization in the corresponding mineralizing cells. This has a morphological consequence: instead of a flat mineralization surface on which nacreous productions can simply extend, the calcite surface becomes marked with a polygonal network of V-shaped depressions caused by the reduction of mineralizing surfaces (
Figure 2g). Although the ends of the calcite prisms suggests possible deposition of aragonite, an unexpected event occurs on this disturbed calcite surface, indicating that regression of prism production was only a preliminary step in the closure of calcite biomineralization.
3.2. The V-Shaped Line: Deposition of an Organic Membrane Dedicated to Closure of the Calcite Biomineralization Area
Various methods have been employed to investigate the contact between calcite and aragonite layers in
Pinctada shells, each providing unique insights into the structural organization at this interface (
Figure 3a–c). Microscopic observation with reflected natural light (
Figure 3a) shows the V-shaped line whose origin is marked by red arrows. A similar thin section observed in transmitted polarized light emphasizes the crystallinity of both calcite and aragonite mineral material units, but the V-shaped line is hardly visible (
Figure 3b). The scanning electron microscopy provides better structural information about the topographic relationships between the organic and mineral phases as shown by
Figure 3c. At the end of two neighboring calcite prisms, the V-shaped surface (yellow arrows) appears as dark and uniform. This is because organic materials have a lower reflective power than calcium carbonates.
Figure 3d obtained by SEM BSE provides a clear view of the organic prism envelopes, including the growing envelopes and the final coverage of the prism, which appears continuous. However, there is a distinct difference between the lateral prism envelopes and their terminal organic structure (yellow arrows).
Essential information was obtained [
25] using Time Of Flight Secondary Ion Mass Spectrometry (TOF-SIMS), which separates chemical components of the organic membrane. By moving the sample in two dimensions, TOF-SIMS can create a biochemical map of the studied area. The main result of this compositional analysis is that the organic membrane covering the prism surfaces during their regression phase is distinct from the envelopes produced during prism growth (
Figure 3e–h). The red arrows at the end of prism envelopes (
Figure 3d,e) are more than just a sign that the prisms have closed through an inflexion of their envelopes. As seen in the global (
Figure 3e) and specialized mappings (
Figure 3f–h), the red arrows mark the end of the calcite biomineralization process that began in the post-metamorphosis phase of shell development [
21,
25].
This interpretation is further strengthened by the next step in shell ontogeny: the structural pattern of the earliest aragonite deposition.
3.3. The Initial Phase of Aragonite Biomineralization on the V-Shaped Surfaces Provides Evidence about the Role of the Covering Organic Membrane
No area of Mollusk shells has been more thoroughly observed than the contact line between the two main shell layers: the calcite prismatic layer and the nacreous aragonite layer (
Figure 4a,b). In the cultivated pearl industry, for example, the position of the optimal cutting site on the mantle depends on the opinions of the grafters about the distance to be maintained within the aragonite-producing mantle for a successful outcome. Closer examination of the aragonite layer margin justifies this empirical practice. Upon closer observation, the expanding margin of the aragonite layer cannot be considered a line. Rather, it is a complex three-dimensional region where the progressive expansion of aragonite onto the calcite substrate follows the process illustrated in
Figure 4c–j.
Optical microscopy using reflected natural light (
Figure 4c) reveals the progressive formation of the aragonite surface by a polygonal network. SEM provides a clearer view of the properties of this network. Observation reveals that aragonite deposition exactly follows the polygonal network of the V-shaped depression created by the progressive regression of the growth layer surfaces and the final end of calcite deposition (
Figure 4c, yellow arrows).
Detailed observation of the early deposition of aragonite reveals a significant pattern: the tiny aragonite grains are never deposited onto the calcite surface (although largely accessible, as shown in
Figure 4e: calc), but exclusively in the deeper parts of the organic membrane covering the V-shaped depression. Even when the size of the aragonitic surfaces increases, no direct contact between calcite and aragonite is ever visible (
Figure 4f,g). Aragonite deposition never exceeds the limits of the membrane. This depositional pattern leaves no doubt about the role of the covering membrane which morphologically appears as an expansion of the prism envelopes. TOF-SIMS has established its specific composition, and the earliest aragonite deposition reveals its role. The membrane exerts a decisive influence on the deposition of aragonite by some physical and/or chemical properties, preventing the direct deposition of aragonite onto the calcite surface.
No exception has ever been found to this precise control of aragonite occurrence. On shells with diameters of up to 15–20 cm (larger than the shells used for grafting), observation of aragonite margins reveals an equivalent pattern, although the depth of the V-shaped depression is attenuated due to a slower lateral expansion (
Figure 4i,j).
Our observations strongly suggest that aragonite biomineralization does not occur directly atop the calcite surface by simply expanding over it. Rather, prism regression involves a coordinated dismantling of all structural components, including the cessation of calcite deposition. This dismantling process alone is insufficient to initiate aragonite deposition.
Deposition of a compositionally specific membrane starting in the deeper parts of the V-shaped polygonal network formed by regression of the prism growth is a prerequisite for deposition of the granular spots (
Figure 4i,j). This depositional pattern is perfectly maintained in even the largest shells, and we can easily verify that the spots of tiny aragonite grains only occur on the specific covering membrane and never on the largely accessible calcite surface, which is only a few micrometers ahead. The prism covering membrane remains an efficient barrier preventing calcite/aragonite contact.
4. Discussion
From a biological perspective, preventing contact between the outer calcite and the inner aragonite layer demonstrates a remarkably coordinated biological mechanism.
It is evident that a calcite/aragonite contact is as unacceptable in the biology of
P. margaritifera as it has been demonstrated to be in sedimentary environments. Notably, this stands in stark contrast to the conventional “aragonite expansion” hypothesis, which proposes an interruption of calcite deposition through a straightforward outward progression of aragonite. The confirmation of the prism’s stepping growth has significant implications for understanding this example of biologically induced calcite formation (
Section 4.1). Furthermore, as
Pinctada are a renowned producer of seawater pearls, the implications of this discovery can be explored in the context of pearl cultivation methods (
Section 4.2).
4.1. Improving Understanding of the Calcite Deposition Cycle in the Pinctada margaritifera
A previous study of the initial stages of calcite mineralization following metamorphosis [
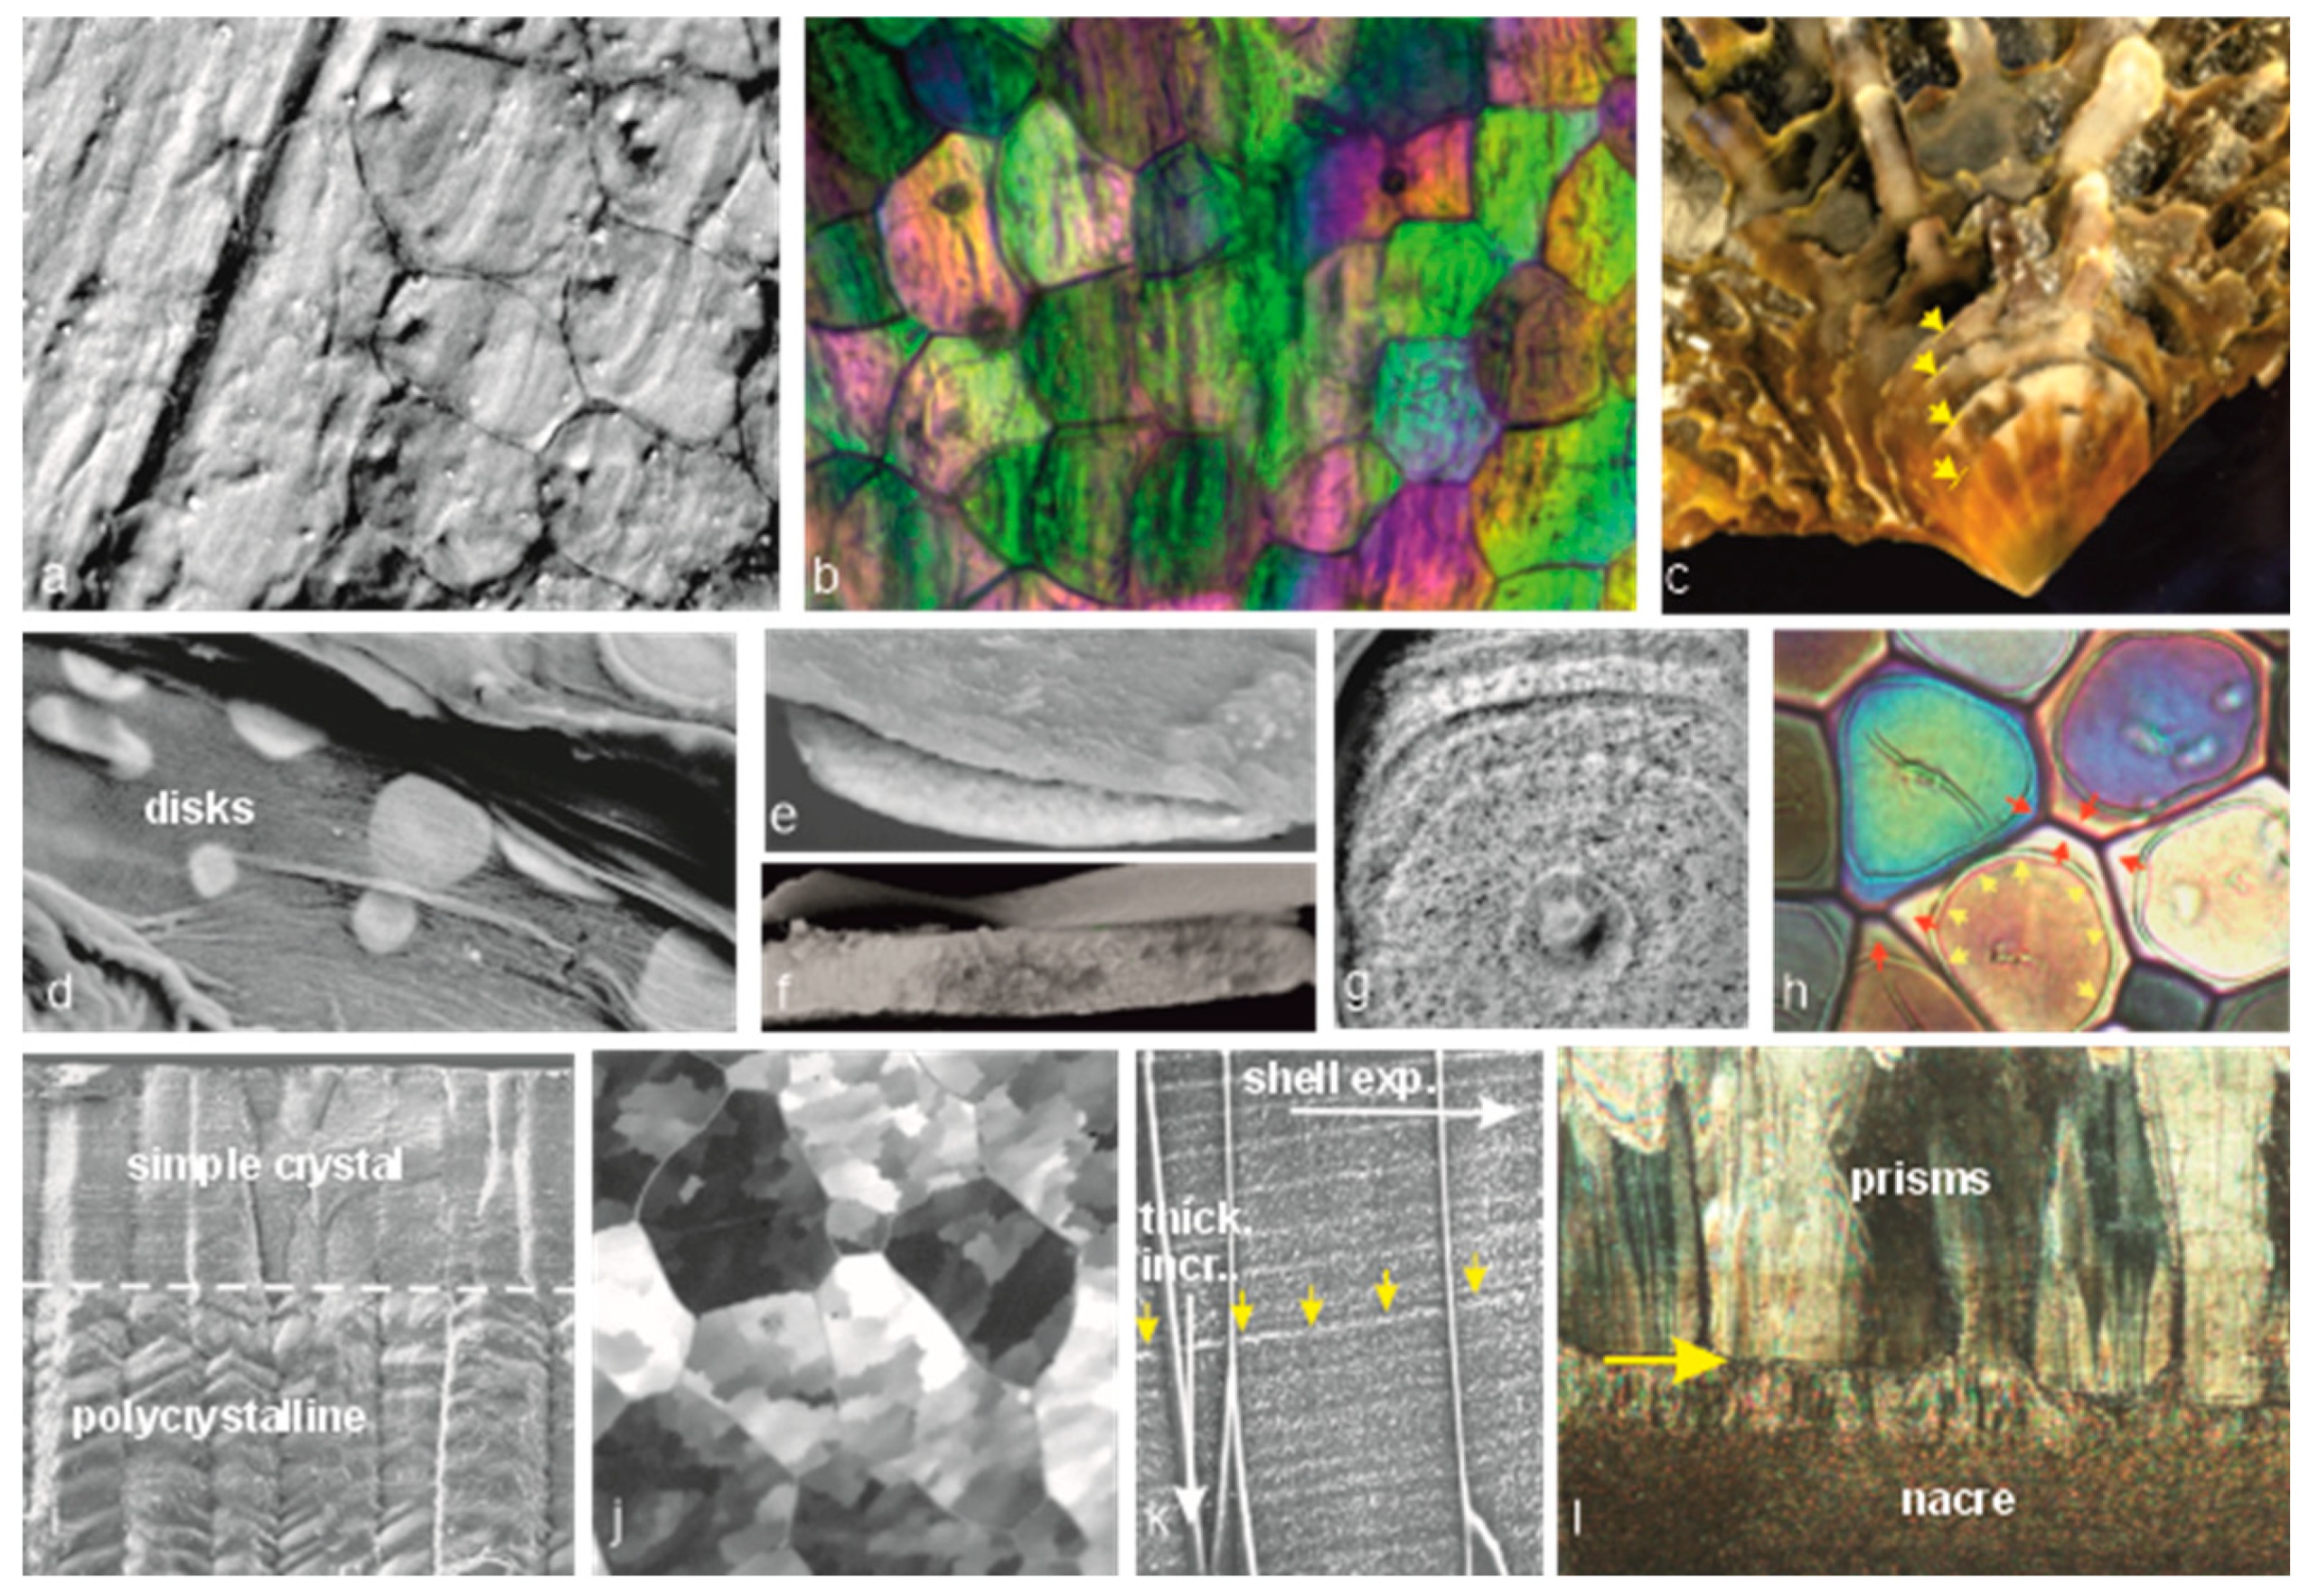
26] concluded that the development of the outer shell layer involves the sequential deposition of calcite and secretion cycles under continuous biological control. This is evident from the distribution of organic components during each step. The calcite prismatic units are secondary structures, the origin of which is explained by the previous structural steps (summarized in
Figure 5).
Previous results (see
Figure 2) draw attention to the loss of the biological control that occurs at the end of the calcite deposition (
Figure 5l, yellow arrow), after the regular series of calcite layers (exemplified in
Figure 5k).
A significant shift in the biomineralization paradigm is the introduction of a temporal aspect to the study of the biomineralization processes. Rather than solely examining the overall biological composition, such as the “secretory repertoire” of calcite or aragonite layers (as described in [
15]), the sequential structural changes that occur within specific microstructures, such as the calcite prisms of
P. margaritifera, offer us a means to investigate compositional alterations throughout the depositional cycle.
By considering the stepping developmental sequence, we can effectively trace the calcite biomineralization cycle from its inception to its completion. The stepped growth of the calcite layer in the Pinctada shell, encompassing the outer mantle groove, can be viewed as a chronologically ordered record of the identified mineralization cycle. Chemical investigations into this section of the shell can be conducted by sequentially scrutinizing the structurally defined sectors. The ultimate goal is to extend this sectorial approach to genomic studies. In this domain, more so than any other, acquiring data from meticulously characterized structural sectors is an indispensable prerequisite to comprehending the biological program that orchestrates the structural and crystallographic transitions evident during the prism’s ontogeny.
Note that a sequential approach to the microstructural units in the shell layers is also essential for comparative studies, as it allows for more accurate descriptions of the corresponding sectors and the identification of relevant taxonomically linked similarities and differences.
4.2. Occurrence of Calcite in Cultivated Pearls
Cultivated pearl production began in the early 20th century in Japan, when the “grafting” process became efficient after about three decades of research. The grafting process involves cutting a small piece of the mantle from the nacre-producing area of a pelecypod and introducing this “graft” into another specimen of the same species. Of course, the greatest attention is paid to keeping the “host” or “receiver” specimen alive during and after grafting, as it will be the pearl producer for the next two years. In the final practice that made Mikimoto successful (and is still in use today), the graft is associated with a round-shaped piece of nacre (the nucleus, prepared from the shells of other species, usually freshwater species). Care must be taken to place the nacre-producing side of the graft in contact with the nucleus. In the first developmental step, the graft wraps around the nucleus, which can reach several millimeters in diameter depending on the grafter’s choice. Then, the mineral layers are superimposed to form an expected round-shaped pearl.
Kawakami’s discovery of calcite in the early developmental stages of pearls was a significant finding [
27,
28]. Further microstructural examination of grafted
Pinctada margaritifera pearls revealed the importance and diversity of this calcite crystallization process, which is responsible for most of the morphological disturbances in pearls [
24]. Additional information was obtained using a synchrotron-based instrument that combines high-resolution observation with crystallographic characterization. It was established that, in the earliest developmental stages, calcite and aragonite units crystallized simultaneously in the same growth layer [
26].
This occurrence of calcite in pearls contradicts the perfect separation between calcite and aragonite mineralization areas as it has been established in the Pinctada shells. Diversity in calcite structures and duration of this abnormal calcite deposition process may contribute to elucidating the overall process.


