Article

Evolution Characteristics through Thermo-Rheological Lithosphere of the Liaonan Metamorphic Core Complex, Eastern North China Craton

1
The Institute of Hydrogeology and Environmental Geology, Chinese Academy of Geological Sciences, Shijiazhuang 050061, China
2
Technology Innovation Center for Geothermal & Hot Dry Rock Exploration and Development, Ministry of Natural Resources, Shijiazhuang 050061, China
3
State Key Laboratory of Geological Processes and Mineral Resources, China University of Geosciences, Beijing 100083, China
*
Author to whom correspondence should be addressed.
Submission received: 14 October 2022 / Revised: 26 November 2022 / Accepted: 29 November 2022 / Published: 6 December 2022
(This article belongs to the Special Issue Mineral Resources in North China Craton)

Abstract

:
Metamorphic core complexes are developed in crustal activity belts at the continental margins or within continents, and their main tectonic feature is that the ductile middle crust is exhumed at the surface. The deformation properties are closely related to the geodynamic process affecting the continental crust. However, the evolution of the metamorphic core complexes after their formation is still unclear. The Cretaceous Liaonan metamorphic core complex developed in the eastern North China craton provides an ideal environment to study its evolution. In this study, we estimate the paleo-temperature and paleo-stress at the time of formation of the metamorphic core complex dynamical recrystallization of quartz and calculate the thermo-rheological structure of the present Liaonan metamorphic core complex by one-dimensional steady-state heat conduction equation and power-creep law. The results show that compared with the Cretaceous period, the geothermal heat flow value of the present Liaonan metamorphic core complex decreases from 70–80 mW/m2 to 49.4 mW/m2, the thermal lithosphere thickness increases from 59–75 km to 173 km, and the brittle transition depth increases from 10–13 km to about 70 km, showing coupling of the crust–mantle rheological structure. We speculate that the evolution of the thermo-rheological structure of the Liaonan metamorphic core complex is possibly caused by rapid heat loss or lithospheric mantle flow in the Bohai Bay Basin.

1. Introduction

Continental metamorphic core complexes (MCCs) are commonly developed in the crustal extensional environment [1,2]. Typical MCCs consist of a weakly metamorphosed brittle fault cover rock, a low-angle detachment fault, and a domed core of metamorphic rocks and migmatites [3,4]. Most of the MCCs are developed with a main detachment fault zone and unidirectional shearing [5]. MCCs may be evidence of lithospheric thinning or delamination [3,6], resulting from flow in the lower crust under the influence of thickened and thermally softened and far-field extensional stresses [4].
However, most studies have focused on the formation mechanism, the rheology of the middle and lower crust, and the constraints on regional continental extension [4,7,8], while lacking sufficient attention to the post-formation evolution of MCCs.
The Cretaceous Liaonan metamorphic core complex (LNMCC) is regarded as a typical Cordilleran-style MCC developed in the Liaodong Peninsula (LP), China [3,8]. The ductile middle and lower crust were exhumed at the surface since the Late Cretaceous as a result of the regional extension. Since the Indonesian orogenesis, significant Mesozoic magmatism and Late Mesozoic extensional tectonics occurred in LP [3,9], which makes it one of the most typical and intense areas of the North China craton (NCC) destruction due to its temporal and spatial consistency with the lithosphere thinning of the NCC.
The thermo-rheological structure is an essential constraint on the nature of the lithosphere [10,11]. This thermo-rheological structure with brittle and ductile layers enables the corresponding structural deformation, such as compression and extension, by adjusting the thickness of layers and the corresponding thermal state to tectonic forces [12]. Therefore, the evolution of MCCs can be constrained by the thermo-rheological state. The difference in thermo-rheological properties between the formation and present MCCs can be analyzed to explore the evolution of MCCs after formation.
Temperature and differential stress within the lithosphere are the main governing parameters of its thermo-rheological structure. The present thermal structure of the lithosphere can be estimated by one-dimensional (1D) steady-state heat conduction [13,14,15]. According to the temperature distribution with depth, the lithospheric rheological structure can be obtained from the brittle failure equation and the ductile rheology of different rock types [16,17]. The paleo thermo-rheological structure of the MCCs at the time of formation time is a challenge but can be estimated from the dynamic recrystallization of minerals. The temperature has an important effect on mineral deformation. Various mineral thermometers were created for the measurement of metamorphic temperature [18,19,20,21,22]. Dynamic recrystallization of the grain size of quartz [23,24,25] is the common method to calculate the deformation temperature. Differential stress can be derived by a variety of methods. For MCCs with extensive deformation in the lower part of the detachment fault, quartz is the main deformation mineral, which makes dynamic recrystallization grain size of quartz also a suitable method for paleo-differential stress calculation [26,27]. Pure quartz layers are usually selected for measurement because the presence of other minerals (such as white mica) can limit the migration of quartz grain boundaries to form smaller grains [28,29].
In this study, we use mineral data obtained from the detachment fault of the LNMCC and apply the recrystallization grain size measurements of quartz to calculate the paleo-temperature and paleo-differential stress, in order to obtain the paleo thermo-rheological structural characteristics of the LNMCC. We collected heat flow, thermal conductivity and radiogenetic heat production data for each layer of the lithosphere of the LNMCC for the present lithospheric thermal-rheological structure. The evolutionary characteristics of the LNMCC were explored based on a comparison of the thermo-rheological structures of the Cretaceous and the present LNMCC lithosphere.

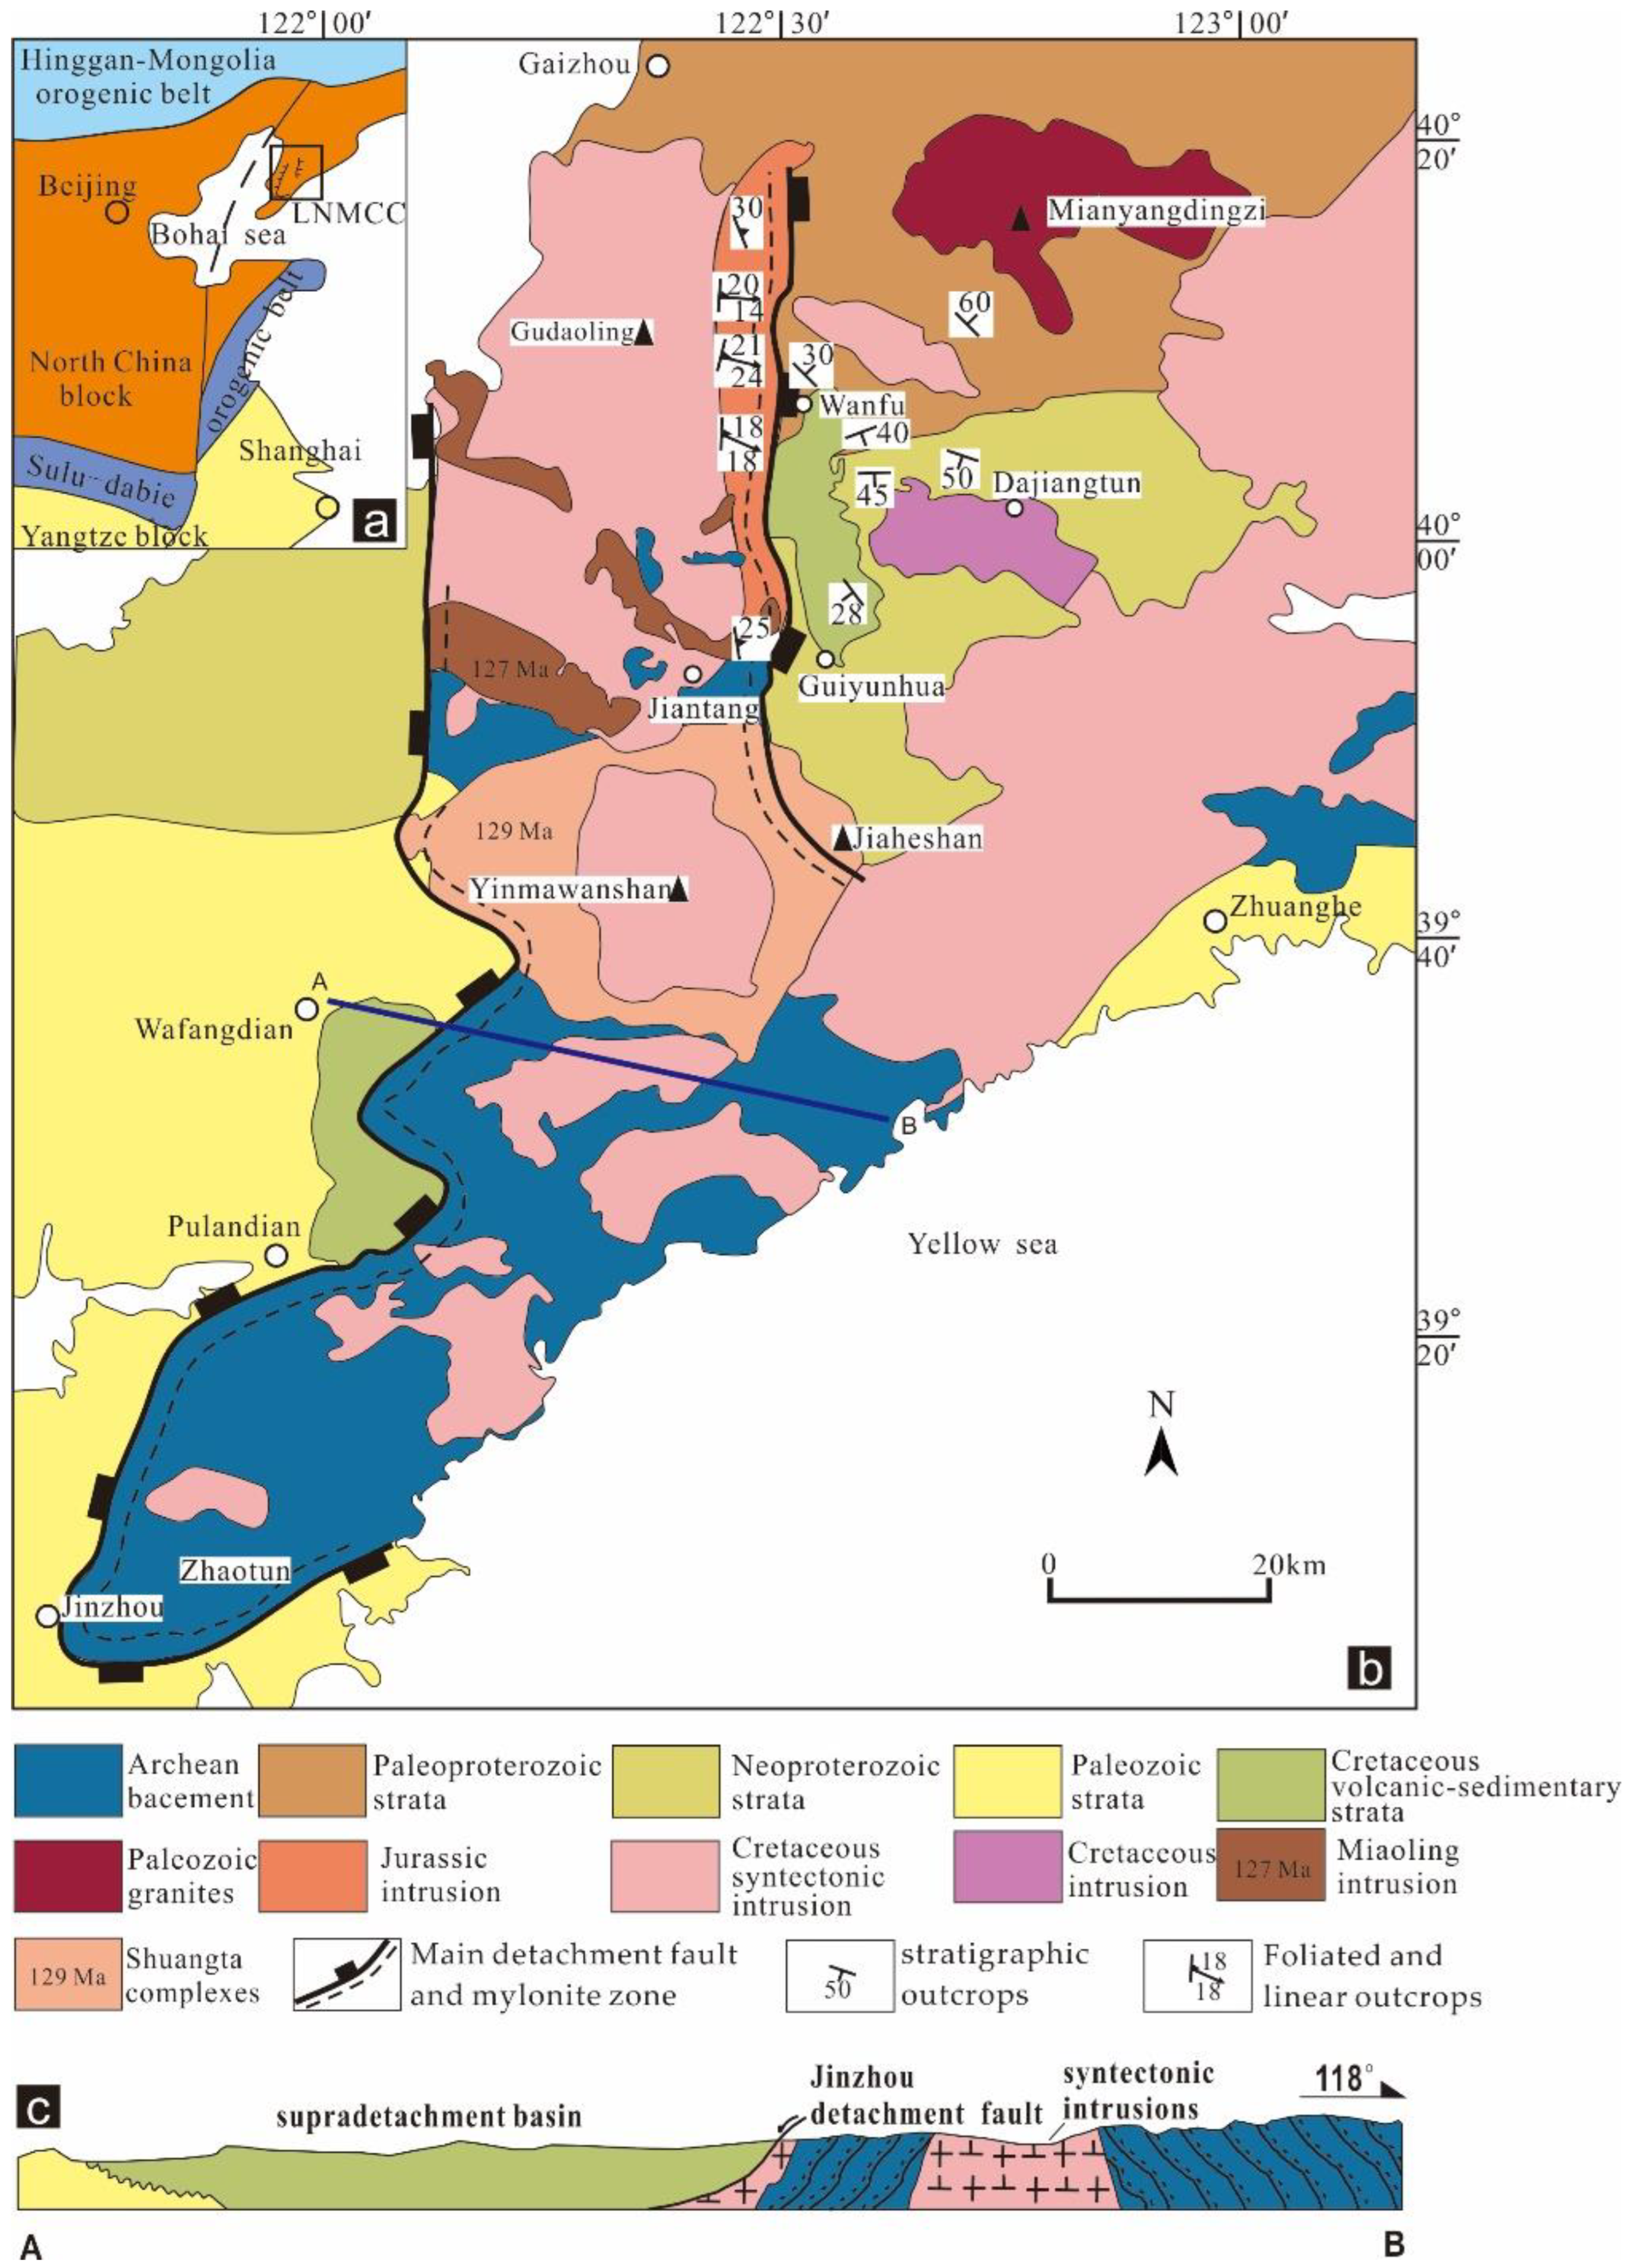
2. Geological Setting

LNMCC is located in the eastern NCC, which was reworked by the convergence of the NCC and the Yangzi Block and the adjacent Pacific tectonic domain, exhibiting a complex lithospheric deformation evolution history (Figure 1). In the Late Mesozoic, the tectonic stress field switched from an N–S contraction to a near-E–W extensional regime [30]. Late Mesozoic to Cenozoic regional extension within the NCC was due to an eastward retreat of the subduction Paleo-Pacific Plate, resulting in large-scale lithospheric thinning (>100 km) in eastern Asia and the formation of the amount of MCCs [5,6].
The LP is a typical region of the lithospheric thinning in the Late Mesozoic of the NCC. During the Paleozoic, the study area formed a relatively stable terrane as part of the NCC. The Mesozoic Yangzi Block collided with the NCC, resulting in the folding of the sedimentary overlying rocks and the development of the local magmatic activity. The Cretaceous period experienced intense tectonic–magmatic activities in the LP as a result of lithospheric thinning in the NCC [5,31].
The lower plate of the LNMCC contains tonalite–trondhjemite–granodiorite igneous suite and Archean protoliths, that are intruded by Early Cretaceous syn-extensional granites. The metamorphic rocks in the lower plate and syn-extensional granites process lineations of similar orientations [8]. The detachment fault of LNMCC has typical corrugation features, with the hinge dip generally consistent with the lineations of the mylonite in the lower plate. The upper plate of the LNMCC consists of Neoproterozoic and Paleozoic sedimentary rocks, which show bedding dips primarily to the ESE, which is opposite to the foliations of the rocks in the lower plate.
Figure 1. Geological map of the LNMCC (modified after [5]). (a) Tectonic location of LNMCC; (b) Simplified geological map of the LNMCC. Ages of Miaoling intrusion and Shuangta complexes are from [32]; (c) Cross section A–B, see Figure 1b for the location.
Minerals 12 01570 g001

3. Petrography

The complete sequence of tectonic rocks that developed beneath the detachment fault of the LNMCC, and from the domed core adjacent to the detachment fault comprises going structurally downward: fractured rocks, fractured mylonite rocks, mylonite rocks, gneiss mylonite rocks, mylonite gneiss rocks, and migmatites. The fractured rocks show cataclasized tectonites with brecciates (Figure 2a). The mylonite rocks have “δ” type feldspar augen, showing the top-to-the-WNW shearing of the rocks (Figure 2b). Gneiss mylonite rocks are elongated with quartzofeldspathic and mafic minerals in laminated bands (Figure 2c). The mylonite gneiss rocks show asymmetric quartzofeldspathic shear band boudins (Figure 2d). The gneissic rocks are seen to have oriented feldspar aggregates (Figure 2e). The layered migmatites show light-colored veins (leucosomes) of partially melted material and pods of restites (dark) (Figure 2f).
The tectonic rock sequences not only differ significantly in macroscopic scale but the microstructure of the rock samples in the direction perpendicular to the detachment fault plane is significantly different in terms of the deformation appearance of different minerals, while with consistent kinematics (dextral shearing) (Figure 3a–f). The feldspar exhibits rounded “δ” type asymmetric porphyroclasts and show dextral shearing (see Figure 3a) in the rocks near the detachment fault, while away from the detachment fault, the feldspar gradually exhibits a brittle rupture (Figure 3b–d) and then changes to plastic deformation with bulging dynamic recrystallization (BLG, Figure 3f). Biotite is more clearly oriented and elongated near the detachment fault (Figure 3c). In mylonite rocks, late brittle fractures cut through the early quartz grains with dynamic recrystallization (Figure 3d). Along the elongation direction, the quartz grain boundaries gradually become irregular (Figure 3a, c, e). A detailed demonstration of quartz grains exhibiting dynamic recrystallization of ductile deformations can be found in Figure 4. The quartz in the rocks adjacent to the detachment fault zone exhibits single-crystal elongation surrounding the feldspar porphyroblasts (Figure 3f). From the microstructures displayed by the different minerals (Figure 3a–f), we infer that the rocks along the extension perpendicular to the detachment fault gradually change from brittle failure to ductile deformation, indicating an evolutionary sequence of low to high deformation temperatures.
It is noted that different minerals do not show an overall decrease in grain size for dynamically recrystallized grains. For example, quartz shows a change from large grains to dynamically recrystallized small grains and then back to large grains, while feldspar shows a decrease in grain size primarily. This is mainly related to the deformation response of different minerals under temperature and pressure conditions.
From the grain dynamic recrystallization sequence of quartz deformation under different temperature and pressure conditions, the rocks in the lower plate of detachment fault of LNMCC have also undergone the evolution process from bulging dynamic recrystallization (BLG, Figure 4a, b) to subgrain rotation recrystallization (SGR, Figure 4b–d) to grain boundary migration (GBM, Figure 4d–f). The formation of a series of fine bulge recrystallized grains along the boundary of the undulose extinction quartz (Figure 4a) is indicative of having undergone a deformation temperature of 290–390 °C [24,26]. Core and mantle structures usually develop at the transition between BLG and SGR (Figure 4b). The SGR mainly exhibits recrystallized grains of uniform size arranged in layers, indicative of a deformation temperature of 440–490 °C (Figure 4c) [24]. During the transition from SGR to GBM, an increase in grain size occurs (Figure 4d). GBM dominates at a deformation temperature of 500–550 °C and gradually increases in grain size with increasing temperature (Figure 4e) [24], and a triple junction structure develops (Figure 4f).
As the metamorphic rocks in the lower plate adjacent to the detachment fault zone moved upward, the mylonites close to the detachment fault experienced brittle failure under the degradation and fragmentation and formed fractured rocks (Figure 2a; Figure 3d), and the fractures cut dynamic recrystallization grains of quartz is observed under the microscope, showing the characteristics of fragmentation superimposed on the ductile rocks. Combining the age of the syn-tectonic rocks (130–120 Ma) and the cooling age of the lower mylonite (120–110 Ma), the Archean metamorphic core of the lower plate was uplifted to the near-surface under the Cretaceous detachment fault activities and superimposed the Cretaceous low-grade syn-shearing metamorphism [8].

4. Methods

4.1. Paleo Thermo-Rheological Structure Estimation

Because deformation behavior and dynamic recrystallization type of quartz are also closely related to temperature [33,34], these characteristics enable us to make estimates of the deformation temperature of rocks containing quartz [25,26]. Samples from different locations in the lower plate of the LNMCC were selected, and an optical microscope (DM2700 P, Leica, Wetzlar, Germany) was used to observe the deformation characteristics and dynamic recrystallization type of quartz. We circled the newly formed dynamically recrystallized grains of quartz under the microscope and estimated the temperature using the established correspondence between the temperature and grain size of dynamically recrystallized quartz [24].
The differential stress to which the rock is subjected reflects the strain strength of the rock during deformation. For the ductile deformation of the lower plate of the detachment fault, the paleo-differential stresses are most suitable to be calculated using the grain size of dynamic recrystallization of quartz established by [26] and modified by [27]. The calculation equations are:
d = 2451σ − 1.26 (climb-accommodated)
d = 39σ − 0.54 (recrystallization-accommodated)
where d is the diameter of the dynamically recrystallized grains and σ is the applied differential stresses.
In this study, we collected paleo-temperature and differential stress data from nineteen samples from [35] (Table S1). These samples represent different locations within the lower plate distance from the detachment fault zone of the LNMCC. By setting the geothermal gradient, the corresponding depth of paleotemperature can be obtained and thus a part of the paleo-thermal structure of the lithosphere can be obtained. Similarly, a correspondence between depth and paleo-differential stress can be obtained for the estimated partial paleo-rheological structure of the lithosphere.

4.2. Present Thermo-Rheological Structure Calculation

One-dimensional (1D) steady-state heat conduction was applied to assume the continental geothermal model. The temperature–depth relation can be estimated using the following equation:
Tz = Tt + (qt × z)/k − (A × z2)/(2k)
In which qt and Tt are the heat flow and temperature at the top of the layer, respectively; z is the thickness of the layer; A is the radiogenic heat production of the layers (μW/m3); and k is the rock thermal conductivity (W/m·K). The surface temperature was 13 °C, as the annual average ground temperature of LP.
The seismic wave velocities and xenoliths obtained in the LNMCC indicate that the upper crust is predominantly gneiss facies, and the middle and lower crusts are relatively granulite facies [36]. The parameters used in the thermal structure model of this study can be found in Table 1.
The ratio of crustal heat flow (qc) to mantle heat flow (qm) is used to characterize the thermal structures, which is calculated using the following equation:
qm = q0 − qc
where q0 is the surface heat flow.
The thermal lithospheric thickness is calculated using two adiabatic lines of the thermal lithosphere [38]:
Upper limit: T1 = 1200 °C + 0.5(°C/km) × Z(km)
Lower limit: T2 = 1300 °C + 0.4(°C/km × Z(km)
The stresses required for brittle and ductile deformations were calculated simultaneously. The lithospheric strength was calculated according to the stresses required for brittle deformation σb and ductile deformation σd. Brittle deformation strength is a function of depth and pressure and is independent of the rock type and temperature [39]. The brittle failure law can be demonstrated as follows [40]:
σb = (σ1 − σ3) ≥ αρgz(1 − λ)
where λ is the pore fluid factor; α a parameter related to the fault type; g is the gravitational acceleration (m/s2); ρ the average density (kg/m3); and z is the depth (km).
Ductile failure is based on the power-creep law as follows [40]:
σd = (ε/A)^(1/n) exp(E/nRT)
where ε is the strain rate; n is the stress exponent; A is the stress constant relative to the material; R is the gas constant; E is the activation energy; and T is the absolute temperature determined by the lithospheric thermal structure.
The minimum value of the brittle and ductile failure at each depth was considered as the rheological strength of the lithosphere (σz), which is expressed as follows [40]:
σz = min {σb, σd}
The rheological structures of the lithosphere were modeled by calculating the rheological strength at different depths. The parameters of ductile rheology used in this study are set in Table 2.

5. Results

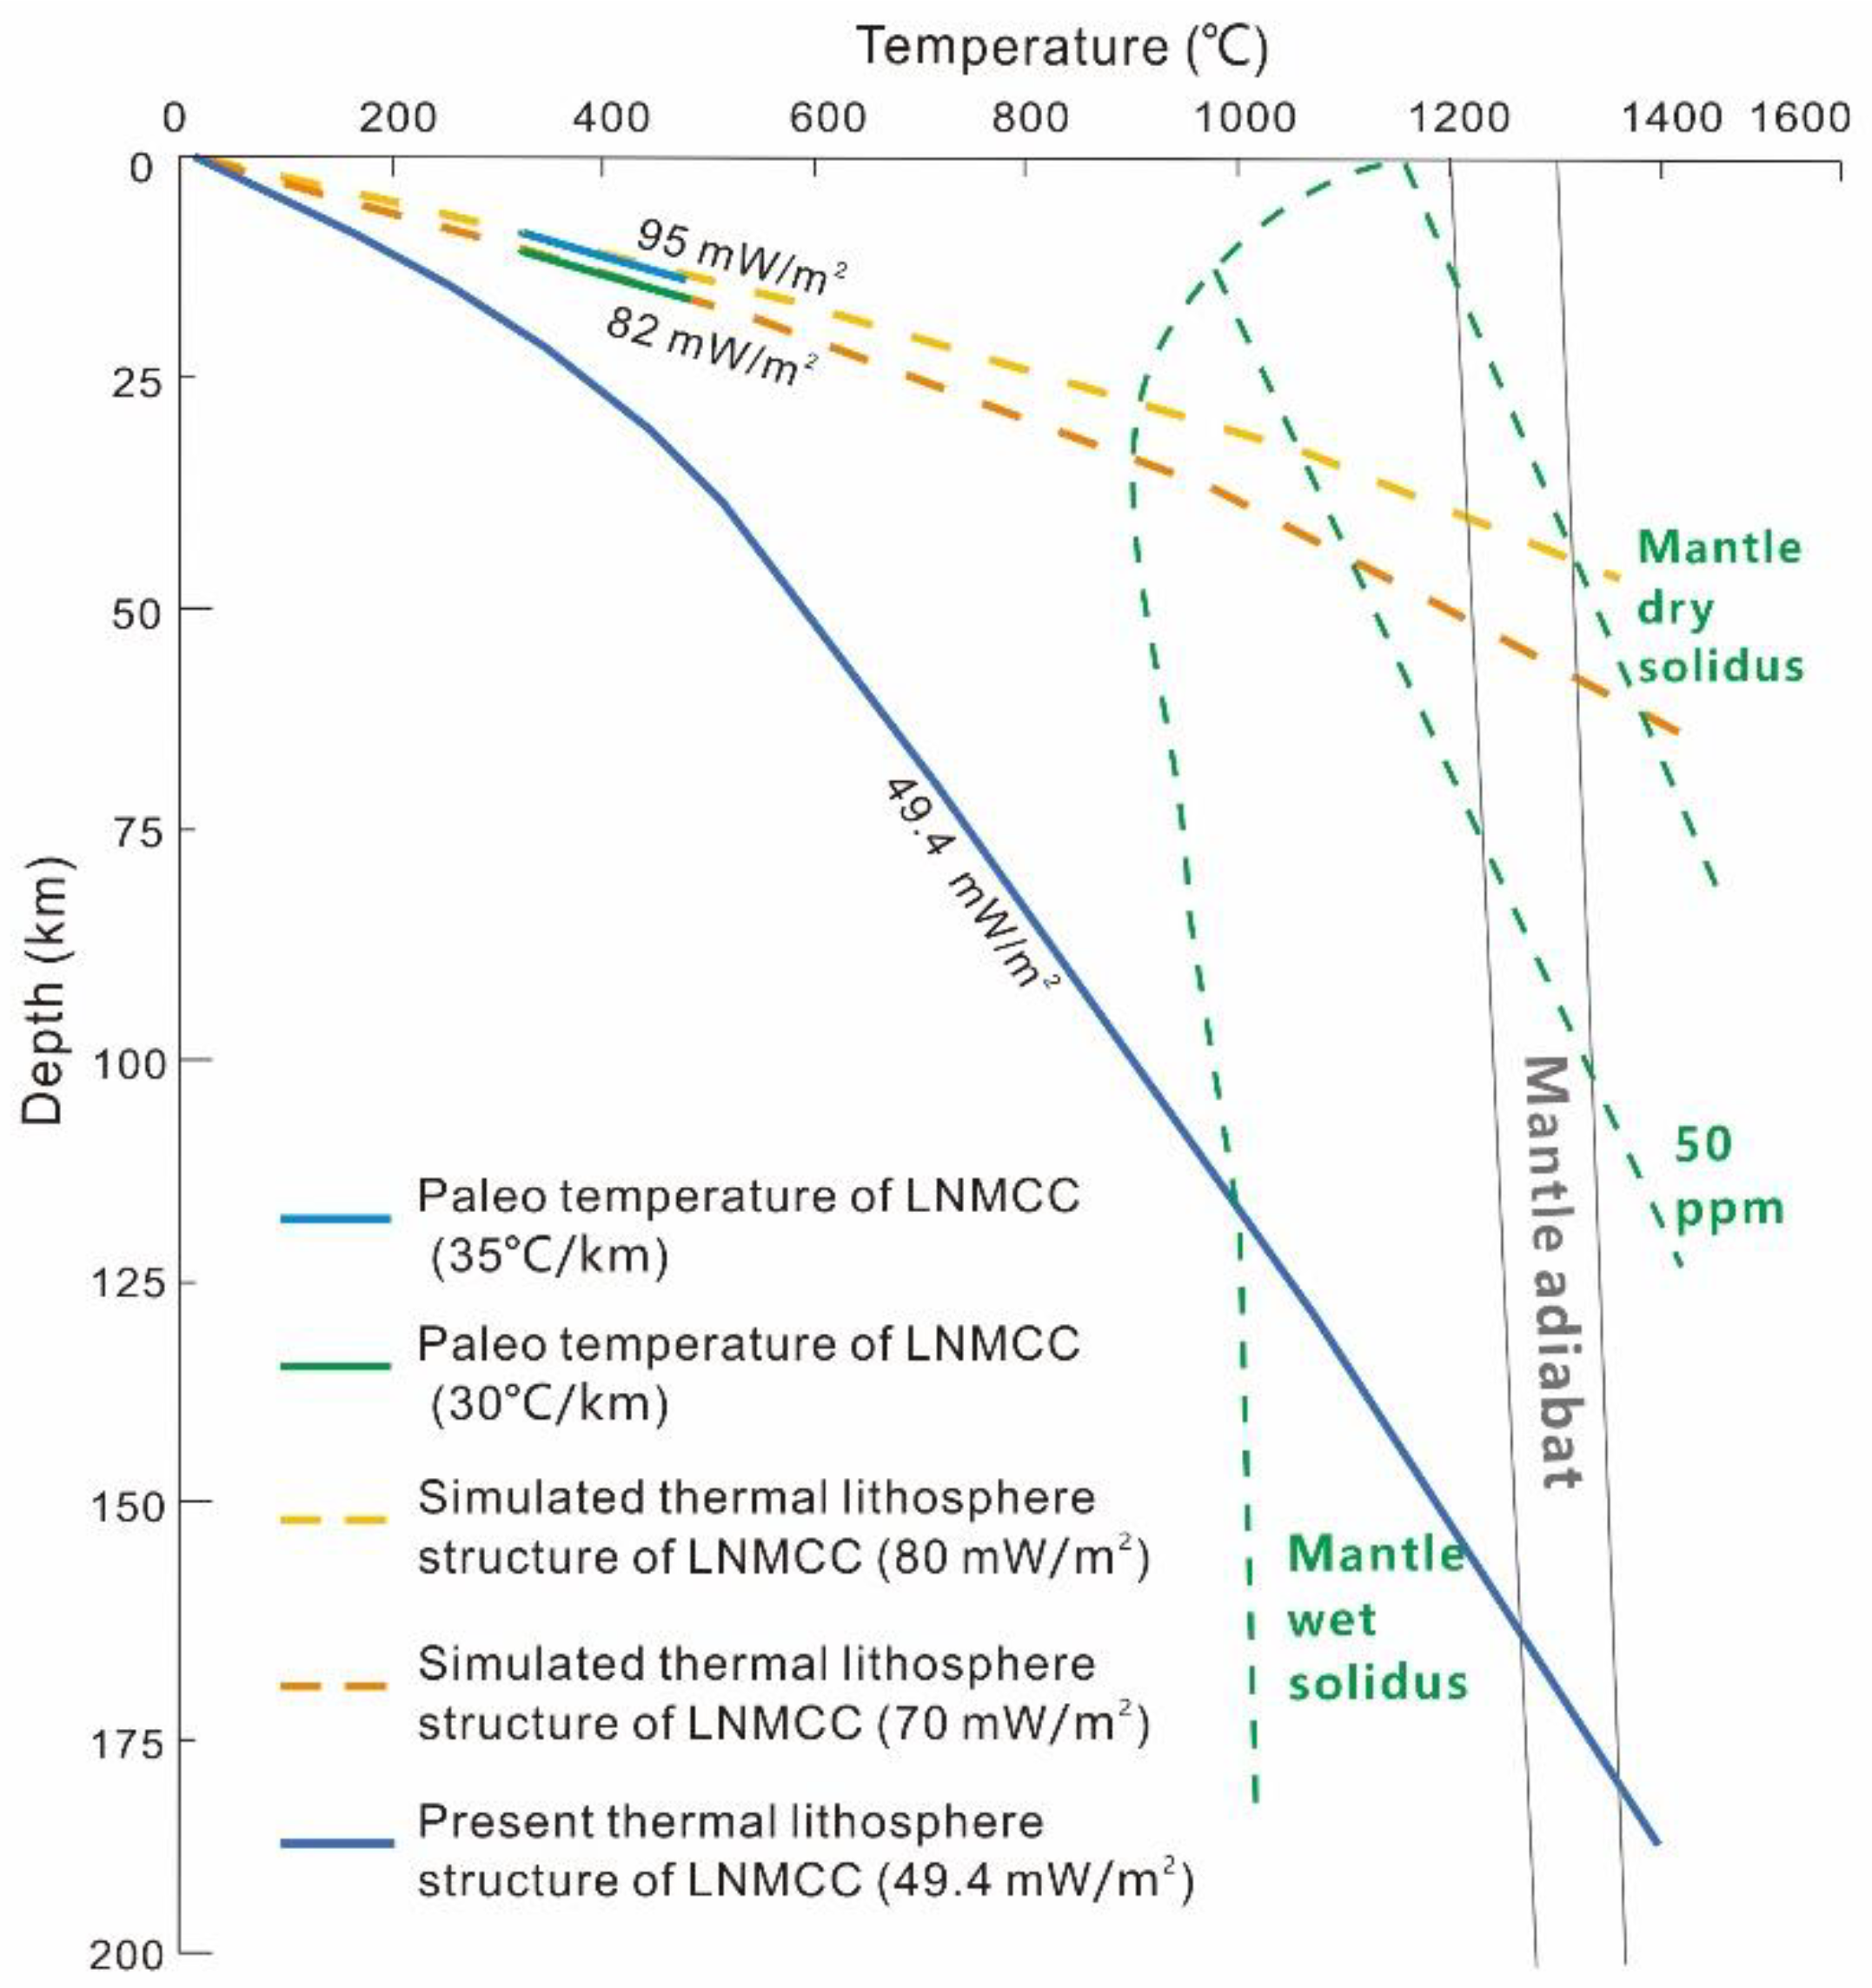
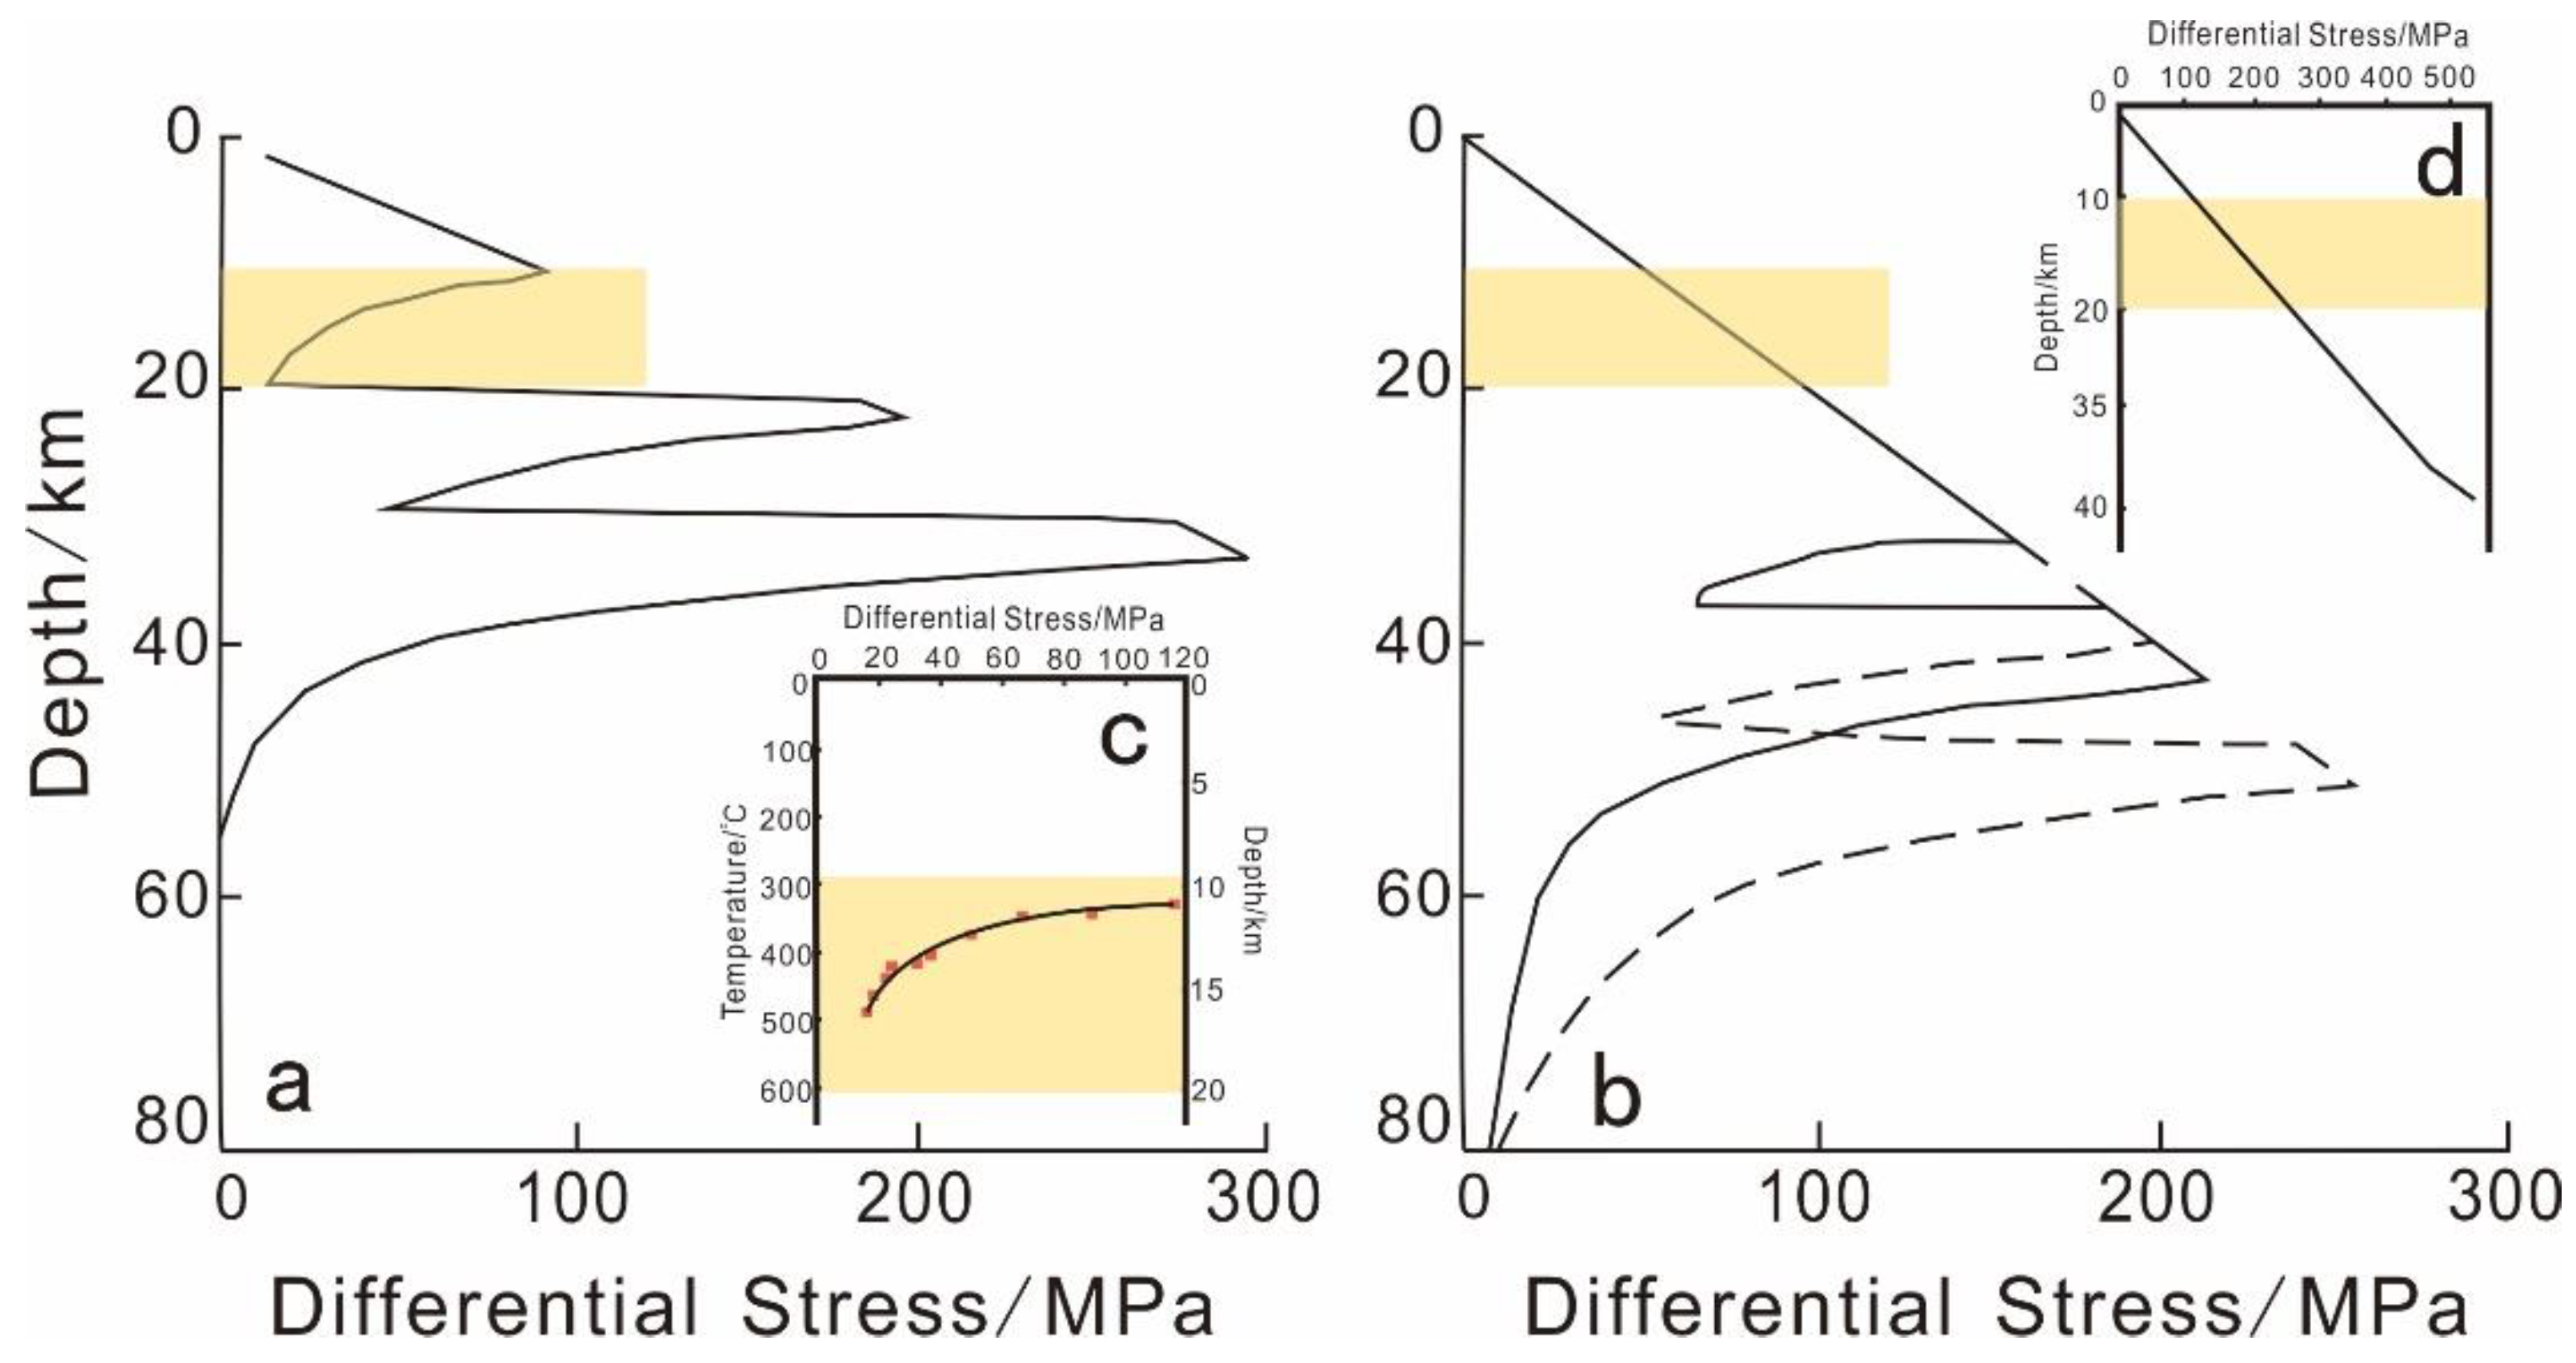
5.1. Paleo Thermo-Rheological Structure

The paleo-temperature range of Cretaceous LNMCC since its formation is 320–480 °C, and the paleo-differential stresses are from 16.988 MPa to 127.153 MPa [35] (Table S1). The width of the detachment fault zone is not constant in the vertical direction but becomes narrower closer to the surface [11]. The mylonite rocks in the detachment fault zone are deformed by the detachment stress, and the stress is related to the distance from the detachment fault. This is the reason why the calculated paleo-differential stress varied significantly. Along with the rocks of the lower plate being gradually exposed to the surface, the rocks near the edge of the detachment fault zone gradually escape from the influence of the detachment fault zone, thus forming a sequence of tectonic rocks where, the further away from the detachment fault zone, the higher the deformation temperature and the lower the differential stress. In addition, the large variation of paleo-differential stresses in the middle and lower crusts recorded by the samples exhibits exponential stress variation characteristics, indicating that the middle and lower crusts are controlled by exponential ductile rheological laws rather than linear brittle failure.
The grain size of dynamically recrystallized grains is inversely correlated with the paleo-differential stress. In other words, the smaller the grain size, the higher the estimated paleo-differential potential stress. Therefore we can set an average surface temperature of 20 °C during the Cretaceous period and a crustal thickness similar to that of the present day, taken from the adjacent region [32]. Setting the geothermal gradient at 40–55 °C/km (using the average gradient in eastern North China from [46]), the paleo heat flow is 105–135 mW/m2. The thermal lithospheric thickness was calculated at 26–36 km. However, this calculated thickness is obviously lower, even less than the given crustal thickness. Therefore, we suggest that the geothermal gradient and heat flow in the Cretaceous LNMCC may not reach the average value of those of eastern North China [46]. We set the geothermal gradient at 30–35 °C/km and obtained a heat flow of 82–95 mW/m2, which is basically consistent with the previous study [46]. The corresponding thermal lithosphere thickness is 43–56 km (Figure 5), while the brittle–ductile transition depth is only 8.5–10 km (Figure 6).

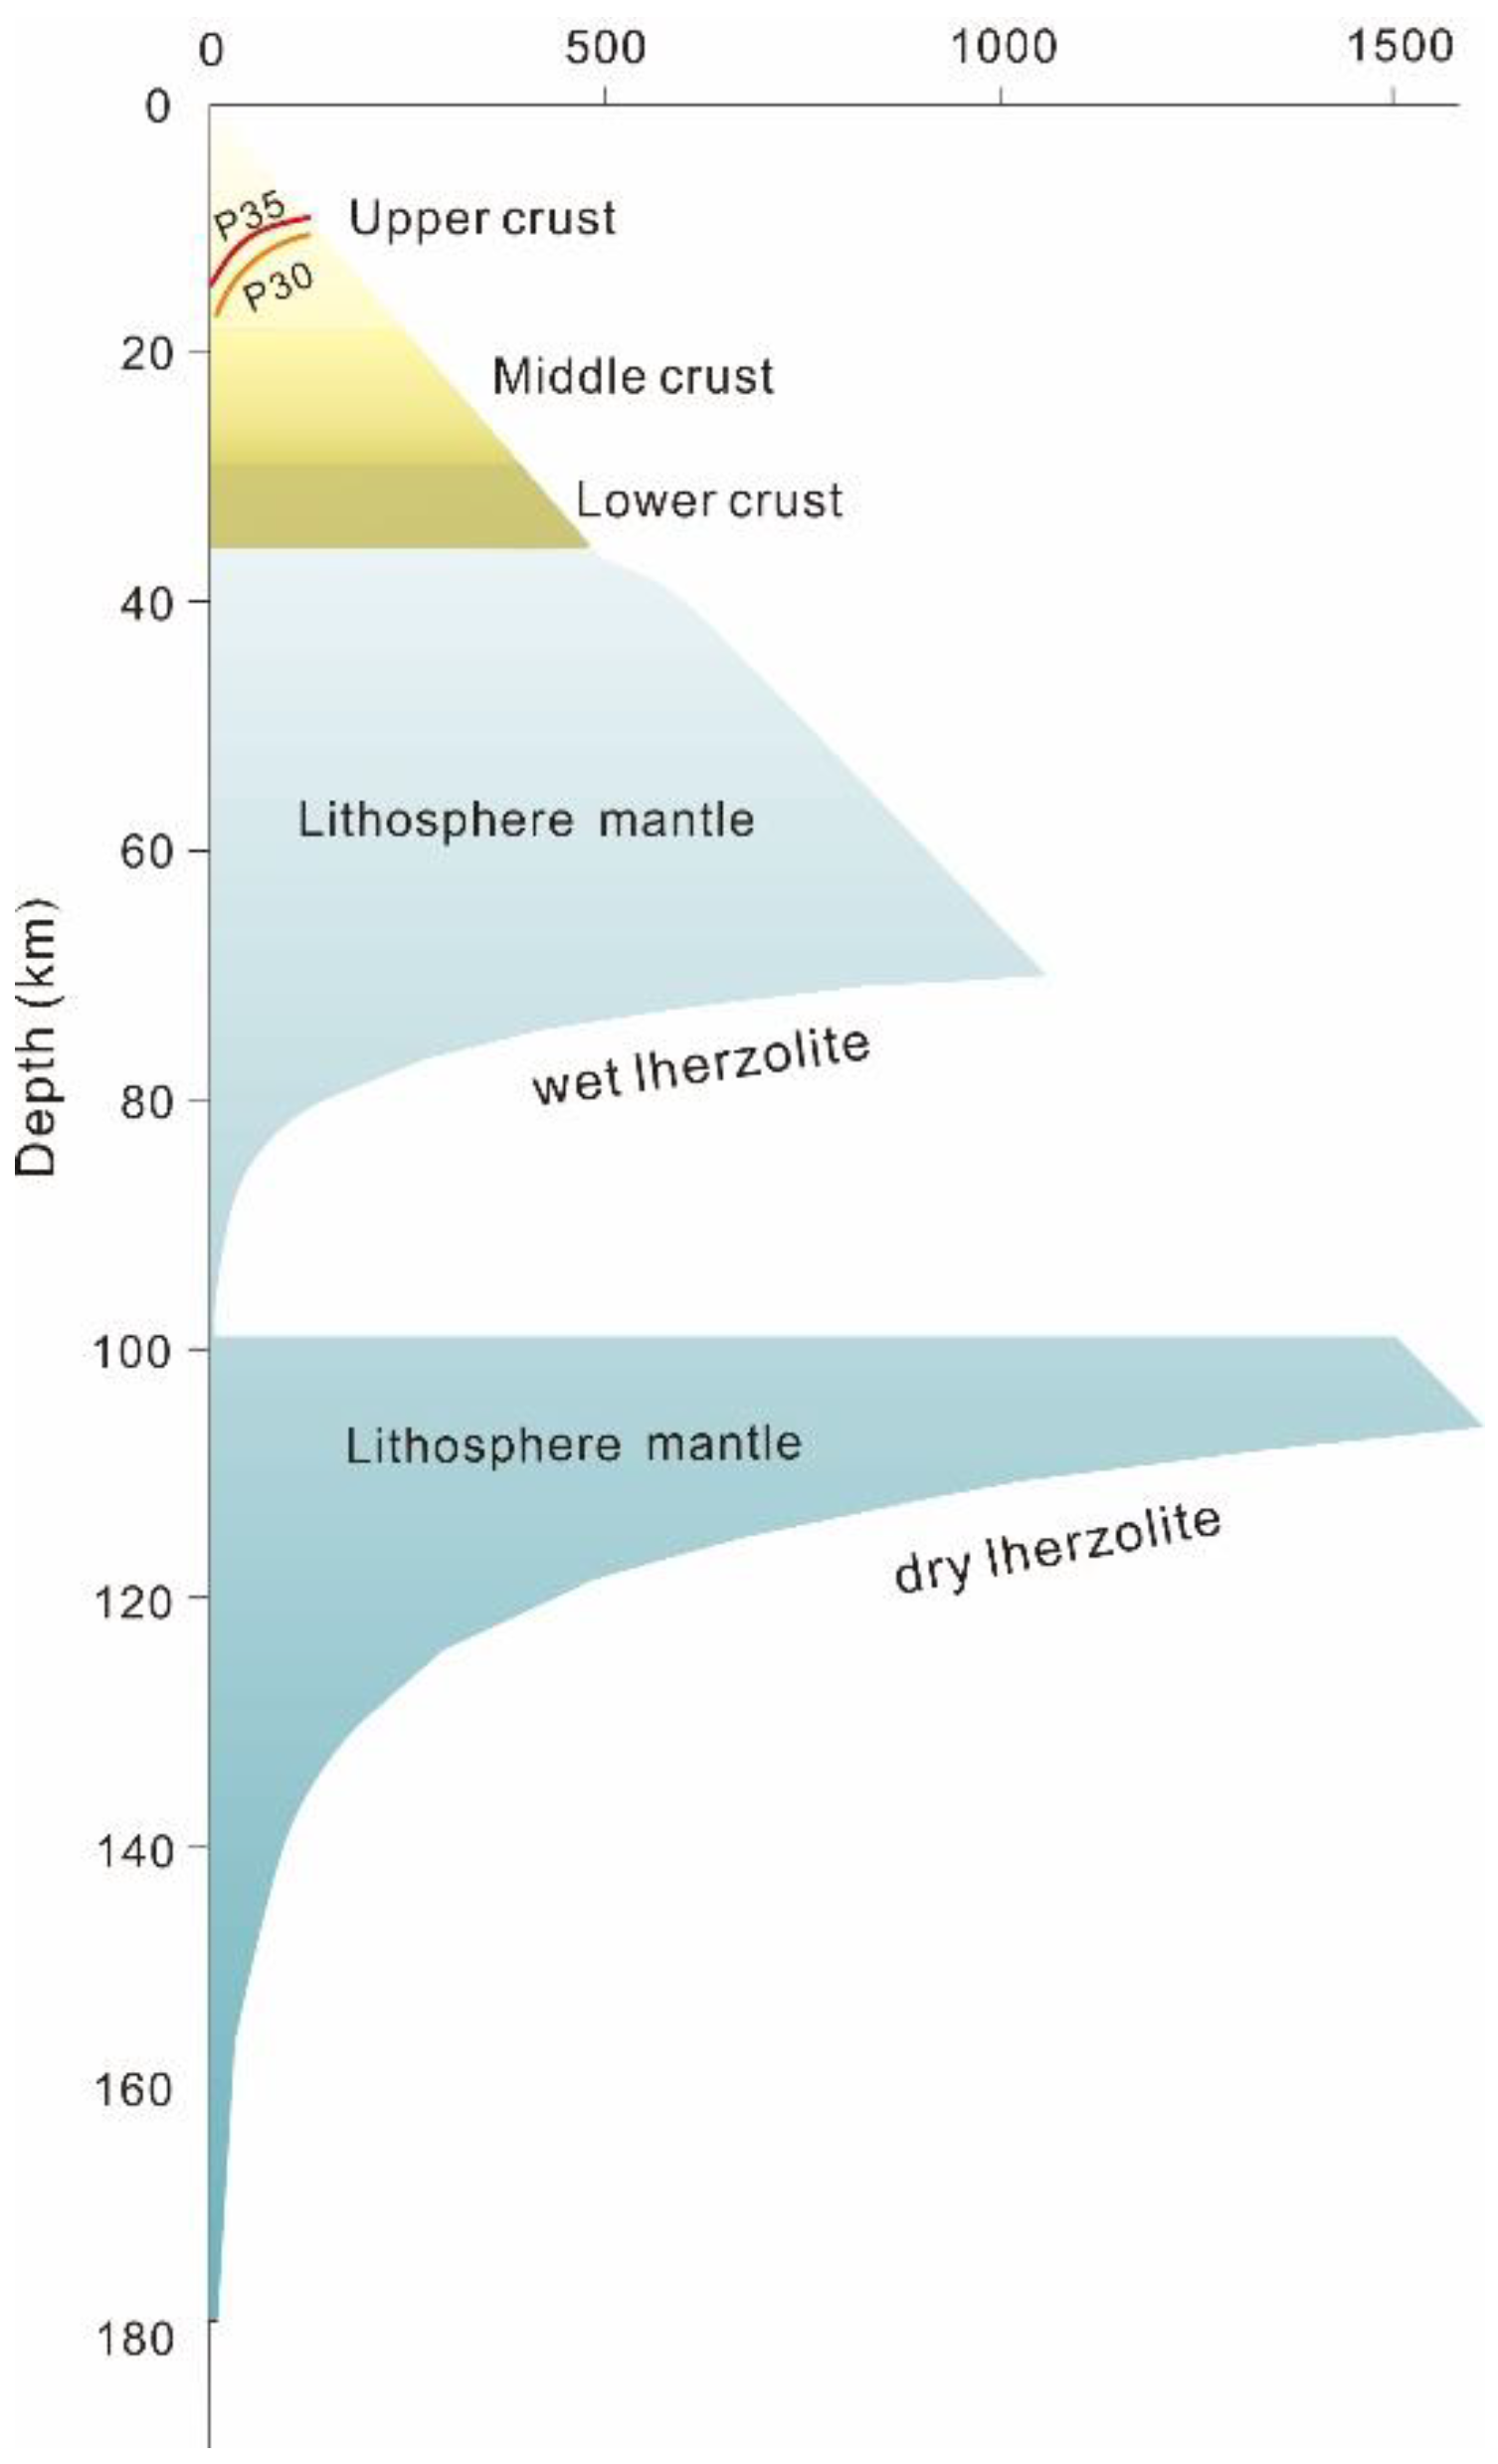
5.2. Present Thermo-Rheological Structure

Through the lithospheric thermal property assignment (Table 1) and the one-dimensional steady-state thermal structure calculation, the crustal heat flow value is calculated at 26.8 mW/m2. Based on the surface heat flow of 49.4 mW/m2, the mantle heat flow value was calculated as 22.6 mW/m2 using equation E2. The present crust–mantle heat flow ratio (qc/qm) of LNMCC is 1.19, indicating that the crustal heat is the main geothermal contribution. Using Equations E3 and E4, the thickness of the thermal lithosphere is calculated to be 164–182 km, with an average value of 173 km (Figure 5). Researchers usually considered that the NCC formed a thinning lithosphere due to extension since the Mesozoic [14,48]; however, our study suggests that presently, the LNMCC may have a thick and cold lithospheric structure.
According to the selected rheological structure parameters of the LNMCC lithosphere (Table 2), the differential stress–depth curves with different parameters are plotted (Figure S1). The lithospheric rheological structure model of the LNMCC is shown in Figure 6. The results show that the upper crust characterized by the dry quartzite curve intersects the brittle rupture line at the lower crust (32 km), which exceeds the thickness of the upper and middle crusts [36], indicating that brittle failure is the main representation of the upper and middle crusts. The rheological curves of wet granulite and granulite characterized by the lower crust intersect the brittle failure curve at 51 km and 55 km, which have obviously exceeded the depth of the lower crust and entered the lithospheric mantle. Therefore, neither of them satisfies the rheological characteristics of the lower crust, namely that the lower crust also has brittle failure as the main deformation mechanism. Analysis of the rheological structure of the lithospheric mantle is challenging. Given that the lithospheric mantle is dominated by lherzolite from the regionally exposed Cenozoic xenoliths [49,50], the ductile rheological of the lithospheric mantle is characterized by dry lherzolite and wet lherzolite curves. The results show that the rheological curves of wet lherzolite and dry lherzolite intersect the brittle failure curve at 70 km and 106 km. Dividing the lithospheric mantle into two parts, the first part is 36–70 km, which continues the brittle failure-dominated rheological form of the lower crust. The second part, 71–173 km, is dominated by the ductile rheology of lherzolite, considering that the Cenozoic lithospheric mantle in the NCC has a high original water content and the bottom of the lithospheric mantle is subjected to thermal roasting or melt extraction by the upwelling of asthenosphere [50,51], resulting in lower water content. Following this feature, we prefer to use the wet lherzolite curve in the upper part of the lithospheric mantle and the dry lherzolite curve near the bottom. The present lithospheric thickness of the NCC has a large variation, in which the lithospheric thickness of the LP revealed by P-wave velocity exceeds 160 km. In addition, a low-velocity layer exists in the upper part of the lithospheric mantle [52], which is indicated to be the expression of the ductile rheology of lherzolite of 70–100 km in the LNMCC.

6. Discussions

6.1. Reliability Analysis of the Thermal-Rheologycal Lithosphere Structure

For the present lithospheric thermal structure of LP, heat flow values, thermal conductivity and radiogenic heat generation at different depths within the crust were calculated using data from previous literature [36,53], and the surface heat flow values and radiogenic heat generation of surface rock were measured. Therefore, the parameters involved in the calculations and the results obtained for the lithospheric structure are highly reliable. The difference is that we set the radiogenic heat generation of the upper crust from a constant value (1.25 μW/m3) to exponential decay, and believe that the radiogenic heat generation transition from the upper to the middle crust is smoother in this setting. The temperature of Moho shows that our result (499 °C) is slightly higher than that using a constant value (468 °C, [36]), which is also consistent with the increased temperature caused by the exponential decay model that reduces the heat flow in crust. Our result of the calculated qc/qm ratio (1.19) was higher than the ratio calculated by some scholars (0.65–0.78) [54,55] but lower than the ratio calculated by others (1.87) [36] because the crust is enriched in radiogenic heat-producing elements and our results indicate that crust heat generation is the main heat source, which corresponds to the present lithosphere of LNMCC with the highest crustal thickness in the LP (36 km) [53]. We calculated the thickness of the thermal lithosphere as 173 km, which coincides with former studies of thermal lithospheric thickness [56], and is in general agreement with the lithosphere thickness (160 km) estimated from the seismic P-wave velocity image [52]. The lithospheric rheological structure of the present LNMCC can be corroborated by the effective elastic thickness (Te). Previous calculations [57] have obtained relatively high Te values (30–40 km) for the LP, which are consistent with our calculated brittle–ductile transition depth (32 km) in the rheological structure.
The paleo-temperature and paleo-differential stress microstructural criteria are widely used [24,58,59,60]. The thickness of the thermal lithosphere corresponding to the paleo thermo-rheological structure in the LP during the Cretaceous period is calculated to be 59–75 km, which is consistent with previous petrological and tectonics that suggested the Cretaceous lithospheric thinning [5,8,47,61]. The mantle xenoliths of the Mesozoic to Cenozoic basalts of the NCC are dominated by fertile or transitional spinel lherzolites, and equilibrium temperature and pressure conditions indicate high geotherms. In addition, the lack of garnet facies peridotite in the Mesozoic–Cenozoic xenoliths indicates that the LAB is less than 80 km [50,62]. The thermos-barometry of xenoliths reveals a temperature range of 1200–1280 °C in the sub-Moho mantle [62], indicating the high heat flow of the Mesozoic–Cenozoic.

6.2. Characteristic of Present Thermo-Rheological Structure

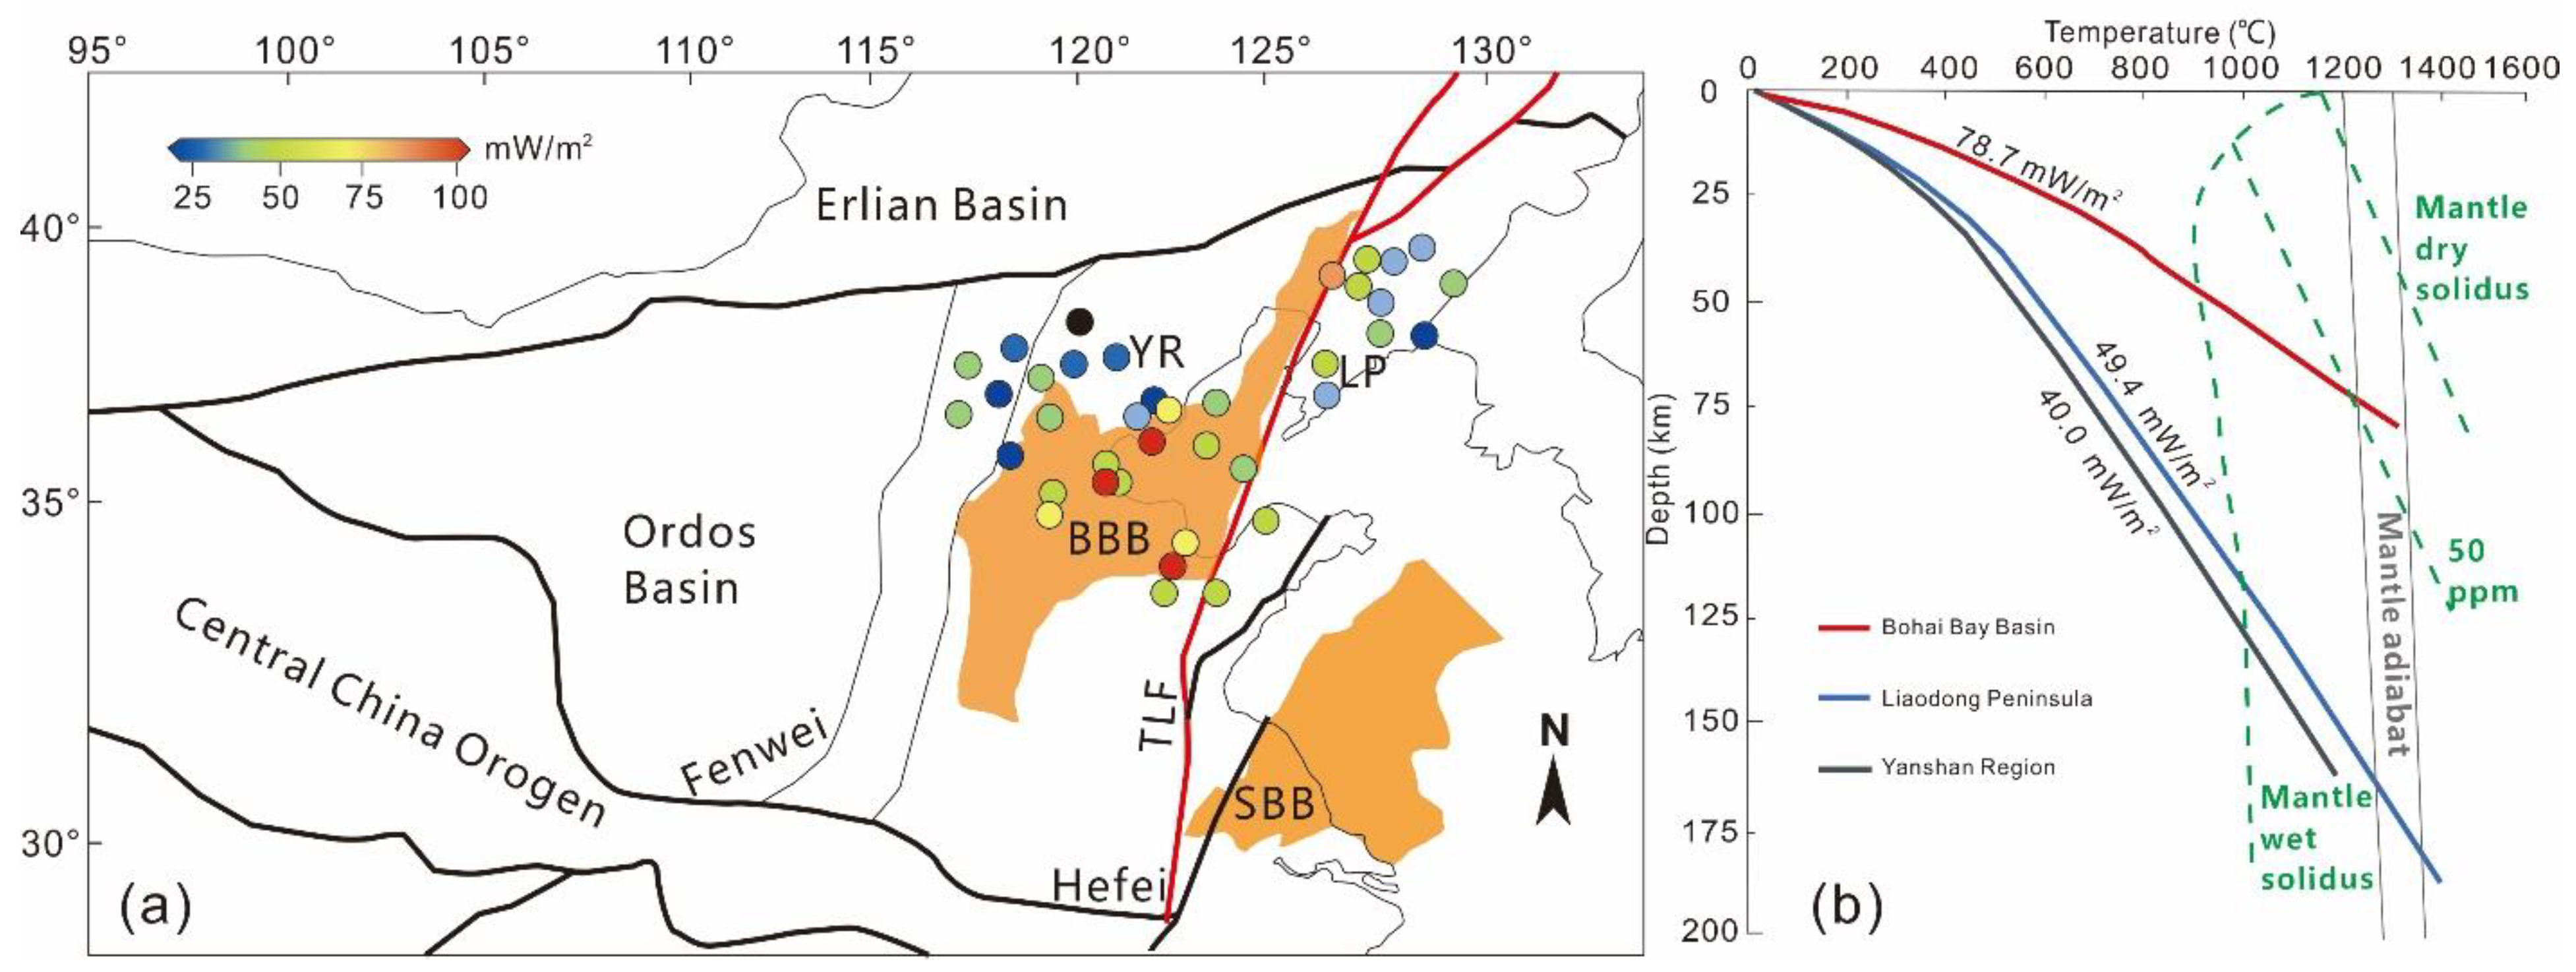
6.2.1. Geothermal Field of LNMCC and Adjacent Regions

The present LP is a relatively low heat flow region, similar to the Yanshan Region (YR), and the two are separated by the high heat flow area of the Bohai Bay Basin (BBB, Figure 7a). The BBB is regarded as the central area of the NCC lithospheric thinning [17,63]. Therefore, the high value of heat flow in the BBB may be related to lithospheric thinning and asthenospheric upwelling. The qm is 40.5 mW/m2 in the BBB [14], which is greatly higher than the qm in LP (22.9 mW/m2) and YR (21.78 mW/m2). In addition, the thermal lithospheric thicknesses in LP and YR are significantly thicker than that in the BBB (Figure 7b), showing obvious divergence from the lithospheric structure of the BBB. The possibility of the existence of different lithospheric thicknesses and thermal states is also supported by the heterogeneity of the Cenozoic lithospheric mantle in the NCC [62,64,65]. The geological model of the modified lithospheric mantle of the newly formed lithosphere in the BBB also shows that the lithospheric thickness of the BBB is considerably lower than that of the LP [66]. The lithospheric thermal structure of the BBB intersects the mantle adiabatic lines at depths below 50 km (Figure 7b). Note the high water content of the lithosphere of the Cretaceous NCC [47,67], which implies that partial melting of the mantle may have occurred below 50 km. From the similar geothermal and qm values in LP and YR, combined with the tectonic features that are separated by the BBB, we hypothesize that LP and YR had the same geothermal conditions before the first stage of BBB rifting in the Cretaceous [68]. The extensional rifting and subsidence of the BBB, with the upwelling of the asthenosphere and high heat flow [17,68], separate the LP and YR.
Note that the Tanlu Fault passes through the BBB along the NE–SW direction (Figure 7a), so it is unknown whether the regional geothermal field is constrained by the extension of the BBB or the activities of the Tanlu Fault. Terrestrial heat flow studies of the southern Tanlu Fault concluded that this part of the fault zone is probably not a thermal anomaly zone [69]. In addition, the area of high heat flow values exhibits basically the same extent as the BBB (Figure 7a; Figure S2). From this, we demonstrate that the geothermal field in this region is dominated by the extension of the BBB, with the Tanlu Fault acting as the eastern boundary of the BBB rather than the main heat-constrained fracture.
Thermal lithosphere thickness changes in the BBB indicate rapid cooling after 40 Ma in the Cenozoic [17], but thermal evolution studies in the LP are lacking. The cooling process of the granitoids exposed by thermal chronology data from the LP shows that rapid cooling (cooling rate of about 40–55 °C/my) occurred after 122 Ma [70]. This is in accordance with the MCC cooling processes in the North American Cordillera and the Mediterranean Aegean/Anatolia region [71]. Correspondingly, a rapid uplift occurred in the LP since 110 Ma [72]. This may have resulted from a rapid decrease in temperature caused by the exposure of the middle and lower crusts to the shallow surface and heat transfer to the surrounding rock. In addition, the cooling of the lithosphere caused the conversion of the asthenosphere to new lithosphere attached beneath the old lithosphere, creating a thickened lithosphere [15,73].
Figure 7. Regional heat flow and lithospheric thermal structure characteristics (modified after [14]). (a) Distribution of geothermal heat flow values in northeastern the NCC. Heat flow values are from [14]; (b) Comparison of lithospheric thermal structures in the BBB, LP (LDP) and YR (YSR). The Lithospheric thermal structure of BBB and YR are modified from [14,74], respectively. Abbreviations: TLF—Tanlu Fault; BBB—Bohai Bay Basin; YR—Yanshan Region; LP—Liaodong Peninsula; SBB—Subei Basin.
Minerals 12 01570 g007

6.2.2. Thermal Evolution of LNMCC

The current thickness of the thermal lithosphere is 173 km, while the thermal flow values derived from paleo-temperature and estimated geothermal gradients during the deformation of the detached lower plate correspond to 70–80 mW/m2, which corresponds to a thickness of 59–75 km for the thermal lithosphere. This comparison exhibits rapid cooling of the lithosphere from 120 Ma [5] to the present and a significant increase in the thermal lithospheric thickness. LNMCC has different temperature conditions for the metamorphism of crustal layers at different depths. After the middle and lower crusts stretching to the surface, our study shows that the heat flow of LNMCC from the Cretaceous to the present decreased from 82–95 mW/m2 to 49.4 mW/m2. The rapid reduction of terrestrial heat flow indicates the cooling of the entire lithosphere occurs after LNMCC formation.
Thickening of the thermal lithosphere represents a decrease in the total heat received by the LNMCC, or an increase in heat loss. There are two possible reasons for this. The first reason is an increase in the rate of heat loss due to the exhumation of high-temperature rocks from the middle and lower crust to the surface. The second is a reduction in heat flow due to an overall reduction in radiogenic heat generation in the crust, as the relatively low radiogenic heat generation of the middle and lower crusts replaced the higher radiogenic heat generation of granitic or sedimentary basement rocks. In short, this results in an overall decrease in lithospheric heat, which allows for the conversion of the asthenosphere to the lithosphere mantle and thus the thickening of the lithosphere [73]. Note that possible variations in crustal thickness are not considered in this study. Note that possible variations in crustal thickness are not considered in this study. Because the evolution of crustal thickness since the Mesozoic was influenced by complex factors, the geological record of earlier periods may also have been imprinted by later periods. This is an ambitious topic and is not the focus of this study.

6.3. Differences between Cretaceous and Present Rheological Structures of LNMCC

A series of extensional basins, e.g., the Subei Basin and BBB, developed in eastern China during the Mesozoic and Cenozoic, and the formation and evolution of these basins are common [75]. The brittle–ductile transition zone of the Subei Basin is about 15–18 km and the present heat flow is between 55 and 83 mW/m2 [76], which is higher than the global average heat flow value (65 mW/m2, [77]), showing the characteristics of a Mesozoic–Cenozoic continental extensional region (Figure 7a).
The Tarim Basin in western China is a typical intra-continental complex basin [78]. The Tarim Basin is an ancient cratonic basin with a Precambrian crystalline basement, which is overlain by a sedimentary cover with a thickness of more than 15,000 m. The stratigraphy of the Phanerozoic is relatively fully developed. The depth of the brittle–ductile transition in the Tarim Basin is significantly greater than that in the Subei Basin, at about 30~40 km. The present heat flow value in Tarim Basin is 40–50 mW/m2 [78] and the mantle heat flow is 15–24 mW/m2, which is significantly lower than that of the basin in eastern China, indicating that the mantle contribution to the heat flow of the eastern basins is more significant. Comparing the lithospheric rheological characteristics of the LNMCC with the typical basins of East and West China (Figure 8), the rheological strength curves of the upper and middle crusts of the Cretaceous LNMCC are very similar to the Subei Basin, while differ significantly from the Tarim Basin in the West. This similarity indicates the LNMCC shares common features with the evolution of the Subei Basin: a shallow brittle–ductile transition zone (<20 km). The LNMCC of the Cretaceous period is characterized by a warmer lithosphere and higher mantle heat flow. In contrast, the rheological lithosphere of the present LNMCC is similar to that of the Tarim Basin, with thicker brittle layers and deeper brittle–ductile transition zone (>30 km), and heat flow values lower than the global average heat flow value [77], indicating the character of a cold lithosphere.

6.4. Implication for the Evolution of LNMCC

From the calculated thermo-rheological structure of the Cretaceous lithosphere in LNMCC, it appears that the Cretaceous LNMCC has a thin thermal lithosphere (59–75 km) and a shallow brittle transition depth (12–15 km). Assuming that the middle and lower crusts of the Cretaceous period are also gneiss and granulite, the crustal radiogenic heat production is relatively low (Figure 9a). That is, the high heat flow (70–80 mW/m2) mainly came from mantle heat. Combined with the thin thermal lithosphere, it can be assumed that the asthenosphere provides a large amount of heat. Most of the MCCs’ detachment faults in NCC are ESE–SE oriented [5], except for the WNW oriented LNMCC, Yiwulvshan MCC and Xiaoqinling MCC, and most of them were formed during 120–132 Ma [6]. It is implied that the flow direction of the lower crust in LP and Yiwulvshan is ESE directed, which is possibly the result of the subordinate flow of the middle and lower crusts under the influence of the eastward flow of the asthenosphere [80,81]. Similar foliations and shearing indicators with consistent top-to-the-WNW kinematics develop in the detachment fault zone and in metamorphic rocks in the lower plate, which strongly supports the occurrence of eastward flow in the middle and lower crusts.
The present thermo-rheological structure of the lithosphere in LNMCC exhibits a thick lithosphere (173 km) and a deep brittle–ductile transition depth (32 km). Given the absence of Cenozoic rocks in the study area, and assuming that the composition and layered structure of the crust of the LNMCC is stable, the thickening of the present lithosphere is primarily due to the thickening of the lithospheric mantle compared to the Cretaceous period. Despite this possible reason for the heat loss of the LNMCC, the thickening of the lithospheric mantle is speculated that the center of lithospheric thinning of the NCC since the Cenozoic is located in the BBB, and the lithospheric mantle in the BBB shows ductile rheology character under a depth of 40 km [17]. Therefore, the thinning of the lithospheric mantle in the BBB would cause the ductile mantle flow to the surrounding area (including the LP) by the upwelling of the asthenosphere [56], resulting in the thickening of the lithospheric mantle in the LP.

6.5. Comparation with Continental MCCs Worldwide

Most core complexes in the world form in regions of extension in collapsed orogens [71]. MCCs can be caused by the gravitational collapse of over-thickened crust (e.g., Transbaikalia; [82]) or by the rollback of an adjacent oceanic plate (e.g., North American Cordillera MCC, [83]). Plateaus or high mountains may have existed in the Jurassic period in LP [84,85]. The Cretaceous LNMCC was formed in the subduction of the Paleo-Pacific Plate, where lithospheric extension caused an upwelling of the asthenosphere [31]. Thus, the tectonic setting of the LNMCC is closer to the formation features of the Cordillera MCC, namely the westward and eastward subduction and retreat of the Paleo-Pacific Plate, which may have formed similar MCCs. The difference is that one is in the Mesozoic and one is in the Paleogene [86]. The evolutionary process after MCC formation is still an unknown issue, and the LNMCC, as a typical MCC formed by oceanic plate retreat and extension, is expected to provide a reference for the evolution of similar types of MCCs. For example, the MCCs of the Menderes Massif in the eastern Mediterranean formed in the Oligo–Miocene and extension in the overriding plate has led to exhumation. The MCCs of the Menderes Massif are currently an active geothermal zone with heat flow exceeding 90 mW/m2 [87,88]. Depending on the evolution of the LNMCC, the MCCs of the Menderes Massif may be contrasted with the Cretaceous stage of the LNMCC.

7. Conclusions

In this study, we investigate the thermo-rheological properties of the LNMCC at the time of its formation in the Cretaceous, by estimating the paleotemperature and paleo-differential stress of rocks with varying degrees of dynamical metamorphism in the lower plate of the detachment fault. We explore the evolution of the LNMCC after its formation by comparing it with the thermo-rheological structure of the present LNMCC.
According to the results of paleo-temperature and paleo-differential stress at Cretaceous LNMCC estimated from the grain size dynamic recrystallization of quartz, and set geothermal gradients of 30–35 °C/km, the calculated values for the Cretaceous heat flow are 82–95 mW/m2, with a thermal lithosphere thickness of 43–56 km, and a brittle–ductile transition depth of 8.5–10 km.
The present crust–mantle heat flow ratio (qc/qm) of the LNMCC is 1.19, indicating that crustal heat is the main heat contribution. The thickness of the thermal lithosphere is 173 km and the calculated brittle–ductile transition depth reaches 70 km, indicating the existence of a rheological coupling between the crust and the lithosphere mantle.
The LP and YR are inferred to have a consistent geothermal background prior to the Cretaceous BBB extension. The thermal lithosphere of LP thickened from 59–75 km to 175 km and the crustal rheological structure changed from the “Subei Basin type” to the “Tarim Basin type”. The high heat flow values of the LNMCC during the Cretaceous period may be the result of a large amount of heat supplied by the asthenosphere. The unidirectional shear of the LNMCC is presumably due to the subordinate flow of the middle and lower crusts under the influence of the eastward flow of the asthenosphere.

Supplementary Materials

The following supporting information can be downloaded at: https://0-www-mdpi-com.brum.beds.ac.uk/article/10.3390/min12121570/s1, Figure S1: The lithospheric rheological structures of Liaonan metamorphic core complex; Figure S2: Heat flow map of continental China; Table S1. Paleo-temperature and paleo-differential stresses calculated from the grain size of dynamically recrystallized quartz of Liaonan metamorphic core complex.

Author Contributions

Conceptualization, H.G. and J.L.; validation, G.W.; visualization, W.Z. All authors have read and agreed to the published version of the manuscript.

Funding

This study was supported by the Project of China Geological Survey (DD20221676), and the National Key Research and Development Program of China (2019YFB1504203).

Data Availability Statement

Not applicable.

Acknowledgments

This study was supported by the Project of China Geological Survey (DD20221676), and the National Key Research and Development Program of China (2019YFB1504203). We are grateful for the comments from the editor and anonymous reviewers that helped improve this manuscript.

Conflicts of Interest

The authors declare no conflict of interest.

References

  1. Lister, G.; Davis, G.A. The origin of metamorphic core complexes and detachment faults formed during Tertiary continental extension in the northern Colorado River region, U.S.A. J. Struct. Geol. 1989, 11, 65–94. [Google Scholar]
  2. Lister, G.; Baldwin, S.L. Plutonism and the origin of metamorphic core complexes. Geology 1993, 21, 607–610. [Google Scholar] [CrossRef]
  3. Liu, J.; Davis, G.A.; Lin, Z.; Wu, F. The Liaonan metamorphic core complex, Southeastern Liaoning Province, North China: A likely contributor to Cretaceous rotation of Eastern Liaoning, Korea and contiguous areas. Tectonophysics 2005, 407, 65–80. [Google Scholar]
  4. Bahadori, A.; Holt, W.E.; Austermann, J.; Campbell, L.; Rasbury, E.T.; Davis, D.M.; Calvelage, C.M.; Flesch, L.M. The role of gravitational body forces in the development of metamorphic core complexes. Nat. Commun. 2022, 13, 5646. [Google Scholar] [CrossRef] [PubMed]
  5. Liu, J.L.; Chen, X.Y.; Zhang, J.; Zhou, B.J.; Fan, W.K.; Yan, J.X. Gneiss domes and stratified middle to lower crustal flow in continental mobile belt. Acta Geol. Sin. 2022, 96, 3158–3181. (In Chinese) [Google Scholar]
  6. Lin, W.; Faure, M.; Monié, P.; Schärer, U.; Panis, D. Mesozoic extensional tectonics in eastern Asia: The south Liaodong Peninsular metamorphic core complex (NE China). J. Geol. 2008, 116, 134–154. [Google Scholar] [CrossRef] [Green Version]
  7. Rey, P.; Vanderhaeghe, O.; Teyssier, C. Gravitational collapse of the continental crust: Definition, regimes and modes. Tectonophysics 2001, 342, 435–449. [Google Scholar] [CrossRef]
  8. Zheng, Y.; Liu, J.; Hou, C.; Sun, Y.; Craddock, J.P. Exhumation of Metamorphic Core Complexes through Progressive Subhorizontal Shearing, Doming, and Detachment Faulting: Insights from the Cretaceous Liaonan Metamorphic Core Complex, Eastern North China Craton. Lithosphere 2020, 2020, 7866820. [Google Scholar] [CrossRef]
  9. Yang, J.H.; Wu, F.Y.; Chung, S.L.; Lo, C.; Wilde, S.; Davis, G. Rapid exhumation and cooling of the Liaonan metamorphic core complex: Inferences from 40Ar/39Ar thermochronology and implications for Late Mesozoic extension in the eastern North China Craton. Geol. Soc. Am. Bull. 2007, 119, 1405–1414. [Google Scholar] [CrossRef]
  10. Ji, S.C.; Li, L.; Xu, Z.Q. Dislocation creep and flow strength of the Earth’s crust. Acta Geol. Sin. 2021, 95, 159–181. (In Chinese) [Google Scholar]
  11. Behr, W.M.; Platt, J.P. A naturally constrained stress profile through the middle crust in an extensional terrane. Earth Planet. Sci. Lett. 2011, 303, 181–192. [Google Scholar]
  12. Korchinski, M.S.; Teyssier, C.; Rey, P.; Whitney, D.L.; Mondy, L. Single-phase vs two-phase rifting: Numerical perspectives on the accommodation of extension during continental break-up. Mar. Pet. Geol. 2021, 123, 104715. [Google Scholar] [CrossRef]
  13. Furlong, K.P.; Chapman, D.S. Heat Flow, Heat Generation, and the Thermal State of the Lithosphere. Annu. Rev. Earth Planet. Sci. 2013, 41, 385–410. [Google Scholar] [CrossRef]
  14. Jiang, G.; Hu, S.; Shi, Y.; Zhang, C.; Wang, Z.; Hu, D. Terrestrial heat flow of continental China: Updated dataset and tectonic implications. Tectonophysics 2019, 753, 36–48. [Google Scholar]
  15. Gan, H.; Wang, G.; Wang, B.; Wang, X.; Lin, W.; Yue, G.; Tan, X. Abnormally low heat flow in Southeast China resulted from remnant slab subducted beneath the east Asian lithosphere. Terra Nova 2022, 34, 340–348. [Google Scholar] [CrossRef]
  16. Burov, E.B.; Diament, M. The effective elastic thickness (Te) of continental lithosphere: What does it really mean? J. Geophys. Res. 1995, 100, 3905–3927. [Google Scholar]
  17. Qiu, N.; Xu, W.; Zuo, Y.; Chang, J.; Liu, C. Evolution of Meso-Cenozoic thermal structure and thermo-rheological structure of the lithosphere in the Bohai Bay Basin, eastern North China Craton. Earth Sci. Front. 2017, 24, 13–26. (In Chinese) [Google Scholar]
  18. Blundy, J.D.; Holland, T.J.B. Calcic amphibole equilibria and a new amphibole-plagioclase geothermometer. Contrib. Mineral. Petrol. 1990, 104, 208–224. [Google Scholar] [CrossRef]
  19. Holdaway, M. Application of new experimental and garnet Margules data to the garnet-biotite geothermometer. Am. Mineral. 2000, 85, 881–892. [Google Scholar] [CrossRef]
  20. Wu, C.M.; Zhang, J.; Ren, L. Empirical garnet-biotite-plagioclase-quartz (GBPQ) geobarometry in medium-to high-grade metapelites. J. Petrol. 2004, 45, 1907–1921. [Google Scholar] [CrossRef] [Green Version]
  21. Anovitz, L.M.; Essene, E.J. Compatibility of Geobarometers in the System (CFAST): Implications for Garnet Mixing Models. J. Geol. 1987, 95, 633–645. [Google Scholar] [CrossRef]
  22. Takeshita, T. Quartz Microstructures from the Sambagawa Metamorphic Rocks, Southwest Japan: Indicators of Deformation Conditions during Exhumation. Minerals 2021, 11, 1038. [Google Scholar] [CrossRef]
  23. Toy, V.G.; Prior, D.J.; Norris, R. Quartz fabrics in the Alpine Fault mylonites: Influence of pre-existing preferred orientations on fabric development during progressive uplift. J. Struct. Geol. 2008, 30, 602–621. [Google Scholar] [CrossRef]
  24. Stipp, M.; StuÈnitz, H.; Heilbronner, R.; Schmid, S.M. The eastern Tonale fault zone: A ‘natural laboratory’for crystal plastic deformation of quartz over a temperature range from 250 to 700 C. J. Struct. Geol. 2002, 24, 1861–1884. [Google Scholar]
  25. Passchier, C.W.; Trouw, R.A.J. Microtectonics; Springer: Berlin/Heidelberg, Germany, 2005. [Google Scholar]
  26. Stipp, M.; Tullis, J. The recrystallized grain size piezometer for quartz. Geophys. Res. Lett. 2003, 30, 2088. [Google Scholar]
  27. Holyoke, C.W.; Kronenberg, A.K. Accurate differential stress measurement using the molten salt cell and solid salt assemblies in the Griggs apparatus with applications to strength, piezometers and rheology. Tectonophysics 2010, 494, 17–31. [Google Scholar] [CrossRef]
  28. Hacker, B.R. Differential stress, strain rate, and temperatures of mylonitization in the Ruby Mountains, Nevada: Implications for the rate and duration of uplift. J. Geophys. Res. 1990, 95, 8569–8580. [Google Scholar] [CrossRef]
  29. Little, T.A.; Baldwin, S.; Fitzgerald, P.; Monteleone, B.D. Continental rifting and metamorphic core complex formation ahead of the Woodlark spreading ridge, D’Entrecasteaux Islands, Papua New Guinea. Tectonics 2007, 26, TC1002. [Google Scholar] [CrossRef]
  30. Shao, J.A.; Zhang, L.Q.; Mu, B.L. Transformation of the tectonic regime is a lithospheric-scale activity. Geol. Bull. China 2004, 23, 973–979. (In Chinese) [Google Scholar]
  31. Teng, G.; Liu, S.; Wang, M.; Bao, H. Petrogenesis and tectonic implications of the Mesozoic granitoid intrusions in the eastern Liaoning Peninsula, NE China. J. Asian Earth Sci. 2020, 195, 104356. [Google Scholar] [CrossRef]
  32. Wu, F.Y.; Yang, J.H.; Liu, X.M. Geochronological Framework of the Mesozoic Granitic Magmatism in the Liaodong Peninsular, Northeast China. Geol. J. China Univ. 2005, 11, 305–317. (In Chinese) [Google Scholar]
  33. Zulauf, G. Structural style, deformation mechanisms and paleodifferential stress along an exposed crustal section: Constraints on the rheology of quartzofeldspathic rocks at supra- and infrastructural levels (Bohemian Massif). Tectonophysics 2001, 332, 211–237. [Google Scholar] [CrossRef]
  34. Faleiros, F.M.; Campanha, G.A.C.; Bello, R.M.S.; Fuzikawa, K. Quartz recrystallization regimes, c-axis texture transitions and fluid inclusion reequilibration in a prograde greenschist to amphibolite facies mylonite zone (Ribeira Shear Zone, SE Brazil). Tectonophysics 2010, 485, 193–214. [Google Scholar]
  35. Liu, J.; Gan, H.; Jiang, H.; Zhang, J. Rheology of the middle crust under tectonic extension: Insights from the Jinzhou detachment fault zone of the Liaonan metamorphic core complex, eastern North China Craton. J. Asian Earth Sci. 2017, 139, 61–70. [Google Scholar]
  36. Zhang, R.H.; Wu, J.X.; Zhang, W.X. Terrestrial heat flow and thermal structure of the lithosphere in South Liaoning. Earthq. Res. China 1991, 7, 11–24. (In Chinese) [Google Scholar]
  37. Rudnick, R.L.; Fountain, D.M. Nature and composition of the continental crust: A lower crustal perspective. Rev. Geophys. 1995, 33, 267–309. [Google Scholar] [CrossRef] [Green Version]
  38. Artemieva, I.M.; Mooney, W.D. Thermal thickness and evolution of Precambrian lithosphere: A global study. J. Geophys. Res. Solid Earth 2001, 106, 16387–16414. [Google Scholar] [CrossRef] [Green Version]
  39. Byerlee, J. Friction of rocks. Pure Appl. Geophys. 1978, 116, 615–626. [Google Scholar] [CrossRef]
  40. Ranalli, G. Regional variations in lithosphere rheology from heat flow observations. In Terrestrial Heat Flow and the Lithosphere Structure; Cermak, V., Rybach, L., Eds.; Springer: Berlin/Heidelberg, Germany, 1991; pp. 1–22. [Google Scholar]
  41. Luan, F.; Paterson, M.S. Preparation and deformation of synthetic aggregates of quartz. J. Geophys. Res. 1992, 97, 301–320. [Google Scholar]
  42. Wilks, K.R.; Carter, N.L. Rheology of some continental lower crustal rocks. Tectonophysics 1990, 182, 57–77. [Google Scholar] [CrossRef]
  43. Wen, D.; Wang, Y.; Zhang, J.; Li, P.; Jin, Z. Rheology of Felsic Granulite at High Temperature and High Pressure. J. Geophys. Res. Solid Earth 2021, 126, e2020JB020966. [Google Scholar] [CrossRef]
  44. Carter, N.L.; Ave’lallemant, H.G. High Temperature Flow of Dunite and Peridotite. Geol. Soc. Am. Bull. 1970, 81, 2181–2202. [Google Scholar]
  45. Berckhemer, H. High-temperature anelasticity and elasticity of mantle peridotite—Reply. Phys. Earth Planet. Inter. 1979, 23, 48–59. [Google Scholar]
  46. Fu, M.X.; Hu, S.B.; Wang, J.Y. Thermal regime transition in eastern North China and its tectonic implication. Sci. China Ser. D Earth Sci. 2005, 48, 840–848. [Google Scholar] [CrossRef]
  47. Katz, R.F.; Spiegelman, M.; Langmuir, C.H. A new parameterization of hydrous mantle melting. Geochem. Geophys. Geosystems 2003, 4, 1073. [Google Scholar] [CrossRef]
  48. Geng, X.; Foley, S.F.; Liu, Y.; Wang, Z.; Hu, Z.; Zhou, L. Thermal-chemical conditions of the North China Mesozoic lithospheric mantle and implication for the lithospheric thinning of cratons. Earth Planet. Sci. Lett. 2019, 516, 1–11. [Google Scholar]
  49. Guo, P.; Ionov, D.A.; Xu, W.; Wang, C.; Luan, J. Mantle and Recycled Oceanic Crustal Components in Mantle Xenoliths from Northeastern China and their Mantle Sources. J. Geophys. Res. Solid Earth 2020, 125, e2019JB018232. [Google Scholar] [CrossRef]
  50. Xia, Q.K.; Hao, Y.T.; Liu, S.C.; Gu, X.Y.; Feng, M. Water contents of the Cenozoic lithospheric mantle beneath the western part of the NCC: Peridotite xenolith constraints. Gondwana Res. 2013, 23, 108–118. [Google Scholar]
  51. Xu, Z.; Gong, B.; Zhao, Z.F. The water content and hydrogen isotope composition of continental lithospheric mantle and mantle-derived mafic igneous rocks in eastern China. Sci. China Earth Sci. 2016, 59, 910–926. (In Chinese) [Google Scholar] [CrossRef]
  52. Xu, P.; Zhao, D. Upper-mantle velocity structure beneath the North China Craton: Implications for lithospheric thinning. Geophys. J. Int. 2009, 177, 1279–1283. [Google Scholar]
  53. Jia, L.H.; Li, X.L.; Li, J.; Lei, C.; Zhao, Q.; An, X.Y. Research on crustal structure of Liaoning area based on broadband seismic data. North China Earthq. Sci. 2013, 31, 1–7. (In Chinese) [Google Scholar]
  54. Gornov, P.Y.; Goroshko, M.V.; Malyshev, Y.F.; Podgornyi, V.Y. Thermal structure of lithosphere in Central Asian and Pacific belts and their adjacent cratons, from data of geoscience transects. Russ. Geol. Geophys. 2019, 50, 485–499. [Google Scholar] [CrossRef]
  55. Liu, G.D.; Lu, Z.X. Temperature structure of the crust and upper mantle and earthquake in the south of Liaoning. Northeast. Seismol. Res. 1990, 6, 6–13. (In Chinese) [Google Scholar]
  56. Zheng, J.; Xia, B.; Dai, H.; Ma, Q. Lithospheric structure and evolution of the North China Craton: An integrated study of geophysical and xenolith data. Sci. China Earth Sci. 2020, 64, 205–219. [Google Scholar]
  57. Lu, Z.; Li, C.; Zhu, S.; Audet, P. Effective elastic thickness over the Chinese mainland and surroundings estimated from a joint inversion of Bouguer admittance and coherence. Phys. Earth Planet. Inter. 2020, 301, 106456. [Google Scholar]
  58. Pennacchioni, G.; Menegon, L.; Leiss, B.; Nestola, F.; Bromiley, G.D. Development of crystallographic preferred orientation and microstructure during plastic deformation of natural coarse-grained quartz veins. J. Geophys. Res. 2010, 115. [Google Scholar] [CrossRef] [Green Version]
  59. Bose, N.; Dutta, D.; Mukherjee, S. Role of grain-size in phyllonitisation: Insights from mineralogy, microstructures, strain analyses and numerical modeling. J. Struct. Geol. 2018, 112, 39–52. [Google Scholar]
  60. Dong, Y.; Cao, S.; Cheng, X.; Liu, J.; Cao, H. Grain-size reduction of feldspar and flow of deformed granites within the Gaoligong shear zone, southwestern Yunnan, China. Sci. China Earth Sci. 2019, 62, 1379–1398. [Google Scholar] [CrossRef]
  61. Chang, Z.; Dong, G.; Scott, J.M. Early Cretaceous basalts record the modification of the NCC lithospheric mantle: Implications for lithospheric thinning. Int. Geol. Rev. 2021, 64, 1330–1346. [Google Scholar] [CrossRef]
  62. Menzies, M.A.; Xu, Y.; Zhang, H.; Fan, W. Integration of geology, geophysics and geochemistry: A key to understanding the NCC. Lithos 2007, 96, 1–21. [Google Scholar] [CrossRef]
  63. Huang, Z.; Li, H.; Zheng, Y.; Peng, Y. The lithosphere of North China Craton from surface wave tomography. Earth Planet. Sci. Lett. 2009, 288, 164–173. [Google Scholar] [CrossRef]
  64. Zheng, J.; Griffin, W.L.; O’Reilly, S.Y.; Liou, J.G.; Zhang, R.Y.; Lu, F. Late Mesozoic-Eocene Mantle Replacement beneath the Eastern North China Craton: Evidence from the Paleozoic and Cenozoic Peridotite Xenoliths. Int. Geol. Rev. 2005, 47, 457–472. [Google Scholar] [CrossRef]
  65. Yuan, X.C. Velocity structure of the Qinling lithosphere and mushroom cloud model. Sci. China-Earth Sci. 1996, 39, 235–244. [Google Scholar]
  66. Li, C.; Feng, J.; Fan, J.; Dong, D.; Dosso, S.E. Seismic anisotropy evidence for modified lithosphere below the Bohai Sea region, eastern North China Craton. Tectonophysics 2021, 823, 229192. [Google Scholar] [CrossRef]
  67. Wang, Z.; Liu, J.; Xia, Q.; Hao, Y.; Wang, Q. The distribution of water in the early Cretaceous lithospheric mantle of the North China Craton and implications for its destruction. Lithos 2020, 360, 105412. [Google Scholar] [CrossRef]
  68. Hou, G.T.; Qian, X.L.; Cai, D.S. The tectonic evolution of Bohai Basin in Mesozoic and Cenozoic Time. Acta Sci. Nat. Univ. Pekin. 2001, 37, 845–851. (In Chinese) [Google Scholar]
  69. Wang, Y.B.; Hu, S.B.; Nie, D.G.; Zhang, K.S.; Jiang, G.Z.; Wang, Z.T. Is the Tan-Lu fault zone a thermal anomaly belt: Constraints from heat flow in its southern section. Chin. J. Geophys. 2019, 62, 3078–3094. (In Chinese) [Google Scholar]
  70. Lin, W.; Monié, P.; Faure, M.; Schärer, U.; Shi, Y.; Breton, N.L.; Wang, Q. Cooling paths of the NE China crust during the Mesozoic extensional tectonics: Example from the south-Liaodong Peninsular metamorphic core complex. J. Asian Earth Sci. 2011, 42, 1048–1065. [Google Scholar]
  71. Whitney, D.L.; Teyssier, C.; Rey, P.; Buck, W.R. Continental and oceanic core complexes. Geol. Soc. Am. Bull. 2012, 125, 273–298. [Google Scholar] [CrossRef]
  72. Wang, Y.; Wang, F.; Wu, L.; Zhang, Z.; Shi, W.; Yang, L. Differential Post-mineralization Thermal Evolution of the Jiaodong and Liaodong Areas, Eastern China: An Indicator of Regional Tectonic Activity. Gondwana Res. 2021, 103, 502–521. [Google Scholar] [CrossRef]
  73. Niu, Y.L. Generation and evolution of basaltic magmas: Some basic concepts and a new view on the origin of Mesozoic–Cenozoic basaltic volcanism in Eastern China. Geol. J. China Univ. 2005, 11, 9–46. [Google Scholar]
  74. Liu, F.; Wang, A.; Wang, G.; Zhang, W.; Liao, Y.; Tong, J. Characteristics of Terrestrial Heat Flow and Lithospheric Thermal Structure in Typical Intermountain Basin at the Eastern Foot of Yanshan Mountain, North China. Front. Earth Sci. 2021, 9, 758605. [Google Scholar] [CrossRef]
  75. Zhang, Y.W.; Lu, K.Z.; Qi, J.F.; Chen, F.J. Structure frame and genetic mechanism of gas (oil) basin in China. Sci. China (Ser. D) 1996, 26, 493–498. (In Chinese) [Google Scholar]
  76. Wang, L.S.; Li, C.; Shi, Y.S. Distribution of terrestrial heat flow density in Tarim Basin, western China. Chin. J. Geophys. 1995, 38, 855–856. (In Chinese) [Google Scholar]
  77. Pollack, H.N.; Hurter, S.J.; Johnson, J.R. Heat flow from the Earth’s interior: Analysis of the global data set. Rev. Geophys. 1993, 31, 267–280. [Google Scholar] [CrossRef]
  78. Wang, L.S.; Li, C.; Shi, Y.S. Distribution of terrestrial heat flow density in lower Yangtze area. Chin. J. Geophys. 1995, 38, 469–476. (In Chinese) [Google Scholar]
  79. Wang, L.S.; Li, C.; Liu, F.T.; Li, H.; Lu, H.F. Thermo-rheological structure of lithosphere of East and West Basin in China. Sci. China (Ser. D) 2000, 30, 116–121. (In Chinese) [Google Scholar]
  80. Zhu, R.X.; Chen, L.; Wu, F.Y.; Liu, J.L. Timing, scale and mechanism of the destruction of the North China Craton. Sci. China-Earth Sci. 2011, 54, 789–797. [Google Scholar] [CrossRef]
  81. Chang, L.; Wang, C.; Ding, Z. Seismic anisotropy of upper mantle in eastern China. Sci. China Ser. D Earth Sci. 2009, 52, 774–783. [Google Scholar] [CrossRef]
  82. Wang, T.; Zheng, Y.; Zhang, J.; Zeng, L.; Donskaya, T.; Guo, L.; Li, J. Pattern and kinematic polarity of late Mesozoic extension in continental NE Asia: Perspectives from metamorphic core complexes. Tectonics 2011, 30, TC6007. [Google Scholar] [CrossRef] [Green Version]
  83. Dickinson, W.R. The Basin and Range Province as a Composite Extensional Domain. Int. Geol. Rev. 2002, 44, 1–38. [Google Scholar] [CrossRef] [Green Version]
  84. Zhang, Q.; Jin, W.D.; Li, C.D.; Wang, Y.L. Yanshanian large-scale magmatism and lithosphere thinning in Eastern China: Relation to large igneous province. Earth Sci. Front. 2009, 16, 21–51. [Google Scholar]
  85. Zhang, L.; Wang, C.; Cao, K.; Wang, Q.; Tan, J.; Gao, Y. High elevation of Jiaolai Basin during the Late Cretaceous: Implication for the coastal mountains along the East Asian margin. Earth Planet. Sci. Lett. 2016, 456, 112–123. [Google Scholar] [CrossRef]
  86. Jepson, G.; Carrapa, B.; George, S.W.; Triantafyllou, A.; Egan, S.M.; Constenius, K.N.; Gehrels, G.E.; Ducea, M. Resolving mid- to upper-crustal exhumation through apatite petrochronology and thermochronology. Chem. Geol. 2021, 565, 120071. [Google Scholar] [CrossRef]
  87. Erkan, K. Geothermal investigations in western Anatolia using equilibrium temperatures from shallow boreholes. Solid Earth 2015, 6, 103–113. [Google Scholar]
  88. Roche, V.; Sternai, P.; Guillou-Frottier, L.; Menant, A.; Jolivet, L.; Bouchot, V.; Gerya, T.V. Emplacement of metamorphic core complexes and associated geothermal systems controlled by slab dynamics. Earth Planet. Sci. Lett. 2018, 498, 322–333. [Google Scholar] [CrossRef]
Figure 2. Field photos of the tectonic rock sequence in the lower part of the detachment of LNMCC. (a) Fragmentation of the original rock; (b) Feldspar augens develops in mylonites; (c) Quartzofeldspathic and mafic minerals in the laminated bands; (d) The necking of belt of quartzofeldspathic minerals showing top-to-the-WNW shearing; (e) Feldspar aggregates are oriented and arranged in bands; (f) The layered migmatites donates possible differentiation melting of minerals.
Minerals 12 01570 g002
Figure 3. Structural, microstructural characteristics in mylonitic rocks from the lower plate of the detachment zone of LNMCC. All images are in cross-polarized light (XPL). (a) Quartz exhibits crystal elongation surrounding the feldspar porphyroblasts; (b) Elongated quartz with bulging dynamic recrystallization; (c) Progressive recrystallization of quartz with subgrain rotation; (d) Early quartz grain dynamic recrystallization occurs with late fracture; (e) Recrystallized quartz exhibits as irregular grain shapes; (f) Feldspar exhibits crystal elongation and biotite aggregates exhibit belt shape. Abbreviations: Pl—feldspar; Qz—quartz; Bi—Biotite; BLG—bulging dynamic recrystallization; SGR—subgrain rotation recrystallization; GBM—grain boundary migration.
Minerals 12 01570 g003
Figure 4. Quartz recrystallization type of LNMCC. All images are in cross-polarized light (XPL) under optical microscope. (a) Recrystallized bulges along grain boundaries; (b) Increased subgrain proportion compared with (a,c) Dominant subgrain rotation recrystallization; (d) Progressive subgrain rotation with increased subgrain size; (e) Grain boundary migration with irregular grain shapes; (f) Progressive grain boundary migration with triple junction. Abbreviations: BLG—bulging dynamic recrystallization; SGR—subgrain rotation recrystallization; GBM—grain boundary migration.
Minerals 12 01570 g004
Figure 5. Lithosphere geotherms for the LNMCC. The dark blue solid line, orange and yellow dotted lines represent the geotherms by the calculation results of 49.4 mW/m2, 70 mW/m2, and 80 mW/m2, respectively. The blue and green solid lines represent the geotherms of Cretaceous LNMCC under 30 °C/km and 35 °C/km, respectively. The two black solid lines donate the adiabatic lines of the thermal lithosphere calculated by equations E3 and E4. The melting conditions are presented by green dashed lines (after [47]) showing the dry, intermediate and hydrous conditions.
Minerals 12 01570 g005
Figure 6. The lithospheric rheological structures of the LNMCC. Red and orange solid lines represent the Cretaceous rheological structures under 30 °C/km and 35 °C/km, respectively. Abbreviations: P30—Cretaceous rheological structure under 30 °C/km; P35—Cretaceous rheological structure under 35 °C/km.
Minerals 12 01570 g006
Figure 8. Lithospheric rheology characteristics of typical basins in eastern and western China (Modified after [79]); (a) Subei Basin; (b) Tarim Basin; (c) Cretaceous LNMCC (30 °C/km); (d) Present LNMCC. The yellow zones represent the depth interval of 10-20 km. The red dots in Figure 8c represents the paleo-differential stresses calculated in Table S1.
Minerals 12 01570 g008
Figure 9. Evolution model of LNMCC based on thermo-rheological structure (modified after [5,13]). (a) Conceptual model of LNMCC in the Cretaceous period. Short black arrows indicate middle and lower crustal flow, and the long black arrows indicate flow in the asthenosphere; (b) Conceptual model of the present LNMCC. The long black arrows indicate flow in the asthenosphere. Abbreviations: M—Moho; L/A—Boundary of the lithosphere and the asthenosphere.
Minerals 12 01570 g009
Table 1. Parameters used in the thermal structure model. (Data from [36,37]).
Heat Flow (mW/m2)Layers (km)Radiogenic Heat Productions (μW/m3)Thermal Conductivity (W/m·K)
49.4Upper crust01.252.5
1–31.25 × 10−z/D2.5
4–180.82.5
Middle crust (19–28)0.82.7
Lower crust (29–36)0.332.5
Lithosphere mantle (>36)0.033.4
Table 2. Parameters of ductile rheological structure for LNMCC lithosphere.
LayerLithologyRheologyE, kJ/molnA, MPa−n/sReference
Upper crustgranodiorite, felsic gneissDry quartzite15241.198 × 10−8[41]
Middle and Lower crustsmigmatites, granuliteFelsic granulite (dry)2433.18.000 × 10−3[42]
Felsic granulite2604.21.000 × 10−4.4[43]
Lithosphere mantlelherzoliteLherzolite (wet)3312.38.040 × 102[44]
Lherzolite (dry)52344.500 × 101[45]
Publisher’s Note: MDPI stays neutral with regard to jurisdictional claims in published maps and institutional affiliations.

